
Abstract
Positron emission tomography (PET) functional imaging is based on changes in regional cerebral blood flow (rCBF). Functional magnetic resonance imaging (fMRI) is based on a variety of physiological parameters as well as rCBF. This study is aimed at the cross validation of three-dimensional (3D) fMRI, which is sensitive to changes in blood oxygenation, with oxygen-15-labeled water (H215O) PET. Nine normal subjects repeatedly performed a simple finger opposition task during fMRI scans and during PET scans. Within-subject statistical analysis revealed significant (“activated”) signal changes (p < 0.05, Bonferroni corrected for number of voxels) in contralateral primary sensorimotor cortex (PSM) in all subjects with fMRI and with PET. With both methods, 78% of all activated voxels were located in the PSM. Overlap of activated regions occurred in all subjects (mean 43%, SD 26%). The size of the activated regions in PSM with both methods was highly correlated (rho = 0.87, p < 0.01). The mean distance between centers of mass of the activated regions in the PSM for fMRI versus PET was 6.7 mm (SD 3.0 mm). Average magnitude of signal change in activated voxels in this region, expressed as z-values adapted to timeseries, zt, was similar (fMRI 5.5, PET 5.3). Results indicate that positive blood oxygen level-dependent (BOLD) signal changes obtained with 3D principles of echo shifting with a train of observations (PRESTO) fMRI are correlated with rCBF, and that sensitivity of fMRI can equal that of H215O PET.
Keywords
Functional magnetic resonance imaging (fMRI) techniques that are sensitive to blood oxygen level-dependent (BOLD) (Ogawa et al., 1990) signal changes have become a popular approach to brain mapping. BOLD fMRI methods can be performed on widely available clinical scanners, do not require exogenous agents (tracers, contrast), and are particularly useful for studies involving multiple experimental within-subject conditions. The first reports of imaging based on BOLD effects in humans appeared in 1992 (Ogawa et al., 1992; Bandettini et al., 1992; Kwong et al., 1992). Since then, fMRI techniques have been applied to an ever increasing number of activation paradigms. However, important questions pertaining to sensitivity, reproducibility, nature of artifacts, contribution of nonselective physiological processes, and nature of physiological processes underlying BOLD effects remain.
Sensitivity relates to the ability to detect evoked signal changes. Stimulation-induced changes in signal intensity are typically on the order of 1–5% with a 1.5 T scanner, close to scan-to-scan instability. As a result, BOLD fMRI has a low sensitivity for regional changes in brain activity. Sensitivity can be improved by repetition of stimulation and by averaging across scans. There is a practical limit, however, to the number of repetitions, as time constraints and changes in physiological responses caused by fatigue or habituation become factors. The sensitivity of a scan method affects the magnitude of stimulation-induced signal change relative to background noise. The likelihood that the results of any particular study are reproducible (i.e., reliability) is determined, in part, by the choice of a significance threshold. Use of an appropriate threshold, which is typically high for large numbers of voxels, is important for assessment of the reliability of the results.
The cause of fMRI signal change is not necessarily related to local neuronal activity. Nonspecific signal changes may be generated by artifacts caused by head motion (Hajnal et al., 1994), inflow (Duyn et al., 1994b; Kim et al., 1994), nonselective physiological processes (e.g., veins draining from a site of neuronal activity) (Lai et al., 1993), or, simply, by random noise (false positive results related to significance thresholds). The topographical agreement between site of detected signal change and site of neuronal activity is affected by these factors.
In the present study, some of these issues are considered by directly comparing functional activation data from an fMRI study to those from a positron emission tomography (PET) study of regional cerebral blood flow (rCBF), acquired from the same subjects. A simple experimental design with a finger opposition task was used to investigate reliability of functional maps obtained with both methods and to assess spatial correspondence of activated regions. Comparison with PET was chosen to attempt cross-validation of fMRI with an accepted functional imaging method. The experimental design involved repeated scanning of individual subjects, to enable within-subject statistical evaluation. For activation, a simple finger opposition task, which causes an increase in neuronal firing rates in well-defined regions along the contralateral central sulcus (Penfield and Boldrey, 1937; Roland et al., 1980; Colebatch et al., 1991; Fox et al., 1985) was used. To compare both methods directly, the same statistical analysis method (utilizing z-maps adapted for data time series) was applied to both data sets. The applied omnibus significance level of 0.05 corresponds to an expectation of false positive results in one of 20 subjects.
Until recently, the amount of brain tissue that could be imaged with one fMRI scan was limited. Most techniques acquire two-dimensional images from sections of brain tissue and are, therefore, of restricted value for brain mapping studies when the location of brain activity is unknown. A three-dimensional (3D) fMRI scan method, which has been shown to identify activation of the primary sensory and motor cortex in human subjects (Van Gelderen et al., 1995), is now available. This method, principles of echo shifting with a train of observations (PRESTO), is basically a combination of echo shifting (Moonen et al., 1992; Duyn et al., 1994a) and multiple gradient echoes per radio frequency (RF) excitation (Liu et al., 1993). PRESTO has several theoretical and practical advantages over other gradient echo techniques. A relatively large volume (55 mm slab) is scanned in a short (6 s) period, in contrast to slower 3D FLASH methods (Duyn et al., 1994a). Short scan times limit artifacts caused by motion during scans and allow for large numbers of repetitions. 3D scans are less susceptible to inflow effects (Duyn et al., 1994a), which are nonspecific, than are single or multislice methods. Because the volumes are spatially intact (i.e., unwarped), they can be easily registered directly to one another and superimposed directly on structural images. Scanning is done using a clinical scanner and standard hardware (including gradient coils and head coil).
Oxygen-15-labeled water (H215O) PET is used to measure rCBF (Raichle et al., 1976). Since several bolus injections (six-to-eight injections with conventional scanners) may be administered to one subject, it is possible to compare images obtained during different experimental conditions. Here, H215O PET was used for single-subject studies, with multiple repetitions of one experimental condition alternating with one control condition. Single-subject study designs have the advantage that functional and anatomical variations across individuals do not contribute to variance in the results, as holds true for group designs.
METHODS
Subjects
Four female and five male volunteers (mean age 28.2 years, education 18.1 years) participated after giving informed consent. The research protocol was approved by the National Institute of Mental Health (NIMH) Human Studies Review Board and the Radiation Safety Committee. All subjects were strongly right-handed according to the Edinburgh Handedness Inventory (mean score 0.95). By means of a detailed questionnaire, subjects were screened for major medical, neurological, and psychiatric illnesses and use of medication. Positive responses to any of the questions prevented participation in the study. Subjects were requested to abstain from the use of nicotine and caffeine for 4 h prior to the scan sessions and over-the-counter medications for 24 h prior. Subjects were paid for their participation, which involved two PET sessions (with an average interval of 12 days) and one fMRI session (average 36 days after the last PET session).
Scans
MRI
Scans were obtained with a clinical 1.5 Tesla (T) scanner (SIGNA, General Electric, Milwaukee, WI, U.S.A.) equipped with a standard quadrature head coil and standard shielded gradients with a maximal gradient strength of 10 mTm−1 and maximum slew rate of 17 Tm−1s−1. To limit head motion, a special holding device, in which the head was strapped in a hammock that allowed for some motion, but made the head “gravitate” back to the original position, was used. Longitudinal body motion (“drifting” into the scanner) was compensated for by supporting the top part of the bed on rollers. The rollers allowed the bed to be moved by the subject (e.g., pushed away from the scanner) independent of the headholder, thus preventing translation of body movement into head motion in that direction. Structural and functional images were acquired in transverse orientation, from the same section of the brain. For high anatomical detail, inversion recovery (IR) images, which matched the functional images in location and orientation [time to inversion/repetition time (TI/TR) 800/3000 ms, slice thickness 2.75 mm, 1 mm gap, 24 slices spanning 90 mm, FOV 240 mm, 256 by 128, 7 min scan time], were obtained. The IR scan was executed immediately after the last functional scan. At the conclusion of the session, for the purpose of off-line registration of all functional images, a whole-brain volume was acquired with a spoiled GRASS sequence: sagittal, echo time (TE) TR 5.1/20 ms, field of view 300 mm, 124 contiguous slices 1.2 mm thick, 256 by 256.
For functional scans, the 3D-PRESTO sequence described previously (Van Gelderen et al., 1995) was used with the following parameters: TE 35 ms (range 29.6–40.4 ms), TR 24 ms, flip angle 11°, slab thickness 65 mm, with 90 mm field of view, data matrix 64 by 50 by 24, scan time 6.0 s). Nominal resolution was 3.75 by 3.75 by 3.75 mm. Full width at half maximum (FWHM) was ∼4.5 mm in each direction after reconstruction. Volumes are presented as the middle 14 contiguous slices, each 3.75 mm thick. The 11° flip angle produced images with virtually no contrast between grey matter, white matter, and cerebrospinal fluid (CSF) (Fig. 1). Fat and bone are hypointense.
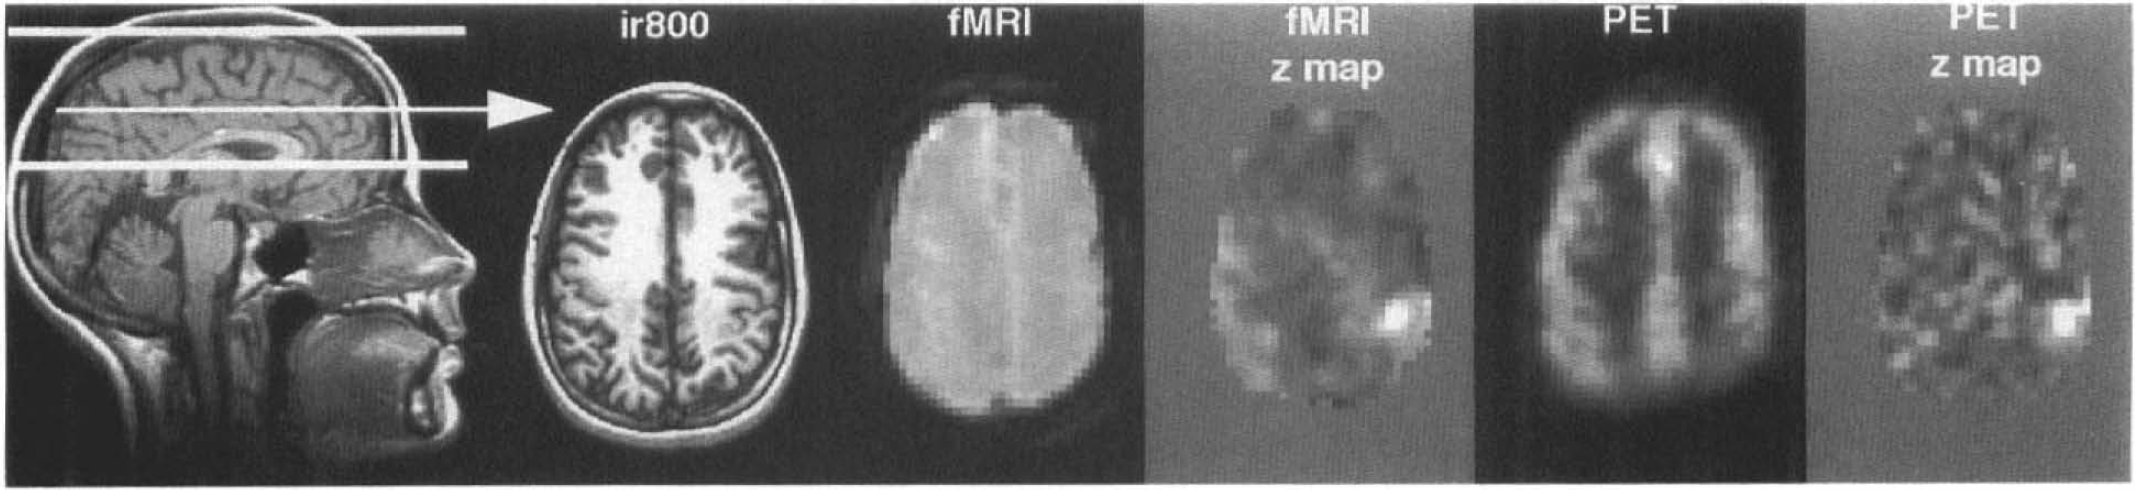
Images of one slice obtained with MRI, fMRI, and PET. Thick white lines on the sagittal slice indicate orientation and extent of the analyzed fMRI and PET volumes. Arrow indicates the position of the transverse slice shown on right. The five transverse images are from the same slice (slice 6 from subject 2, Fig. 2). From left to right are shown in radiological orientation: high resolution anatomical image (IR800), smoothed fMRI, fMRI zt-map, smoothed PET, and PET zt-map images. Smoothed images are averaged over control scans. Only tissue imaged with both PET and fMRI is shown. Greyscale for the zt-maps ranges from black for zt ≤ −5 to white for z, ≥ 5. For details of analysis, see methods.
PET
PET scans were performed on a Scanditronix PC-2048/15B brain tomograph (Scanditronix Corp., Upsalla, Sweden), which produces 15 contiguous slices with an in-plane resolution of 6.0–7.5 mm and an axial resolution of 5–6.5 mm after reconstruction. Voxel size was 2 by 2 mm in-plane and 6.5 mm axial. Slices were obtained parallel to the canthomeatal line, with the lowest slice collected 16–26 mm above this landmark, individually adjusted to include the top of the brain. Transmission scans were obtained in the same planes as were PET scans using a rotating 68Ga/68Ge pin source, and were used to correct the emission scans for radiation count attenuation by tissue and skull. For each emission scan, an intravenous bolus of ∼37.5 mCi of H215O was administered. Following arrival of tracer in the brain, the time course of regional cerebral radioactivity concentration was determined simultaneously for the 15 slices by collecting a total of 16 scans (12 × 10 s, 4 times; 30 s). Emission scan data were reconstructed with corrections for attenuation, scatter, random coincidences, and deadtime. Beginning 20 s prior to injection and continuing throughout the 4-min scan, arterial blood samples were drawn, using an automated blood sampler at a rate of 3.8 ml/min, and used to determine the time course of arterial blood 15O activity. Blood activity was measured using paired sodium iodide detectors and corrected for random coincidences and dispersion (Daube-Witherspoon et al., 1992). Voxel by voxel calculations of absolute rCBF were based on a least-squares model (Koeppe et al., 1985), and were used for subsequent analyses. For two of the nine subjects, arterial blood samples were not available; in those cases, cumulative count data over the 60-s period following arrival of the bolus were used.
Procedures
MRI
Before entering the scanner, each subject was informed about the procedure, and each briefly practiced the finger opposition task. This task was used during the experiment, and entailed touching the thumb once with each one of the digits, repeating the sequence for 30 s at a rate of two finger taps per s. Subjects' eyes were closed during functional scans. PRESTO scans were acquired continuously during alternating 30-s periods of rest (“control”) and finger opposition (“task”). Five scans were acquired during every period. The first scan of each group of five was discarded after the experiment to avoid a confound related to the delay in vascular responses to neuronal activation (Kwong et al., 1992; Bandettini et al., 1992). An investigator stood by the subject to record the rate of finger oppositions and to indicate the end of each 30-s period by touching the subject's leg. The experiment always began with a control period, i.e., with both hands relaxed. Within one session, subjects performed the task 16 times, alternated with 16 control periods. Thus, 160 scans, of which 128 were used for analyses, were acquired per subject. After spatial alignment (registration) of individual volumes (see data analysis), the four volumes acquired in each period were averaged into one volume, yielding a total of 32 volumes per subject.
PET
Each subject underwent two PET scanning sessions, each of which consisted of two motor task and two rest conditions (a total of eight scans). The following procedure was used during both PET sessions. A radial arterial catheter was placed in the left wrist for arterial blood sampling and a catheter was placed in the right antecubital vein for tracer administration. Head motion in the scanner was limited by a custom-fitted thermoplastic mask. Before the first scan, the experiment was explained, the opposition task briefly practiced, and one dummy control scan executed. Scans lasted 4 min and were separated by 12 min, i.e., six times the halflife of 15O. Task and control conditions were alternated across scans. The condition of the first scan—task or control—was alternated across subjects. Subjects' eyes were closed during all scans. Subjects were told to relax during control scans. Finger opposition (2 Hz) commenced 15 s before bolus injection and continued throughout the scan (4 min 15 s total).
Data analysis
After reconstruction, all of the volumes were registered to each other for each individual subject (see below). A meaningful comparison of extent and magnitude of regional activation across scan modalities requires equal spatial smoothness of the images. For this reason as well as for statistical purposes, PET and the fMRI volumes were modified to match the data sets for voxel size and for smoothness. These are critical parameters in the z-map analysis. Before registration, PET volumes were resampled to obtain the voxel size of fMRI (i.e., 3.75 mm3 c). After registration, fMRI and PET scans were smoothed to match degree of smoothness. To that end, fMRI volumes were convoluted with a 3D Gaussian filter with a FWHM of 7.5 mm, whereas for PET volumes, 3D Gaussian filter was used with a FWHM of 5.8 mm. The resulting (calculated) FWHM was 8.7 mm in all three directions for both methods, and the voxel size remained 3.75 mm isotropic. Images of one slice are shown in Fig. 1. Finally, data sets were statistically analyzed separately, and the significant voxels superimposed on the IR images. Details of each step of image registration are described in more detail below.
fMRI
For each subject, fMRI volumes were registered to one another, as described (Van Gelderen et al., 1995), using a program that uses a least squares difference (LSD) criterion (Unser et al., 1993). The sharp brain-tissue contour (Fig. 1) made it possible to use a cine-loop of a sagittal view of the volumes to inspect for motion. Some misalignment was observed in all subjects, usually on the order of one voxel (at the brain perimeter). After registration, no misalignment could be detected, by cine, in any of the subjects.
PET
PET volumes were registered to one another for each subject using a registration program that employs a ratio variance algorithm (Woods et al., 1992). Volumes appeared to be aligned with visual inspection. Direct registration of PET to fMRI volumes was not possible due to differences in shapes of volumes and in contrast (see Fig. 1). Therefore, the anatomical volume was used as an intermediate step. This volume was stripped of extracerebral tissue, i.e., signals from bone, skin, and fat were removed and then registered to PET by means of a surface matching algorithm (Jiang et al., 1992). Next, the resulting anatomical volume was registered to fMRI with the LSD program (Unser et al., 1993). Registration parameters obtained from this step were applied to PET volumes.
Statistical procedure
For each individual subject, the two data sets, i.e., PET and fMRI volumes, were analyzed separately using the same statistical evaluation method, as described previously (Van Gelderen et al., 1995; Ramsey et al., 1994). This method utilizes standardized normal variates, based on repeated measurements (time series) within a single subject, and is here referred to as “zt-map analysis.” It is important to note that, in all analyses, the voxel size was universal for fMRI and PET (3.75 mm isotropic). Only the part of the brain that was imaged with both techniques, the superior part (Fig. 1, left), was analyzed. This included almost all tissue within the fMRI volumes. For zt-map analysis, first each scan was individually normalized to its global mean, i.e., ratio to the mean of all voxels within the brain. Difference volumes were derived from each pair of volumes (fMRI, 16 pairs; PET four pairs). A pair consisted of one control volume and the contiguous task volume. Second, for each voxel, mean, variance, and standard deviation were computed from the set of difference volumes. After masking out nonbrain tissue, the mean variance was computed from brain tissue voxels. Using a criterion based on a χ2 statistic, voxels with significantly different variances were identified (p < 0.01). This subgroup of voxels (at most 0.7% of the total volume) was analyzed in the same way as were the rest, but with a recalculated mean standard deviation. For the third step, mean (pooled) standard deviation (PSD) was used to compute zt-values for all voxels:

where n = number of difference volumes. An example of slice zt-maps is shown in Fig. 1. A critical zt-value was determined for each subject and scan data set (fMRI or PET) separately, using a simple Bonferroni correction for the number of comparisons, i.e., the number of voxels in the analyzed volume. Thus, to obtain an overall (omnibus) significance level of p < 0.05 (one-sided, positive signal changes only), the required p-value for individual voxel comparisons was assumed equivalent to the omnibus p-value divided by the number of brain-tissue voxels (∼11,000). Finally, a bitmap was generated for voxels with a significant positive signal change and superimposed onto the IR images. This bitmap was then used to count significant voxels and to isolate those voxels for calculation of zt-values and relative signal change magnitude.
Negative signal changes were also examined. To that end, the critical z-value was applied (with negative sign) to the z-maps. Signal changes beyond this threshold were observed by both methods, but were small in number (mean number of voxels: fMRI, 5.9; PET, 4.6). These did not occur in a consistent pattern, either anatomically or across methods. Since interpretation of negative signal changes in fMRI is not yet an established matter, these voxels are not discussed further.
Comparing data sets
A 3D volume of interest (VOI) capturing the primary sensory motor cortex (PSM) region in the left hemisphere was defined for each subject on the basis of IR images. This was done liberally in order to include all voxels in the precentral gyrus, central sulcus, and postcentral gyrus. For the present study, PSM was defined as the group of voxels within this VOI. To evaluate topographical agreement, significant voxels in the PSM were counted and compared (Table 1), and the extent of overlap in that region determined (Table 2). A zt-value-weighted center of mass (COM) was calculated only from significant voxels in the contralateral PSM, for each method. The location of each COM is given in Talairach coordinates (Talairach and Tournoux, 1988) without correction for brain size (Table 3). Correction for size, i.e., linear normalization of length, width, and height, did not affect the results. The anterior commissure (AC)-posterior commissure (PC) line was placed on the anatomical images for each subject. Location of the COM is given in mm anterior to the ventral AC line, “x”; lateral to the sagittal interhemispheric plane, “y”; and superior to the AC-PC plane, “z”. The difference in locations of fMRI and PET COMs was expressed in mm along these axes and as the absolute distance between them. In addition, the proximity (in mm) of each COM to the middle knee, i.e., the anteriorly concave section as described in Ono et al. (1990) and Van Gelderen et al. (1995) of the central sulcus, was measured for both methods in each subject.
Number of significant voxels in the whole scanned volume (total), in the contralateral PSM and bilateral in the SMA, for each imaging method
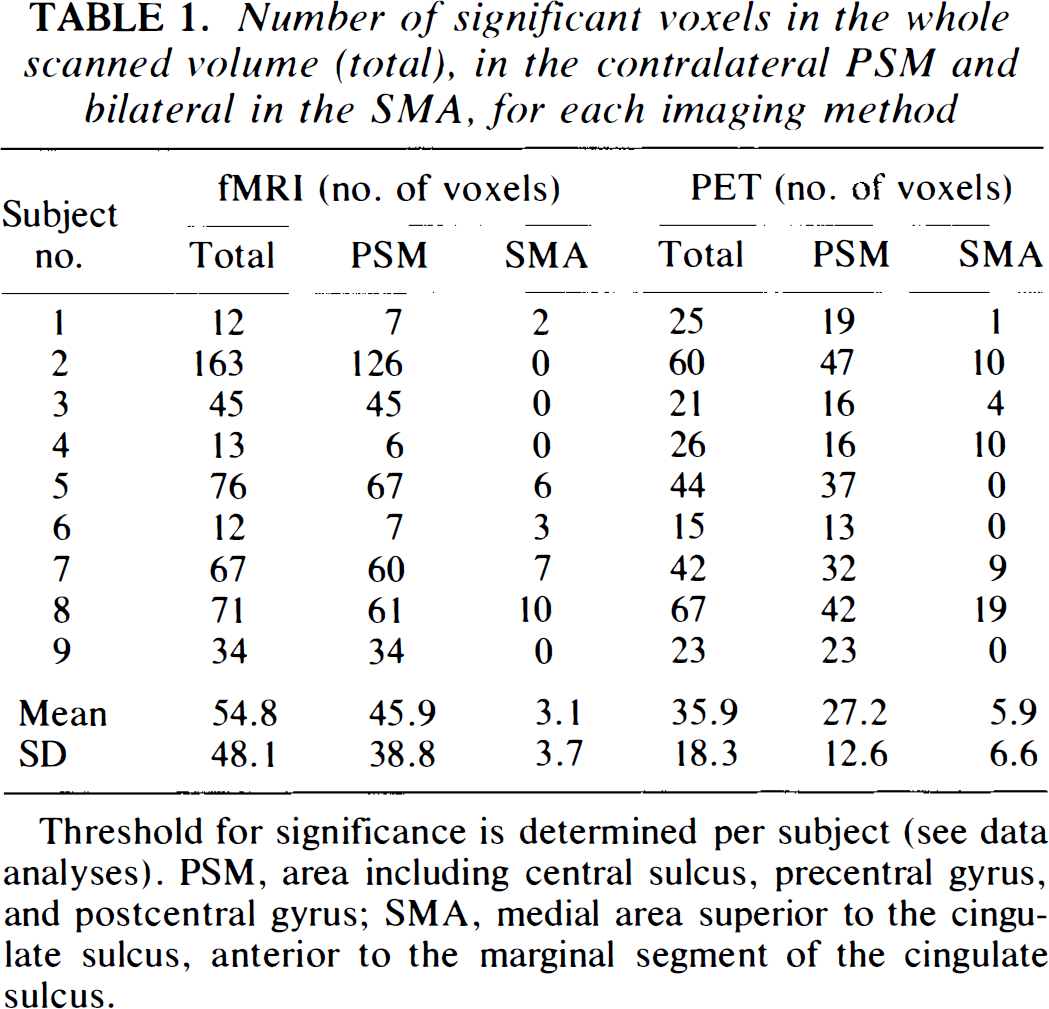
Threshold for significance is determined per subject (see data analyses). PSM, area including central sulcus, precentral gyrus, and postcentral gyrus; SMA, medial area superior to the cingulate sulcus, anterior to the marginal segment of the cingulate sulcus.
Extent of overlap of significant voxels in PSM and distance of the centers of mass (COM) of significant PSM voxels to each other (fMRI versus PET) or to the central sulcus
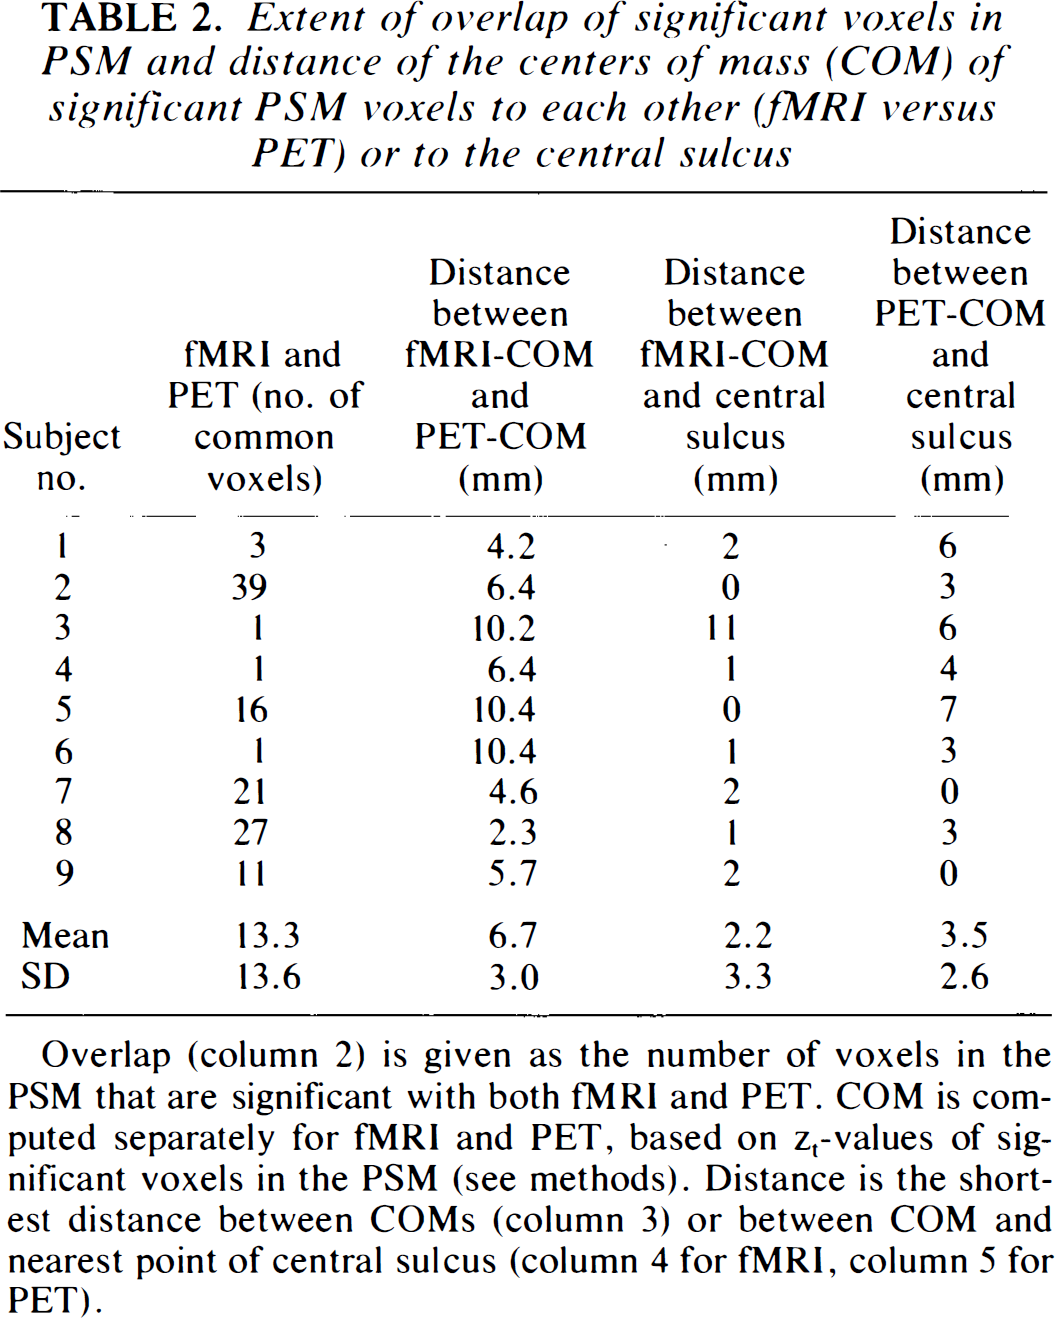
Overlap (column 2) is given as the number of voxels in the PSM that are significant with both fMRI and PET. COM is computed separately for fMRI and PET, based on zt-values of significant voxels in the PSM (see methods). Distance is the shortest distance between COMs (column 3) or between COM and nearest point of central sulcus (column 4 for fMRI, column 5 for PET).
Coordinates of the center of mass (COM) of significant voxels in the PSM, for each subject, for fMRI and PET, relative to the bicommissural AC-PC system of Talairach and Tournoux (1988)
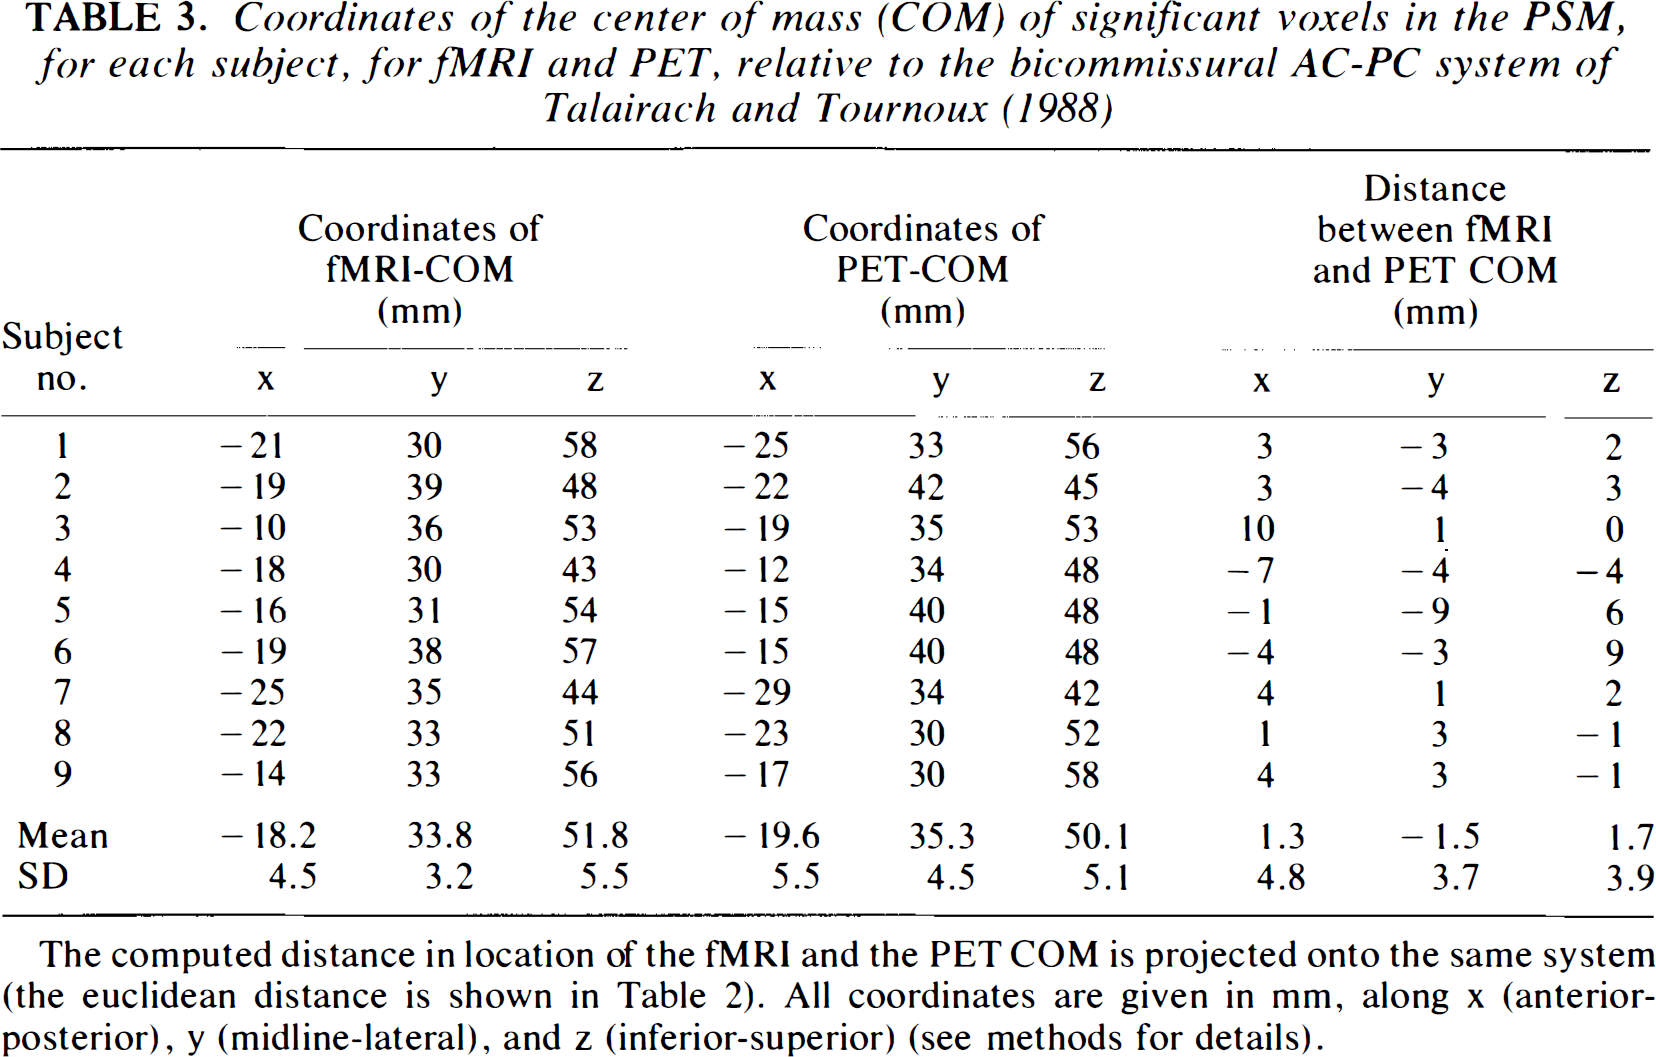
The computed distance in location of the fMRI and the PET COM is projected onto the same system (the euclidean distance is shown in Table 2). All coordinates are given in mm, along × (anterior-posterior), y (midline-lateral), and z (inferior-superior) (see methods for details).
Significant voxels in the scanned volume were counted and used to calculate the relative proportion of PSM voxels, to indicate regional specificity of brain activity (Table 2). The magnitude of signal change in the PSM was expressed for both scan methods as mean zt-values, i.e., averaged over significant voxels in the PSM only.
To evaluate whether interindividual characteristics contributed in a consistent fashion to the result, the correlation between numbers of significant voxels in the VOI in both data sets across subjects was calculated.
Note that the statistical zt-map analysis is identical to that used previously (Van Gelderen et al., 1995; Ramsey et al., 1994). However, to avoid confusion with other applications of z-maps, the subscript “t”, denoting adaptation for time series, was added.
RESULTS
The total number of voxels in which signal change was significant (Table 1) was small relative to the whole volume (fMRI, 0.5%; PET, 0.3%). The difference between fMRI and PET in the total number of significant voxels was not significant (Wilcoxon signed rank test, p > 0.05). Significant signal changes were found in the contralateral PSM of all subjects in both fMRI and PET zt-maps (Table 1, Figs. 2 and 3). The average number of significant voxels, a measure of the size of the activated region, in the PSM was greater with fMRI than with PET (46 versus 27 voxels); the difference was not significant (Wilcoxon signed rank test, p > 0.05). When these numbers were expressed as a proportion of the total number of significant voxels in the whole volume, the numbers were almost identical (fMRI, 78.2 versus PET, 78.0%). The significant voxels outside of the PSM were located in the supplementary motor area (SMA) (fMRI, five subjects; PET, six subjects), ipsilateral frontal cortex (fMRI, three subjects; PET, two subjects), contralateral frontal cortex (fMRI, one subject; PET, three subjects), ipsilateral parietal cortex (fMRI, one subject), contralateral striatum/pallidum (PET, two subjects), and ipsilateral striatum/pallidum (PET, one subject). These voxels were either solitary or formed small clusters (<10 adjacent voxels) (Fig. 2).
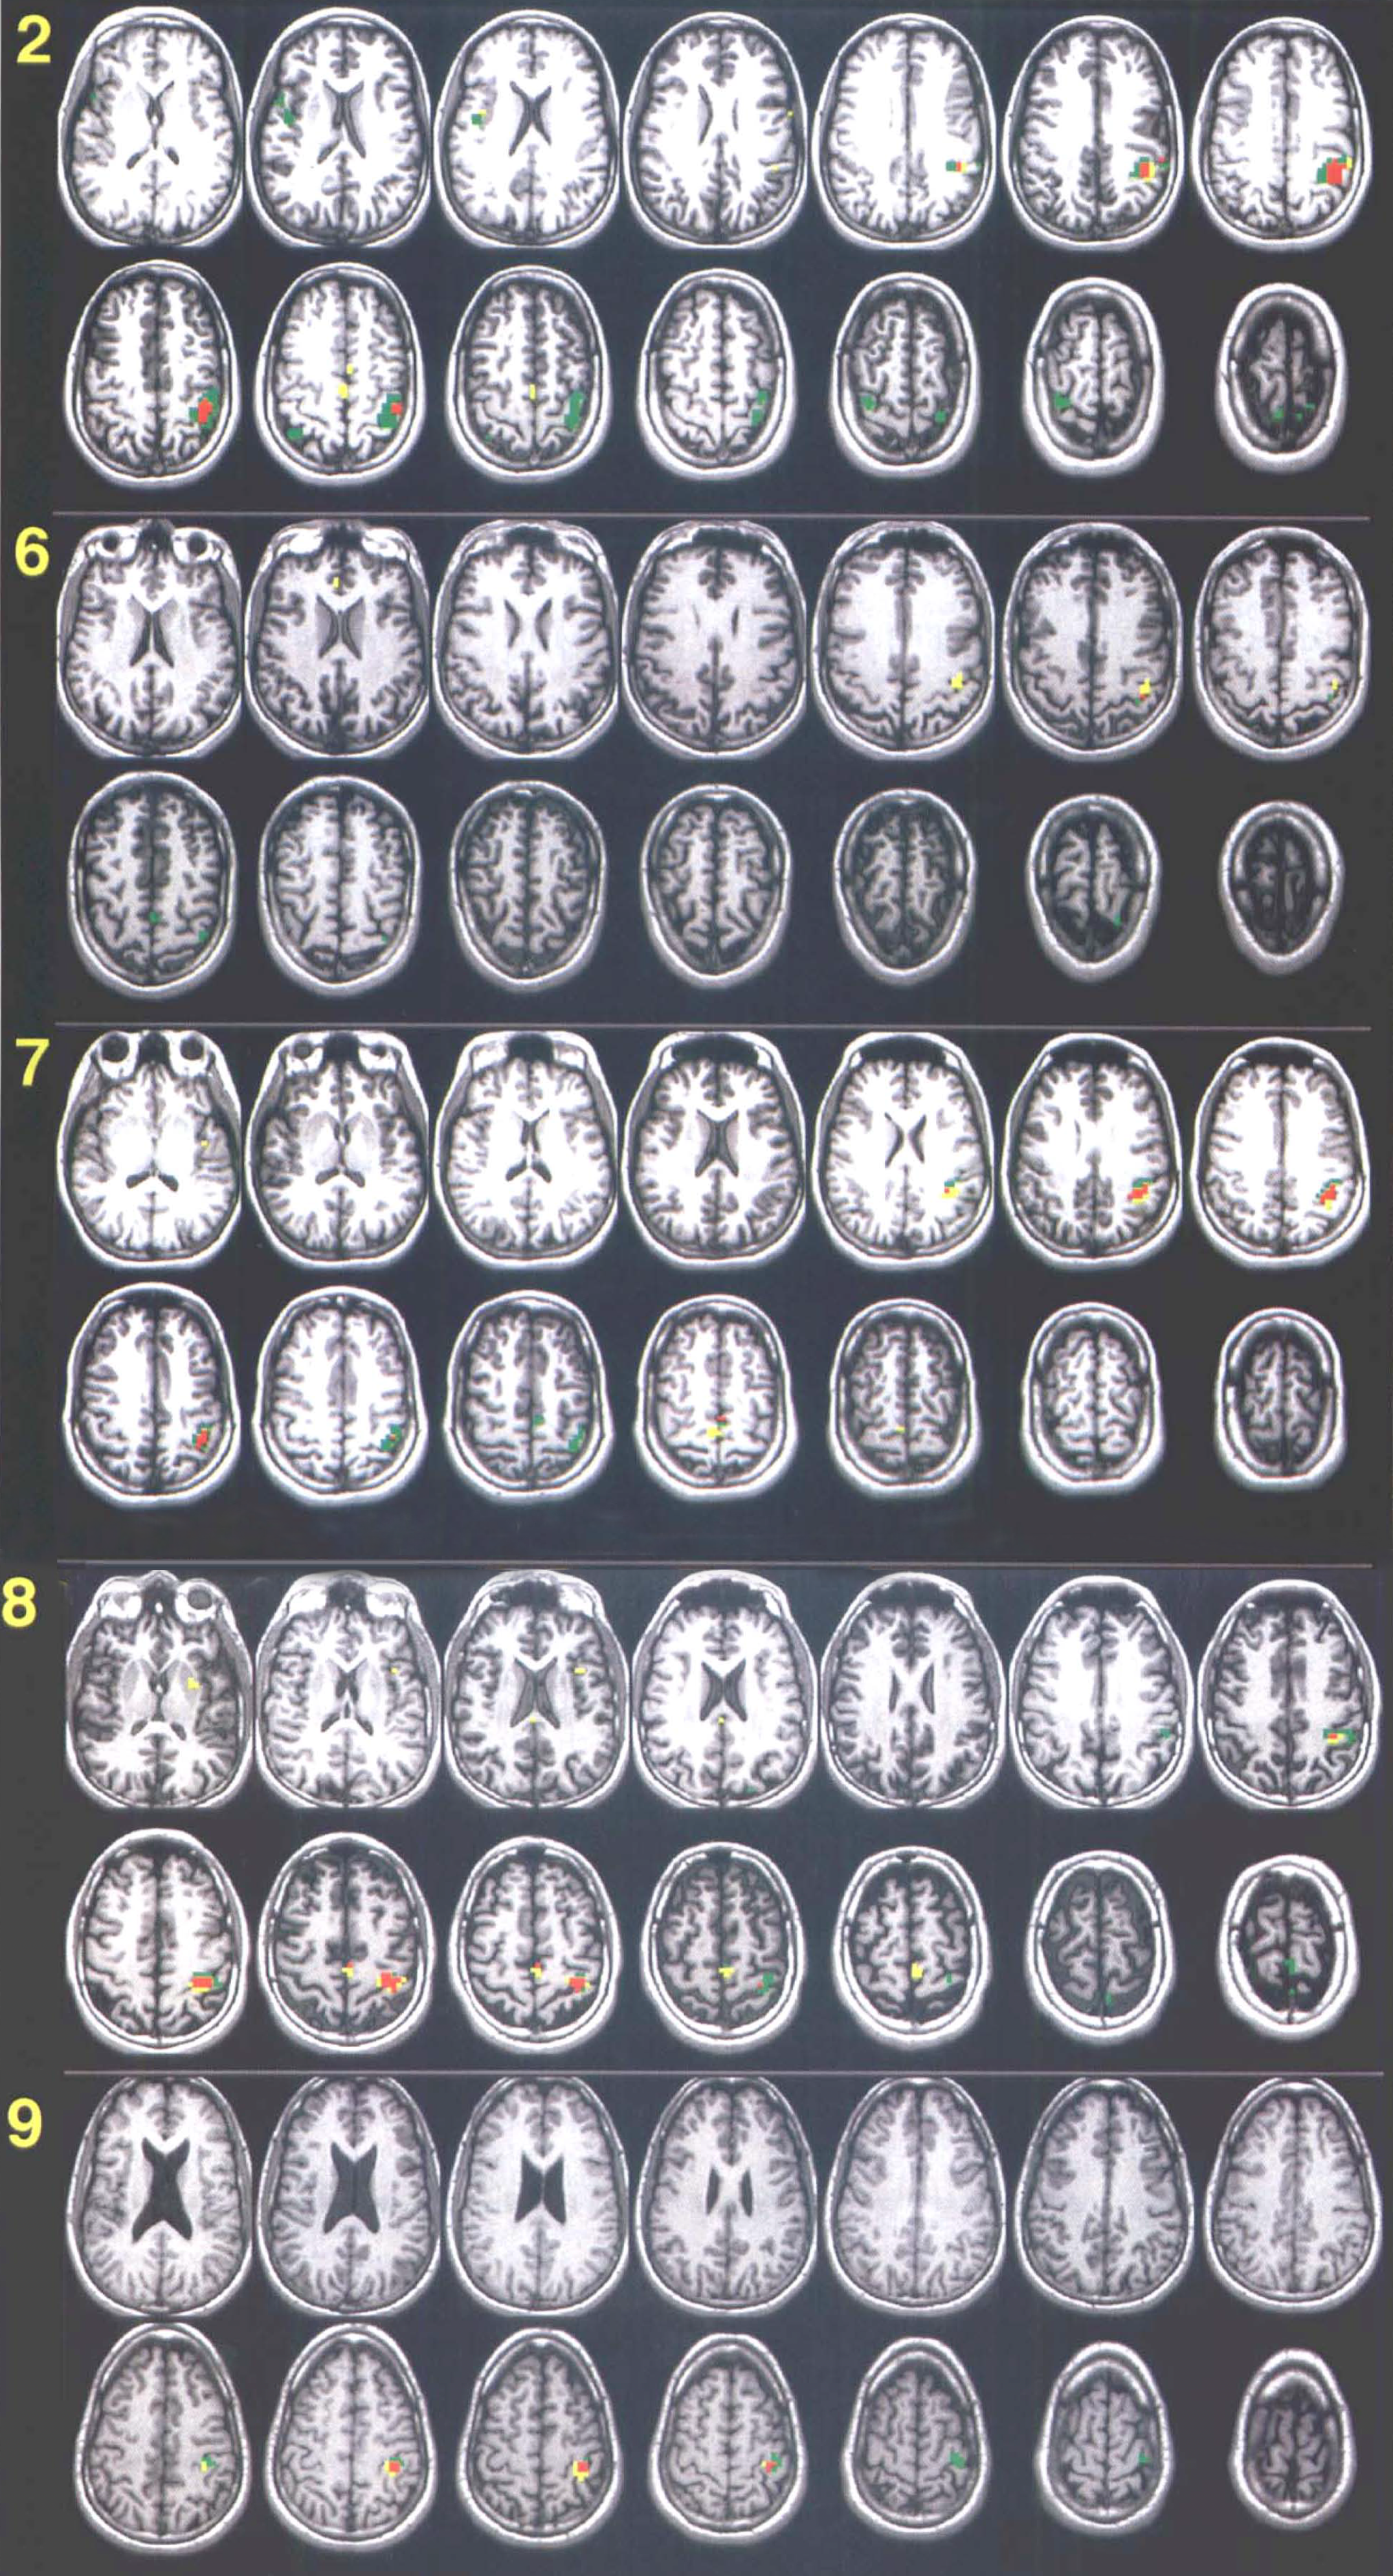
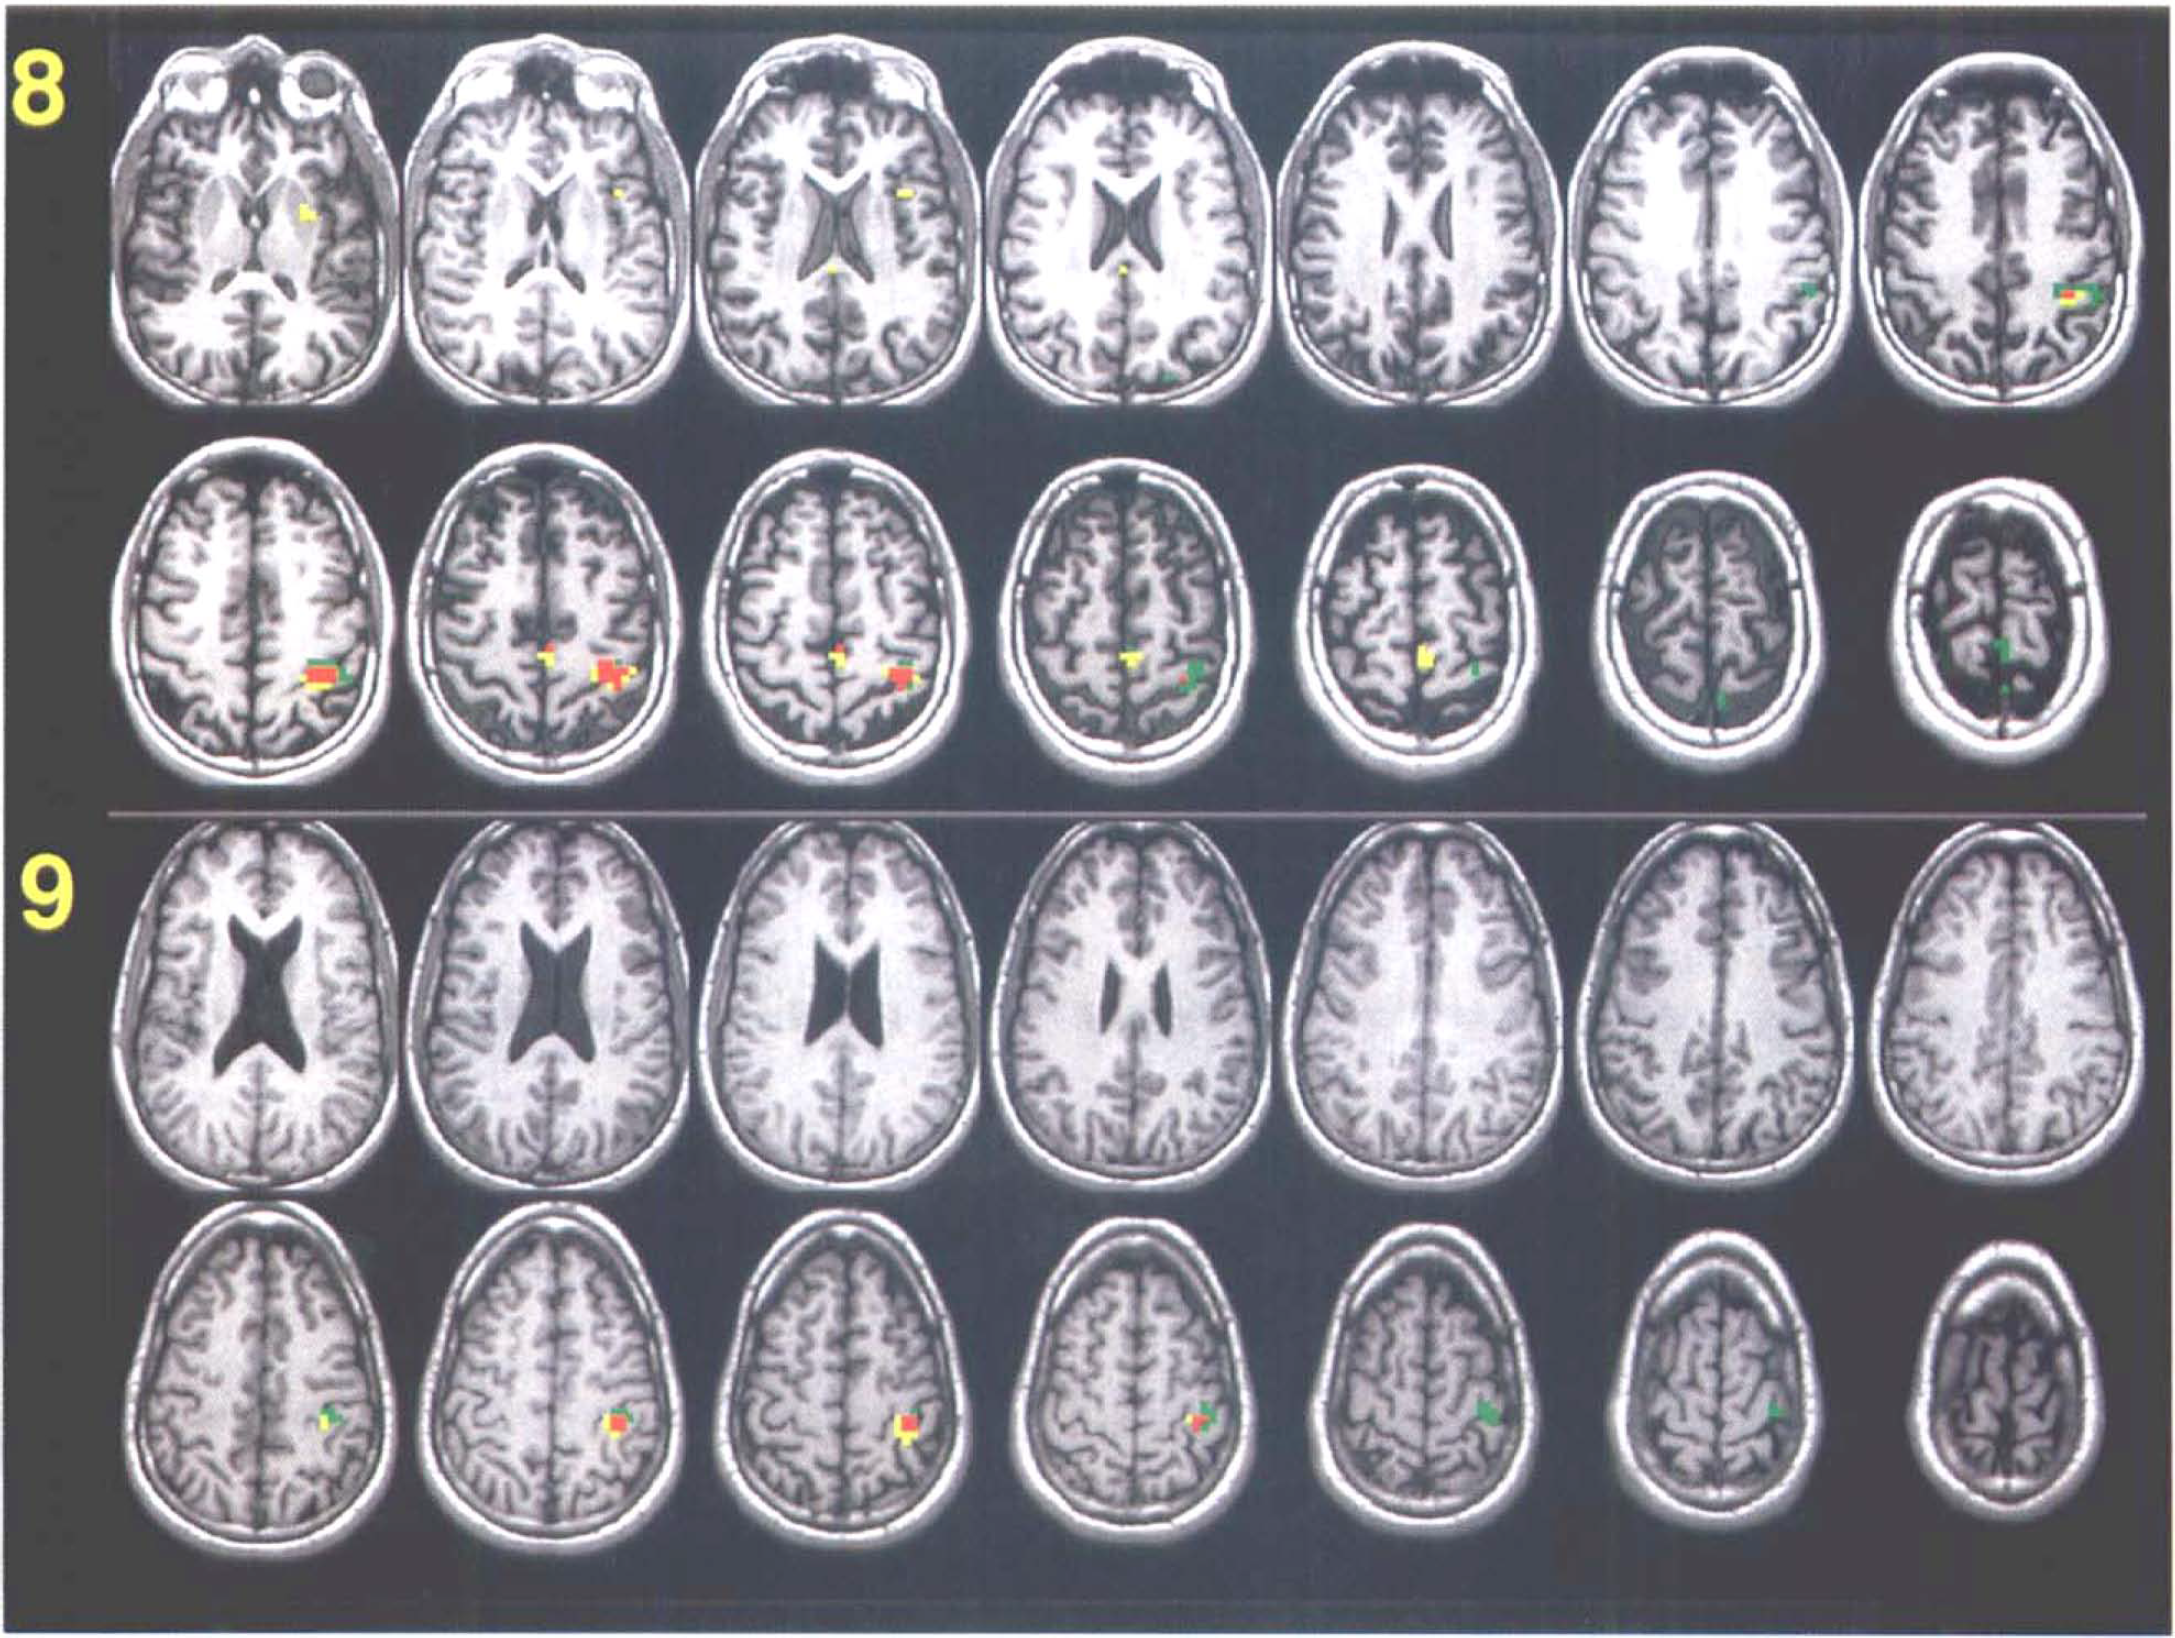
See legend page 762.
Both the total number of significant voxels in the brain (Total in Table 1) and contralateral PSM were highly correlated between methods (Spearman rho = 0.78, p = 0.014 and rho = 0.87, p = 0.003, respectively). Overlap of significant voxels (Fig. 2) from both methods was found in all subjects. For an indication of the extent of overlap, the percentage of overlapping voxels was calculated relative to the maximum possible overlap, i.e., the number of voxels of the smallest cluster of the two zt-maps. The average overlap calculated accordingly was 43% (SD 26%).
Mean locations of COMs across subjects were virtually identical for fMRI and PET (Table 3). Variability of coordinates was approximately the same for all three directions (x, y, and z, Table 3). For both fMRI and PET, COMs were located close to the central sulcus (mean distance: fMRI, 2.2 mm; PET, 3.5 mm; Table 2). Locations of the COMs varied mainly along the walls of the central sulcus, both across and within subjects. The average distance between fMRI and PET COMs (Table 2) was 6.7 mm. There was no consistency in the direction of the difference (Table 3). In one subject (no. 3 in Tables 1,2, and 3), regions of activation were located near the precental sulcus. Additional fMRI studies yielded the same result, also for the right hemisphere with left hand finger movements, suggesting that this may be an individual characteristic.
The mean zt-value of significant voxels in the PSM, averaged over nine subjects, was approximately the same for both fMRI (5.5, SD 0.8, range 4.7–7.0) and PET (5.3, SD 0.4, range 4.8–5.8). In these voxels, the mean signal change, as percent of control signal intensity, was quite different: fMRI, 0.99% (SD 0.09%, range 0.8–1.1%); PET, 30.4% (SD 6.5%, range 21.22.6%).
DISCUSSION
We have compared directly, within the same individuals, cerebral activation during finger movements, measured with H215O PET and with BOLD-sensitive 3D fMRI. Both PET and fMRI produced anatomically selective changes in the PSM region, contralateral to the hand used for the finger opposition task. The zt-map analysis indicates that this result was very consistent within subjects, since zt-values are highly dependent on the reproducibility of signal change with repetition.
Within subjects, spatial locations of activation sites from both methods were close, measured in terms of the proportion of overlapping voxels with signal change (43%) and in terms of the absolute distance between COMs (6.7 mm). The difference in location of these COMs was not biased in any consistent direction. Across subjects, both activated clusters were located close to the middle knee of the central sulcus, where neurons mediating movement of fingers are thought to be located (Ono et al., 1990; Rumeauet al., 1994). This strongly suggests that both methods yield somatotopically correct results. These findings also strongly suggest that BOLD signal changes, at least as acquired with the 3D PRESTO technique, agree highly with local changes in perfusion.
In PET images, the signal is generated by radiolabeled water, which, after injection, diffuses freely and rapidly into the tissue surrounding blood vessels. The distribution of tracer in the brain is a function of local blood flow, and signal changes are strongly linked to loci of changes in blood supply. In fMRI, BOLD signal changes can be generated by venous blood that flows out of a region of neuronal activity. The degree of deoxygenation in such draining veins is, thus, affected by upstream neuronal activity. This causes some displacement of the locus of signal change, from the true site of neuronal activity towards the draining veins. The present study did not address these issues directly, but the findings suggest that the contribution of large draining veins is limited. Differences were seen between foci of the COM of signal changes in the PSM region, although they were small (i.e., less than the FWHM), but there was no consistency in the direction of this spatial difference (Table 3). A more superior location of the fMRI COM could be expected, relative to that in the PET data, if BOLD effects were dominated by large draining veins, which travel from the center outward (to the superior sagittal sinus), downstream from the activated region in the central sulcus. However, signs of draining veins were present in some fMRI cases, in which the cluster of activated voxels in the PSM appeared to extend towards the surface of the brain, where major veins are located and where significant voxels implicated the sagittal sinus (e.g., as in subject no. 8).
Compared to other reports on BOLD effects, the fMRI signal changes we observed were rather small. This is the result of the combination of smoothing data (>2× the original voxel size) and the relatively small size of the activated region. Smoothing was required to match both methods for spatial resolution. In fMRI studies, the FWHM is typically only slightly larger than the voxel size. In the case of PRESTO images, the FWHM is 4.5 mm (Van Gelderen et al., 1995), meaning that resolution images higher than the ones presented here can be obtained under the same conditions. Typically, signal changes in unblurred PRESTO images are on the order of 1.5–3% (Van Gelderen et al., 1995), which is comparable to that of echo planer imaging (EPI) at 1.5 T (Kwong et al., 1992). The difference in signal change expressed as percentage of baseline (PET, 33.1% versus fMRI, 1.0%) is not a reflection of differences in sensitivity of the methods, as is shown with the zt-map analysis. For experimental designs utilizing single-subject statistics, sensitivity is particularly affected by the scan-to-scan stability (expressed here as PSD).
The ability of each method to detect activation-dependent signal change, i.e., sensitivity, at a statistically relevant threshold, was comparable. The high threshold, being associated with an omnibus p-value of 0.05, indicates that the significant results were very reliable. The zt-map approach benefits from a large number of repetitions. The finding that results were comparable with different numbers of repetitions (fMRI, 16 versus PET, four) supports the notion that activation-induced signal changes are smaller (relative to the scan-to-scan instability) in fMRI. One could argue that PET is, thus, more sensitive, but the present findings show that the larger number of scans able to be acquired with fMRI compensates adequately for this disadvantage. In fact, the total motor activation time was less in the fMRI session (8 min) than in the PET sessions (16 min). However, the effective activation duration was comparable if one takes into account that most of the counts in PET were collected during the first 2 min of a scan. Experimental designs were different due to inherent limitations. As PET scans lasted 4 min, some degree of fatigue and/or habituation may have occurred. To avoid this in fMRI, although the significance of these factors for brain activity is not clear, the task duration was kept short.
Various groups have studied activation of the supplementary motor area during motor tasks ranging from simple (Colebatch et al., 1991; Matelli et al., 1993; Rao et al. 1993) to complicated (Deiber et al., 1991; Roland et al., 1980; Grafton et al., 1993), to imagined (Roland et al., 1980) using PET and related imaging methods. Our results are similar to those of these earlier studies in some respects, but not others. Involvement of the SMA in very simple or low-frequency finger movements is not robust (Roland et al., 1980). The SMA is thought to be particularly active during planning of composite movements (Roland et al., 1980; Deiber et al., 1991). The present PET results are consistent with this notion in that activation of the SMA (six of nine subjects) was not as reliable as that obtained for the PSM (all subjects). In studies in which significant rCBF changes in the SMA were found with similar finger movement tasks, these changes were on the order of 10–15% (Fox et al., 1985; Colebatch et al., 1991). The apparent discrepancy between those reports and the present one may well be due to different criteria used for significance as well as different degrees of image smoothness. Also, earlier PET studies employed intersubject averaging, whereas the present study involved within-subject analyses. Depending on the individual scan-to-scan instability i.e., PSD, significance with PET required a rCBF change on the order of 21–34% in the present study (numbers are derived from individual PSDs, critical zt-values, and number of repetitions). Our fMRI results (SMA activation in five of nine subjects) were similar to the present PET results.
The implications of the findings for other fMRI pulse sequences are rather complicated. Assuming that most of the presented fMRI signal change is BOLD related, one would expect other pulse sequences with similar BOLD sensitivity to yield comparable results. However, differences could be expected for two reasons. The first is the sensitivity to BOLD effects, as compared to inflow effects. This is especially important when comparing techniques that differ in the way data are acquired spatially, i.e., as consecutive single slice, multislice, or true 3D volumes. The second is sensitivity to motion. Of importance here is the degree of signal stability in the presence of head motion that is small, parenchymal motion related to cardiac and respiratory cycles, and flow motion of blood and cerebrospinal fluid (CSF). The statistical approach is, in essence, comparable to most statistical methods used to analyze functional images in that the key parameters are magnitude of signal change and image (voxel) variance over time. Perhaps one of the most important differences between the most commonly used z, t, and cross-correlation maps is the way in which the threshold for significance is determined. Given the degree of agreement between the fMRI and the PET results observed with the stringent thresholding procedure, other commonly used analysis methods should yield comparable results with similar thresholds.
It is important to note that since PET and, particularly, fMRI techniques are continuously being improved, any direct comparison is probably not an accurate reflection of the current state of the art. Moreover, the many different variables that account for signals generated by the two methods makes a comparison of results problematic. Our intention in this study was not to evaluate the relative merits of each method, but, rather, to use PET as an empirical validation of BOLD fMRI activation mapping. To this end, we found that the activation maps acquired by each of the two methods are remarkably similar. The data also suggest that BOLD fMRI activation during finger movements, at least as measured with 3D PRESTO, is closely related to changes in cerebral perfusion.
Footnotes
Acknowledgment:
The authors thank Kathleen Tallent, Joy Austin, and Roy Sexton for their skilled technical assistance, and Bob Rawlings for statistical advice.