
Abstract
To evaluate the effect of the repetition rate of a simple movement on the magnitude of neuronal recruitment in the primary sensorimotor cortex, we used a blood flow-sensitive, echo planar functional magnetic resonance imaging (fMRI) sequence in six normal volunteers. Three of the volunteers also had [15O]water positron emission tomography (PET) studies using the same paradigm. Previous PET studies had shown an increase in regional CBF (rCBF) with movement frequencies up to 2 Hz and then a plateau of regional cerebral blood flow (rCBF) at faster frequencies. To evaluate the extent of the activation, the correlation coefficient (cc) of the Fourier-transformed time-signal intensity change with the Fourier-transformed reference function was calculated pixel by pixel. The degree of activation was measured as the signal percent change of each region of interest with a cc > 0.5. The left primary sensorimotor cortex was constantly activated at 1, 1.5, 2, and 4 Hz, while there was only inconsistent activation at 0.25 and 0.5 Hz. Percent change in signal intensity linearly increased from 1 to 4 Hz. Area of activation increased up to 2 Hz and showed a tendency to decrease at higher frequencies. Individual analysis of PET data showed activation in the same location as that revealed by fMRI. The combination of progressively increasing signal intensity with an area that increases to 2 Hz and declines at faster frequencies explains the PET finding of plateau of rCBF at the faster frequencies. Functional magnetic resonance imaging shows similar results to PET, but is better able to dissociate area and magnitude of change.
Keywords
Studies of correlation of physiological parameters such as repetition rate of a stimulus to indexes of neuronal activity like regional CBF (rCBF) or glucose consumption rate have been carried out in the primary sensory cortical areas in humans (Fox and Raichle, 1984; Wise et al., 1991) with positron emission tomography (PET). Using PET with group analysis, we found that the rCBF increased in the primary sensorimotor cortex (SM1) with the repetition rate of movement, with saturation of δCBF at rates faster than 2 Hz (Sadato et al., 1996). As a partial volume effect due to limited resolution of PET precludes dissociation of volume from magnitude (Fox et al., 1985), we have pursued the same issue with functional magnetic resonance imaging (fMRI), which has better spatial resolution and allows individual analysis. We evaluated the effect of repetition rate of a simple movement on the magnitude as well as area of recruitment in the SM1.
METHODS
We studied six normal, right-handed volunteers (five men and one woman), aged 24–40 years. The protocol was approved by the institutional review board, and all subjects gave written informed consent. Opponent finger movement of the right index finger was performed with visual pacing at different frequencies of 0.25, 0.5, 1, 1.5, 2, and 4 Hz (except for one condition of one subject who performed the 1.5-Hz movement with auditory cuing because the visual pacemaker broke during the experiment). The order of conditions was pseudorandomized among subjects. Subjects were taught to perform a brisk and precise touch of the tip of the thumb with the index finger at each stimulus, immediately followed by a return to the resting position. Repetition rate of the finger movement was monitored by an electrically equipped glove. Each task consisted of three rest and three finger movement periods; each period was 30 s long, alternating rest and movement (Fig. 1). An on-off cycle of 60 s (30-s rest and 30-s movement) was chosen to maximize the induced signal amplitude and to obtain a stable plateau of signal enhancement induced by the movement (Bandettini et al., 1993b). In each set of data acquisition series, the frequency of the movement was kept constant. To cover the left primary motor cortex, a 5-in surface coil was placed over the left frontoparietal region, and four consecutive sagittal slices covering 30–50 mm left lateral to the midsagittal plane were obtained. Two sagittal images with 5-mm thickness and 5-mm interval were simultaneously obtained in one sequence. The first scan consisted of two slices covering 30–35 and 40–45 mm, with a 5-mm gap between them (35–40 mm). The second scan consisted of two slices covering 35–40 and 45–50 mm, so as to “fill in” the gap. A time course series of 60 images/slice were acquired using T2*-weighted, gradient echo, echo planar imaging sequences with a small z-axis head gradient coil on a 1.5 T GE Signa magnet. The time interval between two successive acquisitions of the same image was 3,000 ms and echo time was 40 ms. A 16-cm field of view was used. The digital in-plane resolution was 64 × 64 pixels with a pixel dimension of 2.5 × 2.5 mm. The magnetic shim in the region of the SM1 was optimized such that a true in-plane resolution of 2.5 × 2.5 mm could be realized. Head motion was minimized by placing comfortable but tight foam padding around the subject's head.
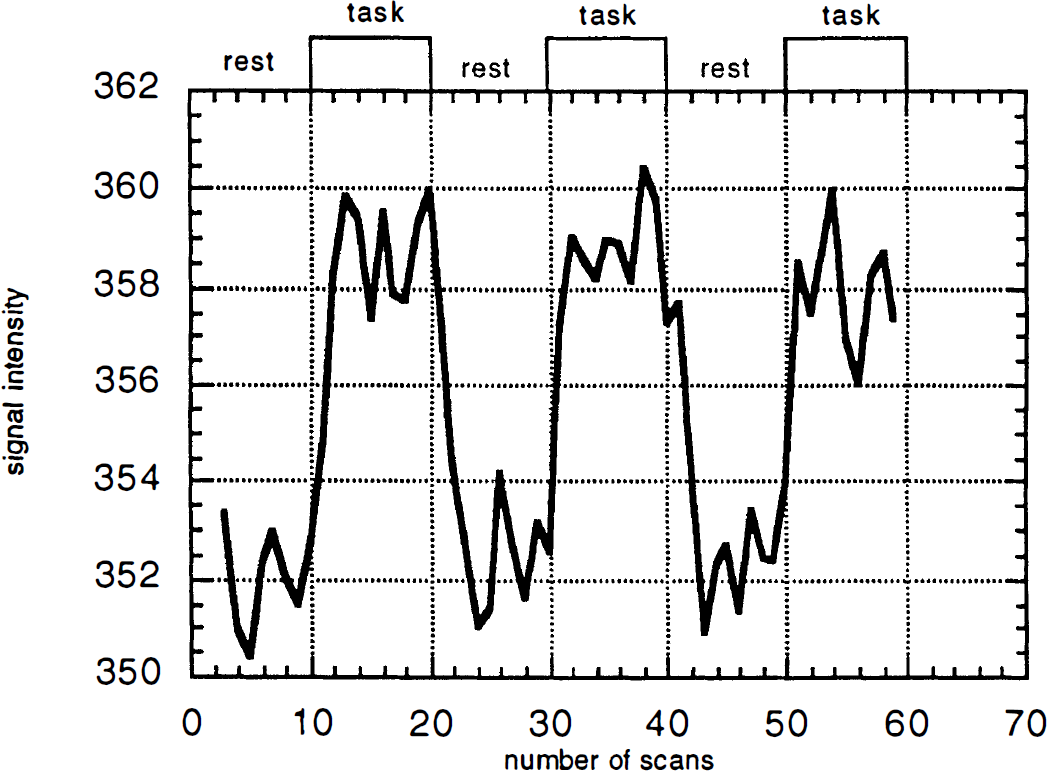
Typical signal intensity change in the left SM1. The x-axis represents the number of scans with 3-s interval; the y-axis shows signal intensity in arbitrary units. During the task phase, the subject performed externally cued opponent index finger movements with fixed frequency. Duration of rest and task conditions is 30 s. Note that it took the first four time points of each phase (∼9 s) for signal intensity to reach steady state.
High-resolution MR images were obtained for anatomical reference to identify the central sulcus. A three-dimensional, T1-weighted spoiled GRASS sequence (repetition time/echo time/flip angle = 33 ms/5 ms/30°) was used to obtain 124 sagittal images. Field of view was 24 cm, matrix size was 256 × 256, and slice thickness was 1.5 mm. The central sulcus was first identified using contiguous sagittal images of high-resolution MRI with the method of Steinmetz et al. (1990). The central sulcus was in turn visually identified on the echo planar imaging referring to the high-resolution MRI of the identical slice.
Functional MRI data were analyzed by calculating correlation coefficients (cc) between the Fourier transform of the time course data and the Fourier transform of a reference waveform. First, after confirming the absence of significant out-of-plane movement by visual inspection, all the images of each slice were two-dimensionally realigned with an automated algorithm (Minoshima et al., 1992). Because the magnetization was not in the steady state for the first three images of each time series set, these were excluded from all analyses. The reference function consisted of a piecewise exponential function with delay constant of 5 s considering the delayed response of blood flow change compared with neuronal activity (Kwong et al., 1992), which was repeated for three cycles following the activation paradigm (Fig. 1). The square of the spectral density plot of this reference function was correlated with the square of the spectral density plot of each pixel (Bandettini et al., 1993a) to generate a cc map with following formula:
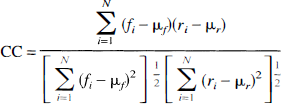
where fi (i = 1, …,N) is the square of the spectral density plot of each pixel, ri (i = 1, …, N) is the square of spectral density plot of reference function, and μf and μr, are the average values of fi and ri over i = 1-N, respectively. In this calculation, DC components were eliminated.
To define the activated foci in the primary sensorimotor area that were adjacent to the central sulcus, cc values above 0.5 were used as threshold. To eliminate pixels with a negative change of intensity associated with the movement task, the threshold of the phase delay was set to <9 s. The significance of activation of these regions of interest (ROI) was evaluated by time series analysis with an autoregressive integrated moving average model (Leonardo et al., 1995). Significance level was set to p < 0.05 with Bonferroni correction over 195 ROI. As all the ROI on the slice in the center of activated foci delineated by correlational analysis procedure showed significant change, further analyses were focused on that particular slice. In the activated regions, the percent change of signal intensity (%δSI) was calculated between the mean signal intensity of pixels within the ROI of the images of movement conditions and that of the rest conditions:
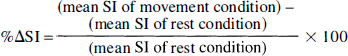
To avoid the transitional period due to the delayed response of signal intensity change (Kwong et al., 1992) (Fig. 1), the first three time points of each phase were omitted in the calculation of the mean signal intensity. Percent signal intensity change was plotted against the movement frequency. The area of the activated focus was evaluated by the number of activated pixels near the central sulcus.
To investigate the relationship between frequency and the %δSI, a generalized regression model was employed. Let Yijk denote the %δSI for subject i, frequency j, and period k, where the period refers to the first, second, or third epoch of the off-on paradigm of length of 60 s (20 time points) within the run of 60 time points. The theoretical mean %δSI, μij, is modeled by

for subject i and frequency fj. This allows for a different slope ([beta]i) and constant term (ai) for each subject for the linear relationship between frequency and %δSI.
Now we must use the real data to estimate μij. Denote by mij the estimated value of μij in EQUATION 1 for subject i at frequency fj, and Yijo denotes the mean of the Yijk over k = 1–3. In the analysis of variance formulation, the residual or error sum of squares (SSE) can be decomposed into two sums of squares, a pure error component (SSPE) and a lack of fit contribution (SSLF), as follows:
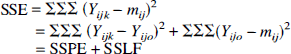
where the sums are on i = 1–6, j = 1–4, and k = 1–3. SSPE measures random variation plus nonrandom variation caused by unknown factors other than the frequency difference. Assuming that nonrandom variations caused by factors other than frequency of the movement, such as fatigue, habituation, or learning, are small, SSPE measures random variation. Then lack of fit is tested in this situation with the following statistic:

which has an F distribution with 12 and 48 degrees of freedom in this case (see Draper and Smith, 1981, for method of calculation). For foci where the linear model is shown to be feasible, the lack of fit and pure error sums of squares were pooled and the significance of linear regression was examined with the F test with 1 and 60 df. In this latter test, p values were adjusted with the Bonferroni correction for the number of ROI defined by the correlation analysis in all subjects. Significance was determined at adjusted p < 0.05.
Three of the six subjects also had a PET examination. The experimental condition was described in detail elsewhere (Sadato et al., 1996). Positron emission tomography scanning was performed with a Scanditronix PC 2048-15B (Uppsala, Sweden), which collected 15 contiguous planes with an in-plane resolution of 6.5 mm full width at half-maximum after reconstruction, and with a center-to-center distance of 6.5 mm, covering 97.5 mm in the axial direction. Matrix size and pixel size of the reconstructed images were 128 × 128 and 2 mm, respectively. Reconstructed images were obtained by summing the activity during the 60-s period following the first detection of an increase in cerebral radioactivity after the intravenous bolus injection of 30 mCi of [15O]water. No arterial blood sampling was performed. Each subject underwent 10 consecutive scans at 10-min intervals. The complete session consisted of two rest scans and eight conditions of opponent movement of the right index finger at different repetition rates. The first and last sessions were resting conditions, and the second to ninth sessions were movement conditions. For the rest scans, the subject lay quietly, and no auditory stimuli were given. For the movement scans, the instructions were to perform auditory-paced opponent movement of the right index finger paced with a metronome. The movement duration was ∼80 s. The frequencies of the movements were categorized into four conditions: slowest (0.25 and 0.5 Hz), slow (0.75 and 1 Hz), fast (2 and 2.5 Hz), and fastest (3 and 4 Hz).
The PET data were analyzed on an individual basis to compare with the fMRI results [the group analysis has already been published (Sadato et al., 1996)]. In the preceding study using PET, we found a steep change in increment of rCBF between 1 and 2 Hz. Hence we tried to obtain finer sampling in fMRI. The PET images were normalized with global mean of tissue activity (Worsley et al., 1992). Positron emission tomography data and high-resolution MRI were coregistered with a three-dimensional automated registration program (Woods et al., 1992, 1993). Mean images of PET were made for each condition. The rest image was subtracted from each movement condition. The subtraction image of each condition was low-pass filtered (5 × 5 × 3 pixels), then thresholded with the standard deviation derived from the pooled variance over the entire brain. Subtraction images thresholded with 3 SD were superimposed on the high-resolution MRI to identify the cluster adjacent to the central sulcus. %δCBF of each movement condition from the rest condition was calculated, based on ROI defined by the comparison between fastest and rest condition with threshold of 3 SD. Volumes of the activated clusters and %δCBF were plotted against the movement conditions.
The subjects' performances of finger movements were recorded using an electrically equipped glove. All subjects performed the tasks with all required frequencies.
RESULTS
The left SM1 was activated at 1, 1.5, 2, and 4 Hz in all subjects (Table 1; Fig. 2). Three of six subjects showed activation at 0.5 Hz, while significant but subtle activation was appreciated at 0.25 Hz in only one subject (Table 1). Three of six subjects showed their largest activated area at 2 Hz. The three others showed the largest activated area at 1.5 Hz; two of these showed a dip at 2 Hz and a slight increase at 4 Hz, whereas the third showed less at 4 Hz than at 2 Hz (Fig. 3A). The %δSI of the ROI in the center of the activated volume linearly increased from 1 to 4 Hz (average of the slopes = 0.33%/Hz, F1,60 = 51.3, p < 0.0001) (Fig. 3B). There is further evidence that there are differences among the slopes of the six subjects with no lack of linear fit. All six have positive slopes, four of which differ statistically from zero (p < 0.05).
Activation in the left primary sensorimotor cortex during opponent index finger movement on the right
Number of pixels.
p < 0.05 at Chi square > 13.5 with the Bonferroni correction for a total of 195 ROI.
NS, no significant change.
Activation in one subject caused by right-sided finger movement at 0.5 Hz (
(
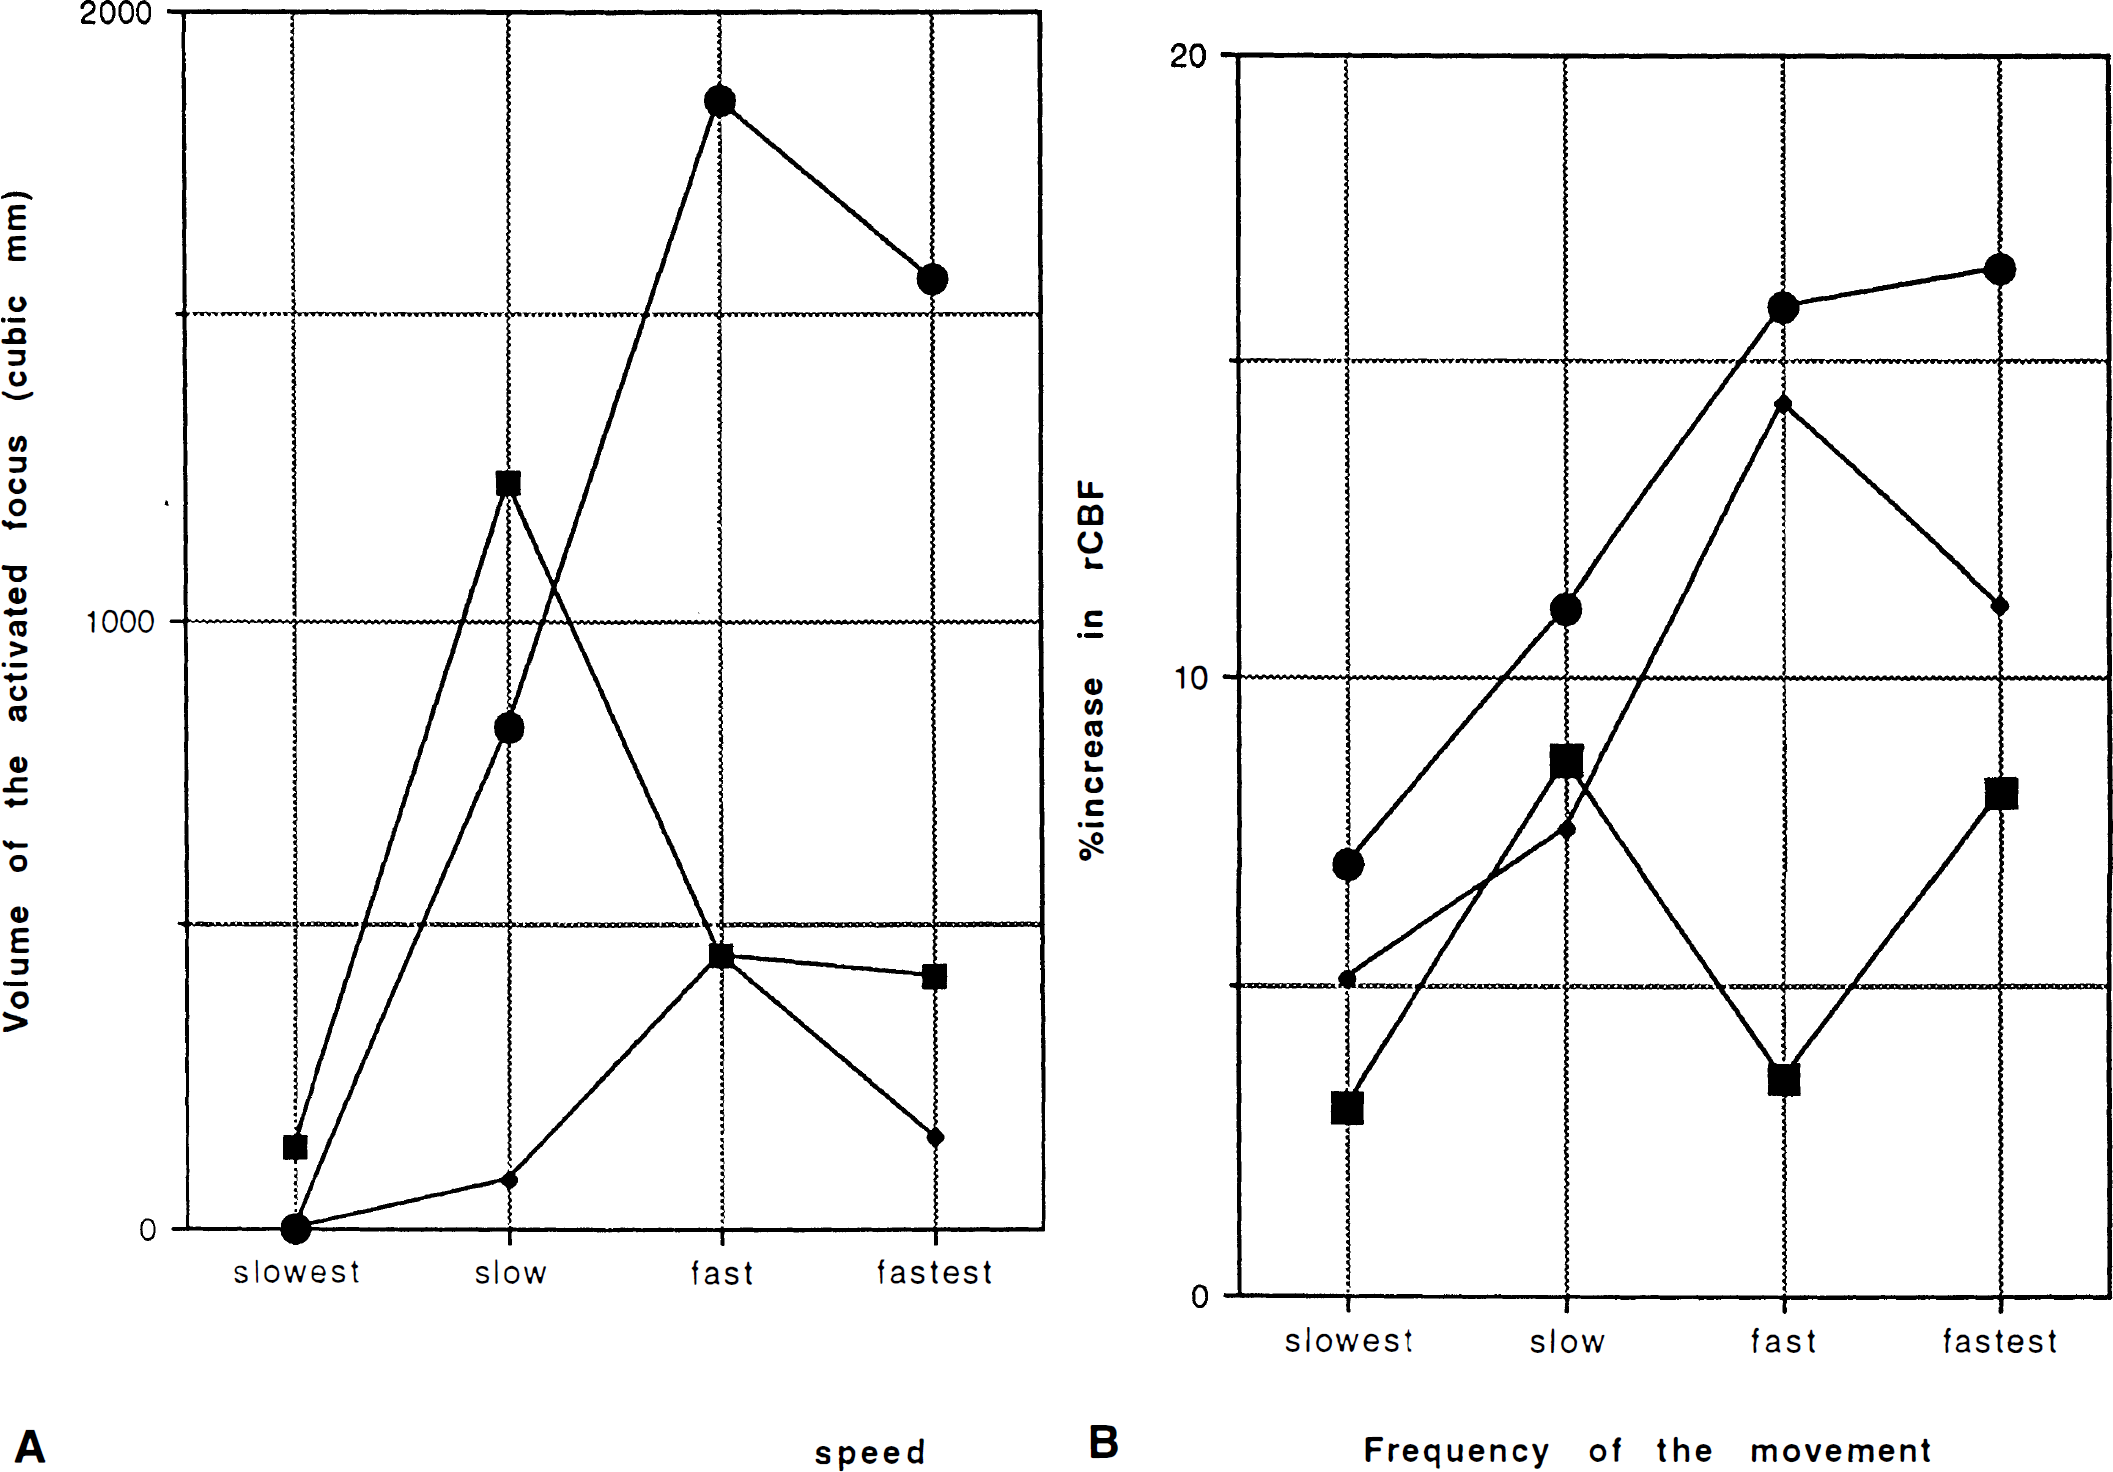
The areas of activation detected by both fMRI and PET were similar and located adjacent to the central sulcus (Fig. 4). Volume of activated foci in the SM1 detected by PET reached its maximum at slow (0.75 and 1 Hz) or fast (2 and 2.5 Hz) rates, slightly decreased at the fastest condition (3 and 4 Hz) (Fig. 5A). %δCBF showed a tendency to saturate above 2 Hz (Fig. 5B).
Activation in the left SM1 depicted by fMRI (
(
DISCUSSION
One of the advantages of fMRI over PET in activation studies is the higher spatial resolution, which could reduce partial volume effects. Higher temporal resolution (1 image/3 s) is another advantage that makes correlational analysis possible. With correlational analysis, the size of the activated area and increase of signal intensity can be evaluated independently, as the calculated cc characterizes the distribution of the spectral density in the frequency domain rather than the increment of the signal itself (Bandettini et al., 1993a).
In this study, we applied a correlational analysis in the Fourier domain rather than in the time domain. As phase information is eliminated with spectral density plot, the correlational change of signal intensity with the on-off period could be detected irrespective of response delay of signal intensity change. In the time domain, slow components or drift of signal intensity change unrelated to on-off period of the task are frequently observed and could greatly reduce correlation with respect to the reference waveform (Bandettini et al., 1993a). These components could be easily eliminated by digital filtering of spectral density plots. On the other hand, this method will detect equally pixels that increase or decrease with the input function. In this study, activated pixels detected had cc of >0.5 in the frequency domain with phase delay <9 s. Hence, we have detected only pixels that increase in signal intensity with task. In fact, the phase map did not show any negative responses around the central sulcus.
The threshold chosen here (cc > 0.5) was empirically determined and could be justified by the fact that the ROI defined by cc > 0.5 in the SM1 area had a much higher mean cc, suggesting that this threshold level is low enough to be sensitive to screen the region. Note should be made that the cc was calculated with the square of the spectral density in the frequency domain. The plot of the square of the spectral density accentuates the peak value of the original spectral density plot; hence, the characteristics of the responses are well extracted. Second, our ROI selection is clearly directed by the anatomic information of where the central sulcus is, allowing us to further limit the number of ROI.
The center of the activated foci in the primary sensorimotor area defined and selected by the two processes mentioned above showed statistically significant change as shown in the time series analysis with Bonferroni correction (Leonardo et al., 1995). This method takes into account autocorrelation of time series data that cannot be neglected in echo planar imaging acquisition with short time interval (Friston et al., 1994).
The relatively long duration of the on-off period (30 s on, 30 s off, 10 scans in each phased was used to reach the steady state of signal intensity in each phase, as it takes 6–9 s for signal intensity to reach plateau (Fig. 1). This allowed us to calculate mean signal intensity in each phase and %δSI. On the other hand, it reduced the number of periods in a limited time of measurement, which in turn might affect sensitivity of correlational analysis to detect the activated area. The optimal condition such as number of on-off cycles or duration of measurement is not known. Longer duration of measurement might induce physiologic effects such as learning or habituation (Karni et al., 1995).
In this study, the frequency of the movement was kept constant in each set of data acquisition series to make the response of the signal intensity change in the movement phase constant. This strategy allowed us to assume that the time course of measured signal intensity in an activated voxel was similar to the reference function. This method is in contrast with the previous study by Bandettini et al. (1993b) in which frequency of the movement varied within each session, making the shape of the time-signal intensity curve unpredictable.
Our method assumes that the signal change follows the reference function; hence, slower responses with longer time constants might be missed. As only two movements with 0.25 Hz were done during the initial three scans of each on period, it may not be enough to get stable activation. If the delay of activity increase would be much longer for a slow rate than that for a faster rate, the activated area and intensity for the slow rate might be underestimated due to delay of activation.
The quantitative relationship between MR signal intensity change and blood flow is not well understood. It has been hypothesized that MR signal intensity change in the T2*-weighted gradient echo sequence is proportional to changes in the total deoxyhemoglobin concentration in the voxel, which is affected by changes in blood volume and hematocrit as well as by changes in percent saturation of oxygen (Jezzard et al., 1994). Oxygen delivery, CBF, and cerebral blood volume increase with neuronal activation (Kwong et al., 1992). As CBF (and oxygen delivery) changes exceed cerebral blood volume change two- to fourfold and oxygen extraction fraction increases only slightly (Fox et al., 1988), total deoxyhemoglobin decreases; hence, less intravoxel dephasing and increased nuclear MR signal occur (Kwong et al., 1992). Detre et al. (1992) proposed a one-compartment model with the longitudinal magnetization and blood flow effect, which showed flow change was proportional to change of inverse of T1. Using inversion recovery echo planar imaging, which was a T1-sensitive sequence, Kwong et al. (1992) showed that percent change of MR signal by a T2*-sensitive sequence was identical to that of a T1-sensitive sequence in the activation of the primary visual cortex with photic stimulation of different frequencies, which in turn was well correlated with PET results from Fox et al. (1984). This implies that at least in the primary visual cortex, the signal intensity change observed with the BOLD method is proportional to δCBF elicited by increased neuronal activity. Here, we assume that energy-dependent changes in neuronal function and blood flow are coupled and that neuronal discharge rate is a measure of energy-dependent neuronal function (Raichle, 1987).
Our results with fMRI confirmed the previous report by Bandettini et al. (1993b), showing a linear increase of MR signal in the primary sensorimotor cortex as repetition rate of movement increased. The area over which frequency-dependent rCBF changes occur, however, may vary with repetition rate. The tendency for a decreased area of activation at higher frequencies may partly explain the saturation or ceiling effect of the rCBF change observed with PET.
A ceiling effect in blood flow in the SM1 was observed in the PET studies. Group analysis showed that an increase of rCBF in SM1 saturated at rates faster than 2 Hz (Sadato et al., 1996). In the present study with individual analysis, the area of activation showed saturation in the fast and fastest conditions. Since PET has limited spatial resolution, the amount of rCBF change measured at the center of the area of change depends not only on the true amount of rCBF change present there but also on the extent of the area of change relative to the spatial resolution of the system (Fox et al., 1985). Additionally, intersubject averaging for group analysis necessitates more spatial smoothing to compensate anatomical variation, causing poorer spatial resolution.
Our present fMRI study showed that the size of the activated area increased up to 2 Hz, reached a plateau, then showed a tendency to decrease. This could be explained as follows: When the frequency of the movement increases, more pixels have an activation above the threshold. When all pixels of the area have been activated above this threshold, the size of the activated area no longer increases. With higher frequencies, some areas in the SM1 increase their activity while others diminish, causing a decrease of the total activated area.
One possible reason for a decrease in area relates to afferent feedback. Primary motor cortex maps are modified by afferent feedback at the cortical neuronal nets targeting pyramidal tract neurons; that is, decreased afferent input can decrease intracortical inhibition, resulting in increased activation in the primary motor cortex (Brasil Neto et al. 1993; Sadato et al., 1995). Inversely, faster movement accompanied by more afferent feedback might intensify lateral inhibition, causing a decrease in the activated area of the primary motor area. Animal studies provide evidence that in the parietal cortex structures, there is short-term plasticity with reduction of the activity volume after exposure to a repetitive tactile stimulus (Whitsel et al., 1989).
The relationship between neuronal activity and rCBF change is not straightforward, since inhibition of neurons is an energy-consuming synaptic activity that is related to increase in rCBF just like excitation of neurons (Raichle, 1987). In rat cerebellar cortex, both activated and inhibited zones by electrical stimulation showed increased blood flow (Akgören and Lauritzen, 1995), supporting this notion. However, motor cortex neurons have local excitatory connections that would not be active if the neurons themselves were inhibited. Hence, rCBF might well indicate regions that are activated, not because of the synaptic activity leading to their own activation or because of their activity per se, but because when activated they will generate significant local synaptic activity. Inversely, increased lateral inhibition might cause a decrease in the activated area. Increased lateral inhibition could well occur in our experiments since the central pixel continuously increased in intensity.
Other possible technical reasons for a decreased area of activation might be as follows: (a) When the movement is faster, there might be a reduction in the total excursion of the finger even though it is tapping more frequently, and (b) perhaps with faster frequencies there is some reduction in force. Neither of these, however, could explain why the center of M1 linearly increased as the frequency increased.
Direct comparison of fMRI and [15O]water PET has not been reported often. Marenco et al. (1994) compared fMRI and [15O]water PET changes during visual stimulation with four normal volunteers. They found that the degree of activation in PET and fMRI did not correlate either within or across subjects. The authors speculated that this discrepancy could be due to the fact that fMRI reflects intravascular phenomena, while PET changes are more representative of tissue flow.
There are several differences between PET and fMRI, even though both are used for functional brain mapping based on the change of rCBF as a measure of neuronal activity. With use of [15O]water as a tracer, rCBF was originally calculated with Kety's diffusible autoradiographic method with arterial input function (Kety, 1951); thus, rCBF was a parameter of perfusion. In an activation study, the primary concern is to locate and quantitate regional changes of CBF induced by the activation paradigm because global CBF is not significantly affected by passive sensory stimulation or motor tasks (Fox et al., 1984, 1985 and 1986; Seitz and Roland, 1992). A fluctuation of global CBF could be caused by technical as well as physiological factors (Sadato et al., 1993). The effect of fluctuation of global CBF was effectively abolished by multiplying each pixel by a correction factor calculated as the scan global CBF divided by the true mean global CBF (Fox and Raichle, 1984). This method, global normalization, has been shown to allow quantitative comparison of the relative regional increase in radiotracer concentration and blood flow induced by selective stimulation. Subtraction of the resting condition from the activated condition localizes the foci related to the specific task. Recently, the simplified method without arterial sampling has been widely used, since no change in response-detection sensitivity or specificity was shown under certain conditions (Fox and Mintun, 1989). It is based on the fact that the concentration of [15O]water after bolus injection is nearly proportional to the CBF of that region. Global normalization and subtraction of the rest condition from the activation condition are followed, as in the original method. In either way of using PET, therefore, rCBF changes are properly understood as changes relative to whole-brain mean (Fox and Mintun, 1989). In the present study, we used the simplified method; hence, global CBF was not measured. On the other hand, fMRI signal changes reflect an intravascular event. Functional magnetic resonance imaging detects activation by the correlational change of signal intensity with the on-off cycle of the task, without any manipulation equivalent to global normalization in PET.
These differences make direct comparison of fMRI with PET useful, because PET has been established as an useful tool for functional brain mapping (Fox et al., 1984; Fox and Mintun, 1989; Roland, 1993). The present study confirmed the activation in the same loci in the SM1 by both fMRI and PET in the same subjects. Response detection appeared to be equivalent because individual analysis of PET constantly showed activation of the SM1 at 0.75 Hz or above, while fMRI revealed consistent activation of SM1 at 1 Hz or above. Direct comparison between PET with group analysis and fMRI is difficult, because of limited coverage by fMRI. In the present study, fMRI showed similar activation in the SM1 with the same task. Additionally, with higher spatial and time resolution, fMRI could dissociate area and magnitude of the change, thereby explaining the PET finding. Although monitoring of physiological parameters during the task is more difficult than with PET, our preliminary study underscores the usefulness of fMRI as a tool for functional brain mapping.
Footnotes
Abbreviations used
Acknowledgements
The authors thank Dr. Jose M. Maisog, National Institute of Mental Health, for his support in the data processing. Dr. Manabu Honda for his valuable comments and discussion, and D. G. Schoenberg, M.S., for skillful editing.