
Abstract
The potential effects of changes in blood flow on the delivery and washout of radiotracers has been an ongoing question in PET bolus injection studies. This study provides practical insight into this topic by experimentally measuring cerebral blood flow (CBF) and neuroreceptor binding using simultaneous PET/MRI. Hypercapnic challenges (7% CO2) were administered to non-human primates in order to induce controlled increases in CBF, measured with pseudo-continuous arterial spin labeling. Simultaneously, dopamine D2/D3 receptor binding of [11C]raclopride or [18F]fallypride was monitored with dynamic PET. Experiments showed that neither time activity curves nor quantification of binding through binding potentials (BPND) were measurably affected by CBF increases, which were larger than two-fold. Simulations of experimental procedures showed that even large changes in CBF should have little effect on the time activity curves of radiotracers, given a set of realistic assumptions. The proposed method can be applied to experimentally assess the flow sensitivity of other radiotracers. Results demonstrate that CBF changes, which often occur due to behavioral tasks or pharmacological challenges, do not affect PET [11C]raclopride or [18F]fallypride binding studies and their quantification. The results from this study suggest flow effects may have limited impact on many PET neuroreceptor tracers with similar properties.
Keywords
Introduction
The effect of changes in radiotracer delivery on outcome measures of receptor-specific positron emission tomography (PET) studies has been a recurrent discussion in the literature.1–3 Pharmacological challenges or activation paradigms can cause large and potentially rapid changes in cerebral blood flow (CBF), as shown with PET flow tracers, blood oxygen level dependent (BOLD), CBF or cerebral blood volume (CBV) measurements in experiments using functional magnetic resonance imaging (fMRI) techniques.4–9 Typically, the purpose of pharmacological challenges in receptor imaging studies with PET is to measure reductions in PET signal that can be attributed to reductions in specific receptor availability. However, if the delivery and washout of the tracer are also altered during the timeframe of a PET study or in conjunction with a pharmacological challenge, a central question is how PET measures of receptor binding could be affected.
In PET blocking or competition studies, it is usually assumed that the kinetic parameters of the radiotracer are constants throughout a study, except for the binding term k3. A variety of model-based analyses1,10,11 rely on this assumption and have been adopted to assess receptor binding for studies that employ a double bolus design (baseline scan followed by a blocking scan) or a within-scan challenge. Yet, pharmacologic challenges, such as amphetamine, can produce relatively large transient changes in CBF and CBV,4,5 with their relationship described by Grubb et al. 12 These dynamic parameter changes may invalidate the assumption of constant kinetic rates. Large CBF changes can occur in a variety of clinical or experimental conditions, secondary to direct neurovascular coupling in settings of increased activity (e.g. epilepsy or cognitive tasks) or respiratory changes (hyper- or hypocapnia). Regardless of origin, sizable changes in CBF and CBV potentially could have pronounced effects on radiotracer delivery, washout and their dynamics. 2
Previously, investigations have simulated whether specific binding measures can be affected by changes in blood flow. Various assumptions have been made to simulate the precise mechanism of how blood flow could affect kinetic parameters in a compartmental model. Several studies postulated that blood flow changes affect both the plasma-to-tissue transfer rate K1 and the tissue-to-plasma transfer rate k2 in the same manner.1,2,13 Assuming a dependency of k2 on K1, changes in CBF of up to 25% were simulated to produce a negligible effect. 3 However, the empirical relationship between flow changes and these kinetic parameters has not been independently measured in the setting of significant flow alterations. Indeed, others have made different assumptions and decoupled K1 and k2. These models resulted in more pronounced changes in simulated time activity curves (TAC) caused by CBF changes.2,3 Thus, the fundamental question remains which of these underlying assumptions is more physiologically relevant. 2
One experimental investigation in humans was reported 14 in which hyperventilation was used to decrease blood flow physiologically while measuring dynamic PET time-activity data from [11C]raclopride. While changes in the overall shape of TACs were observed, decreases in blood flow for the duration of the experiment did not affect binding potentials of [11C]raclopride. Other radiotracers, especially those that may have a large extraction fraction in vivo, irreversible binding, or very high affinity, are suspected to be vulnerable to bias arising from changes in flow. Cumming et al. 15 postulated that differences in [18F]fallypride binding potentials, an example of a high affinity radiotracer, are due to differences in CBF values and thus tracer delivery in healthy volunteers and that these could even be used as a surrogate marker for CBF. This finding and the confound of CBF changes would potentially question the validity of studies that have used [18F]fallypride to investigate dopamine displacement and characterize extra-striatal D2/D3 receptor binding.16,17
Simultaneous measurements of blood flow and receptor binding would be able to experimentally measure the effects of blood flow on radiotracer binding. By repeatedly injecting a short-lived blood flow tracer in the presence of a long-lived neuroreceptor ligand, measurements of both CBF and receptor occupancy are possible using PET alone, 18 but such experiments are highly technically demanding and have not been performed to our knowledge. With the availability of combined PET/MRI scanners, however, it is now possible to continuously monitor CBF using arterial spin labeling techniques19,20 during a neuroreceptor PET imaging experiment. This method has the advantage that changes in flow can be tracked continuously at high temporal resolution (seconds to minutes) throughout a PET study. By perturbing CBF using modest respiratory challenges between or during the scan in a way that does not directly influence neuroreceptor availability, the effect of changes in blood flow on radiotracer binding can be directly evaluated using simultaneous PET/MRI technology.
The goal of this study was to experimentally measure controlled changes in CBF and their influence on PET time activity curves (TACs) with simultaneous PET/MRI in a variety of settings simulating a range of experimental paradigms of general interest. CBF was increased by inducing hypercapnia in non-human primates (NHP) for specific periods of time during the dynamic PET acquisition, and changes in CBF were simultaneously measured with arterial spin labeling. Two tracers specific to the dopamine D2/D3 receptors were investigated: [11C]raclopride, a well-validated tracer for displacement studies, and [18F]fallypride, a tracer previously suggested to be susceptible to flow changes. We carried out simulations of flow changes and compared these to experimental results, thus providing insight into the assumptions used for kinetic simulations.
Materials and methods
Animal model
Imaging studies were carried out in two healthy baboons (papio anubis, one male, three years old and one female with active menstrual cycle, four years old), both with a weight of approximately 10 kg. Initial anesthesia was induced with 10 mg/kg ketamine and 0.5 mg/kg xylazene, and maintained during the scan by isoflurane (1%, mixed with air). Baboons were ventilated throughout the entire study and physiological changes in blood pressure, pulse, end-tidal CO2 and breathing rate were monitored during the experiment. The baboons did not receive any pharmacological challenges acting at the dopamine receptor system before or during the study, and there was at least one month of a drug-free period before the start of these experiments. All procedures were approved by and complied with the regulations of the Institutional Animal Care and Use Committees (IACUC) at Massachusetts General Hospital, and are reported according to ARRIVE guidelines.
Study design with hypercapnia
To induce hypercapnia (and thus increase CBF), animals were ventilated with 7% CO2 mixed with air for a period of 10–15 min at a time. Exposure to 7% CO2 was repeated in a block design fashion, interleaved with a period of 10–15 min of ventilation with air.
Two experimental conditions were carried out with [11C]raclopride that mimicked the timing normally used for within-scan pharmacological or behavioral challenges: In one condition (1×CO2), one hypercapnia period of 12 min was applied 34 min after injection of the radiotracer. In another condition (3×CO2), hypercapnia was applied three times for a duration of 10 min, starting at 20, 40 and 60 min after tracer injection, which would allow to observe the effects of increasing blood flow on the TAC in a dynamic fashion. Experiments with [11C]raclopride were carried out in the male baboon. Using [18F]fallypride, a baseline and two varying hypercapnia conditions were tested in the female baboon: One experimental design employed five hypercapnia challenges (5×CO2) in an ON-OFF block design, with the timings representing within-scan challenge conditions. Each hypercapnia challenge lasted 12 min, with onsets at 30, 60, 90, 120 and 150 min. after injection of the radiotracer. In a different experimental design (2×CO2), the onset of the first hypercapnia challenge was timed to start 4 min before injection of the radiotracer and to last for 16 min. This design allowed for measurements of flow effects during the uptake of the tracer. An additional hypercapnia period was added at the end of the scan at 110 min (for a duration of 15 min) after radiotracer injection.
PET/MR image acquisition
Simultaneous PET and MR data were acquired on a whole-body human PET/MR scanner at 3 T (mMR, Siemens AG, Healthcare Sector, Erlangen Germany). A custom-built PET compatible 8-channel NHP receive array together with the body coil for transmit was used for MR imaging. 21 For quantitative flow measurements, pseudo-continuous arterial spin labeling (pcASL) optimized for NHPs 22 was employed for the entire duration of the experiment (FOVread = 128 mm, resolution = 2 × 2×4 mm, TE = 15 ms, TR = 3.5 s, post-labeling delay = 800 ms, BW = 1474 Hz). The phased-array receiver enabled a two-fold acceleration with GRAPPA 23 in the anterior-posterior direction.
PET emission data were acquired in list-mode format for 90 min ([11C]raclopride) or 150–180 min ([18F]fallypride) starting with radiotracer injection, which was given as a bolus by hand injected over 30 s. Injected activities were kept similar for each radiotracer injection, with an average of 5.01 ± 0.02 mCi for [11C]raclopride and 3.12 ± 0.08 mCi for [18F]fallypride experiments. Average specific activities of the produced radiotracers were 1.1 mCi/nmol for [11C]raclopride and 22.7 mCi/nmol for [18F]fallypride. Images were reconstructed with the ordinary Poisson expectation maximization algorithm with 3 iterations and 21 subsets. Corrections for scatter and attenuation of the head and the radiofrequency coil were applied during reconstruction. The final reconstructed volume consisted of 4 × 4×2 mm voxels in a 172 × 172×127 matrix, with framing intervals of 10 × 30 s, followed by 1 min frames.
ASL data analysis
Both MR and PET data were registered to the Saleem-Logothetis stereotaxic space, 24 in which regions of interest were defined standardly. All data analysis and processing were performed with open-access software. 25
ASL data were first motion-corrected and spatially smoothed with a 4 mm Gaussian kernel, after which they were skull-stripped and registered. To compute perfusion-weighted or relative CBF maps, a pairwise subtraction of tag and control data was performed. Images were averaged over experimentally defined blocks of baseline and hypercapnia conditions and normalized to the respective tag condition. Quantitative CBF voxelwise maps for each condition were computed for a single post-labeling delay as described in previous methods. 22
PET data analysis: Kinetic modeling
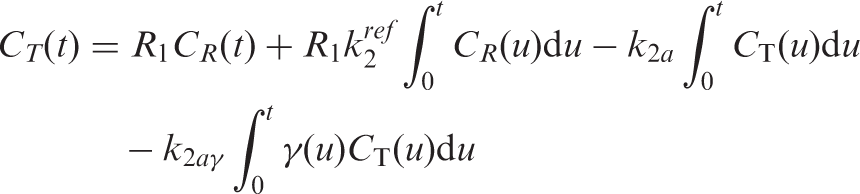
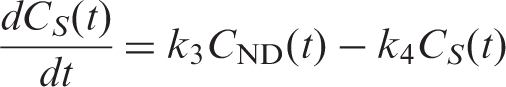
PET [11C]raclopride and [18F]fallypride data were analyzed with a GLM formulation of the three-parameter simplified reference tissue model (SRTM)26–28 using the cerebellum as a reference region. The SRTM is based on the following basic equations
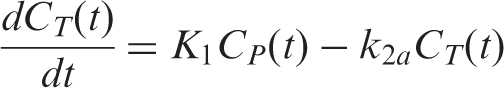
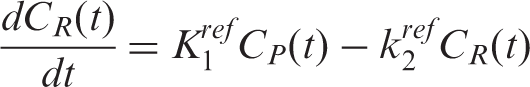
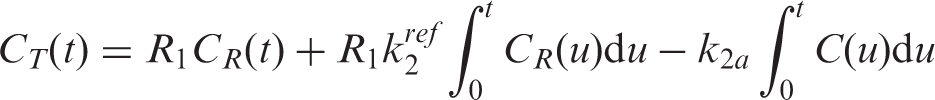
Substituting the expression for C
P
(t) and integrating, we get an expression for the total tissue concentration C
T
(t). In this case, all kinetic rates are assumed to be constant
For [11C]raclopride, SRTM was used to analyze the full TAC (90 min of data acquisition). In a second analysis, only the first 20 min of the TAC was used for the SRTM analysis. Using the first 20 min of the scan provides an estimate to a no-flow-change condition in the same scan (within-scan baseline) because hypercapnia was only introduced after 20 min. In a third analysis, the first 60 min of the TAC were taken into account for an SRTM analysis for comparison purposes to the previous cases.
In addition to steady state kinetic modeling, analyses with a time-dependent k2a(t) binding parameter were performed, based on previously established models, such as the linear extension of the reference tissue model LSSRM
1
or ntPET.
2
In the study presented here, the time-dependent parameter was not based on an exponentially decaying activation. Rather, we chose to represent the hypercapnia periods as an instantaneous change to a new constant value since changes in CBF were observed rapidly. The time-dependent binding parameter used to quantitatively evaluate the effect of flow changes on binding measures, is thus described as
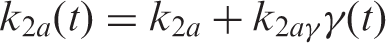
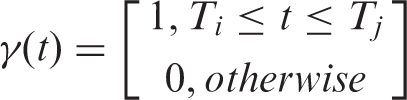
The parameters T i and T j are defined by the timing of the challenge, i.e. the start and end of the CO2 exposure, so that k2a(t) represents one activation term with cyclic “ON” periods. The k2a(t) parameter was then fitted to a new constant value for the duration T i to T j of the challenge.
The operational equation including the time-dependent binding term is thus expressed as
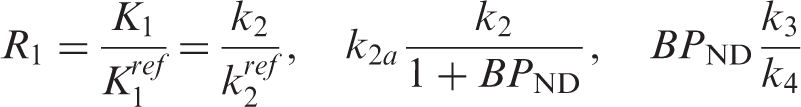
In order to quantify binding changes over time, the time-dependent binding quantity, dynamic binding potential
29
(DBPND), was computed from the time-dependent binding term k2a(t) and its relationship to the other rate constants

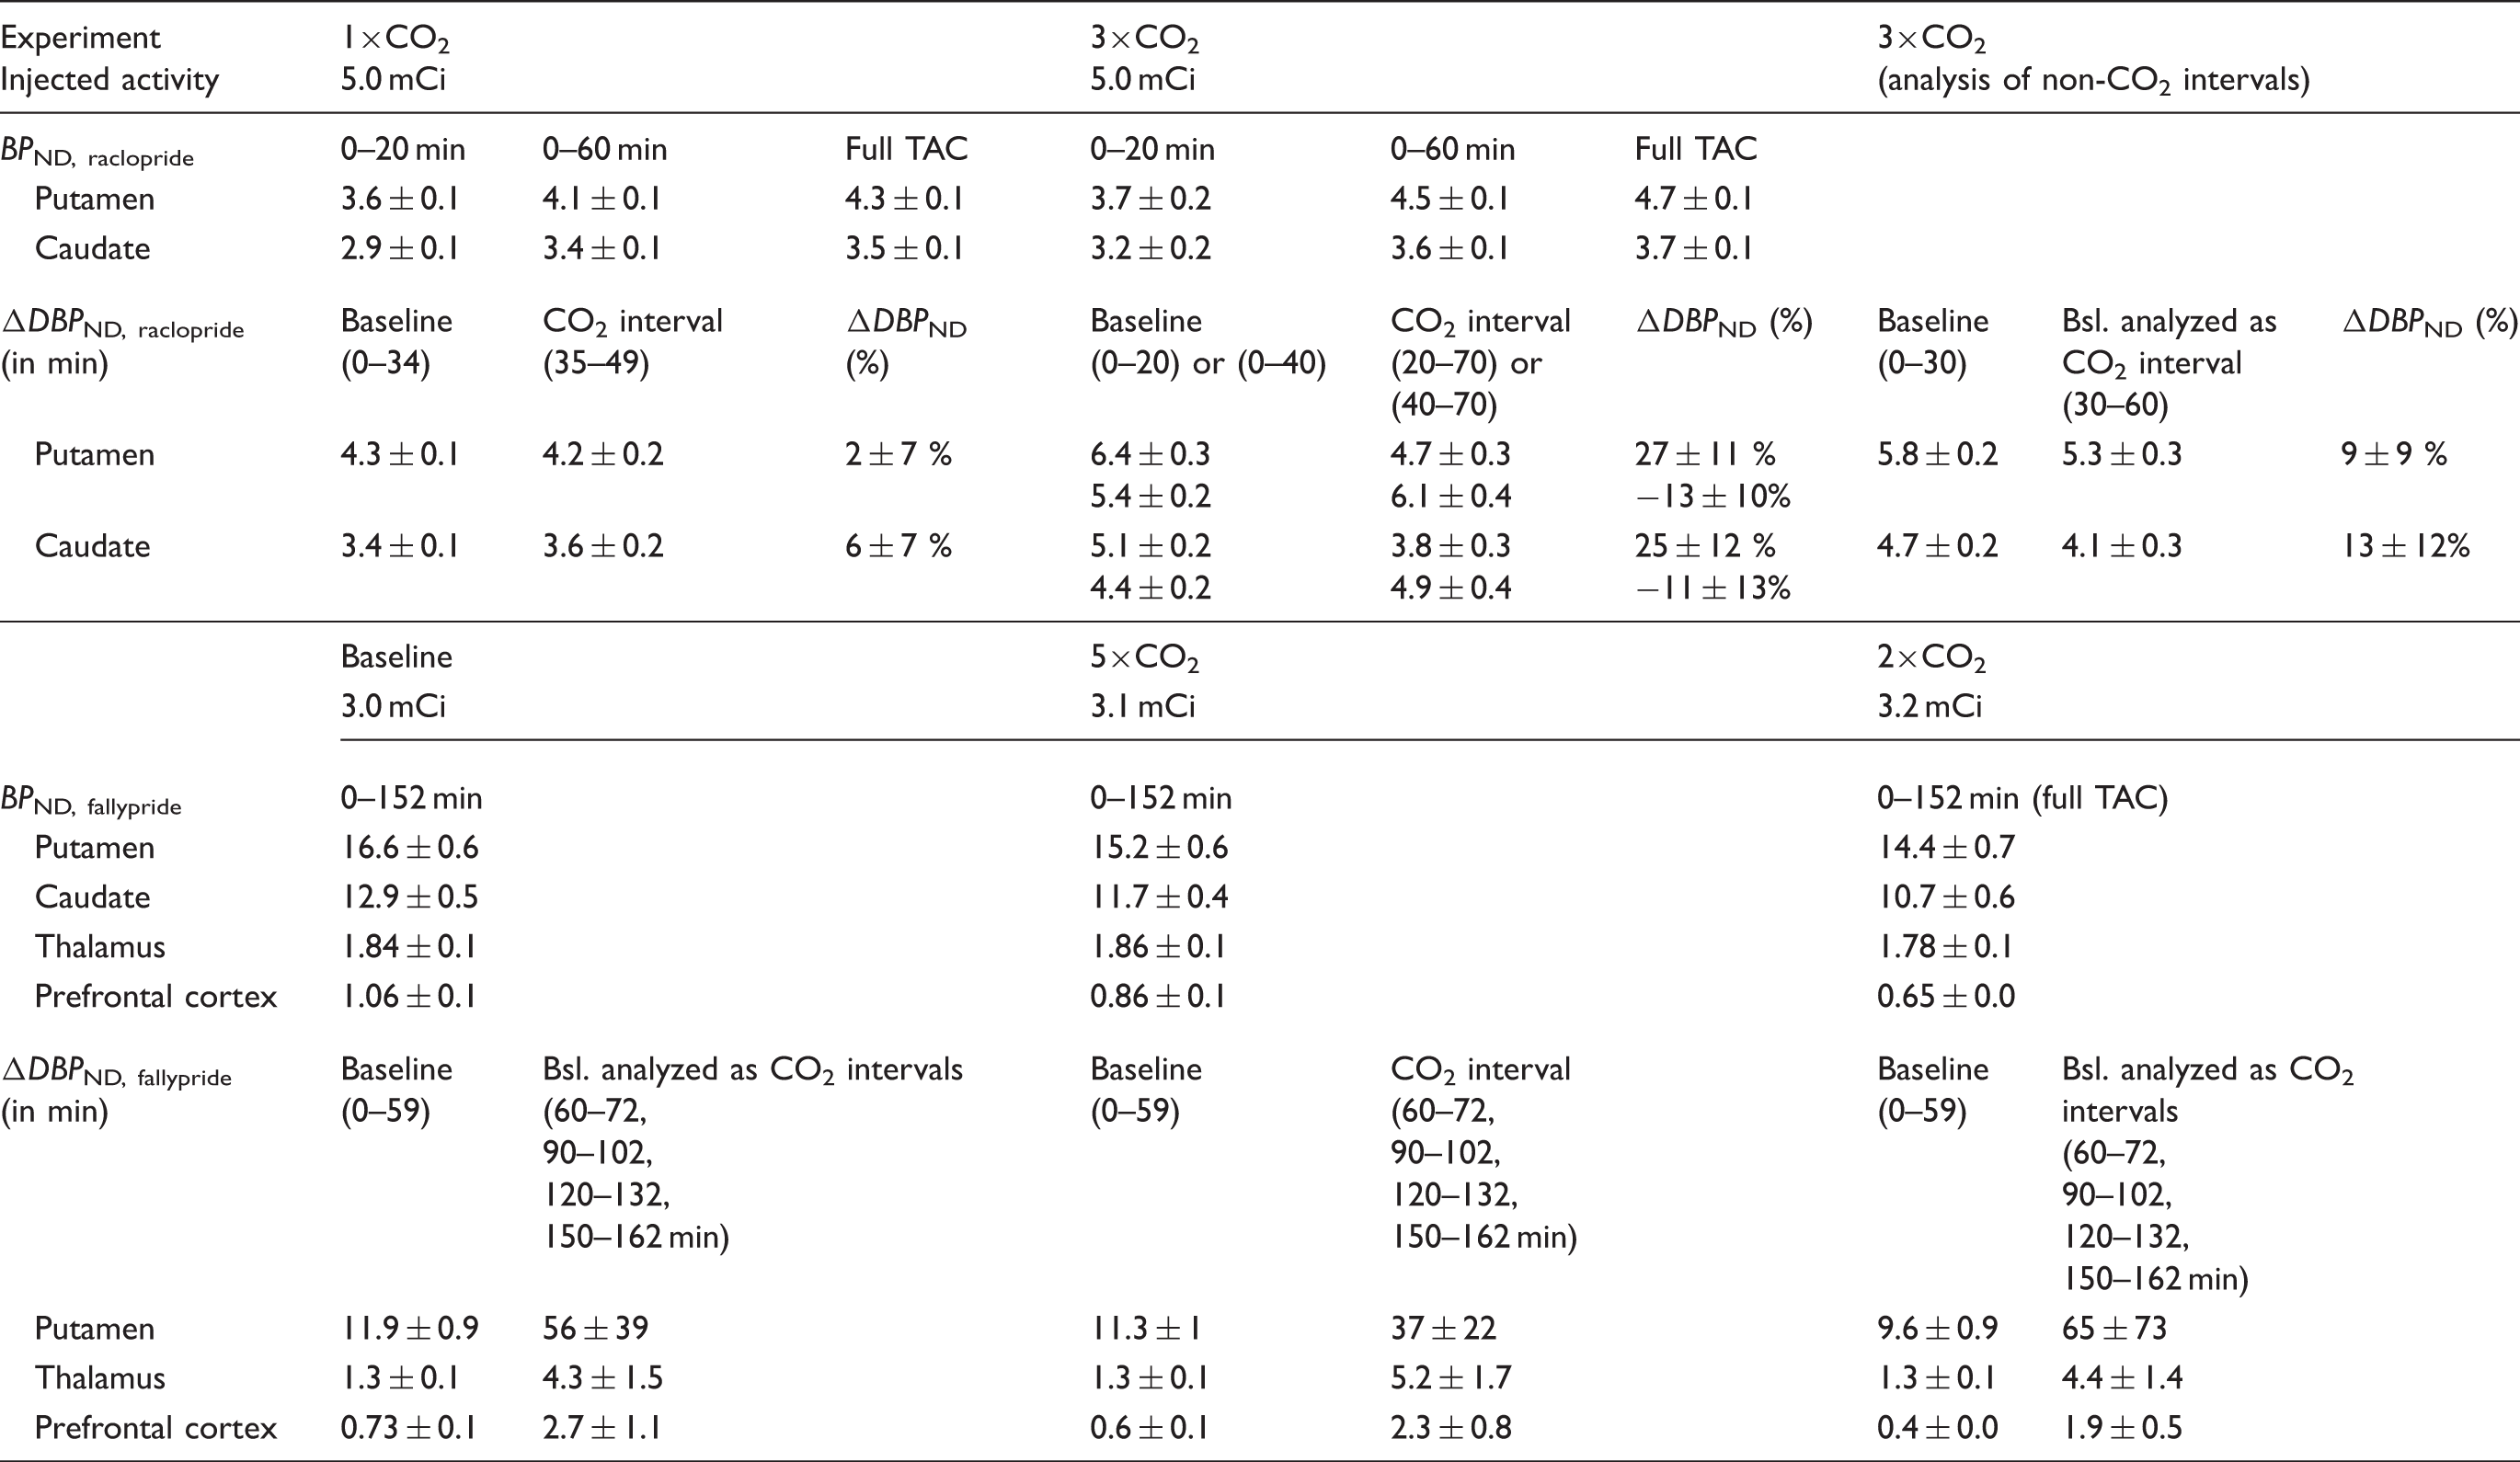
For each analysis, the error for estimating the binding potential (BPND or DBPND) was calculated by propagation of the standard error from the linear model analysis in k2 and k2a, and is reported in, e.g. Table 2.
Simulations: Reference tissue model
The effect of flow changes on radiotracer kinetics was simulated using a forward model implementation of the full reference tissue model (FRTM), 30 i.e. a two-tissue compartmental model, for the radiotracers [11C]raclopride and [18F]fallypride. The inputs to the forward model were a simulated plasma input function and kinetic rate constants K1 through k4.
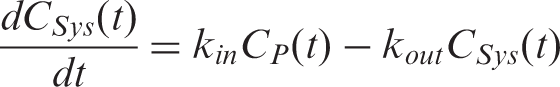
The plasma input function was calculated using a model that consists of two compartments representing the plasma concentration C
P
and a system concentration C
Sys
. The input to the plasma compartment is the bolus injection I, modeled as a rectangular pulse function that with a duration of 1 min. Three kinetic rate constants determine the shape of the plasma input function: a system inflow rate k
in
= 1/6 min−1, a system outflow rate k
out
= 1/12 min−1 and a plasma clearance rate k
cl
= 1/16 min−1. The operating equation for the plasma input function is
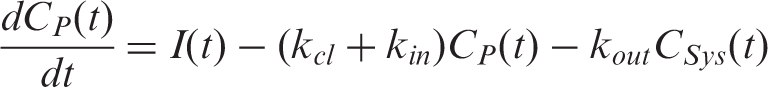
These equations were solved numerically for the plasma concentration C p , which was used as an input to the two-tissue model described below.
Simulations of the FRTM were based on the operational equations of a two-tissue compartmental model

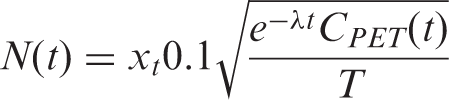
Noise was added to the simulated TACs using a noise model proposed by Logan et al.
31
The model uses random noise that is dependent on counting statistics and thus increases in later time frames according to the following formula
Parameter values for simulations of a specific binding region with [11C]raclopride were assumed to be K1 = 0.16 mL/100g/min−1, k2 = 0.36 min−1, k3 =0.4 min−1 and k4 = 0.14 min−1, so that true outcome parameters were binding potential BP = 2.86 and volume of distribution VD = 0.44. To simulate [18F]fallypride kinetics, a different set of parameters was assumed with K1 = 0.46 mL/100g/min−1, k2 = 0.12 min−1 and k4 =0.025 min−1, and a high binding and a low binding region was simulated by two different k3 values: k3, high-binding = 0.63 min−1, k3, low-binding =0.05 min−1. True outcome parameters were thus BPhigh-binding = 25.2, BPlow-binding = 2 and volume of distribution VD = 3.8. For simulations of the reference region, k3 and k4 were assumed to take a value of zero for both radiotracers. All simulations were implemented in MATLAB (Mathworks, Natick, MA).
Simulations: Changes in blood flow
The hypercapnia interventions were modeled by including a time-dependent change in the kinetic rate constants K1 only, or both K1 and k2, and the respective rate constants in the reference regions. The simulated timing of the flow change mimicked the hypercapnia timing with the ON-OFF design from the experiments with the 3×CO2 condition and the shape of the experimentally measured blood flow changes.
Changes in blood flow were simulated with the following assumptions: (i) Blood flow F is related to the blood to tissue transfer rate constant K1 by
For the purpose of validating assumptions, simulation results with the above assumptions were compared to the following alternative assumptions: (iv′) Surface area S stays constant, i.e. is flow-independent. (v′) Only K1 is flow-dependent, k2 stays constant.
A larger parameter space, with kinetic rates (K1 through k4) varying from 0 to 1, extraction fractions from 0 to 1 and CBF changes up to 300%, was also investigated in order to understand the effect of CBF changes on a potential range of radiotracers with varying properties.
Results
Experimental results: [11C]raclopride
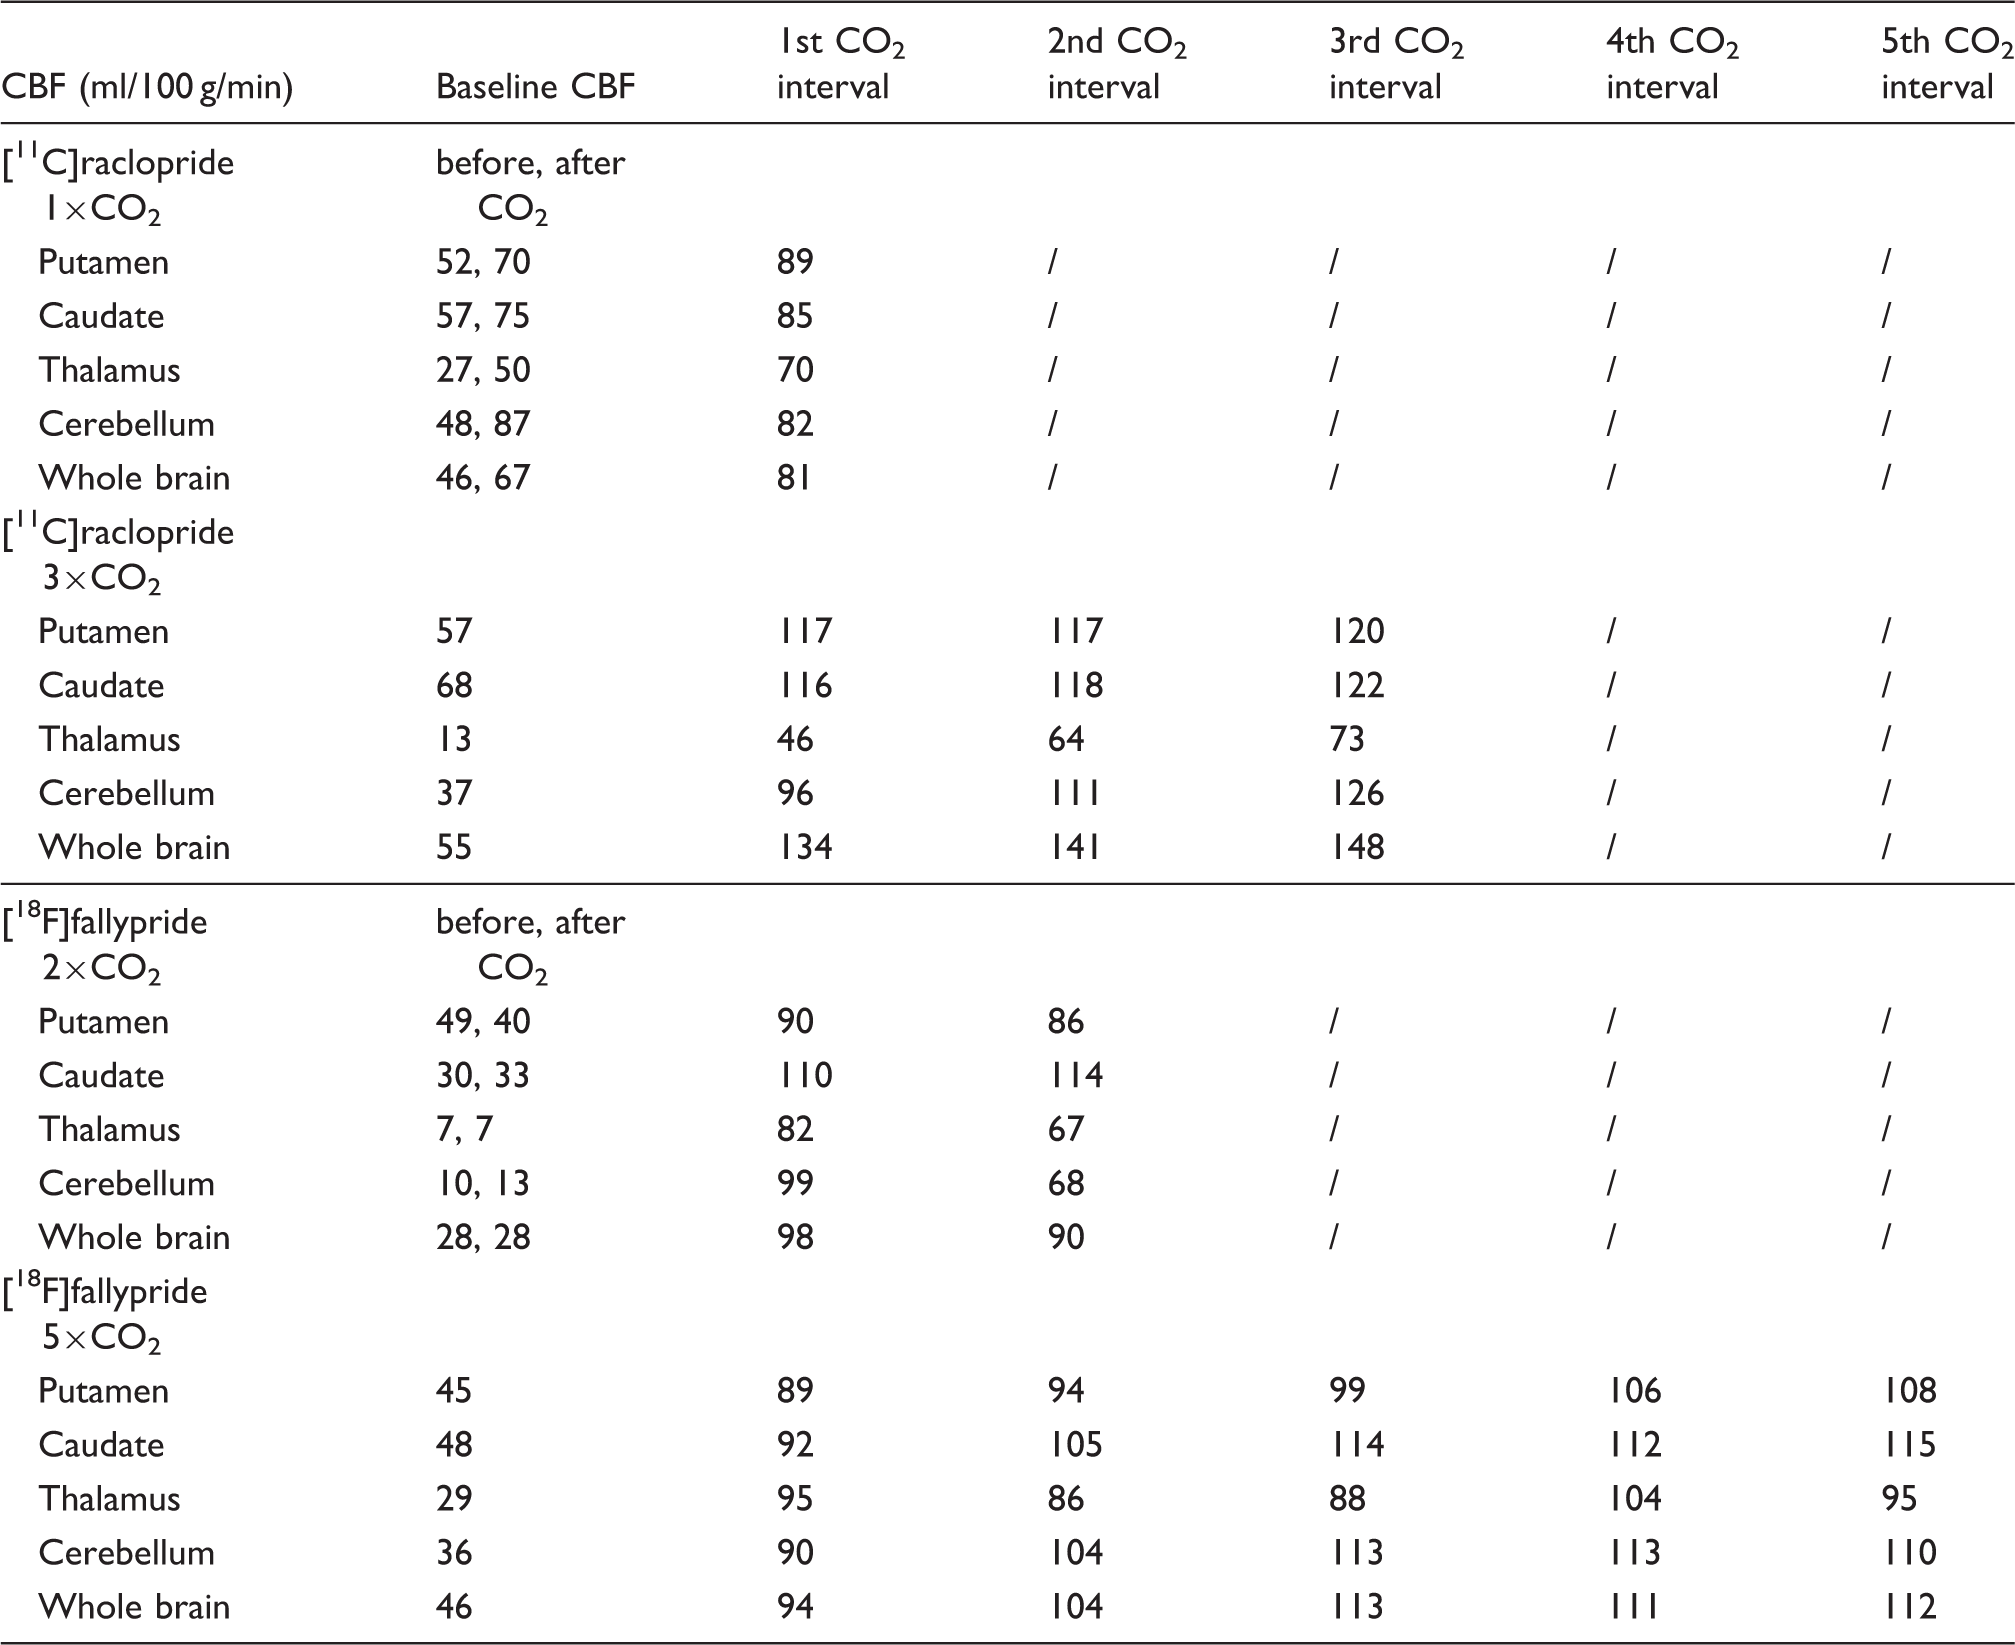
Experimental results from the 3×CO2 study are shown in Figure 1 as a representative scanning session for [11C]raclopride. Increases in CBF, as measured by pcASL, in response to the hypercapnic challenges were measured in all regions, albeit with different magnitudes, as shown for the putamen and cerebellum ROIs in Figure 1(c). Flow increased up to 110% in the putamen and up to 245% in the cerebellum, relative to baseline values. Quantitative analysis of the pcASL data in the putamen showed that flow increased from a baseline value of 59 ml/100g/min to 114, 116 and 119 ml/100g/min for the first, second and third hypercapnic challenge, respectively. In the cerebellum, baseline values of flow were lower (37 ml/100g/min) but increased to 96, 111 and 126 ml/100g/min for the three hypercapnic challenges. See Table 1 for a full list of quantitative CBF values during hypercapnia conditions.
Experimental results from a [11C]raclopride bolus injection and hypercapnia challenges of 7% CO2 applied three times during the session (3×CO2). (a) Time activity curves for putamen and cerebellum show no effects during hypercapnia (blue-shaded areas). (b) Residuals between the kinetic modeling fit and data do not show any pattern associated with the timing of the challenge. (c) Measured flow changes with pcASL show increases in flow in the putamen and cerebellum ROIs. (d) End-tidal CO2 values correspond to measured flow changes. Absolute cerebral blood flow (CBF) values in ml/100g/min during baseline and for each hypercapnia interval. Note: CBF values were measured with pcASL and are listed in ml/100 g/min. The numbered CO2 columns denote chronological hypercapnia periods within each experiment. CBF: cerebral blood flow; pcASL: pseudo-continuous arterial spin labeling. Binding potential estimates for different intervals of the baseline and hypercapnia conditions. Note: SRTM was used for estimating BPND, and a time-dependent k2a(t) parameter was employed for the DBPND estimates. Reported errors in binding potentials denote standard errors from the GLM analysis, calculated from the propagation of errors from k2 and k2a. “Bsl. analyzed as CO2 intervals” signifies that the change in the k2a(t) parameter was set to fall outside of hypercapnia periods. SRTM: simplified reference tissue model; BPND: binding potential; DBPND: dynamic binding potential; Bsl.: Baseline.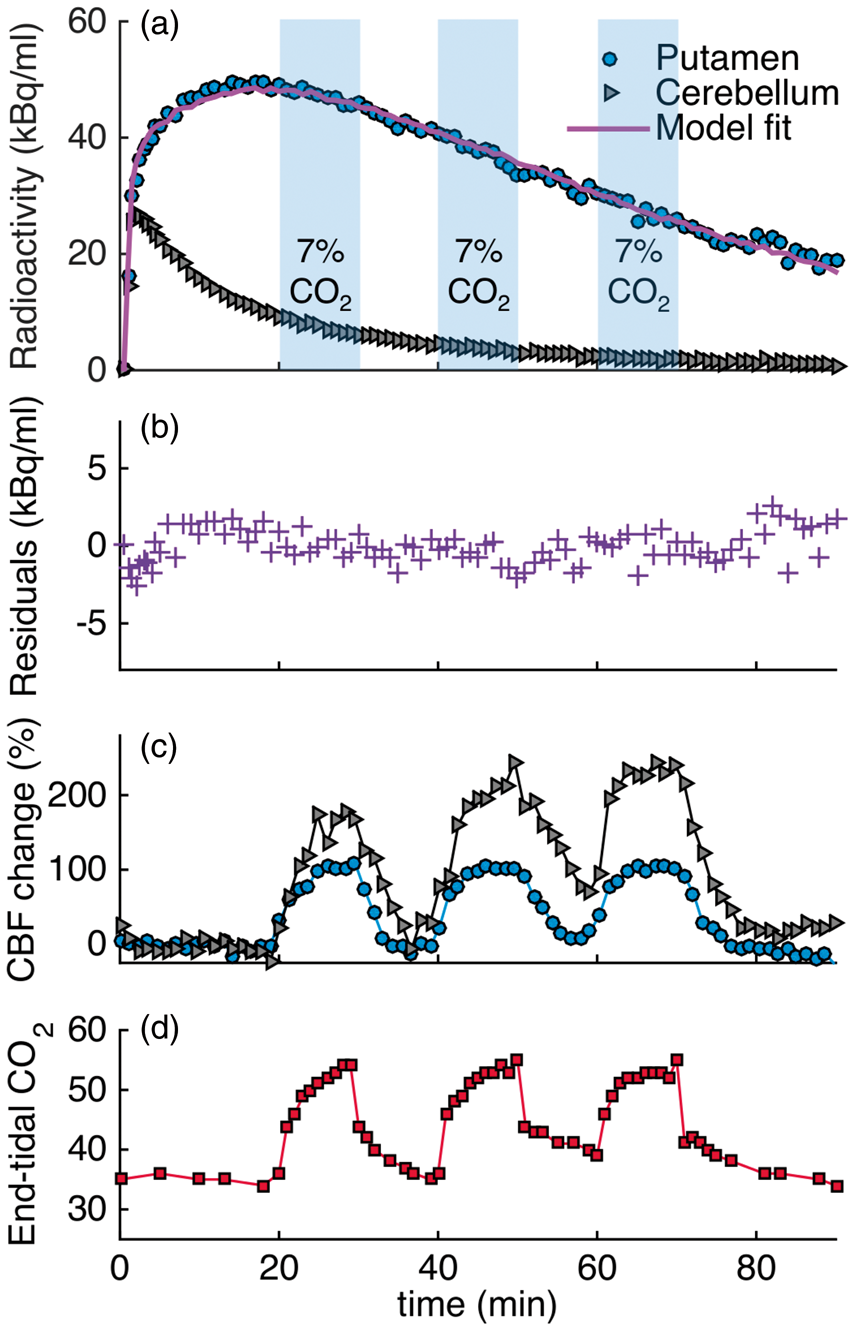
End tidal CO2 (etCO2, Figure 1(d)) correlated well in time with the measured changes in CBF by pcASL. Baseline values started at 35 mmHg and increased by 20 mmHg up to a maximum value of 55 mmHg during the administration of hypercapnia.
Figure 1(a) shows [11C]raclopride TACs for the putamen and cerebellum that were acquired simultaneously with the flow changes. Qualitatively, the TACs do not show prominent changes due to the hypercapnia condition. In a separate experimental session (1×CO2), in which hypercapnia was applied once for a duration of 12 min at 34 min after injection of the radiotracer, no qualitative change in the TAC was observed either.
Quantification of the [11C]raclopride PET data with the SRTM kinetic model and constant kinetic rates resulted in good fits to the entire TAC (solid purple line in Figure 1(a)). Figure 1(b) shows the residuals between the fit and the data. No periodic changes that match the flow pattern are detectable. Based on the Durbin–Watson test of autocorrelation, the residuals are not significantly correlated at the p = 1.5 × 10⁻⁴ level. Table 2 lists the binding potential values for putamen and caudate for the two experimental conditions and the three analyses with different time durations: (i) Using the full 90-min acquisition TAC, the binding potential for the experimental condition with one hypercapnic condition (1×CO2) was BPND = 4.3 ± 0.1 in the putamen. For the experiment with three hypercapnic conditions (3×CO2), as shown in Figure 1, BPND = 4.7 ± 0.1 in the putamen. (ii) An SRTM analysis of the first 20 min of the TAC resulted in BPND values of 3.6 ± 0.1 (1×CO2 experiment) and 3.7 ± 0.2 (3×CO2 experiment) in the putamen. (iii) If the first 60 min of the TAC are analyzed, BPND values in the putamen were 4.1 ± 0.1 (1×CO2 experiment) and 4.5 ± 0.2 (3×CO2 experiment). These values are lower compared to a TAC analysis for a full 90 min, which is likely due to estimation bias when using shorter TACs. From simulations of [11C]raclopride data, we found that there was <2% bias in estimating BPND for using a TAC of a duration of 90 min or 60 min. However, a TAC of duration of 40 min or 20 min underestimated BPND by 8% or 22%, respectively. These differences are similar to those observed in the analysis of the real data.
In a second analysis, a time-dependent k2a term was used to model any changes in binding due to hypercapnia periods. In the 1×CO2 session, there were no significant changes in DBPND detected during the known CO2 interval, based on an F test of the k2a term within the linear model implementation. In the 3×CO2 session, larger changes in DBPND were measured (Table 2) but differed in sign when modeling the hypercapnia periods that started at 20 min versus when modeling the hypercapnia periods starting at 40 min. As a comparison, the non-hypercapnia intervals (30–40 min and 50–60 min) were modeled as “simulated” hypercapnia periods with a varying k2a term. The resulting DBPND values showed changes in binding equivalent to those during the hypercapnia period, suggesting that the changes observed in the time-dependent analysis are not due to flow but due to larger variances in the analysis. None of these analyses methods produced a better fit compared to a standard SRTM analysis.
Experimental results: [18F]fallypride
Figure 2 shows the experimental results for applying five hypercapnia challenges (5×CO2) in an ON-OFF block design over the timecourse of the experiment of 180 min. The timing of the cyclic hypercapnia challenge is indicated by the shaded areas of 7% CO2 exposure. TACs did not show any noticeable changes that matched the pattern of flow modulations (Figure 2(a)). Relative blood flow values measured with pcASL are shown in Figure 2(b). In the putamen, flow increased by up to 178% and in the cerebellum flow increased by up to 246% during hypercapnia. Quantitative CBF values in putamen were 45 ml/100g/min at baseline and increased up to 108 ml/100 g/min during the fifth hypercapnic condition with the highest average value. In cerebellum, baseline values started at 36 ml/100 g/min and increased up to 113 ml/100 g/min. Initial baseline etCO2 values were 32 mmHg and increased to a maximum of 52 mmHg during hypercapnia, as shown in Figure 2(c). The temporal changes in etCO2 matched the pattern of hypercapnia conditions and flow changes very well.
Experimental results from an [18F]fallypride bolus injection and hypercapnia challenges of 7% CO2 applied five times for 12 min during the experiment (5×CO2). (a) Time activity curves for putamen, thalamus and cerebellum are not noticeably affected by hypercapnia (timing of challenge indicated by shaded areas). (b) Measured cerebral blood flow changes with pcASL show increases in flow in the putamen and cerebellum ROIs during hypercapnia. (c) End-tidal CO2 values are well-matched with flow changes for the duration of the experiment.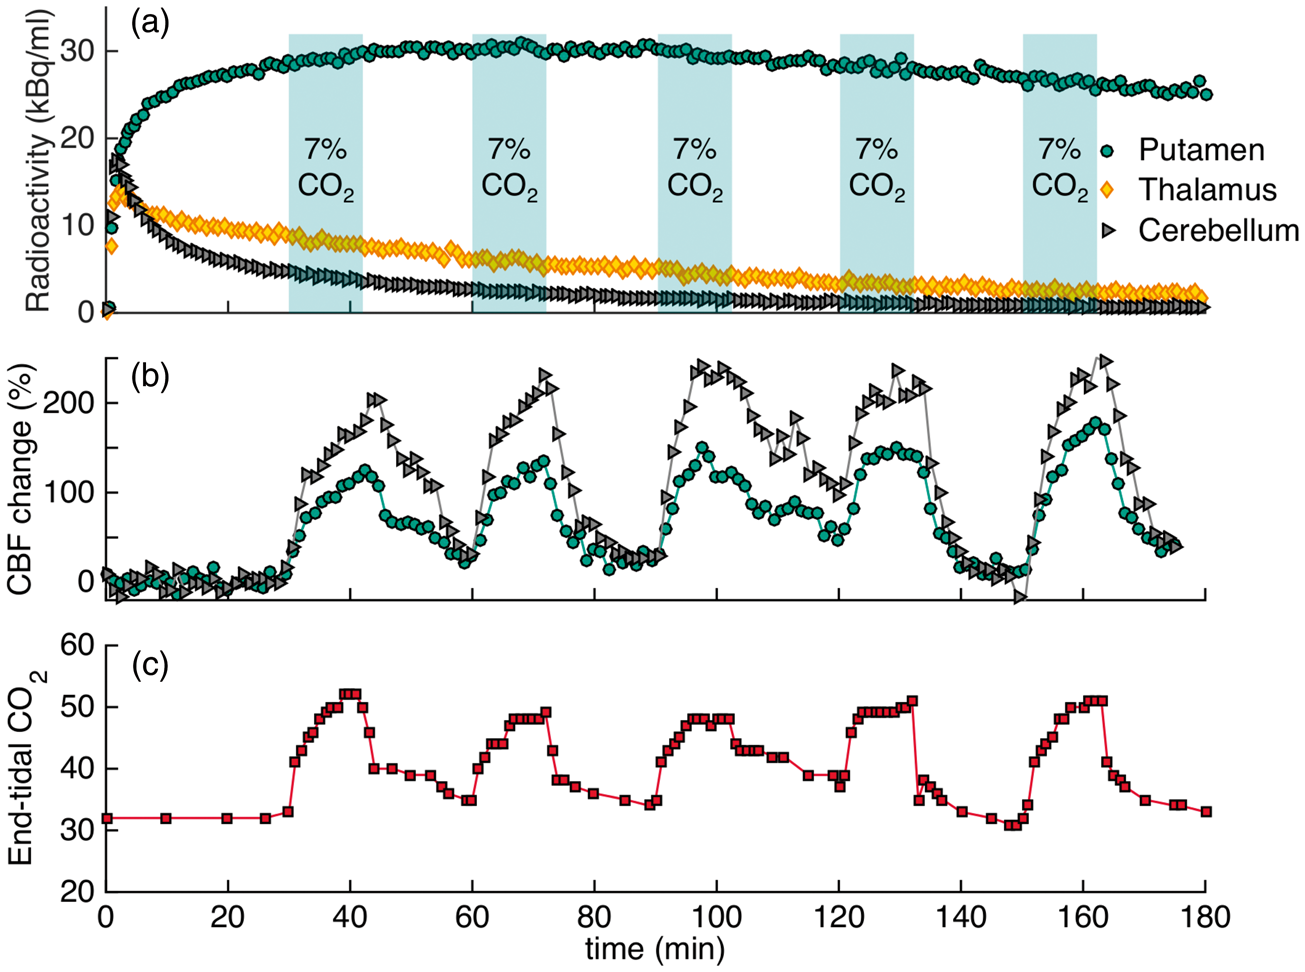
To assess flow effects during radiotracer uptake, the timing of the hypercapnia challenge was altered to start before and persist during injection of the radiotracer in a separate [18F]fallypride experiment (2×CO2, Figure 3). Despite the change in the timing of the challenge, no changes in the shape of the TACs were observed. Changes in flow, measured by pcASL, and etCO2 values measured throughout the timecourse of the experiment are shown in Figure 3(b) and (c). Flow changes corresponded well to the changes observed in etCO2, as shown in the graphs. The flow measurements show that CBF was increased by up to 145% in the putamen during hypercapnia. Average quantitative values in the putamen ranged from 40 ml/100g/min at baseline up to 90 ml/100g/min during hypercapnia. Additional regions of interest and their CBF values are listed in Table 1.
Experimental results from an [18F]fallypride bolus injection and 7% CO2 hypercapnia challenges applied before the start of the experiment to observe flow-induced uptake differences (2×CO2). (a) The shapes of the time activity curves for putamen, thalamus and cerebellum are not affected by hypercapnia (timing of challenge indicated by shaded areas). (b) Measured flow changes with pcASL show large increases in flow during hypercapnia. (c) End-tidal CO2 values for the duration of the experiment.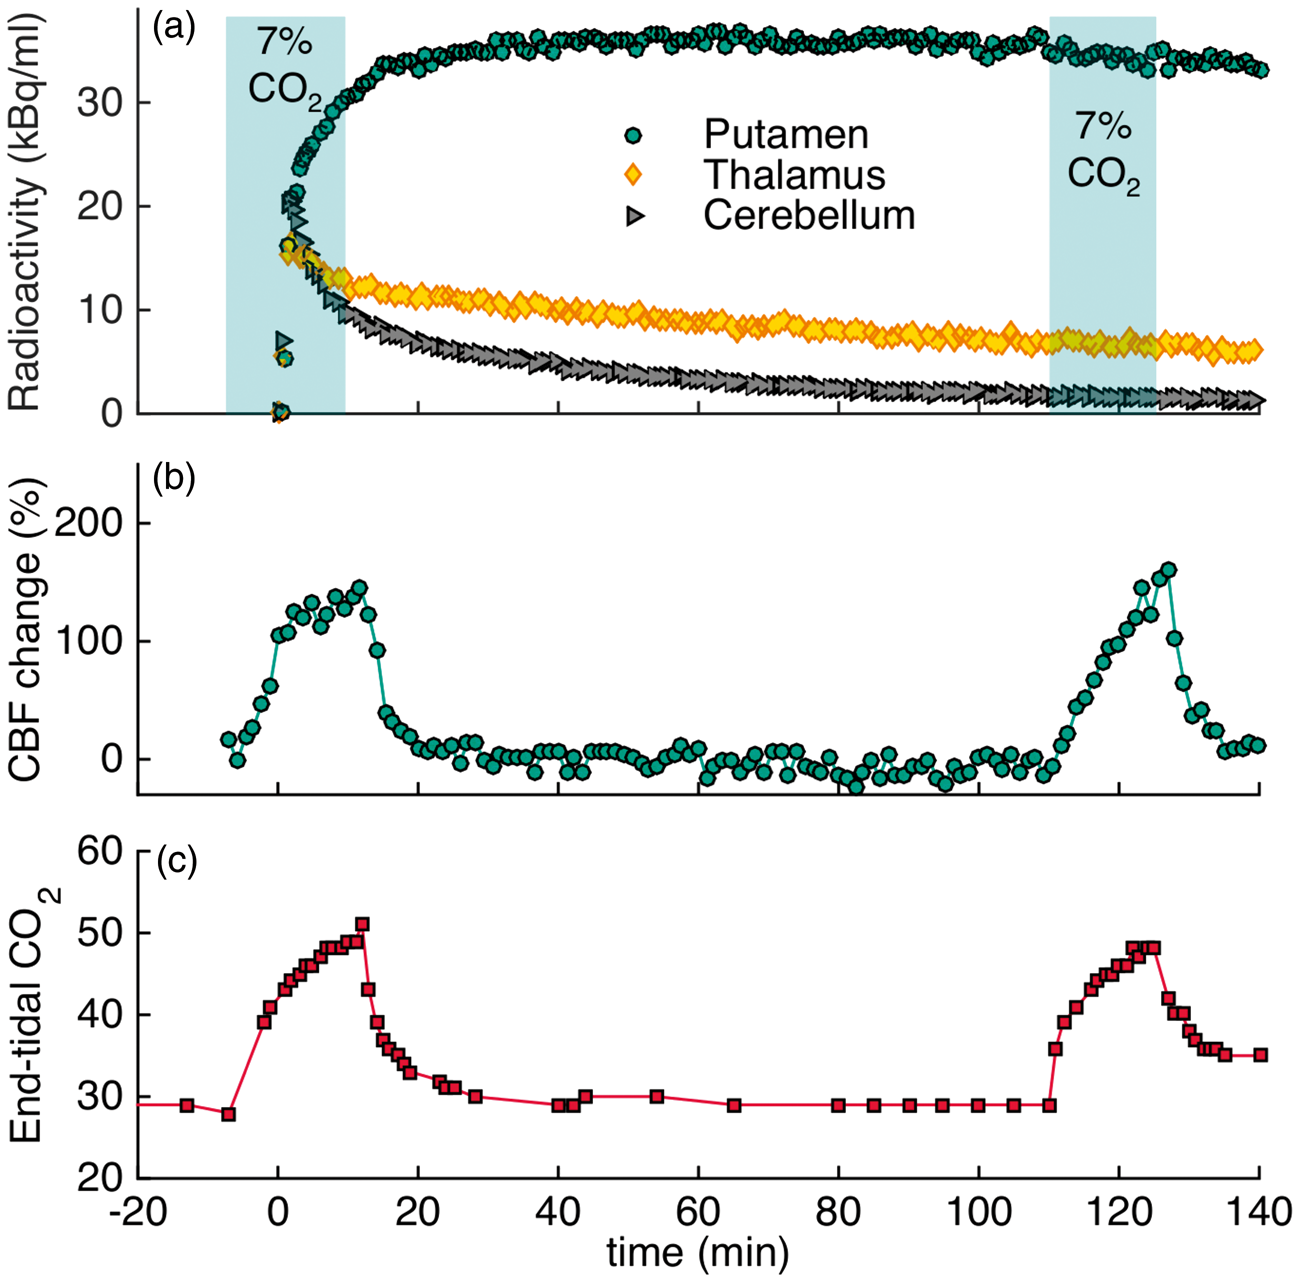
The kinetic modeling results for [18F]fallypride with the SRTM model did not show measurable changes in BPND attributable to flow changes compared to baseline. For a consistent analysis between experiments, all kinetic modeling was employed for taking into account the same scan duration from 0 to 152 min as this was the longest scantime available for one of the experiments. For the 5×CO2 experiment, parameter fits yielded BPND = 15.2 ± 0.6 in the putamen. For the 2×CO2 experiment, we found BPND = 14.4 ± 0.7 in the putamen. A baseline study without any hypercapnia challenges in the same animal gave a BPND of 16.6 ± 0.6 in the putamen. Binding potential values for the full kinetic modeling analysis, including ROIs for thalamus and prefrontal cortex, are listed in Table 2.
The use of a dynamic binding term (time-dependent k2a term) was employed for the 5×CO2 hypercapnia intervals in the [18F]fallypride studies. The resulting DBPND values and the corresponding standard errors for the regions putamen, thalamus and prefrontal cortex are listed in Table 2. The baseline estimate from the first 60 min is underestimating the BPND value compared to the full 152 min in all cases. In addition, the standard errors from the dynamic analysis are at least 30% in all cases. When employing the same analysis for the 5×CO2 session on the baseline and 2×CO2 [18F]fallypride datasets, the errors and underestimation of the baseline were similar, suggesting that the dynamic model itself produces large errors in this setting. Because the 2×CO2 study employed a hypercapnia challenge at the beginning of the TAC, i.e. very early in the scan, it was not possible to reliably use a time-dependent k2a term for that particular experiment.
Figure S1 in Supplementary Materials shows a plot of the TACs from the 5×CO2 and 2×CO2 hypercapnia conditions compared to the baseline [18F]fallypride curve for the putamen and cerebellum. The curves are normalized to their peak values. Compared to the baseline curve, there are only minor differences in uptake and washout. CBF was increased in the 2×CO2 condition at the beginning during the uptake phase but the TAC does not exhibit a different pattern compared to the other two TACs, in which CBF was at baseline during the first 30 min.
Simulation results
We simulated the effect of flow changes on radiotracer kinetics using a full reference tissue compartmental forward model (FRTM) 30 for the radiotracers [11C]raclopride and [18F]fallypride. Simulations that mimicked the ON-OFF design from the experiments were carried out, and analyzed with SRTM. A larger parameter space with different kinetic rates, extraction fractions and CBF changes was also investigated in order to understand the effect of CBF changes on a wider range of radiotracers with varying properties. The full set of assumptions and parameters used for the simulations are described in the Methods section.
Figure 4(a) shows simulated TACs for the radiotracer [11C]raclopride in a specific binding region (e.g. putamen) and for a reference region (e.g. cerebellum). For comparison, a baseline TAC without flow changes is plotted. Changes in the rate constants K1 and k2, corresponding to a doubling of flow starting at 20 min, 40 min and 60 min for a duration of 10 min each, are shown in Figure 4(b). Simulated TACs were analyzed with SRTM in order to evaluate the effect of flow on quantification of binding parameters. While small deviations from the PET baseline curve were observed due to the simulated flow change, a kinetic modeling analysis of the simulated curves with SRTM
26
showed that TACs with simulated flow changes were quantified within <1% error of the true simulated BPND. Figure 4(c) and (d) show the same simulations as in A and B but it is assumed that the k2 parameter stays constant and does not change with flow. If this assumption is made, it can be seen that the TAC with flow changes differs from the baseline. Yet, the changes are relatively small given that flow is assumed to double.
Simulations of a reference tissue model with kinetic parameters for [11C]raclopride. (a) Time activity curves for the PET signal from a specific binding region show very small deviations compared to a baseline PET curve. (b) Timecourse of simulated rate constants K1, k2 with a 100% increase and 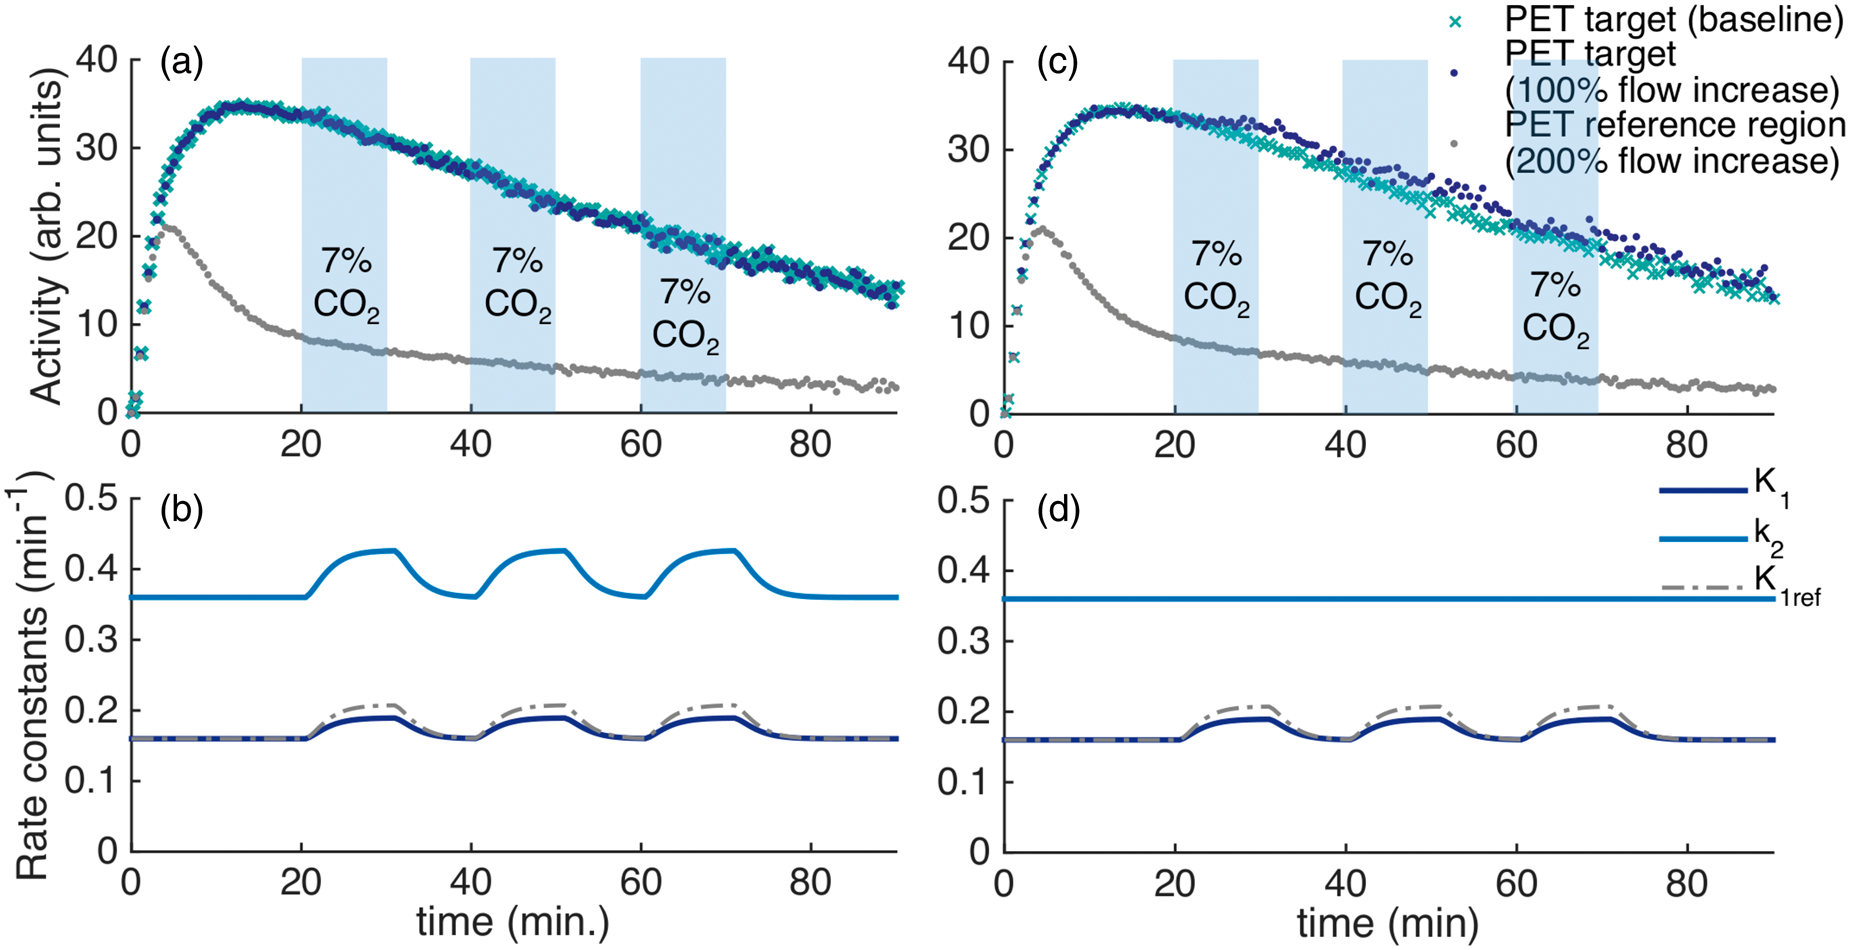
Figure S2 shows simulated TACs for the radiotracer [18F]fallypride in a high specific binding region (e.g. putamen), a low specific binding region (e.g. thalamus) and for a reference region (e.g. cerebellum). The TACs are simulated with an increase in flow with the timing of the (A–B) 5×CO2 and (C–D) 2×CO2 design. Timecourses of the simulated rate constants K1, k2 with a 100% increase and K1ref with a 200% increase in CBF are shown in Figure S2(b) and (d). While the 5×CO2 design does not show changes in the specific binding TACs, the 2×CO2 design shows an increased uptake in the high specific binding region. Quantification of the simulated curves with SRTM resulted in an overestimation of BPND by 5% for the high specific binding region in the 2×CO2 only. All other regions were quantified within <1% of the true simulated BPND value.
To investigate the sensitivity of other radiotracers with varying kinetic properties to changes in blood flow, we simulated the effect of doubling blood flow (100% increase) for a combination of relevant radiotracer parameters. The results are shown in Figure 5(a) and (b), which show the decrease in BPND as a function of K1 through k4. In each plot, two parameters are varied, with the others being held constant at the values listed in the Methods. These results demonstrate that radiotracers with large K1 and small k2 values, i.e. large volume of distribution (VD) values, are most sensitive to changes in blood flow. Yet, even the largest changes deviate by <10% from the true BPND value. The rate constants k3 and k4 do not show a large flow effect change no matter what their values are, i.e. binding potential values do not seem to be a factor for flow sensitivity.
(a, b) Change in BPND due to a doubling in blood flow (100% increase) simulated with the 3×CO2 pattern shown in Figure 4, for a range of K1, k2 and k3, k4 combinations. (a) The plot depicts that radiotracers with large K1 and small k2 values, i.e. large VD (volume of distribution) values, are most sensitive to changes in blood flow. Yet, even the largest changes deviate by <10% from the true BPND value, which is within test-retest values for most radiotracers. (b) The rate constants k3 and k4 show very small changes no matter what their values are, i.e. binding potential values do not seem to be a factor for flow sensitivity. (c) Changes in BPND for a large range of CBF values and different extraction fractions. For CBF increases up to 100%, BPND values are affected by less than 5%, which is well below test-retest values of most radiotracers.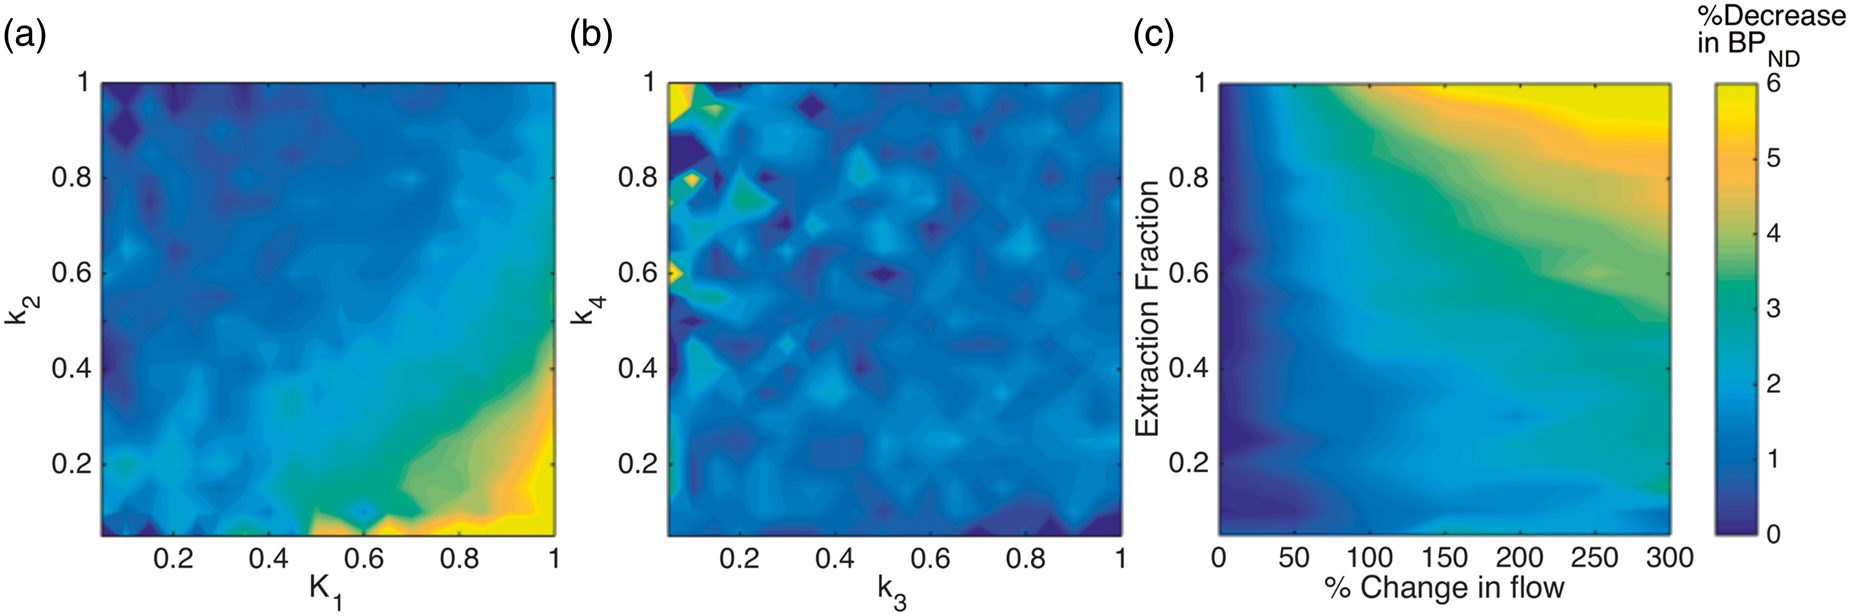
Figure 5(c) shows a plot of the percent decrease in BPND values for an increase in blood flow up to 300% and a varying extraction fraction E. For physiologically relevant increases in flow up to a value of 100% (twice the flow), changes in BPND are < 5% and thus well within test-retest values of PET radiotracers. For radiotracers with extraction fractions less than 0.5, BPND values deviate by < 4% even at large flow changes up to 300%, which are not relevant in most experimental settings. These small deviations are within noise levels and within test-retest values for most PET experiments.
We investigated several assumptions that determine how flow changes affect K1 and extraction fraction E. Figure S3 shows the change in parameters for a range of potential blood flow changes. If K1 only assumes to be related to flow by the Renkin–Crone capillary model, changes in K1 are very small. However, adding in the expansion in surface area due to a volume change increases the change in K1 due to flow. An additional increase in permeability by 20% of the blood flow increase further increases the effect blood flow has on K1, effectively enhancing the effect of the permeability-surface product PS. Since a direct effect of P is not well established, we performed all other simulations assuming a combined effect of PS that is driven by changes in S but not P.
Discussion
In this study, we investigated the effect of increasing blood flow on radiotracer kinetics. By applying hypercapnia challenges in non-human primates, CBF increased up to 2.7-fold in whole-brain. Simultaneous acquisition of dynamic PET data and pcASL with MRI enabled the measurement of radiotracer kinetics together with induced flow changes. For the investigated radiotracers [11C]raclopride and [18F]fallypride, flow changes did not change the shape of the time activity curves or the quantification of binding potentials, independent of the timing of the hypercapnia challenge. Overall, our results suggest that changes in blood flow do not significantly affect specific binding parameters or kinetics of these radiotracers.
[11C]raclopride and [18F]fallypride were chosen as radiotracers in this study due to their differences in extraction fractions, kinetics and affinity, while being specific to the same target (D2/D3 receptors). Raclopride has a fairly low extraction fraction (0.16), 33 whereas fallypride is considered to have a higher extraction fraction (0.4–0.5), 34 higher affinity and slower washout kinetics, which has led to suggestions that it should be more susceptible to blood flow changes. Our result that [11C]raclopride is not sensitive to CBF changes is in agreement with previous simulations1–3 and experimental results, 14 and provides experimental evidence that even extremely large increases in CBF do not affect quantification of binding parameters. This result may help interpret other study results, e.g. in light of our study, CBF is likely not the reason why differences in binding potentials are observed under different anesthesia regimens, 35 even if anesthesia methods can differentially affect CBF. Perhaps more surprisingly, [18F]fallypride did not show measurable sensitivity to CBF increases either, which supports previous theoretical investigations 16 but is in contrast to conclusions from experimental data by Cumming et al. 15 In the latter study, CBF changes were not measured directly, rather, changes in CBF were attributed to the area under the curve from a region of interest in the venous confluence. Our study did not find measurable changes in [18F]fallypride binding with experimentally controlled and determined CBF changes that are much larger than are expected among healthy subjects across a large age range. Hence, our findings suggest that the correlation between the flow metric and [18F]fallypride binding potential by Cumming et al. is not caused by CBF changes.
Hypercapnia challenges were employed because hypercapnia produces large CBF changes that exceed blood flow changes occurring in the brain under many conditions, while also minimally impacting neuronal metabolism
36
and presumably not changing neuroreceptor availability. Our CBF results agree with other studies that reported similar CBF increases using 7% CO2 using either PET or MR measurements, with cerebellum generally showing larger CBF increases compared to cerebral gray matter structures.37–40 PET studies with
Kinetic modeling of PET data was carried out using different models and datapoints in order to quantify potential effects of CBF increases on binding measures. In order to quantify both a baseline BPND value to subsequent flow-affected data in our experimental within-scan challenge design, we investigated the effect of shorter scan durations. Both radiotracers showed lower BPND values and a higher variance. It has previously been shown that shorter scantimes can introduce bias and higher variance in the estimation of BPND41–43 and should be the main reason for our findings, not to be attributed to any flow effects. Using [18F]fallypride, scan times longer than two hours are required to reduce variance in BPND below 5%. 41 This need for very long scan times with [18F]fallypride is likely the reason why the errors associated with a time-dependent term starting at 60 minutes are very large. Our kinetic modeling results suggest that the use of the dynamic analysis may not be as reliable on [18F]fallypride data, although this should be systematically investigated in more detail. For [11C]raclopride, reliable estimates with a variance below 3% are obtained for > 30 min of scantime. 43 Bias of a magnitude similar to expected flow effects are known to occur in kinetic modeling, 44 in particular with SRTM under some conditions. 45 Furthermore, modeling bias can be pronounced when challenges occur very early in scans, such as the early challenges we used to be sensitive to CBF during uptake periods. This likely explains why the modeled changes in binding with [11C]raclopride are much larger with modeled intervals starting at 20 min versus intervals starting at 40 min, as well as the changes observed during non-hypercapnia periods. The choice of an appropriate model and understanding of its biases is thus important, especially when interpreting small changes in binding. Since neither of the analysis methods reliably produced a measurable effect of large CBF increases on binding potential for full or partial TACs, we conclude that CBF does not affect quantification of binding for the two radiotracers investigated.
In this study, we investigated two representative radiotracers but the question of flow sensitivity in other radiotracers remains to be experimentally tested. We thus attempted to generalize results using simulations. The majority of other radiotracers have extraction fractions that lie within the range of [11C]raclopride and [18F]fallypride, and we would expect that similar radiotracers would exhibit negligible sensitivity to CBF changes as well. Experimentally, we have previously shown that infusions of [18F]-FDG are not affected by changes in blood flow 47 – an example of a radiotracer that binds irreversibly to its target and is not blood flow dependent. Our simulations and analysis of flow sensitivity for wide ranges of kinetic parameters K1 through k4 (Figure 5) showed that blood flow is not expected to widely affect specific binding parameters for any combination of values. One of the reasons for this could be that the screening and development process for radioligands selects against flow sensitivity by selecting against non-specific binding.
The primary goal of this study was to investigate how CBF changes, which are known to occur during pharmacological or other functional challenges, influence inferences about specific binding. From fMRI studies 29 based upon CBF, BOLD signal or CBV, 12 we know that flow changes induced by injected drugs can rapidly increase (within minutes) and the timecourse may or may not be correlated with specific binding, depending upon the nature of the drug or stimulus. 46 In PET competition studies, injection of pharmacological challenges can be given before, during or after the radiotracer administration. Consideration of the timing of CBF changes is important because varying parts of the radiotracer curve may be affected differently with kinetic rate constants dominating during update and washout phase. In our experiments, we varied the timing of the challenge in order to address these potential differences. Yet, we did not detect any effects of flow in either scenario on TACs or on radiotracer quantification.
The conclusions from this study are expected to hold for other PET infusion paradigms and measurements. In a separate study, we demonstrated that continuous infusion of [18F]-FDG is not affected by changes in blood flow. 47 With continuous infusion-based methods, steady-state can be reached after an initial equilibration period. 48 In this scenario, flow changes should minimally affect tracer kinetics when blood and tissue concentration are at steady state. In this study, we used the bolus method to maximize flow-sensitivity as a worst-case scenario. Since we did not find that flow affected our measurements, these results should be applicable to continuous infusion, or mixed bolus plus infusion methods as well.
Our simulations assumed that flow alters both K1 and k2 in the same proportion. Our results showed that CBF changes that are within relevant ranges for pharmacological or behavioral challenges (a 50% change in CBF would be considered very large) had no effect on the PET TACs or on the quantification of binding potentials. Very large changes in flow up to 300% are rarely induced through drug or behavioral interventions, but can be reached with hypercapnia. We observed a simulated decrease by up to 4% in BPND compared to baseline with such large CBF changes for radiotracers with an extraction fraction of 0.5 or less, which includes the majority of receptor-specific radiotracers. The magnitude of BPND changes we found due to CBF effects would be considered to be well within test-retest values for most radiotracers.49,50 This is in general agreement with simulation results in the literature that make the same assumptions of how flow affects K1 and k2.1,2 Since our simulations that assume a proportional change in both K1 and k2 (Figure 4(a) and (b)) match our experimental results, this suggests that the proportional change in K1 and k2 represents an accurate model for flow changes. Changing only one of these parameters 3 may not be an accurate model for evaluating effects of CBF changes.
Pharmacological challenges usually produce flow patterns that differ in regions of the brain. Especially when using reference region models 44 for a kinetic analysis in PET, differences in flow between the two regions can potentially affect the estimation of parameters. In the data presented here, we observed differences in flow between the striatal regions (specific binding region) and the cerebellum (reference region), which suggests that the CBF changes we induced are an appropriate model for challenges at neuroreceptors that might act locally. In addition, since we did not observe apparent alterations in the TACs during cycles of modulated flow, our results can be applied even for competition studies, in which only specific regions of the brain are targeted.
It is possible that anesthesia affects the absolute quantification of our study parameters. Yet, a strength of our experimental paradigm is that we specifically used a periodic modulation of hypercapnia and thus CBF. Any change in anesthetic levels that could affect the data would not be expected to be periodic, rather it would be slow-changing. We closely monitored the animals under anesthesia and hypercapnia, which allowed us to observe animal physiology continuously. Since we did not detect changes specifically due to blood flow changes, and the changes induced by hypercapnia were very large, this study conclusion is likely not affected by the anesthetic drugs.
Our study provides experimental and theoretical support for continuing efforts to understand nuances of receptor binding during behavioral 51 or pharmacological challenges17,52 and their relationships to changes in hemodynamic parameters29,53 and functional networks. 54 This study confirms hemodynamic parameters as independent measures from receptor binding in PET studies. Despite previous suggestions in the literature, 15 but in agreement with previous findings from several studies,1,2,16 flow effects on most radiotracers sensitive to neuroreceptors are likely to be a negligible confound for quantification of PET binding parameters.
Conclusions
In summary, we have experimentally investigated the effect of flow changes on neuroreceptor PET radiotracer kinetics using simultaneous measurements of PET and MRI. Even with very large flow changes induced with a hypercapnic challenge, [11C]raclopride and [18F]fallypride TACs did not show measurable changes, indicating that flow does not influence these radiotracers. The flow-insensitivity of the two radiotracers investigated in this study validates a number of previous literature findings. Our findings are important for kinetic modeling approaches and their assumptions on flow. Furthermore, our results show experimental validation of the effect of flow for within-scan challenges and provide a framework for testing the flow effects of other existing or novel radiotracers.
Footnotes
Funding
The author(s) disclosed receipt of the following financial support for the research, authorship, and/or publication of this article: This research was supported by National Institute of Health grants P41EB015896, S10RR026666, S10RR022976, S10RR019933 and S10RR017208.
Acknowledgements
We thank Helen Deng, Judit Sore, Kari Phan, Garima Gantam, Shirley Hsu, Grae Arabasz and Regan Butterfield for their support on radiotracer synthesis and animal setup.
Declaration of conflicting interests
The author(s) declared no potential conflicts of interest with respect to the research, authorship, and/or publication of this article.
Authors' contributions
CYS: Designed study, planned and conducted experiments, analyzed data, performed simulations, interpreted results, wrote manuscript. JBM: Assisted with experiments, data analysis and interpretation, edited manuscript. HYW: Assisted with experiments and data analysis, edited manuscript. CC: Assisted with data reconstruction and analysis, edited manuscript. JMH: Provided radiotracers, assisted with interpretation of results, edited manuscript. BRR: Assisted with study design, interpretation of results, edited manuscript.
References
Supplementary Material
Please find the following supplemental material available below.
For Open Access articles published under a Creative Commons License, all supplemental material carries the same license as the article it is associated with.
For non-Open Access articles published, all supplemental material carries a non-exclusive license, and permission requests for re-use of supplemental material or any part of supplemental material shall be sent directly to the copyright owner as specified in the copyright notice associated with the article.