
Abstract
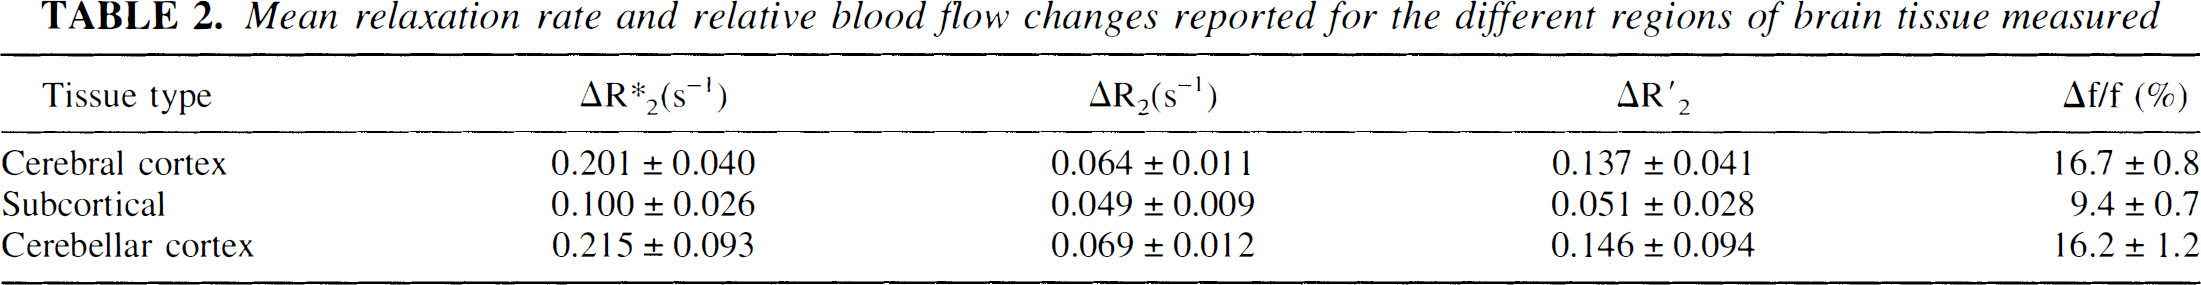
Spin-echo and gradient-echo echoplanar functional magnetic resonance imaging (fMRI) studies at 1.5 Tesla (T) were used to obtain blood oxygenation level-dependent (BOLD) contrast images of the whole brain in seven strongly right-handed women during execution of a complex motor task. Five subjects underwent subsequent H215O positron emission tomography (PET) studies while performing the same task. Group-averaged results for changes in the MRI relaxation rates R2* and R2 at 1.5T in response to neuronal activation in nine cortical, subcortical, and cerebellar motor regions are reported. Results for each method are grouped according to tissue type—cerebral cortex (precentral gyrus and supplementary motor area), subcortical regions (thalamus and putamen), and cerebellar cortex (superior lobule). The observed changes in R2* from activation-induced oxygenation changes were more variable across brain regions with different tissue characteristics than observed changes in R2. The ratio of ΔR2* to ΔR2 was 3.3 ± 0.9 for cerebral cortex and 2.0 ± 0.6 for subcortical tissue. ΔR2*, ΔR2, and relative blood flow changes were ΔR2* = −0.201 ± 0.040 s−1, ΔR2 = −0.064 ± 0.011 s−1, and Δf/f = 16.7 ± 0.8% in the cerebral cortex; ΔR2* = −0.100 ± 0.026 s−1, ΔR2 = −0.049 ± 0.009 s−1, and Δf/f = 9.4 ± 0.7% in the subcortical regions; and ΔR2* = −0.215 ± 0.093 s−1, ΔR2 = −0.069 ± 0.012 s−1, and Δf/f = 16.2 ± 1.2% in the cerebellar cortex.
Keywords
Several models for endogenous blood oxygenation level-dependent (BOLD) contrast on T2- or T2*-weighted magnetic resonance (MR) acquisitions have been proposed (Ogawa et al., 1993; Boxerman et al., 1995a; Hathout et al., 1995; Buxton and Frank, 1997; Buxton et al., 1998; van Zijl et al., 1998). These models suggest that BOLD contrast depends on tissue blood volume fraction, metabolic rate of oxygen, cerebral blood flow, hematocrit, capillary, and venous oxygenation state. Recent studies have suggested that highly mobile protons within the cerebrospinal fluid (CSF) of cortical regions may account for a large portion of the BOLD signal observed during T2*-weighted functional magnetic resonance imaging (fMRI) experiments. The current study applied novel image analysis methods to whole brain BOLD gradient-echo (GE) echoplanar imaging (EPI) fMRI, BOLD spin-echo (SE) EPI fMRI, and blood flow positron emission tomography (PET) imaging. The goal was to determine the contribution to BOLD contrast from T2 relaxation, T2* relaxation, and blood flow in the varying tissue environments of the cerebral cortex, cerebellar cortex, and subcortical regions.
Regional cerebral blood flow changes in response to neuronal activation have been well documented, however, relatively few experiments have been performed using a consistent paradigm to measure intrasubject blood flow change and BOLD signal change. All of these experiments used variations of arterial spin tagging methods to quantify cortical blood flow changes (Kruger et al., 1996; Kim and Ugurbil, 1997; Buxton et al., 1998). These methods are not capable of whole brain evaluation (Edelman et al., 1994; Kim and Tsekos, 1997). Although a few investigators have compared BOLD fMRI signal changes to blood flow in the whole brain using H215O positron emission tomography (PET) (Ramsey et al., 1996; Rees et al., 1997; Kinahan and Noll, 1999), these studies focused on a few selected cortical regions. Therefore, the relation of BOLD signal change to blood flow within subcortical regions remains unclear.
Studies quantifying the BOLD effect in vivo have also focused exclusively on cortical brain regions. Unfortunately, presently available fMRI methods for evaluating cortex not only image the desired area of cortical brain but also inevitably include CSF-filled spaces and large venous drainage systems in the cortical sulci. Based on the large apparent diffusion coefficient value associated with protons contributing to the BOLD effect at 1.5T, Song et al. (1996) concluded that the majority of T2* change from neuronal activation originates from sources other than brain cortex. In contrast, subcortical regions like the putamen do not have a large adjacent venous drainage system, nor do they contain the abundance of highly mobile protons seen in cortical sulci. Therefore, it is reasonable to expect that BOLD contrast may differ significantly between cortical and subcortical regions. Quantification of the relative contributions to BOLD contrast in cortical and subcortical regional environments is necessary to predict the expected signal changes for whole brain fMRI experiments.
The purpose of the current study was threefold: (1) to provide experimental evidence for the dependence of BOLD signal change on the details of tissue environment; (2) to quantify expected T2 and T2* relaxation time changes in cerebral cortex, subcortical regions, and cerebellar cortex to predict expected nuclear magnetic resonance (NMR) signal changes in whole brain fMRI experiments; and (3) to relate T2 and T2* relaxation time changes to relative blood flow changes secondary to neuronal activation.
MATERIALS AND METHODS
Seven healthy right-handed (score > 80; Edinburgh Inventory;Oldfield, 1971) adult women (age 21 to 34 years, mean 26 years) provided written informed consent for a protocol approved by the local Institutional Review Board.
Data acquisition
Paradigm durations give the necessary statistical power for sensitivity to the small baseline NMR signal changes expected from subcortical BOLD T2 and T2* changes. The activation-induced NMR signal changes observed in subcortical structures are expected to be up to five times smaller than cortical signal changes—0.2% to 0.4% at 1.5T (Lowe et al., 1998). For the same cortical regions, the SE signal change can be 20% to 40% less than the GE signal change (Bandettini et al., 1994; Lowe et al., 1998). Therefore, the SE-EPI paradigm must be longer than the GE-EPI paradigm to achieve approximately equivalent statistical power.
All fMRI paradigms followed a 36-second off/36-second on cyclic pattern, giving a 16-image off/16-image on boxcar reference function for expected activation patterns. The epoch length and repetition time ensured that there was a minimal effect of the hemodynamic rise-to-peak on the measurement of the fMRI signal change. Fig. 1 illustrates that there was no observable measurement of the ramp-up of the BOLD signal. A single complete scan for the SE-EPI lasted 648 seconds and consisted of 8½ rest/activation cycles preceded and followed by a quarter cycle of rest. A single complete scan for the GE-EPI lasted 360 seconds and consisted of 4½ rest/activation cycles preceded and followed by a quarter cycle of rest. Given the noise characteristics of this system, a single pixel with an activation paradigm-correlated signal change of 0.2% would have a mean Student's t value of 2.0.
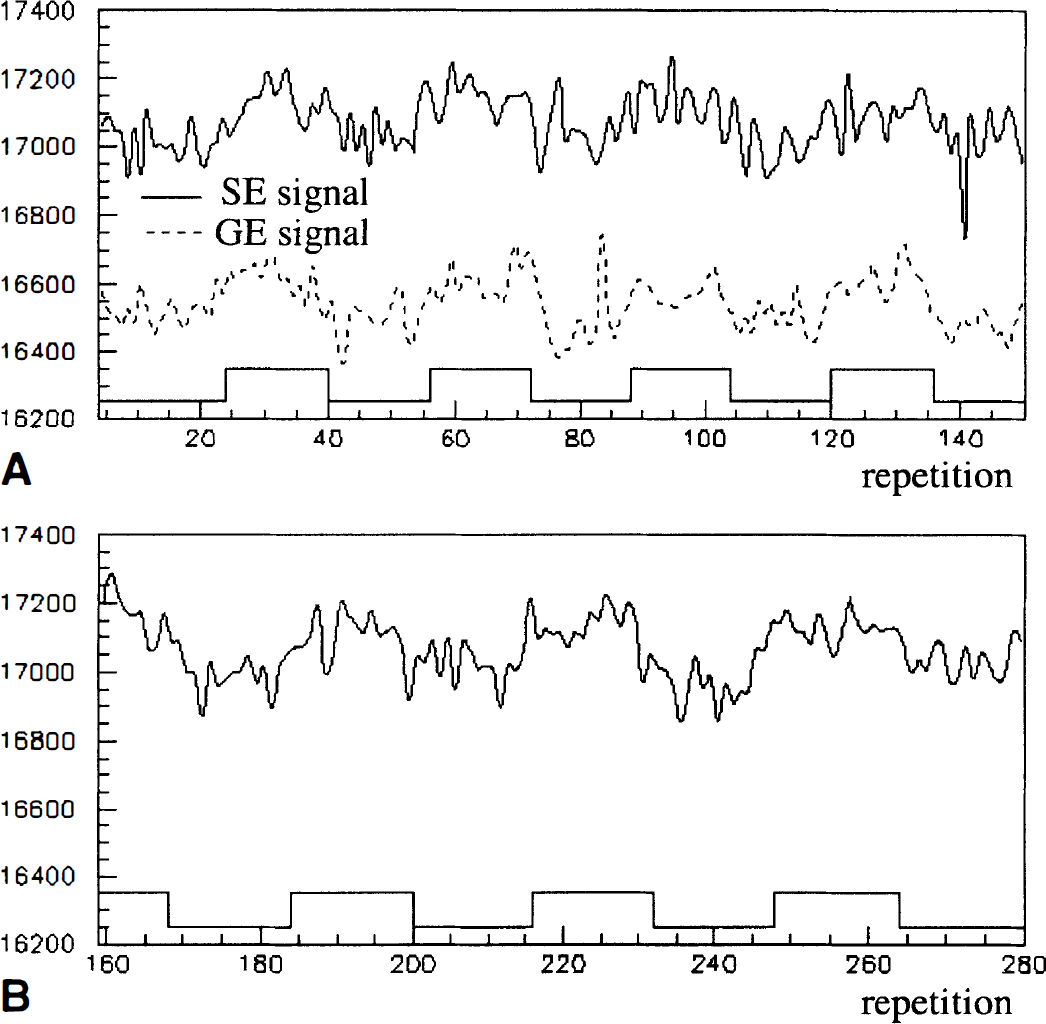
Timeseries for spin-echo echoplanar imaging (SE-EPI; solid line) and gradient-echo echoplanar imaging (GE-EPI; dashed line) signal from a pixel in primary motor cortex for one subject. The timing of tapping–rest is shown with the boxcar function overlay.
Each subject performed 4 paradigms in 1 imaging session, 2 SE followed by 2 GE paradigms, or reversed, with the order randomized across subjects. Subjects were positioned supine on the MRI table with a cloth covering their eyes. Their hands rested on their lower abdomen with the five sets of corresponding digit pads in gentle contact. Subjects remained motionless in this position during the control period. An auditory stimulus instructed the subject to begin tapping corresponding finger pads together in the following sequence: thumb, middle, pinky, index, ring. Subjects repeated this sequence until given an auditory instruction to stop. Subjects were instructed to tap as quickly as possible without making mistakes and were cautioned to make small movements of the fingers to limit head motion. Subjects practiced the task briefly to ensure that they understood instructions and could perform the task before placement in the scanner. During the training session, it was verified that all subjects were able to tap the sequence rapidly enough such that each finger was moved at a rate that was fast compared with an assumed hemodynamic rise time of several seconds.
For each subject, 31 contiguous axial slices were acquired over 90 seconds after each of 8 injections of 50 mCi H215O into the right cubital vein at 15-minute intervals. The subject rested during four scans. For the other four scans, the subject continuously performed the fMRI finger tapping paradigm, with the injection given 10 seconds after the subject began. Resting scans were interleaved with tapping scans.
Data analysis
The MRI time series at each pixel was fit using the least-squares method described in Lowe and Russell (1999), giving each pixel a Student's t value, from which activation maps were generated. This fit gave the amplitude (A) of activation-related signal change and baseline intensity (BI), with the relative signal change S = A/BI. Individual whole brain statistical and relative signal change maps were interpolated to 256 × 256 × 256 cubic voxels (0.9375 mm/side).
The signal change from BOLD effects depends on echo time. Assuming the signal to be largely because of transverse relaxation, the signal change becomes a mono-exponential function of echo time. The authors calculated the associated relaxation time change from
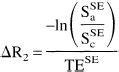
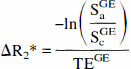
where Sa and Sc refer to the NMR signal in the active and control states, respectively. Superscripts denote the acquisition method. Sa/Sc can be calculated using Sa/Sc = 1 + S, where S = A/BI, as defined above. Maps of changes in R2 and R2* were produced from each subject's percentage activation maps for all of the studies.
Individual whole brain fMRI statistical and relative signal change maps and relative PET blood flow change maps were transformed into Talairach space (Talairach and Tournoux, 1988) using anatomic landmarks from the SPGR scan. Using Stimulate (Strupp, 1996), regions of interest (ROIs) were drawn in nine motor areas using one subject's Talairach-transformed SPGR scan and were then used in all subjects. Each ROI (Fig. 2) was chosen based on anatomy and Talairach coordinate and had anatomically appropriate dimensions (Table 1). Regions of interest were chosen bilaterally in precentral gyrus (PRECG), putamen, thalamus, and superior lobule of the cerebellum and one centered in the midline to include both supplementary motor areas. These regions are involved in complex motor task performance (Alexander et al., 1986).
Approximate Talairach coordinates and volumes of each region of interest
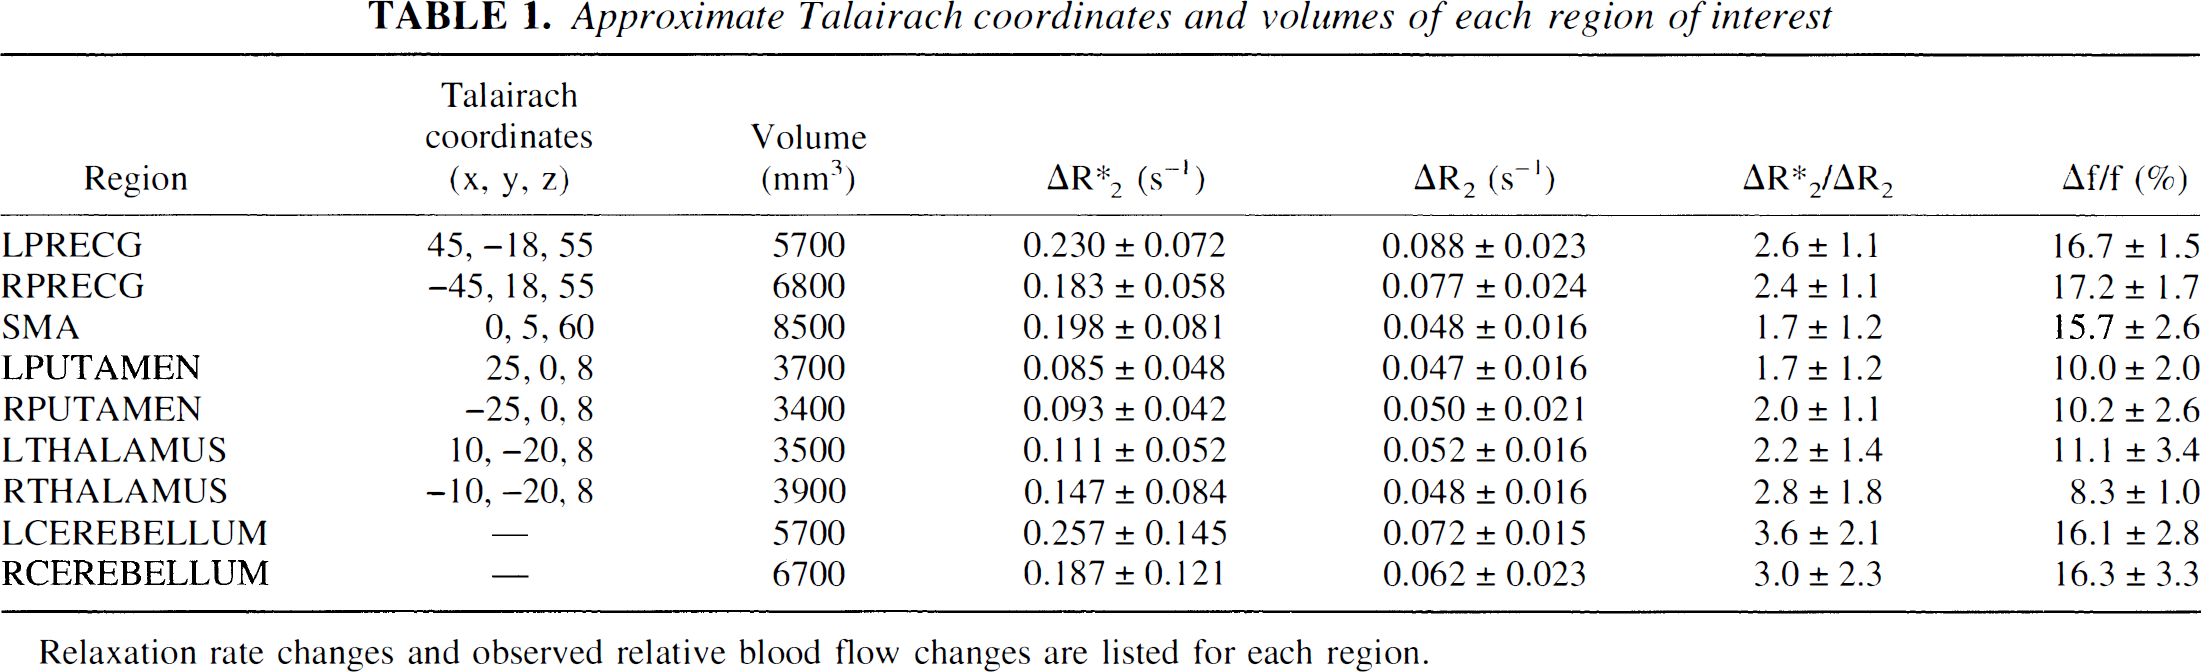
Relaxation rate changes and observed relative blood flow changes are listed for each region.
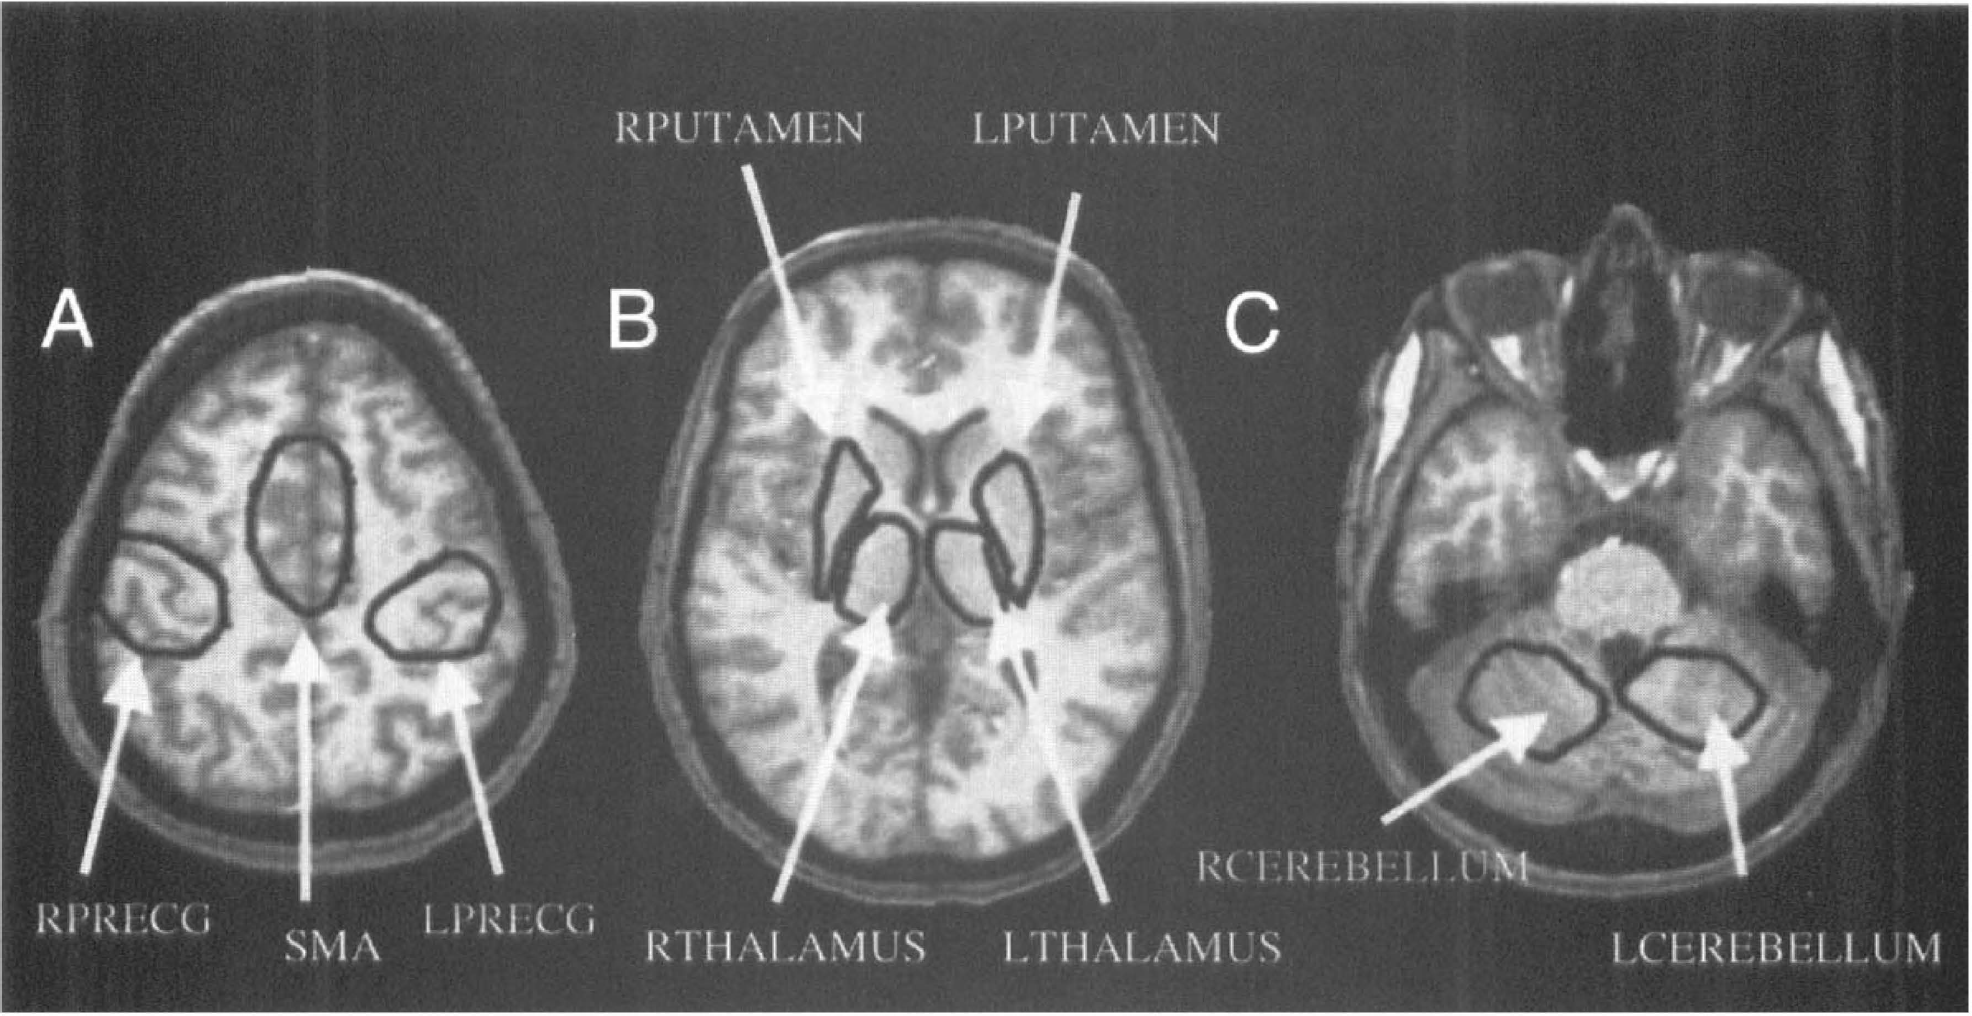
Regions of interest (ROIs) selected in nine regions along the motor pathway from
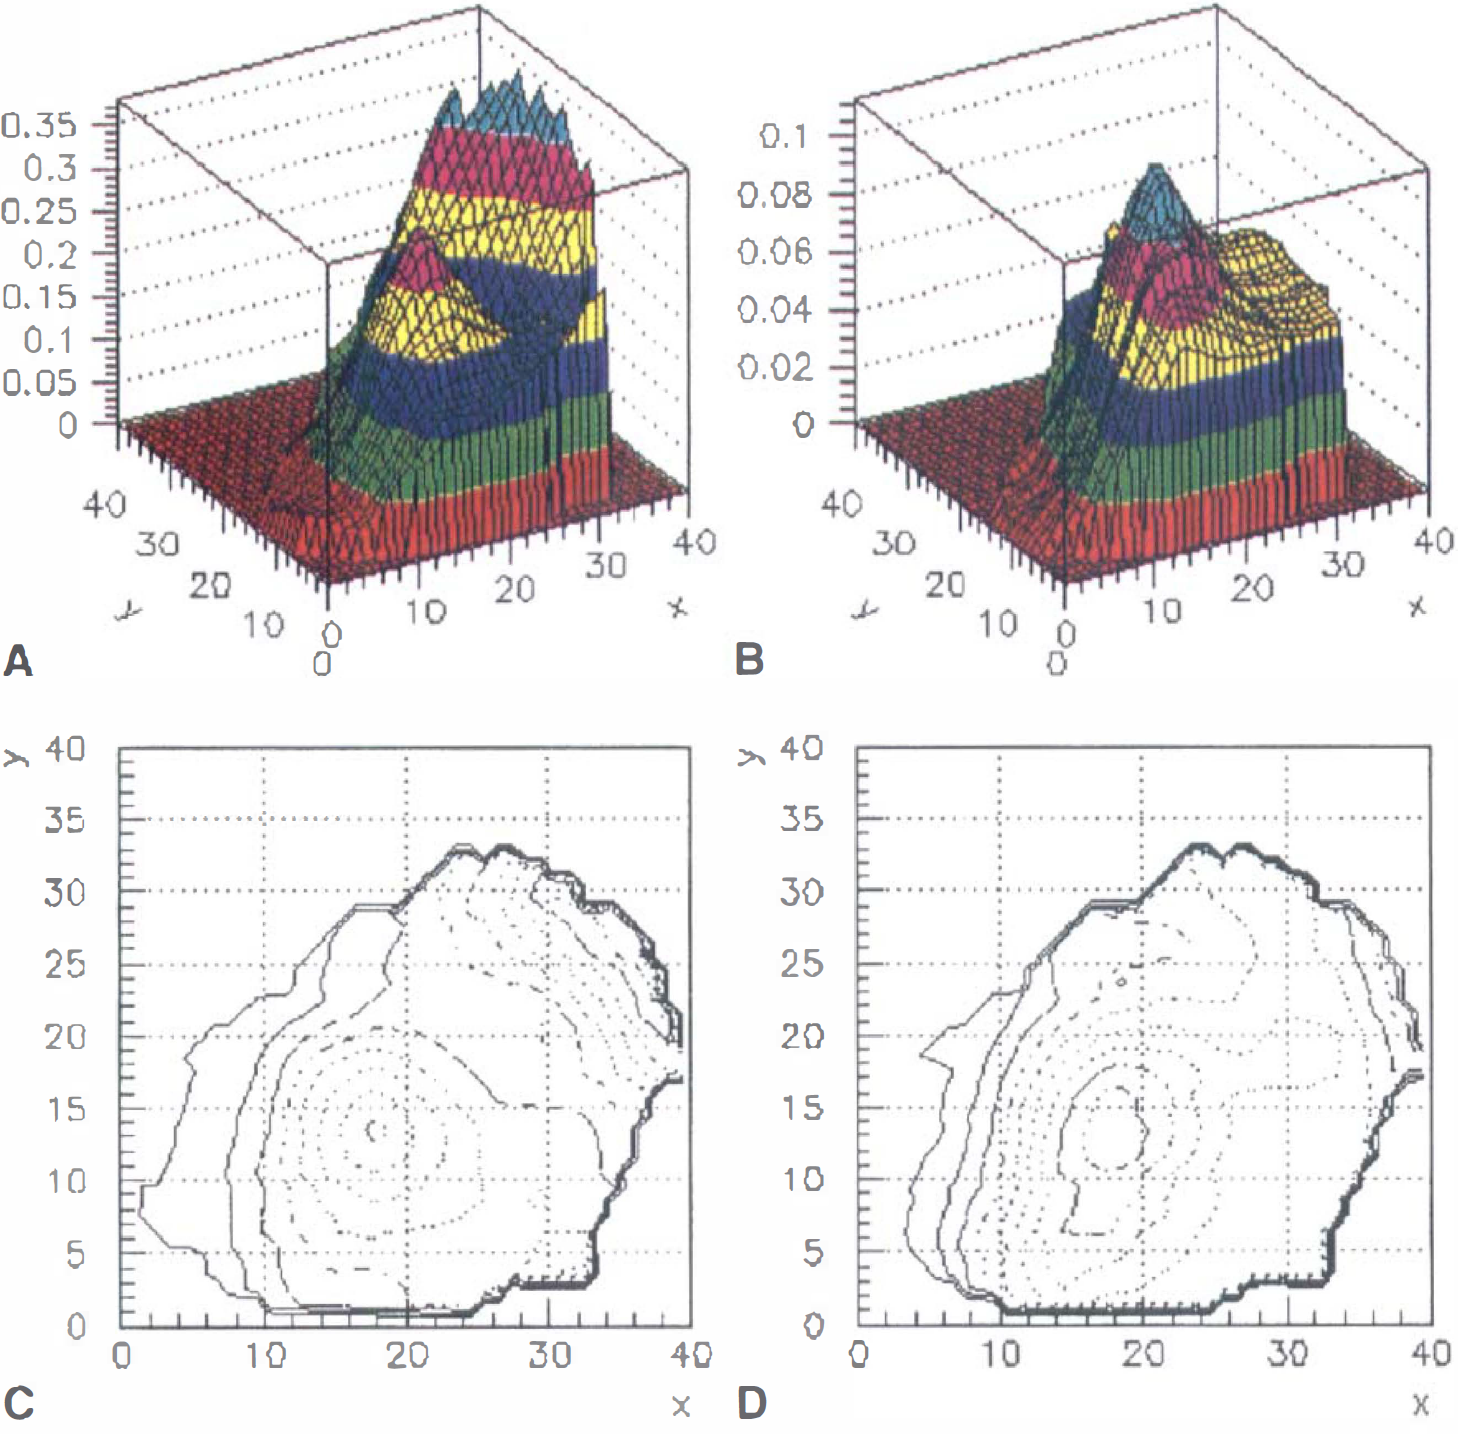
Surface maps of the
The authors used a three-dimensional cluster analysis within each ROI to determine the presence of a signal. A cluster is defined as all spatially contiguous pixels above a single-pixel confidence level of c, which was 0.95 in the current study. The significance of a detected cluster depends on cluster size and c (Forman et al., 1995). As shown in Figs. 3 and 4, estimation of the observed signal change was performed by graphically analyzing the signal intensity surfaces and contour plots for each cluster.
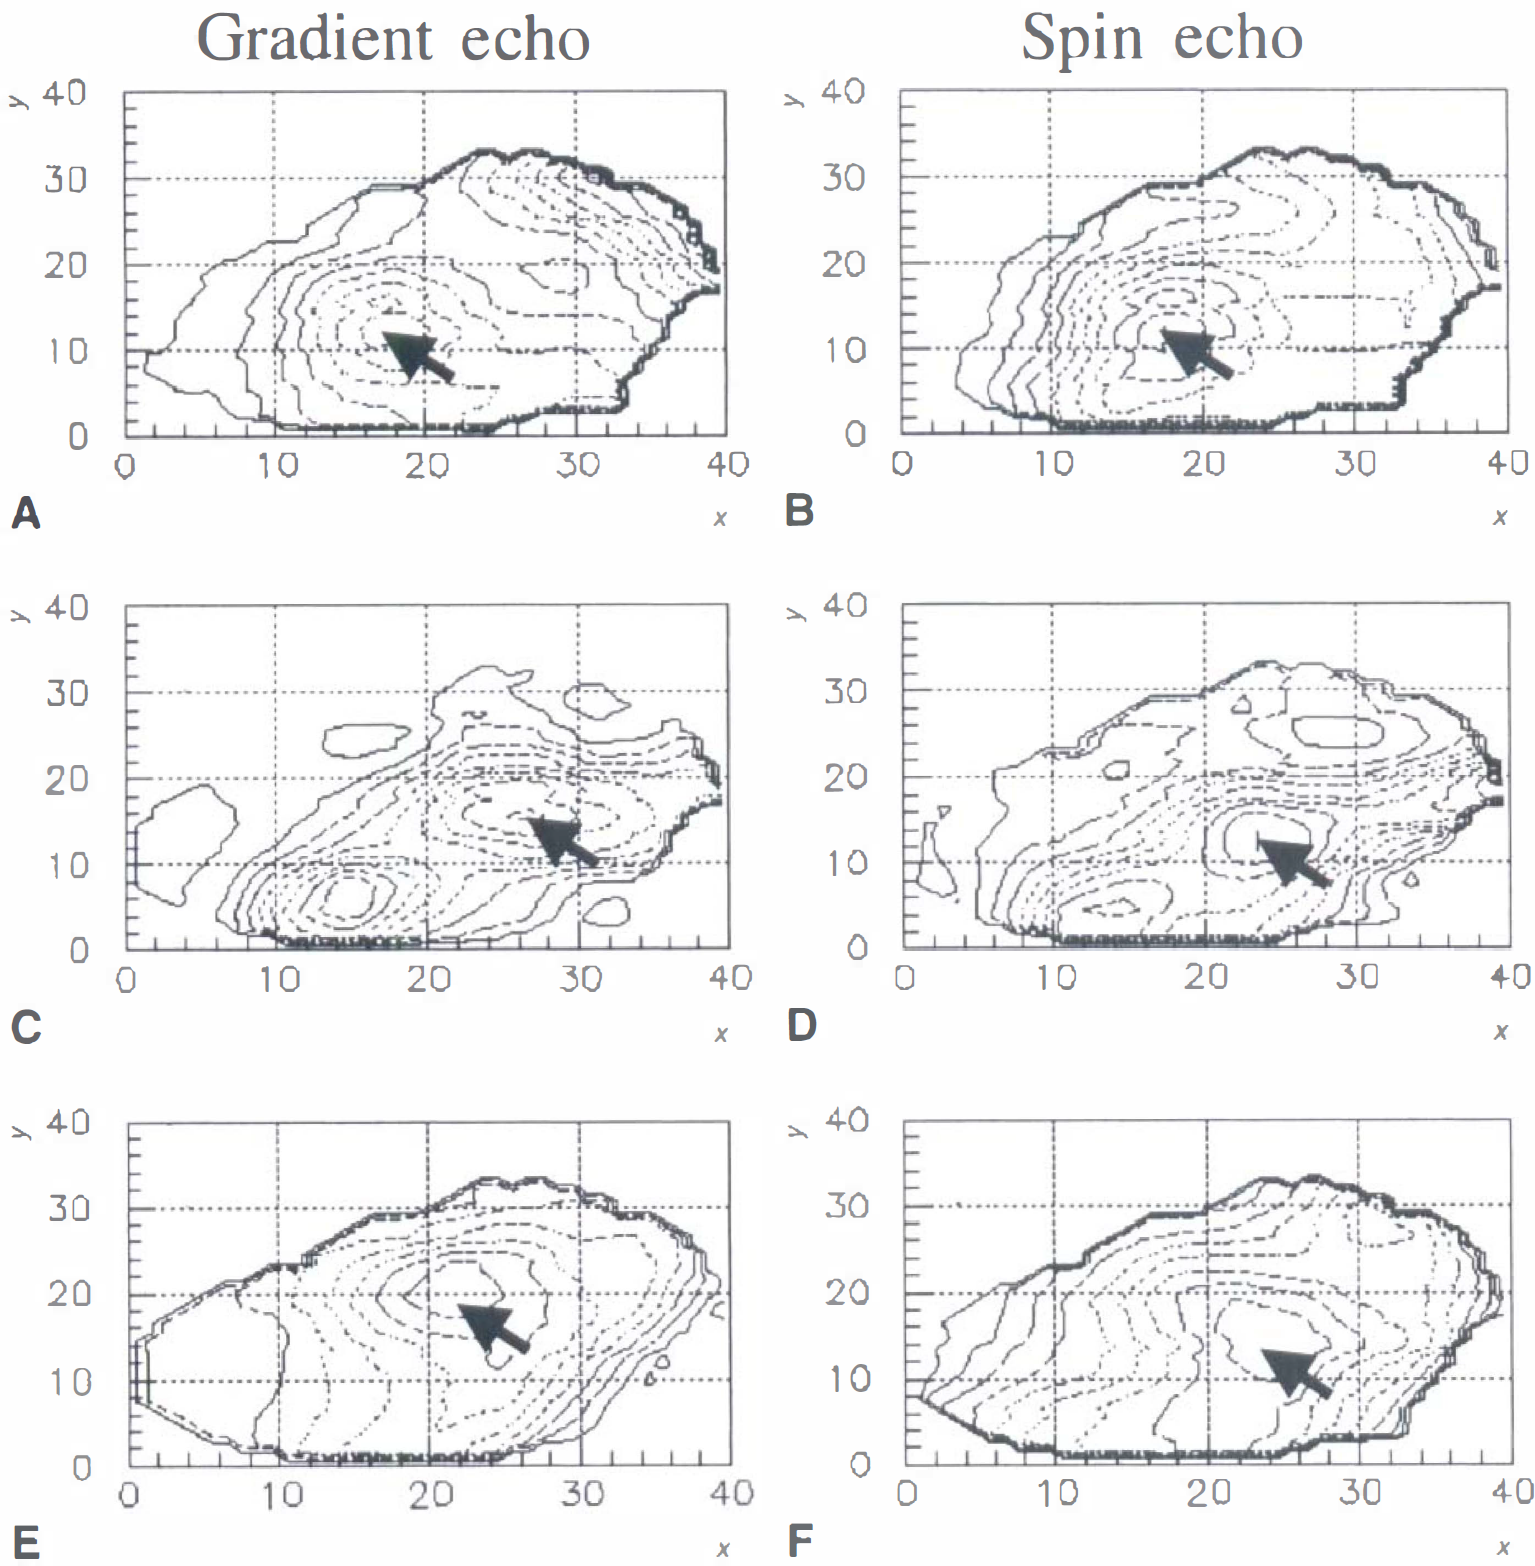
Contour maps of ΔR2*
These surfaces were smooth (Figs. 3 and 4), consistent with the spatial resolution of the fMRI data and an estimated 3.5 mm capillary point-spread function of the T2* response (Engel et al., 1997). There was good spatial correspondence between activation peaks from the GE and SE scans within ROIs. The peak pixel was chosen graphically for each subject/ROI/acquisition combination. This method gives an unbiased estimate of the BOLD signal independently from the experiment-dependent relation between single pixel Student's t value and signal intensity. This signal estimator is used to compare R2* and R2 changes. A similar graphical method can estimate the relative blood flow change in each ROI of the PET data (Fig. 5). The interpolated PET volume data are smooth because the resolution of the original reconstructed blood flow images is ∼8 mm FWHM.
RESULTS
Comparison of GE-EPI to SE-EPI
A possible concern in the authors' measurement of GE fMRI signal change and SE fMRI signal change relates to the difference in the duration of their scans to make these measurements. Subjects executed each SE fMRI scan for almost twice as long as each GE fMRI scan. Habituation effects have been observed in some motor tasks (Toni et al., 1998), which could lead to a bias in the authors' comparison of measured T2 and T2* relaxation times. Fig. 1 shows a typical complete timeseries for a SE-fMRI scan (solid line) and a GE-fMRI scan. The amplitude change did not systematically reduce in the later tapping epochs as compared with earlier epochs. To verify this further, the authors compared the amplitude measured in the first SE scan with the second SE scan and found no systematic effect.
Clusters were found in all ROIs for all subjects. Although the true significance was not easily calculable because of the interpolated nature of the transformed data, the smallest detected cluster in the fMRI data had 2200 pixels (corresponding to approximately 16 pixels before the 4 × 4 × 9 interpolation required to produce the final 256 × 256 × 256 isotropic maps). Through Monte-Carlo calculations, the authors determined this to have a confidence level greater than 99.5%. Assuming isotropy of the signal, this corresponds to a signal of spatial extent ∼8 mm, more than twice the inplane resolution and comparable to the through plane resolution of the fMRI data. As this is the smallest detected cluster, the authors concluded that their fMRI signal estimator had at most a minor bias from partial volume effects.
Mean R2 and R2* changes determined from the graphic analysis are reported in Fig 6. The error bars reflect the standard deviation of the values determined across the six subjects. The measured ratio of average ΔR2* to ΔR2 in primary motor cortex (LPRECG) is 2.6 ± 1.1, which is in agreement with previous measures of this ratio of 2.5–4. Table 1 shows this ratio for all measured brain regions.
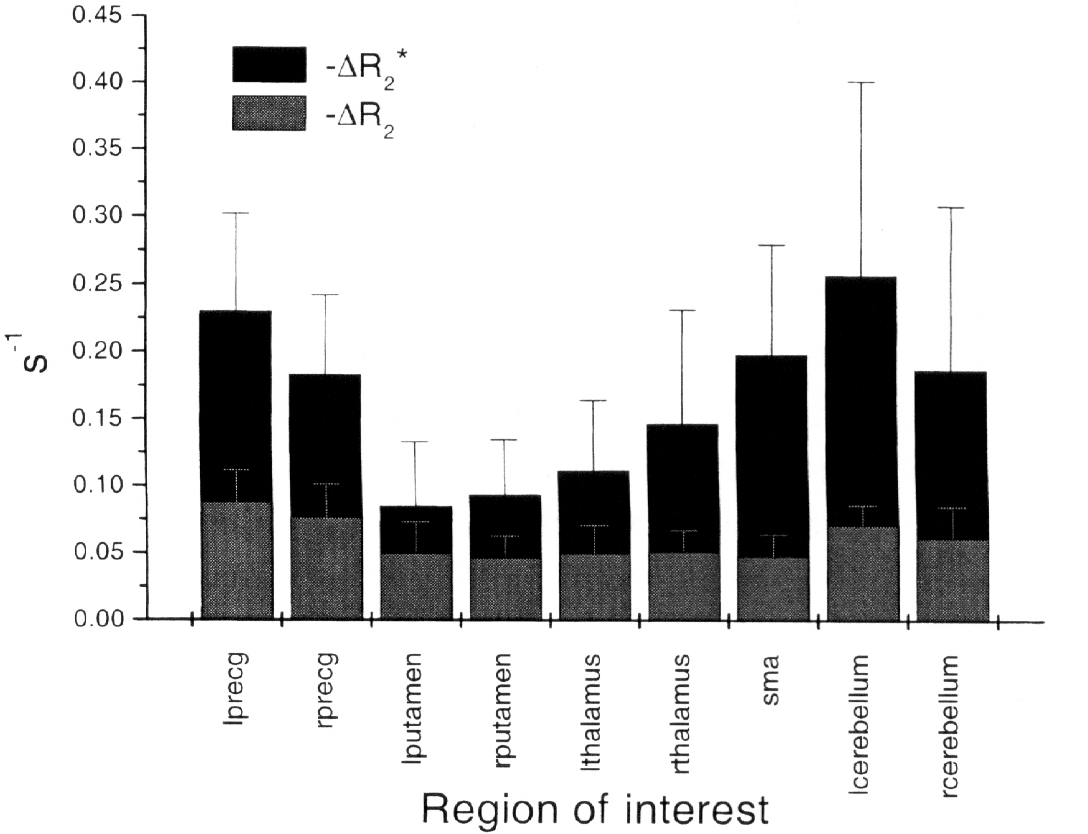
Measured ΔR2* and ΔR2 values from each of the nine regions of interest (ROIs) listed in Table 1. Plotted values are the arithmetic average of the mean of the pixels in the largest cluster in each subject for the given ROI. Error is calculated as the root-mean-square of the average and can be taken as a reflection of the variation in mean R2* or R2 change across studies.
To infer dependence on vascularization, the authors grouped their measurements of relaxation time changes according to cerebral cortical, subcortical, and cerebellar regions. Examination of Fig. 6 shows that the LPRECG, RPRECG, and supplementary motor area ΔR2* and ΔR2 values are all within one standard deviation.1 Therefore, the authors calculated a weighted mean from the values from these regions. The authors termed the combined measurement “cortex”; likewise for LPUTAMEN, RPUTAMEN, LTHALAMUS, and RTHALAMUS, which the authors grouped into “subcortical” tissue and LCEREBELLUM and RCEREBELLUM, which the authors grouped into “cerebellar” tissue. Table 2 lists the resulting ΔR2* and ΔR2 values for these regions.
Mean relaxation rate and relative blood flow changes reported for the different regions of brain tissue measured
PET results
Dosage restrictions for radiation exposure limit each subject's PET study to eight 50 mCi injections. This limits the statistical significance that can be obtained from a single subject subtraction analysis. However, the smallest detected cluster in any of the motor pathway ROIs had a size of 100. The authors estimated this to have a confidence level greater than 95%. The small extent of some of the observed PET signals resulted in a possible bias to this estimator from partial volume effects.
Mean relative blood flow changes determined from the graphic analysis of the PET image data are reported in Fig. 7. Error bars reflect the standard deviation of the intersubject differences, as for the fMRI measurements.
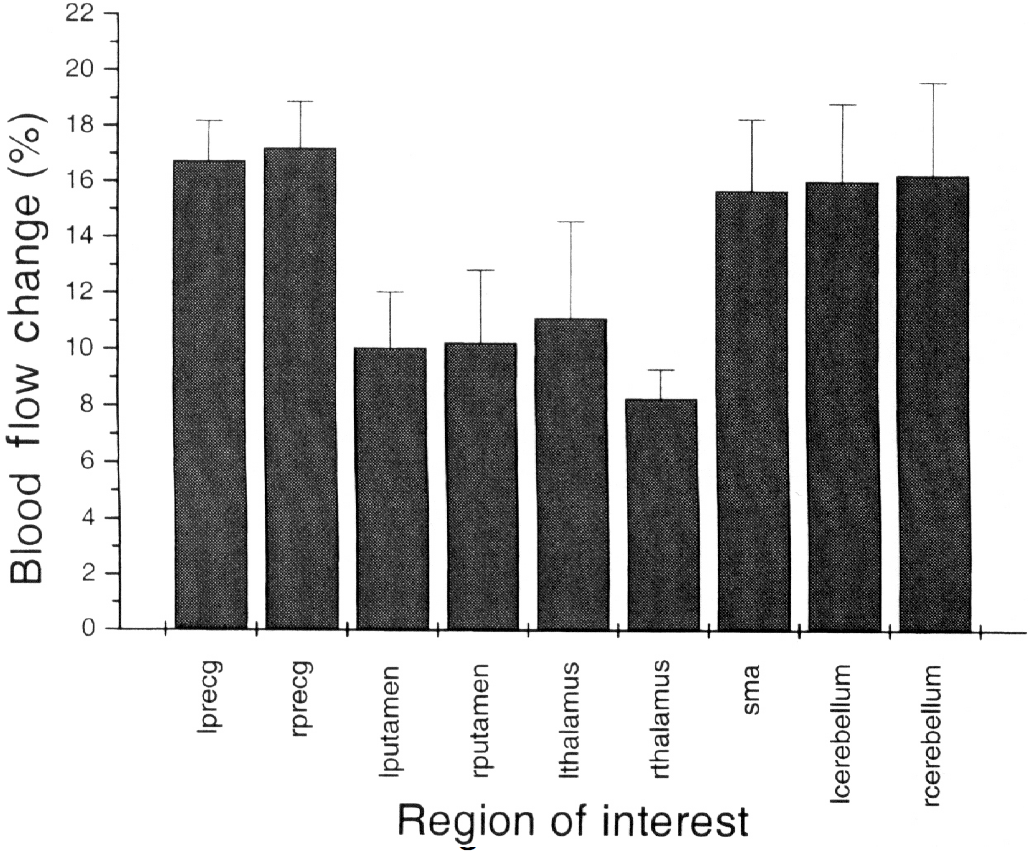
Measured blood flow change values from each of the nine regions of interest (ROIs) listed in Table 1. Plotted values are the arithmetic average of the mean of the pixels in the largest cluster in each subject for the given ROI. Error is calculated as the root-mean-square of the average and can be taken as a reflection of the variation in mean blood flow change across studies.
Grouping the measurements according to tissue type, as was done with the fMRI data, results in the blood flow change values presented in Table 2. Fig. 8 is a plot of ΔR2* and ΔR2 versus percentage blood flow change, illustrating the larger dependence of ΔR2* on blood flow change.
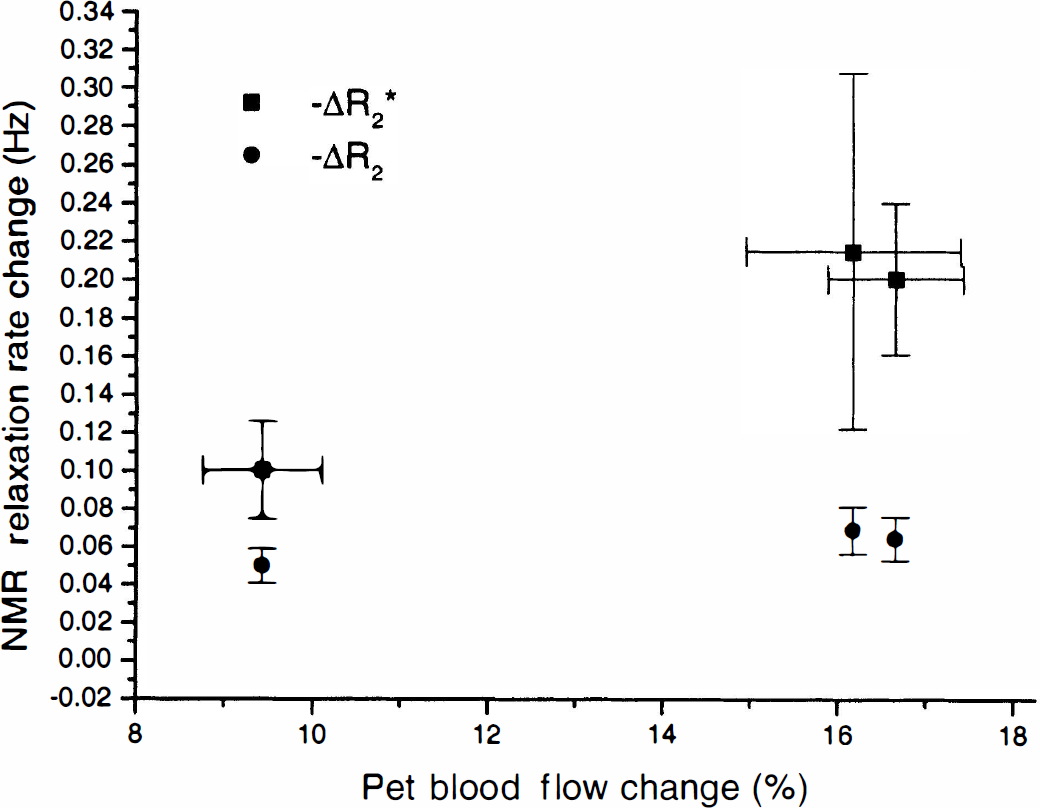
Observed mean blood oxygen level-dependent relaxation rate changes as a function of blood flow change for R2* and R2.
DISCUSSION
Whole brain results
Subcortical activation detected with fMRI techniques at 1.5T have been limited to single or few slice GE fMRI acquisitions focusing on the subcortical ROIs (Bucher et al., 1995; Irwin et al., 1996; Buchel et al., 1997). An exception is the recent study of whole brain activation patterns during a thumb flexion-extension paradigm using GE fMRI (Reichenbach et al., 1998). The authors report approximate signal levels between primary motor cortex, basal ganglia, and cerebellum, but stopped short of systematically quantifying the measured signal changes across subjects. Rao et al. (1997) also observed basal ganglia activation in whole brain GE fMRI during motor task performance in a subset of subjects studied, but no quantification of observed signal changes was made.
The issue of uniformity of sensitivity and specificity is a critical one when performing hypothesis-driven research in whole brain functional neuroimaging. Even simple tasks performed by human subjects can involve extensive networks of neurons, distributed across the cerebrum and cerebellum. The use of techniques that allow hypotheses to be adequately tested on the entire brain is essential to the identification of these networks. The information presented here will allow experimenters to predict expected signal levels to design experiment protocols with appropriate sensitivity.
Variation of ΔR2*, ΔR2, and blood flow change
The authors observed peak values of ΔR2* of −0.03 to −0.5 s−1 and ΔR2 of −0.03 to −0.11 s−1, in agreement with previous measurements (Bandettini et al., 1994). The current observed values of 15% to 17% blood flow increase in cerebral and cerebellar cortex, and 7% to 11% blood flow increase in thalamus and putamen are consistent with those of previous PET studies for a similar task (Shibasaki et al., 1993).
Any given pixel in a fMRI image data set has intra-and extravascular water protons. The transverse relaxation time of protons in both environments depends on intravascular blood oxygenation (Thulborn et al., 1982; Wright et al., 1991; Ogawa et al., 1993; Boxerman et al., 1995a). The relative contribution of each of these groups of protons to the BOLD effect has been investigated at 1.5T for T2* and T2. Using gradient-echo diffusion methods, Song et al. (1996) investigated the effect of diffusion on the BOLD signal in cortical motor regions at 1.5T and observed that most of the T2* change in cortex stems from protons with apparent diffusion coefficient values much higher than that of extravascular water in tissue. They conclude that most of the T2* change must originate from intravascular protons or protons in perivascular CSF. Recently, using SE diffusion-weighted imaging, Zhong et al. (1998) estimated that two-thirds of the T2 relaxation enhancement in BOLD at 1.5T comes from the extravascular protons in tissue. Song et al. (1996) studies were done in motor cortex, whereas Zhong et al. (1998) were in visual cortex.
If ΔR2* = ΔR2 + Δk′2, where Δk′2 is relaxation enhancement from reversible dephasing effects, Table 2 shows that the ΔR2 component of relaxation remains constant across all measured brain regions, whereas the Δk′2 contribution to ΔR2* varies greatly between tissue types. The presence of highly mobile protons near the surface of the cerebral and cerebellar cortex in large draining veins and sulci and their absence in deep gray matter could account for this difference.
The authors have measured R2* and R2 changes concomitant with neuronal activation in three distinctly different types of human brain tissue, cerebral cortex, subcortical tissue, and cerebellar cortex. Although the vascularization of the cerebrum and cerebellum are believed to be quite similar (Akima et al., 1987), the capillary volume fraction of the putamen is nearly half that of the cerebral cortex (Meier-Ruge et al., 1980). Models of the oxygenation contrast mechanism all postulate a direct relation between blood volume fraction and transverse relaxation enhancement (Boxerman et al., 1995b; Hathout et al., 1995; Buxton et al., 1998). The similarity in measured ΔR2 across tissues with very different blood volume fractions suggests that the dependence of ΔR2 on this is very weak.
Coupling of blood flow and ΔR2*
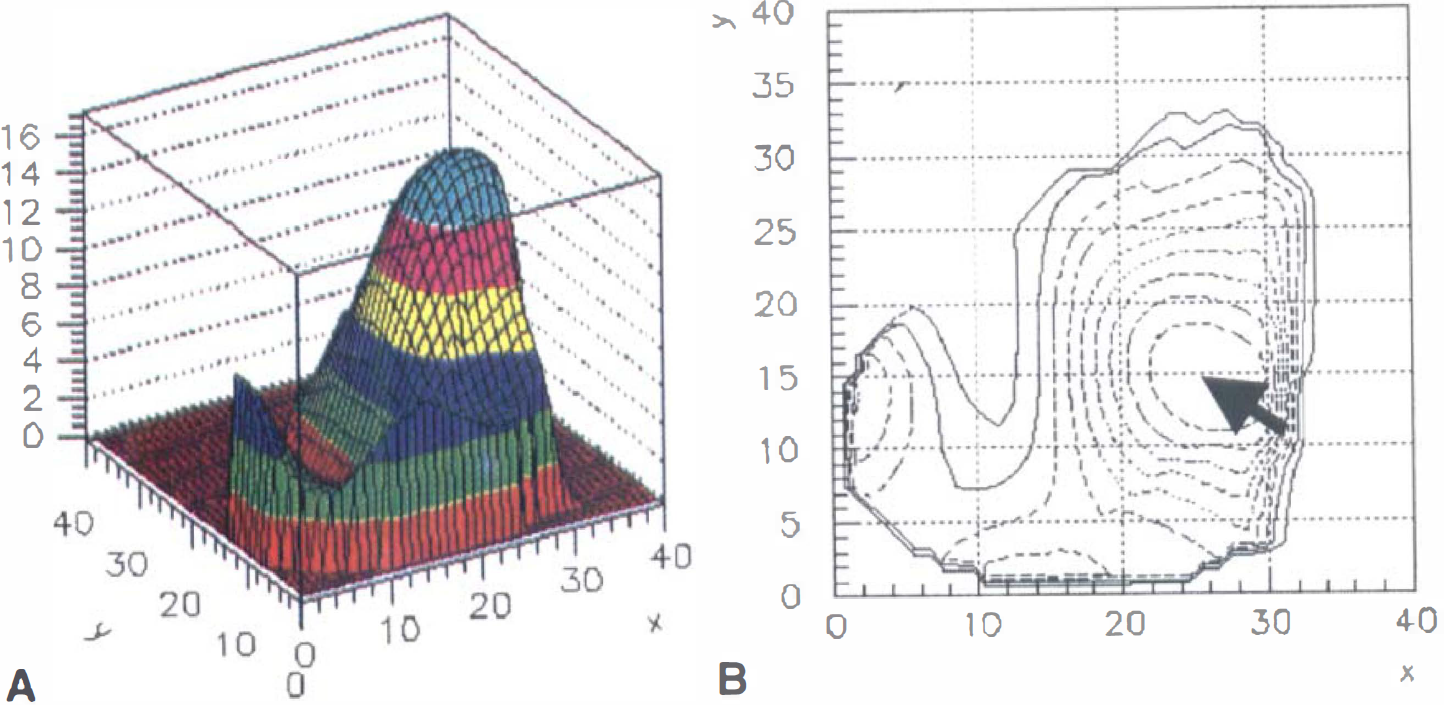
The lower observed blood flow change in subcortical regions, although consistent with previous PET measurements, could possibly be an artifact of the spatial resolution of our flow measurement. As discussed earlier, there is some evidence that the capillary point-spread function from BOLD contrast at 1.5T has a FWHM of 3.5 mm. Thus, the inplane spatial resolution of the current MRI data (∼4 mm) will accurately reflect the amplitude of an underlying signal extending over only a few pixels. However, the current PET measurement had inplane resolution with a FWHM of 8 mm. Blood flow as measured with H215O PET is a reflection of perfusion. There is very little data on the point-spread function of the perfusion response to neuronal activation. However, if the point-spread function for perfusion is similar to the BOLD response, the spatial resolution is the limiting factor in obtaining an unbiased estimate of the signal. Thus, for a signal extending over less than 10 to 20 mm, the authors' estimate of the flow change is an underestimate of the true local response to a small region of activation, such as a region within the putamen or thalamus. The current fMRI data, however, indicate that this is not a problem. Fig. 9 shows typical contour plots for the observed spatial distribution of ΔR2* and ΔR2 changes for the putamen of a single subject. The FWHM of this signal was approximately 12 pixels (∼11 mm).
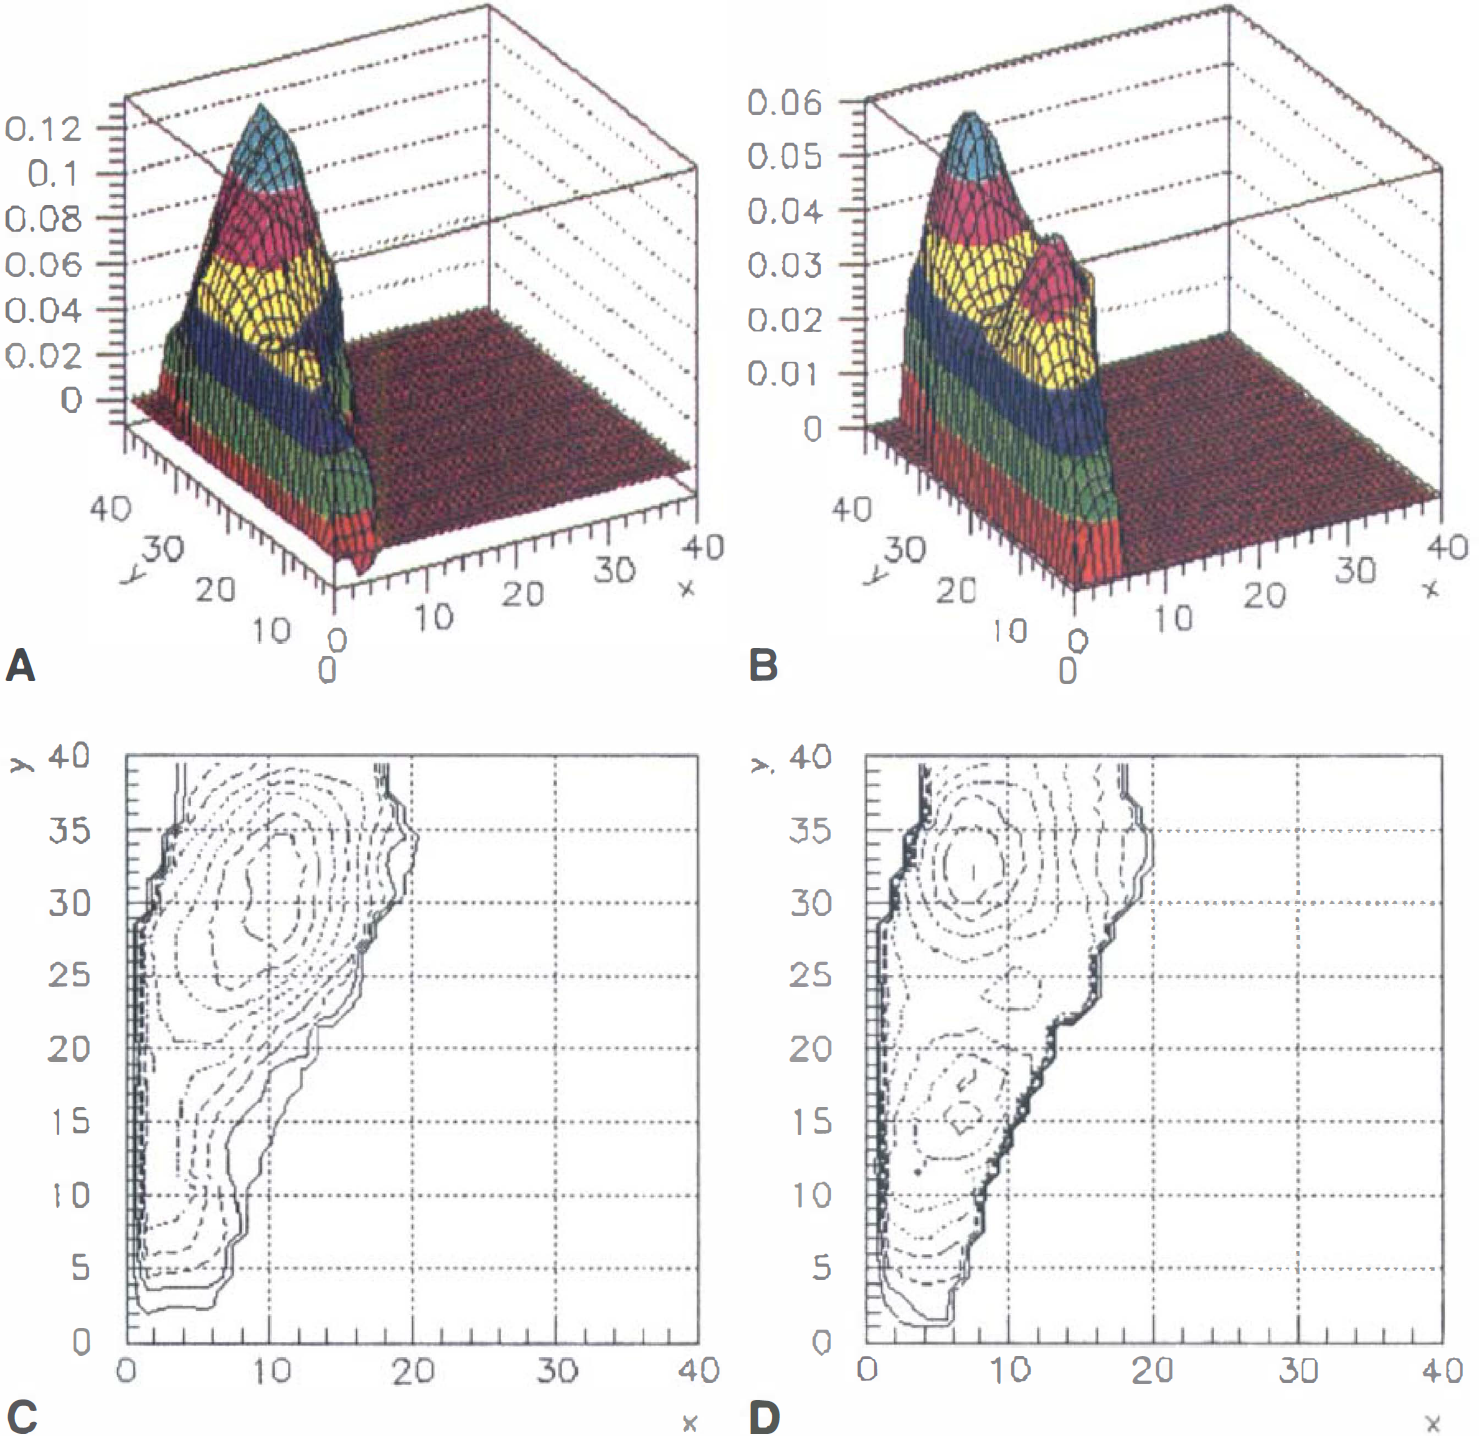
Surface plots for observed
In conclusion, the authors have measured the T2,T2*, and relative blood flow changes from neuronal activity in nine brain regions known to be involved in complex motor task performance across a pool of subjects. These measurements showed that BOLD-based T2 changes are more uniform across the different gray matter structures that may be involved in the neural networks activated in some complex tasks. The largest differences in T2* changes occurred between cortical and subcortical brain regions. Because subcortical regions have a lower volume fraction of macrovessels and CSF protons than cortical regions, this result indicated that perhaps T2* changes have a larger dependence on macrovessels and CSF than T2 changes. Positron emission tomography blood flow change measurements made in the same subjects with the same task indicated a lower dependence of T2 changes on relative blood flow change than T2* changes.
The authors have shown that, when using the T2* methods commonly used in the fMRI literature, researchers should be aware that subcortical brain regions may require much higher sensitivity to observe significant signal changes. For example, the current data show that observation of activation in a cortical region in an experiment with sensitivity limited to R2* changes of 0.1 s−1 will be insensitive to concomitant changes in subcortical regions. Thus, no statement can be made about a possible lack of subcortical region neuronal activation, even if those regions are present in the imaging data set.
Footnotes
Abbreviations used
1
Although R2 for supplementary motor area (SMA) is 0.9 σ less than RPRECG and 1.4 σ less than LPRECG, because SMA measurements were not systematically lower than the other cortical regions for the other measurements, the authors grouped the cortical regions for all measurements. ![]() lists the region of interest values for decoupling SMA from the primary motor regions.
lists the region of interest values for decoupling SMA from the primary motor regions.
Acknowledgements
The authors thank J. Sims and R. Fain of the Indiana University Department of Radiology for their assistance in performing the experiments.