
Abstract
Voxel-level detection of task-induced striatal dopamine (DA) release in humans is achievable with dynamic PET imaging, enabling complex studies of motor, cognitive, and reward tasks. We previously introduced a data-driven methodology termed Residual Space Detection (RSD), which improved detection of low-amplitude DA release, however its applicability was limited to detection of low-amplitude and/or localized effects. Here, we generalize RSD to broader DA release scenarios by introducing a novel model-based baseline time-activity curve prediction method in combination with non-local-means clustering (RSD-Hybrid-IMRTM). In simulations, RSD-Hybrid-IMRTM outperforms our previous methodology for detecting global striatal DA release, improving absolute detection sensitivity by 18% at 5% false positive rate, while also demonstrating the ability to track the magnitude of task-induced changes in synaptic DA concentrations in a noise-robust manner. As a proof of principle, we apply RSD-Hybrid-IMRTM to healthy controls and Parkinson’s disease subjects undergoing finger and foot tapping tasks. Results reveal expected group differences in parametric maps, parameter magnitudes, and functional segregation, demonstrating RSD-Hybrid-IMRTM’s utility for investigating neurotransmission in human cohorts.
Introduction
Dopamine (DA) plays a major role in many aspects of brain function, including motor, cognitive, and reward processing.1–3 Dopaminergic dysfunction is involved in various brain disorders, most notably Parkinson’s disease (PD), where motor symptoms mainly reflect DA deficiency, 2 as well as schizophrenia, where it is hypothesized that psychosis is related to excessive DA signaling. 4 It is thus highly desirable to study DA behavior under a variety of physiological and pharmacological interventions to better understand DA processing in relation to task and disease.
Task-induced increases in synaptic DA concentrations above baseline levels (subsequently termed “DA release”) can be detected in select areas of the human brain by use of dynamic [11C]raclopride (RAC – a D2/3 receptor antagonist) PET imaging.5–10 Although this has traditionally been accomplished with two separate PET scans involving bolus injections of RAC, the first of which has the subject at rest to determine a baseline state while the second scan involves a sustained stimulus aimed to invoke DA release, 11 a more recent approach for inducing and subsequently observing transient DA release involves a single 70+ minute bolus or bolus+infusion PET scan. 7 Under this protocol a baseline state is maintained through the first 30–40 minutes of scanning, after which the subject performs a task designed to induce DA release, such as smoking,8,9,12 engaging in a motor activity, 13 or reward-based learning. 14 This causes a transient voxel-level perturbation to the dynamic PET data as a result of binding competition between DA and RAC at receptor sites: the increased synaptic DA concentration limits subsequent RAC binding, resulting in a localized time-varying decrease in the tracer time activity curve (TAC). As DA concentrations cannot be directly measured in vivo in humans, current detection methods rely on semi-quantitative proxy measures derived from RAC TACs, which are deemed proportional to relative DA concentration changes.
There are two major components of a DA release detection framework: (1) modeling of ‘baseline’ behavior, and (2) task-related DA release modeling. The first relates to a measured voxel TAC’s expected behavior in the absence of DA release and is primarily achieved by analysis of pre-task TAC data. The majority of developments in the present work are aimed at improving the accuracy of the baseline definition, as this step is crucial for reliable predictions of the second component. Task-related DA release modeling may take a variety of forms, including binary or probabilistic detection, prediction of a semi-quantitative metric related to DA release magnitude, or estimation of DA release timecourses.
We recently proposed a data-driven framework, termed Residual Space Detection (RSD), 15 that was found to outperform the more commonly used method, linear parametric neurotransmitter PET (lp-ntPET), in a situation of localized low-amplitude dopamine release. In particular, the enhanced performance of RSD in such a DA release scenario was due to its ability to better define baseline TAC behavior which led to higher detection sensitivity.
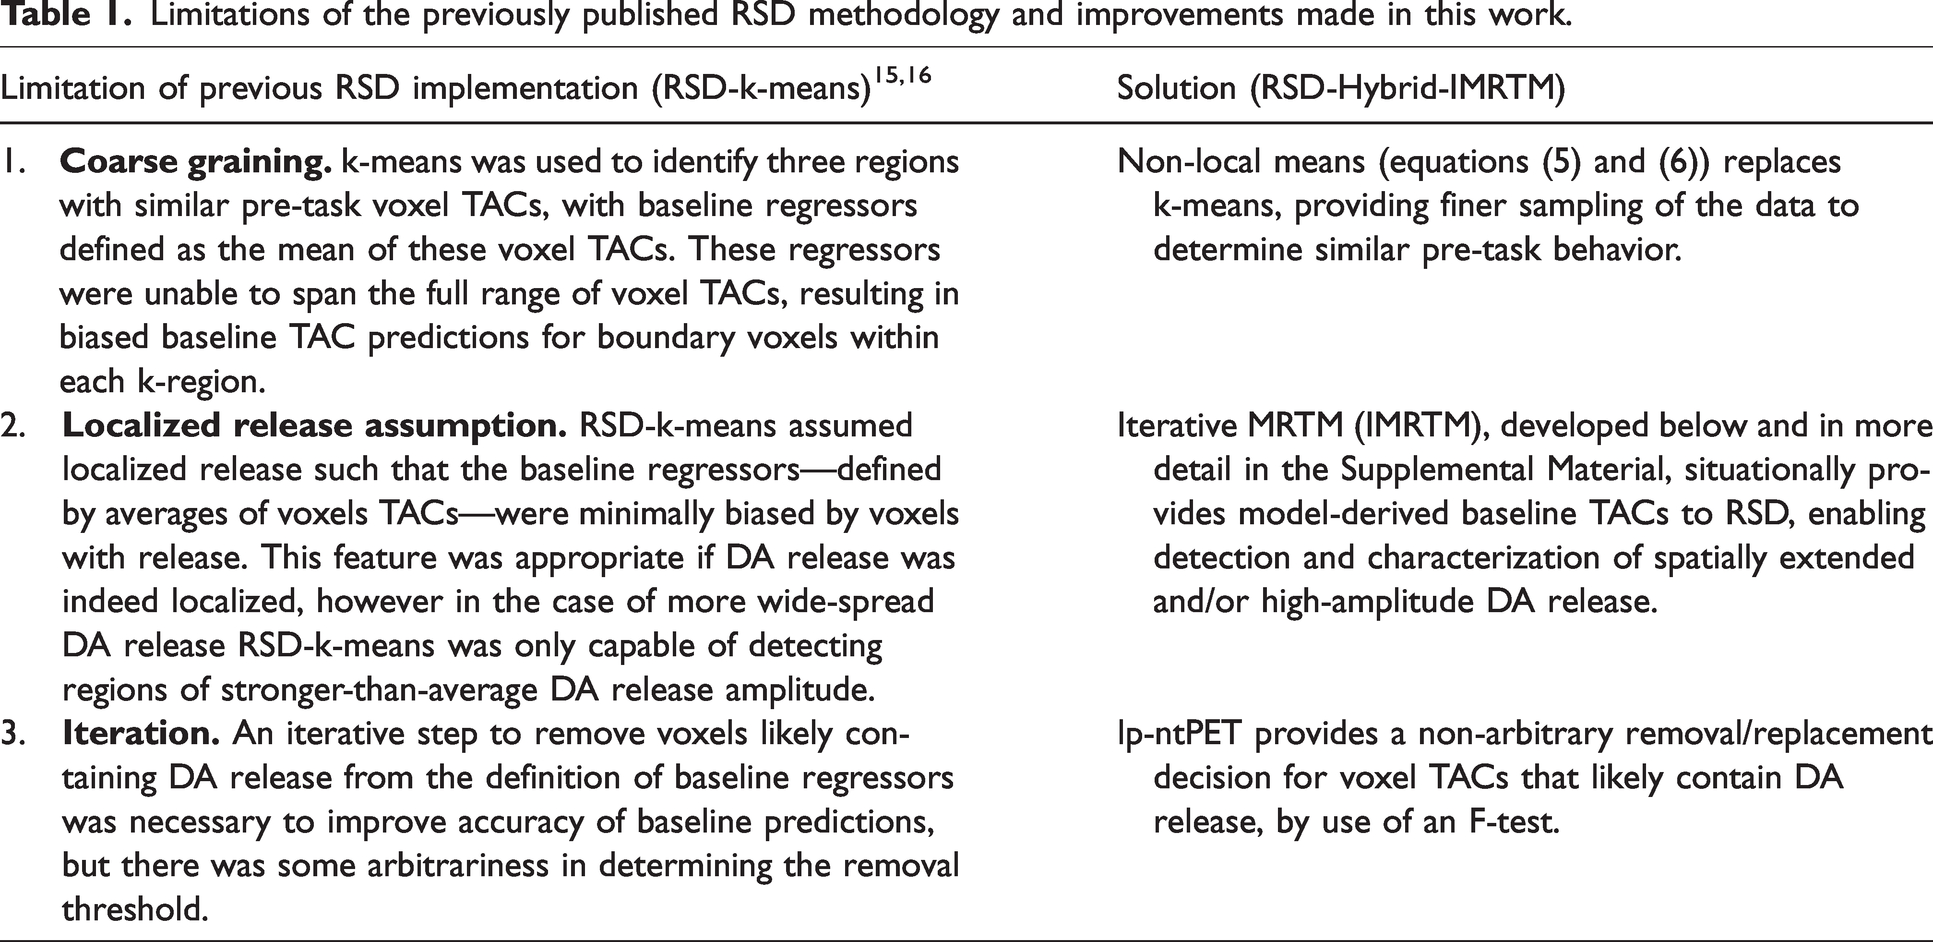
While RSD in its original implementation extended the ability of lp-ntPET to detect localized and low-magnitude DA release, it also had limitations (outlined in Table 1) which led to its suboptimal performance in a more general DA release scenario, where it was consistently outperformed by lp-ntPET. The primary limitation was the assumption of DA release being localized to small striatal sub-regions: as RSD relied on finding voxel TACs within the striatum that were free of DA release signal to use as regressors, if release was of a large magnitude and/or spatial extent, RSD’s defined baseline TACs would be biased (see Theory).
Limitations of the previously published RSD methodology and improvements made in this work.
The aims of this work are: (1) to generalize the RSD methodology to be applicable to a variety of tracer binding conditions (e.g. spatially heterogeneous receptor densities or low basal DA levels present in PD)17,18 and DA release scenarios (e.g. extended vs local release, low- vs high-amplitude), (2) demonstrate robustness of RSD to track DA release magnitude in the presence of noise, and (3) present a proof-of-principle application of RSD to human cohorts. The goal is thus to demonstrate that the generalized method has a similar performance to lp-ntPET in a scenario of diffuse, relatively high DA release, while still maintaining its high detection sensitivity for low level localized DA release.
The paper proceeds as follows. After providing a succinct background on lp-ntPET and the original implementation of RSD, a novel baseline TAC prediction method is developed as an iterative extension to the multilinear reference tissue model (Iterative MRTM; IMRTM).
19
Then a generalized RSD framework is developed, termed RSD-Hybrid-IMRTM; “hybrid” referring to the combination of both data-driven and kinetic model-based baseline TAC predictions to achieve more robust voxel baseline TACs and residuals. A residual form of lp-ntPET making use of the improved baseline TAC predictions of RSD-Hybrid-IMRTM is then introduced to provide more robust estimates of semi-quantitative metrics that track DA release magnitude (
Theory
Existing DA release detection frameworks
Lp-ntPET
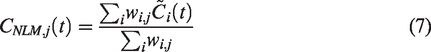
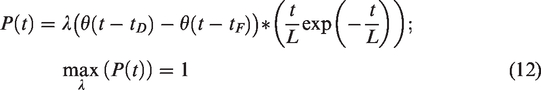
The linear parametric neurotransmitter PET model (lp-ntPET; equation (1)) uses a library of pre-defined release timecourses to simultaneously predict baseline and DA release behavior on a voxel level:
20


RSD
Residual Space Detection (RSD) is a method that aims to predict what voxel TACs would be in a baseline state (i.e. if no DA release occurred) and compares predicted baseline TACs to measured voxel TACs by extracting residual behavior via a percentage difference. Applying a General Linear Model to voxel residuals provides estimates of “percent signal change from baseline”, used as a proxy for DA release. 15
The major innovation of RSD compared to lp-ntPET was to perform baseline TAC predictions and DA release metric predictions in separate steps, which helped to improve robustness of (1) determination of baseline parameters, and (2) estimation of parameters relating to release magnitude. Specifically relating to (1), the lp-ntPET baseline parameters (
Regarding issue (2), the lp-ntPET parameter
Baseline TAC prediction
An important aspect of RSD is the prediction of baseline TACs for each voxel in the region of interest (typically the striatum), which can then be used to determine the magnitude of task-related deviations in the measured voxel TACs as a proxy for DA release. Possible approaches for obtaining voxel-level baseline TAC predictions include (i) using the measured data, (ii) using a model, or (iii) using a hybrid of model- and data-driven TACs.
Data-driven baseline TAC prediction and its limitations (RSD-k-means)
Our previously published work used the measured data alone to construct baseline TACs. In brief, our previous method (hereafter: RSD-k-means)
15
used k-means clustering on pre-task voxel TACs to identify three regions of the striatum, each containing voxels with similar pre-task baseline tracer binding characteristics. The value of k = 3 was chosen to obtain baseline regressor TACs encapsulating a range of binding potential (
Model-based baseline TAC prediction (Iterative MRTM)
To ameliorate the issues of data-driven detection, we now introduce a novel model-based method called Iterative MRTM (IMRTM), used for extracting baseline TAC behavior from a measured voxel TAC which may contain task-induced neurotransmitter release. This method first fits the traditional MRTM model prior to the task start, 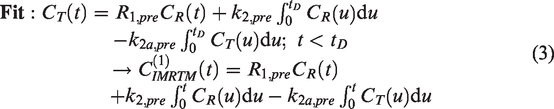
This provides a first approximation to a voxel-specific baseline TAC, 
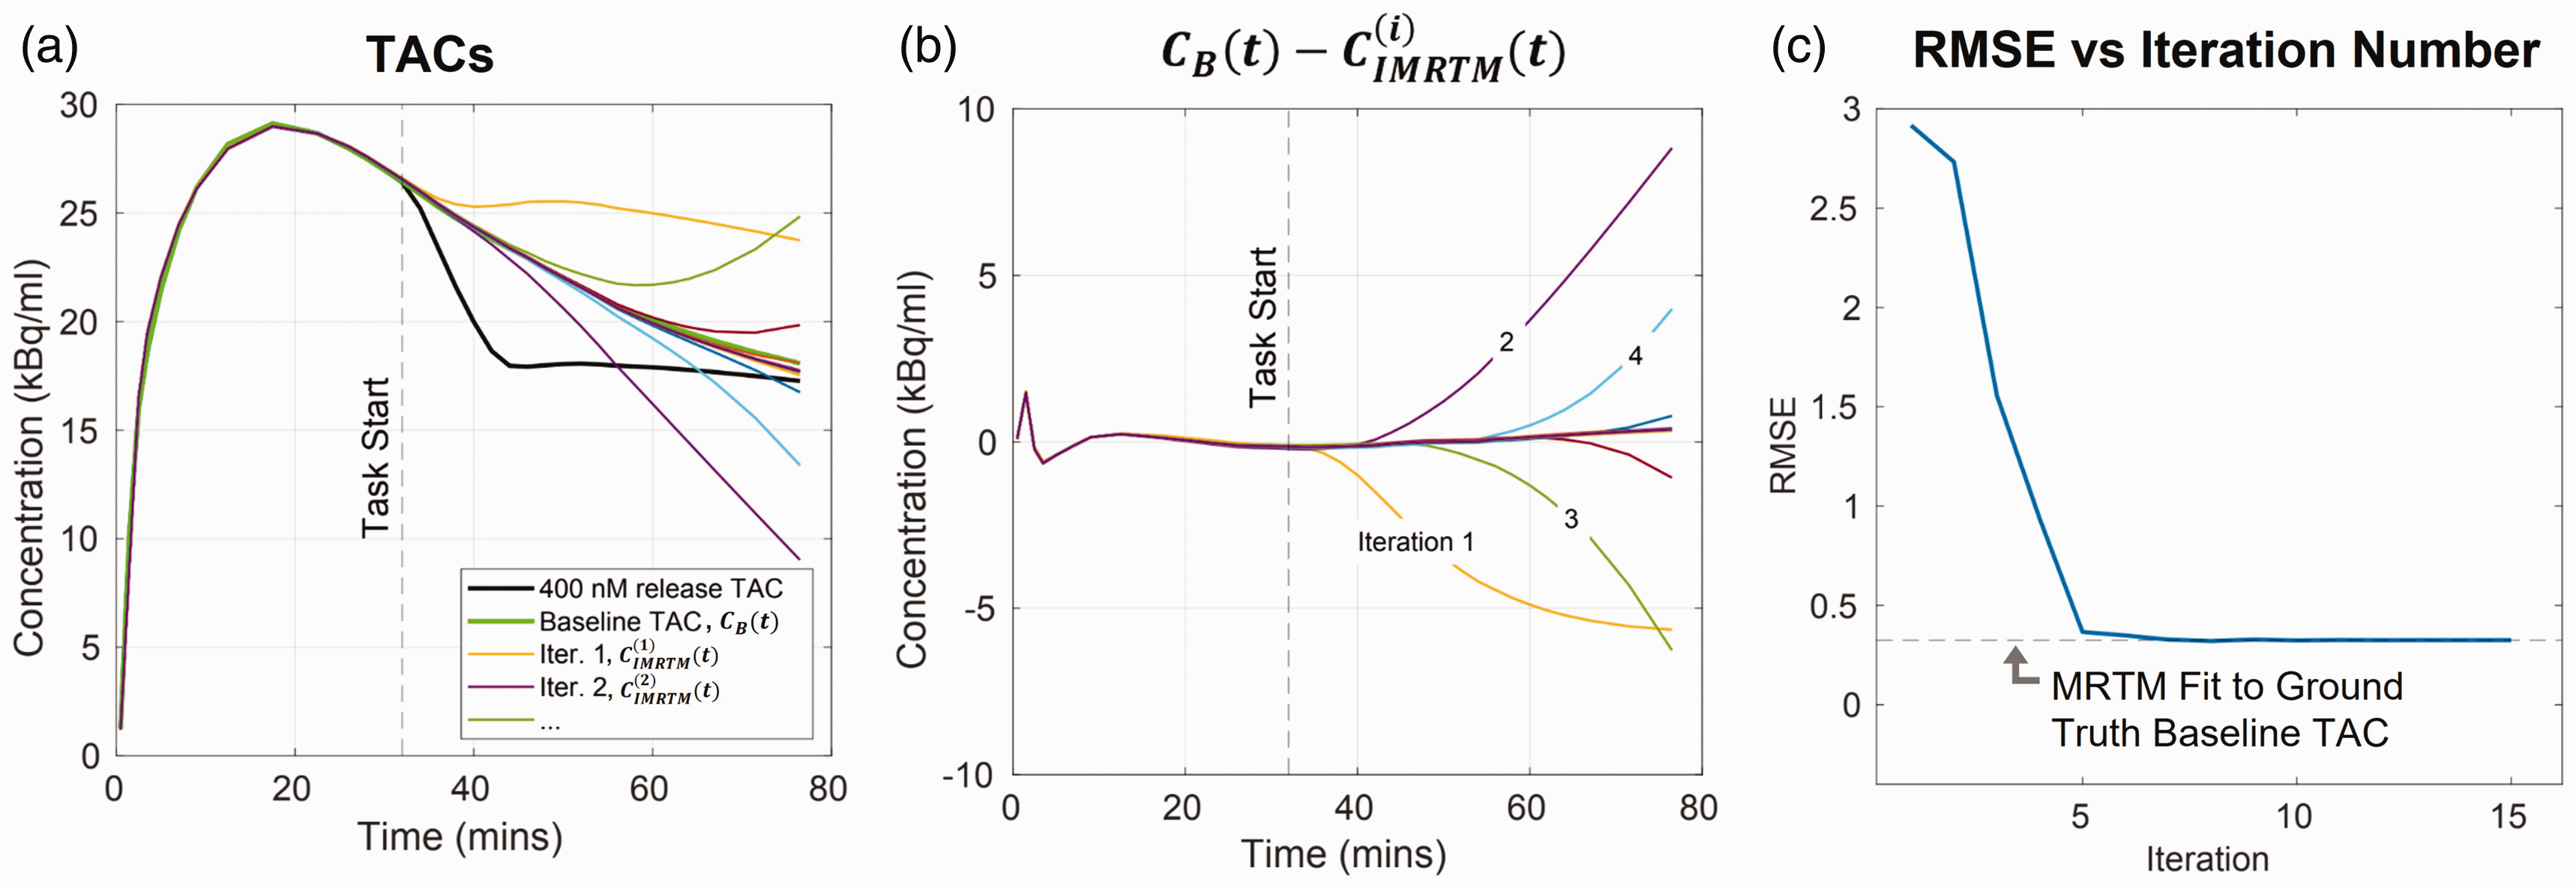
Demonstration of IMRTM baseline convergence for noise free release TAC
To demonstrate the IMRTM procedure, we used the ntPET
21
model to simulate a noise-free [11C]raclopride TAC,
Hybrid baseline TAC prediction (RSD-Hybrid-IMRTM)
While IMRTM provides the ability to predict baseline TACs using a model, it relies on a good fit to the measured voxel TAC prior to the task, which may fail due to pre-task noise or simply because the pre-task data does not capture the voxel’s true kinetics. 22 Therefore, we aggregate both the IMRTM-derived baseline TACs and the measured data into a framework referred to as RSD-Hybrid-IMRTM, to achieve more robust voxel-level baseline TAC predictions. This removes RSD-k-means’ “model-free” requirement, instead opting to use a hybrid approach making use of both model- and data-derived baseline TACs.
The first step of the proposed method is to find voxels with similar kinetics, so that data from other similar voxels may be combined to reduce noise. To do this, we apply MRTM on pre-task data of voxel TACs inside a striatal mask, extracting voxelwise striatal MRTM parameters (
An inherent limitation of our previous method (Table 1) was that 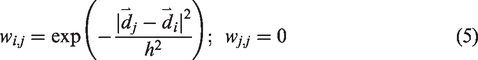
As RSD-Hybrid-IMRTM aims to predict baseline TAC behavior by aggregating measured data (some of which is expected to contain DA release), it needs an objective criterion for avoiding use of release-contaminated signal in its baseline predictions. This objective criterion is provided by a pass of lp-ntPET fitting; after obtaining voxel-level F-statistics with lp-ntPET,
A baseline regressor set is thus constructed using IMRTM-derived TACs for voxels that were deemed significant under lp-ntPET fitting, along with measured voxel TACs that were not deemed significant:

Finally, voxelwise baseline TAC predictions are made using the weights defined by NLM (equation (5)) by first preferentially averaging across model- and data-derived baseline TACs with similar kinetics:
Then the final baseline TAC prediction 

Equation (8) assumes that voxel values are a linear combination of true signal and spill-in from surrounding voxels devoid of specific binding, thus the non-negativity constraint enforces this physiological assumption. In practice,
RSD then proceeds to take the percent difference of the measured voxel TAC 
Defining residuals in this way, rather than as a subtraction, results in residual magnitudes invariant to task start timing and insensitive to 
Residual lp-ntPET
It is often desirable to determine measures relating to the time-varying binding potential,
23
for which the benefits of RSD-Hybrid-IMRTM’s baseline prediction can be used to obtain more stable predictions of 
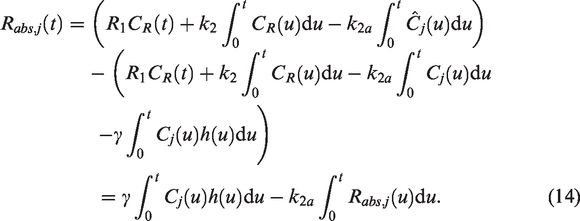
This may be solved using linear regression similar to the typical lp-ntPET procedure. Note that the benefits of percent-difference residuals (equation (10)) cannot be utilized here, as absolute residuals are required to simplify terms in equation (14). We provide results from this model as applied to human subjects below, with example
Methods
Simulation design
Noiseless TACs were simulated following the ntPET model. 9 Kinetic parameters derived from a healthy control subject scanned under baseline conditions were used alongside pre-specified synaptic DA concentration increases and timings to obtain simulated TACs (see Supplemental Table 1 and Supplemental Material section “Simulation details” for more information). It is noted that IHYPR4D 24 post-processing was used for all noisy simulations and human scans for denoising (spatial kernel size of 7.2 mm isotropic, temporal kernel size of 2 frames, 1 iteration).
Two simulation sets were performed in this work to address Aims 1 and 2, both simulating a single 10-minute functional task block starting at 36 minutes:
Detection performance
Clusters of low-amplitude DA release (100 nM increase from a basal DA concentration of 96.4 nM) were placed in the left and right anterior putamen and left caudate. To compare the detection performance of the methods described in the previous section, 50 noisy realizations (NRs) were performed for each scenario of localized clusters (17–22% of ROI size), mid-sized clusters (24–48% of ROI size), and full-ROI clusters of DA release (Figure 2). lp-ntPET was applied with 17 basis functions to allow flexibility in detection (
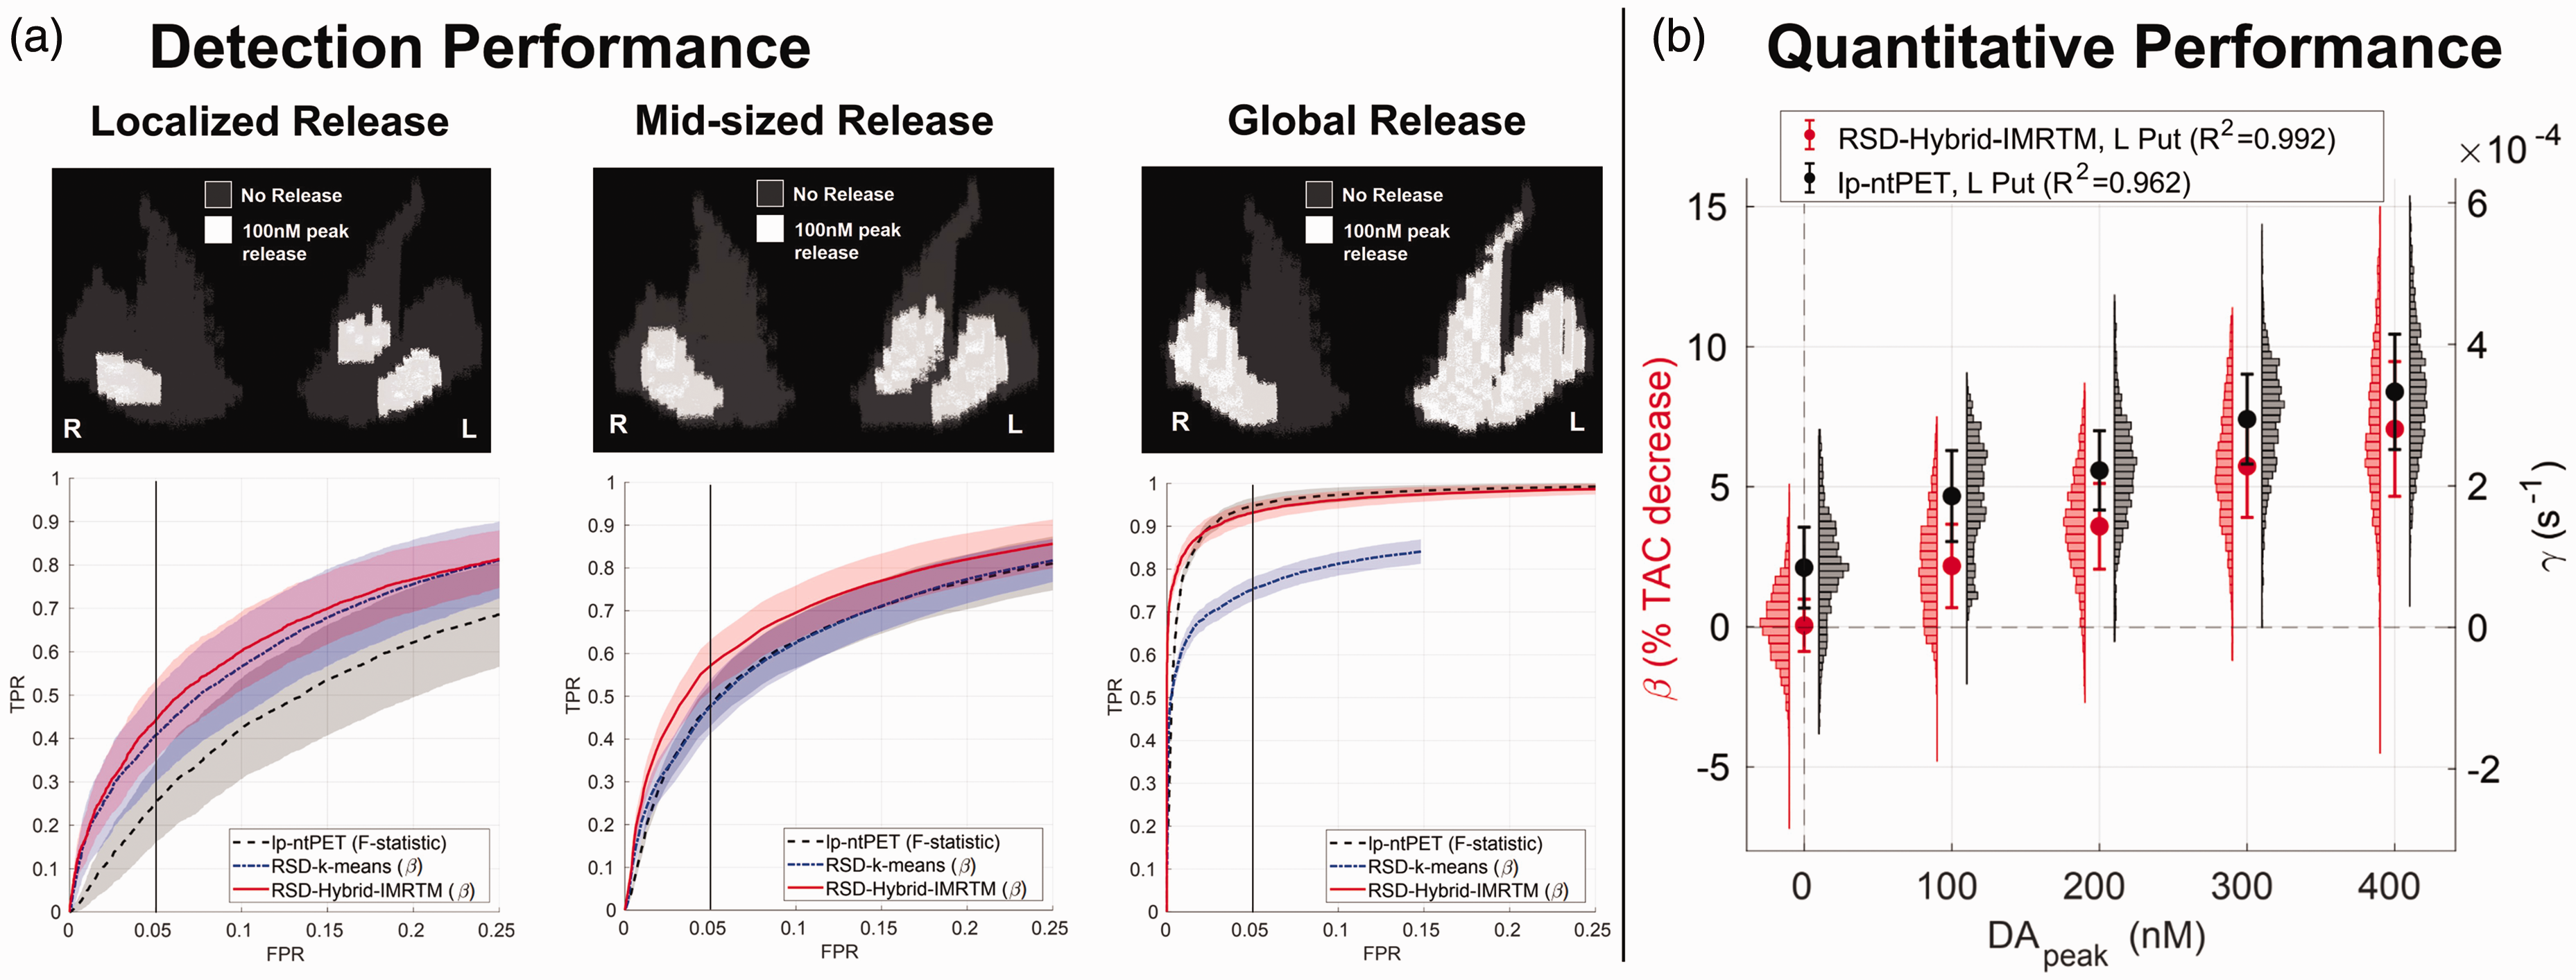
Simulation results. (a) Detection performance for low-amplitude DA release in localized, mid-sized, and global clusters (50 noisy realizations each), comparing the novel RSD-Hybrid-IMRTM to RSD-k-means and lp-ntPET. True positive rate (TPR) is calculated across all ground truth clusters, while false positive rate (FPR) is calculated across the release-free right caudate region. Note, the abscissa is limited to the range 0–25% FPR to highlight methodological differences and (b) quantitative tracking of DA release magnitude in the left putamen cluster (85 voxels) for RSD-Hybrid-IMRTM and lp-ntPET. Note the difference in scale of the y-axes.
Quantitative performance
20 NRs each of 0, 100, 200, 300, and 400 nM DA release were simulated using the localized cluster set from simulation 1. The intent of these simulations was to examine the quantitative behavior of the methods and their ability to track DA release magnitude. lp-ntPET was applied with 1 optimal basis function (
Simulation analysis
Detection performance
Striatal parametric maps output from RSD-Hybrid-IMRTM (
Thus, for each NR, threshold value, and method, a binarized map was obtained, from which TPR was computed across all simulated DA release clusters and FPR was computed within the release-free right caudate. Averaging across NRs for each threshold’s TPR and FPR resulted in a receiver operating characteristic (ROC) curve for each method (Figure 2(a)).
Quantitative performance
Human scans
To examine the ability of RSD-Hybrid-IMRTM to find group differences in human subjects, we present results from HC and PD cohorts, with subjects undergoing separate finger tapping and foot tapping [11C]RAC scans. Differences in activation maps between HC and PD subjects were theoretically expected to include loss of task performance segregation and compensation for motor function deficits in PD by diffuse striatal regions.25,26
Scan protocol
Thirteen PD subjects (5 female; mean age = 66.2, SD = 7.9, range = 55–78) and fifteen healthy controls (8 female; mean age = 64.2, SD = 8.7, range = 47–77) were scanned on the GE SIGNA PET/MR scanner. All HC participants tapped with their dominant right hand/foot, while PD subjects tapped the limb on their most affected motor side (7 right, 6 left). At 36 minutes post bolus injection of RAC (approximately 550 MBq; 14.86 mCi), subjects tapped their foot/fingers at their own pace in 5 blocks of 2 minutes each, with 15 seconds of rest between blocks. The UBC Research Ethics Board (following ethical standards of the Helsinki Declaration of 1975 and as revised in 1983) approved this study (certificate number: H19-03166), and written informed consent was obtained for each subject prior to all study procedures.
Image processing
Acquired PET data were reconstructed using PSF-HYPR4D-K-TOFOSEM,27,28 with attenuation, scatter, randoms, and normalization corrections, after which PET images underwent frame-to-frame realignment using SPM12.
29
Dynamic PET images were denoised using IHYPR4D. Striatal masks were extracted by segmenting subject-specific
Image analysis
To test whether our proposed method provides stronger and/or more interpretable group-level results (Aim 3 outlined in the Introduction), RSD-Hybrid-IMRTM was performed on subject-space dynamic PET images, providing
To explore group differences in spatial DA release patterns using RSD-Hybrid-IMRTM, we performed two analyses: (i) Group-level release patterns were determined by performing one sample T-tests using
To explore group differences in parameter estimation of
Finally the metric of “peak occupancy” (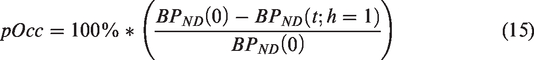
For each subject’s foot tapping scan,
Results
Simulations
Detection performance
Results for detection sensitivity across a range of DA release scenarios are provided in Figure 2(a). RSD-Hybrid-IMRTM consistently outperforms RSD-k-means, while also proving capable of high sensitivity detection for all release scenarios. As expected, it outperforms lp-ntPET for more localized release while performing comparably for more wide-spread release.
Quantitative performance
Figure 2(b) compares the ability of RSD-Hybrid-IMRTM (
RSD-Hybrid-IMRTM provides a metric that is more interpretable as a result of its zero y-intercept, exhibits greater linearity with
Human scans
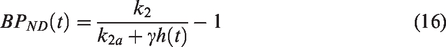
To demonstrate outputs of RSD-Hybrid-IMRTM for human subjects, Figure 3 displays
RSD-Hybrid-IMRTM outputs for individual subjects and groups. (a) Individual striatal
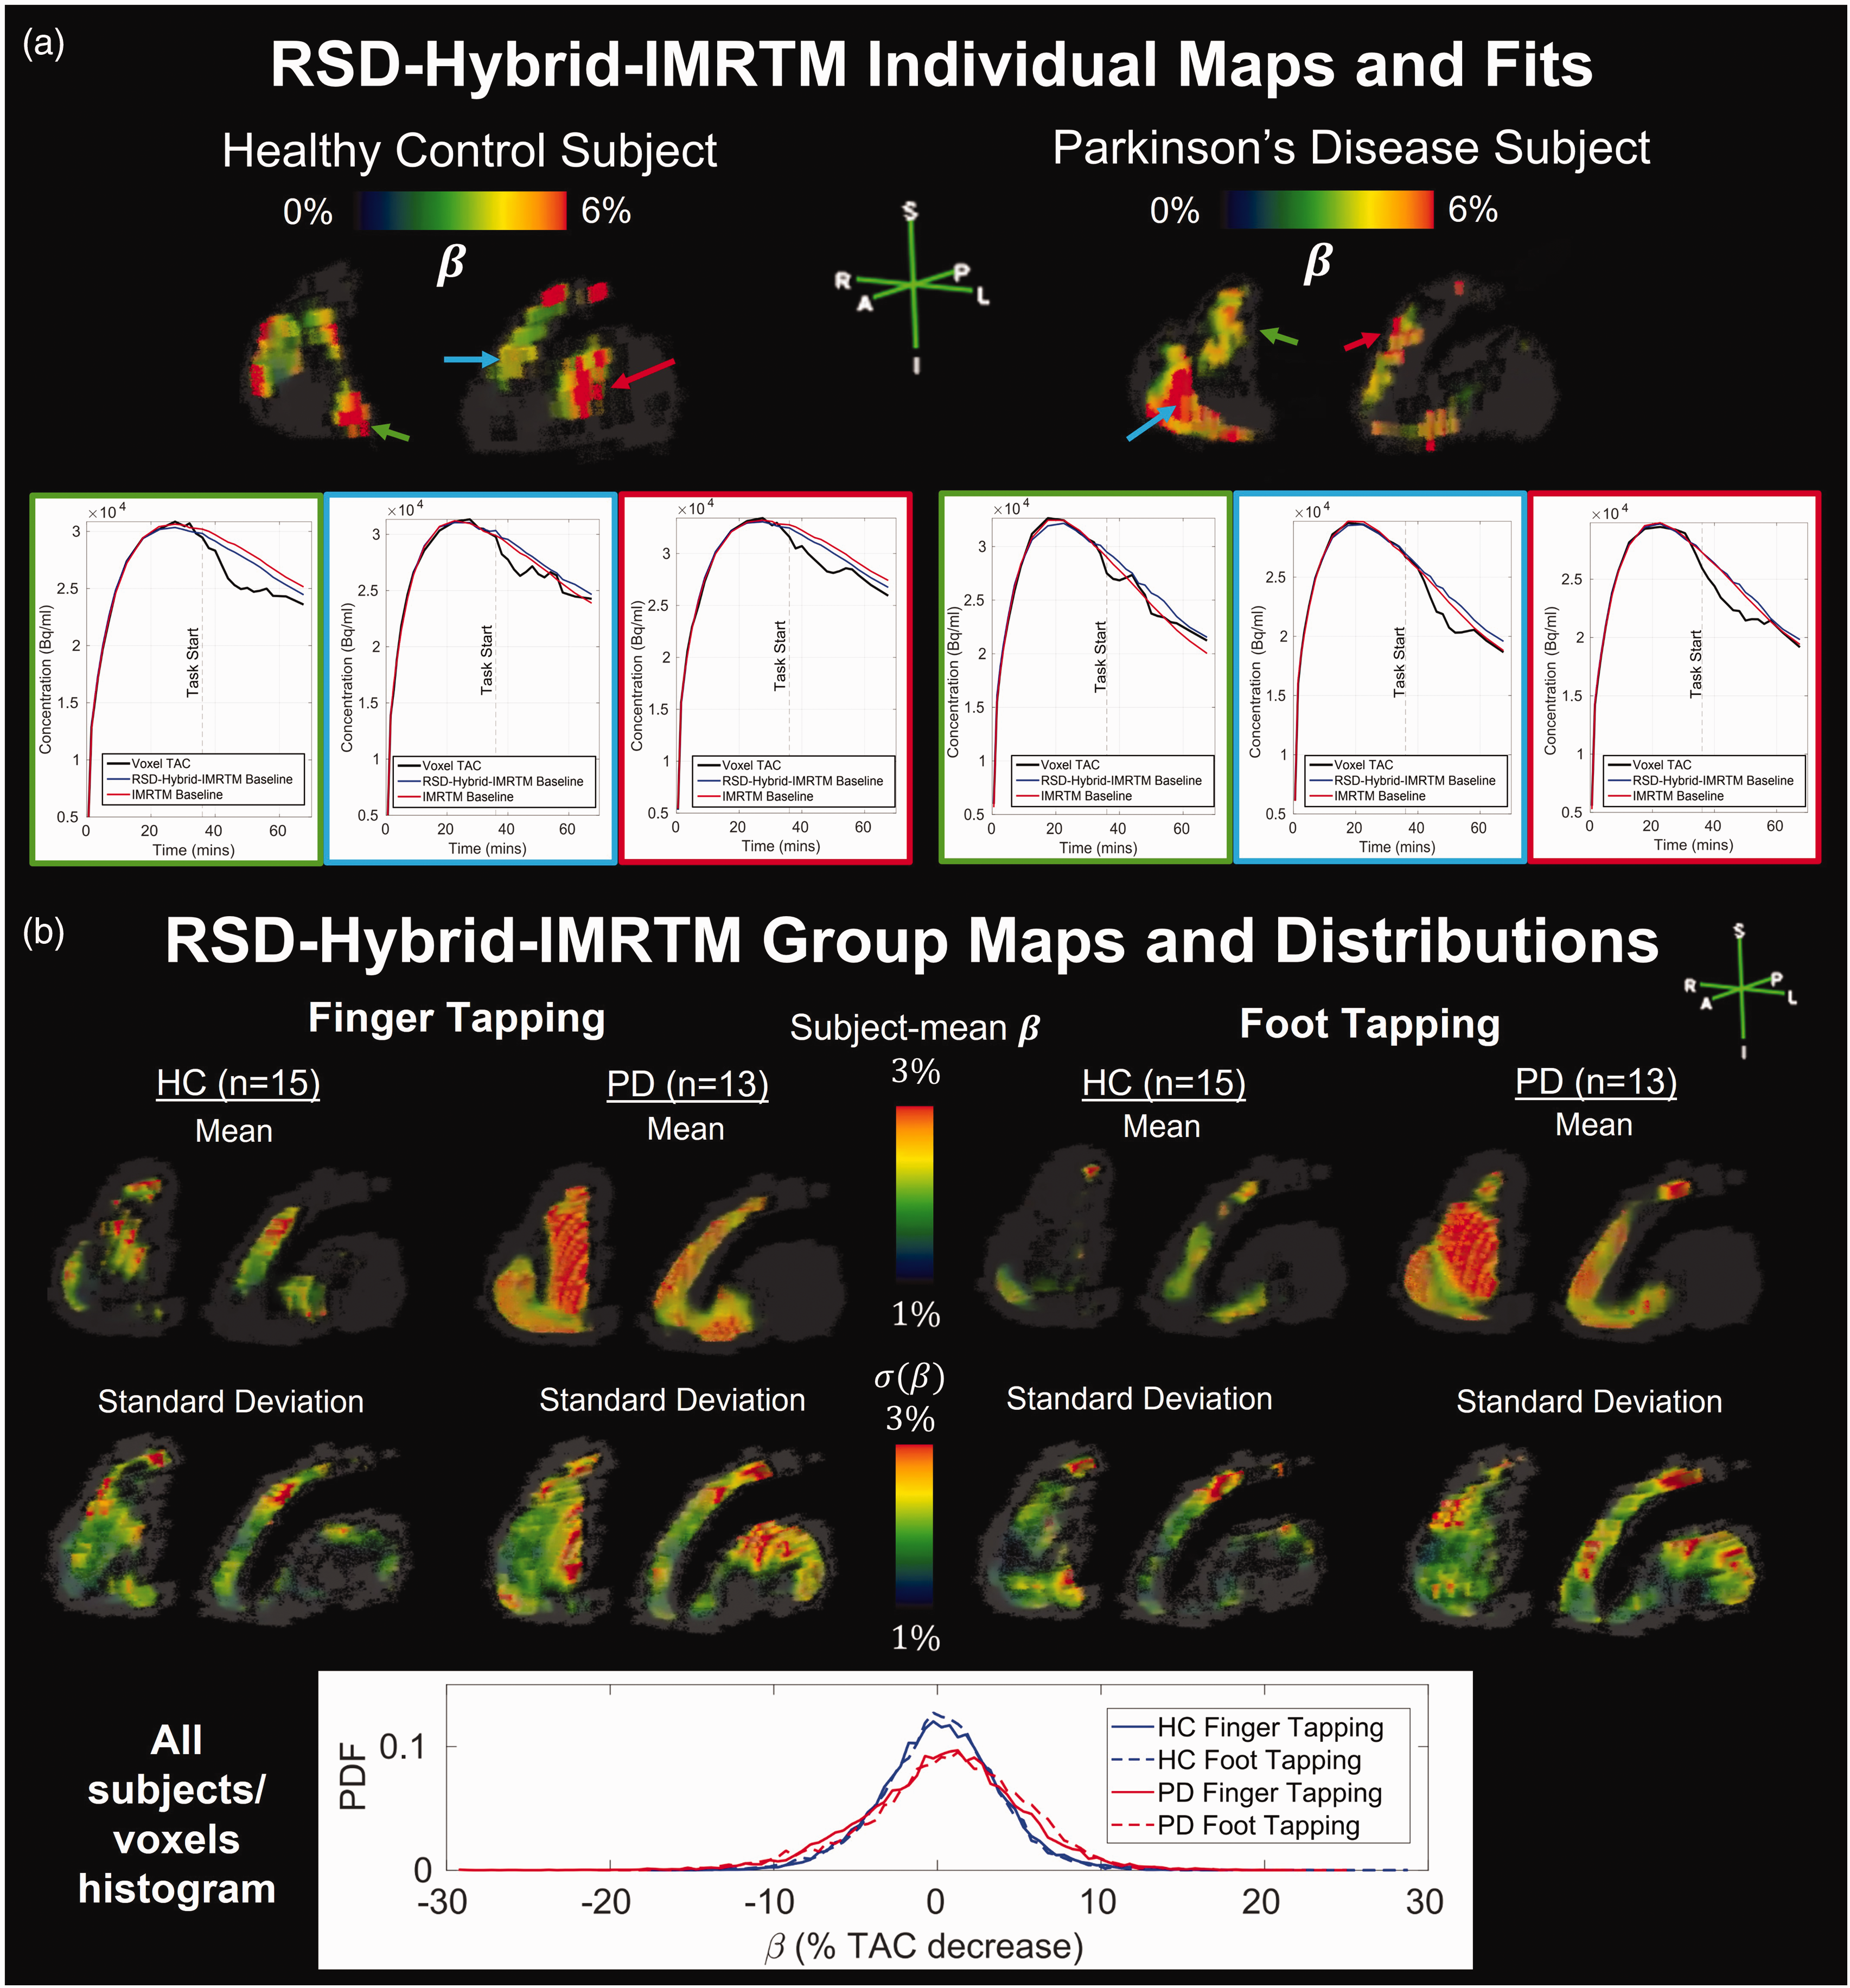
T-statistics computed separately for each group and task combination using
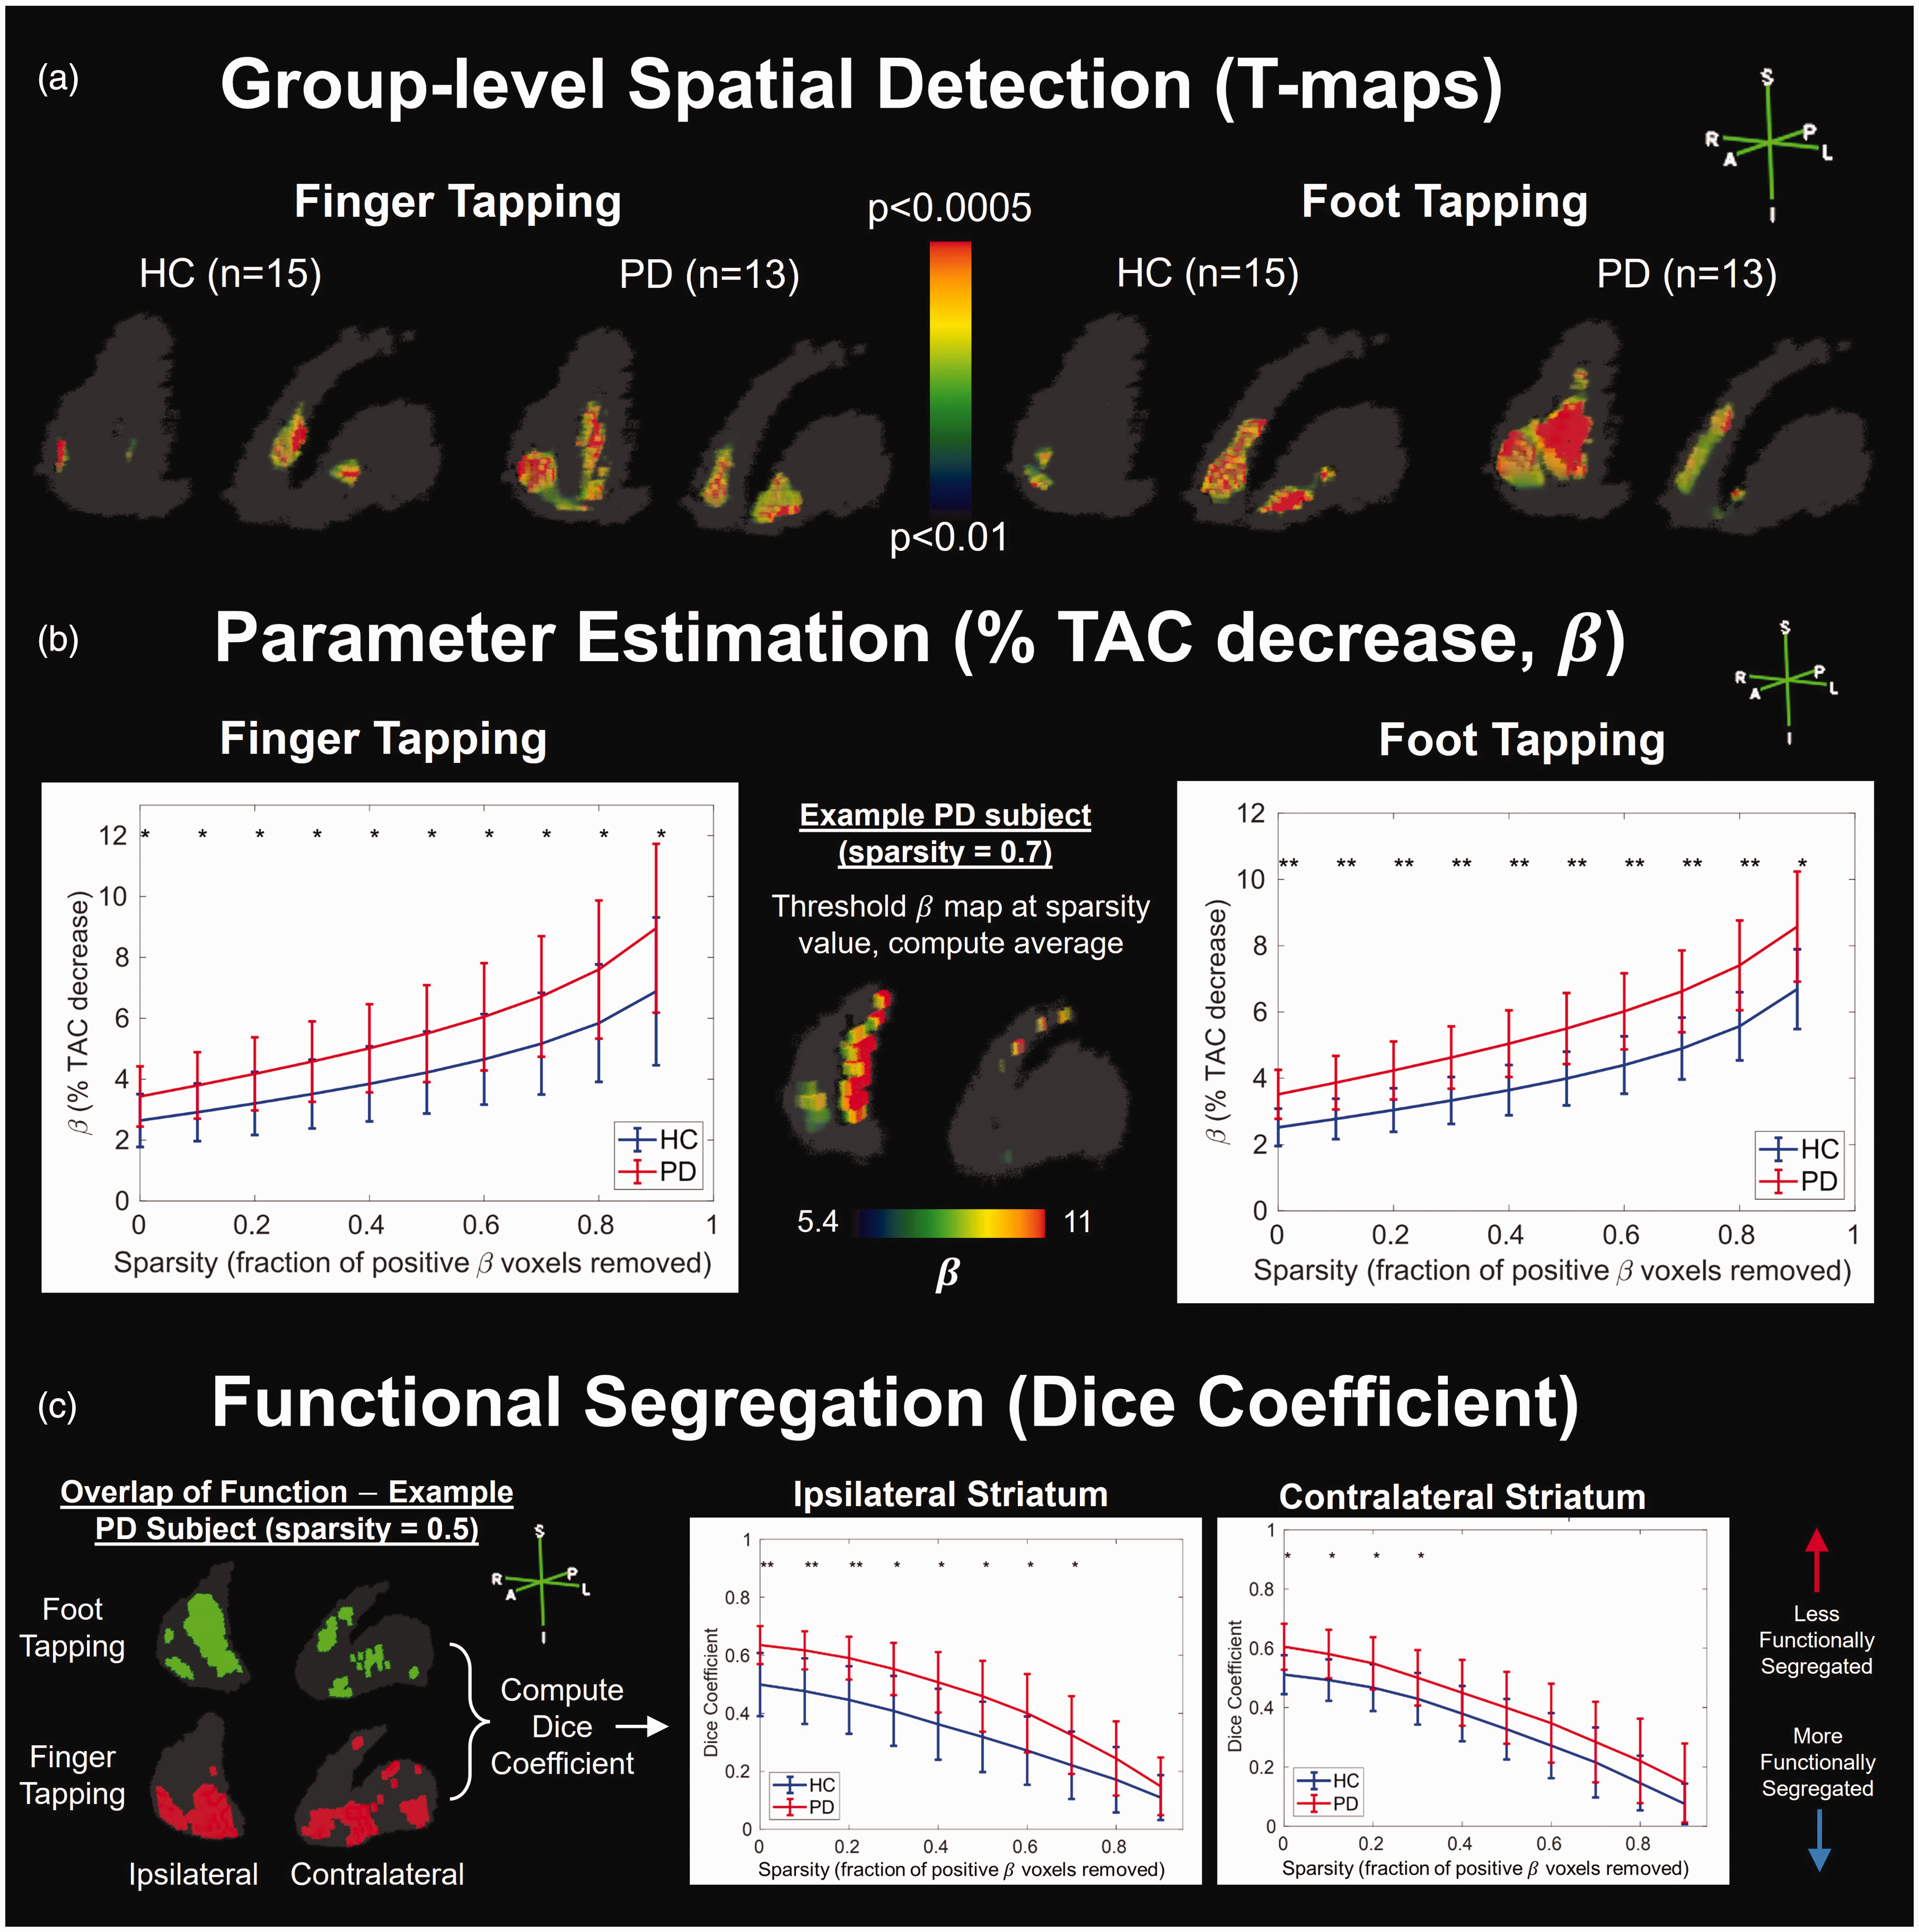
Ability of RSD-Hybrid-IMRTM to find group differences between healthy control (HC) and Parkinson’s disease (PD) subjects. (a) T-test results using subject
Computing the mean
Results from RSD-Hybrid-IMRTM demonstrate significantly reduced functional segregation in PD (Figure 4(c)), indicated by higher overlap between foot and finger tapping maps as measured by the dice coefficient, and is most dominant on the ipsilateral side to tapping.
Results from lp-ntPET show group differences in spatial detection that can be interpreted similarly, albeit with lower statistical power and higher spatial noise compared to RSD-Hybrid-IMRTM (Supplemental Figures 7 and 8). For group level analysis of
Finally, results from residual lp-ntPET are displayed in Figure 5, with comparisons to standard lp-ntPET and RSD-Hybrid-IMRTM. The top and middle rows of Figure 5 are visually grouped to compare similar lp-ntPET metrics (
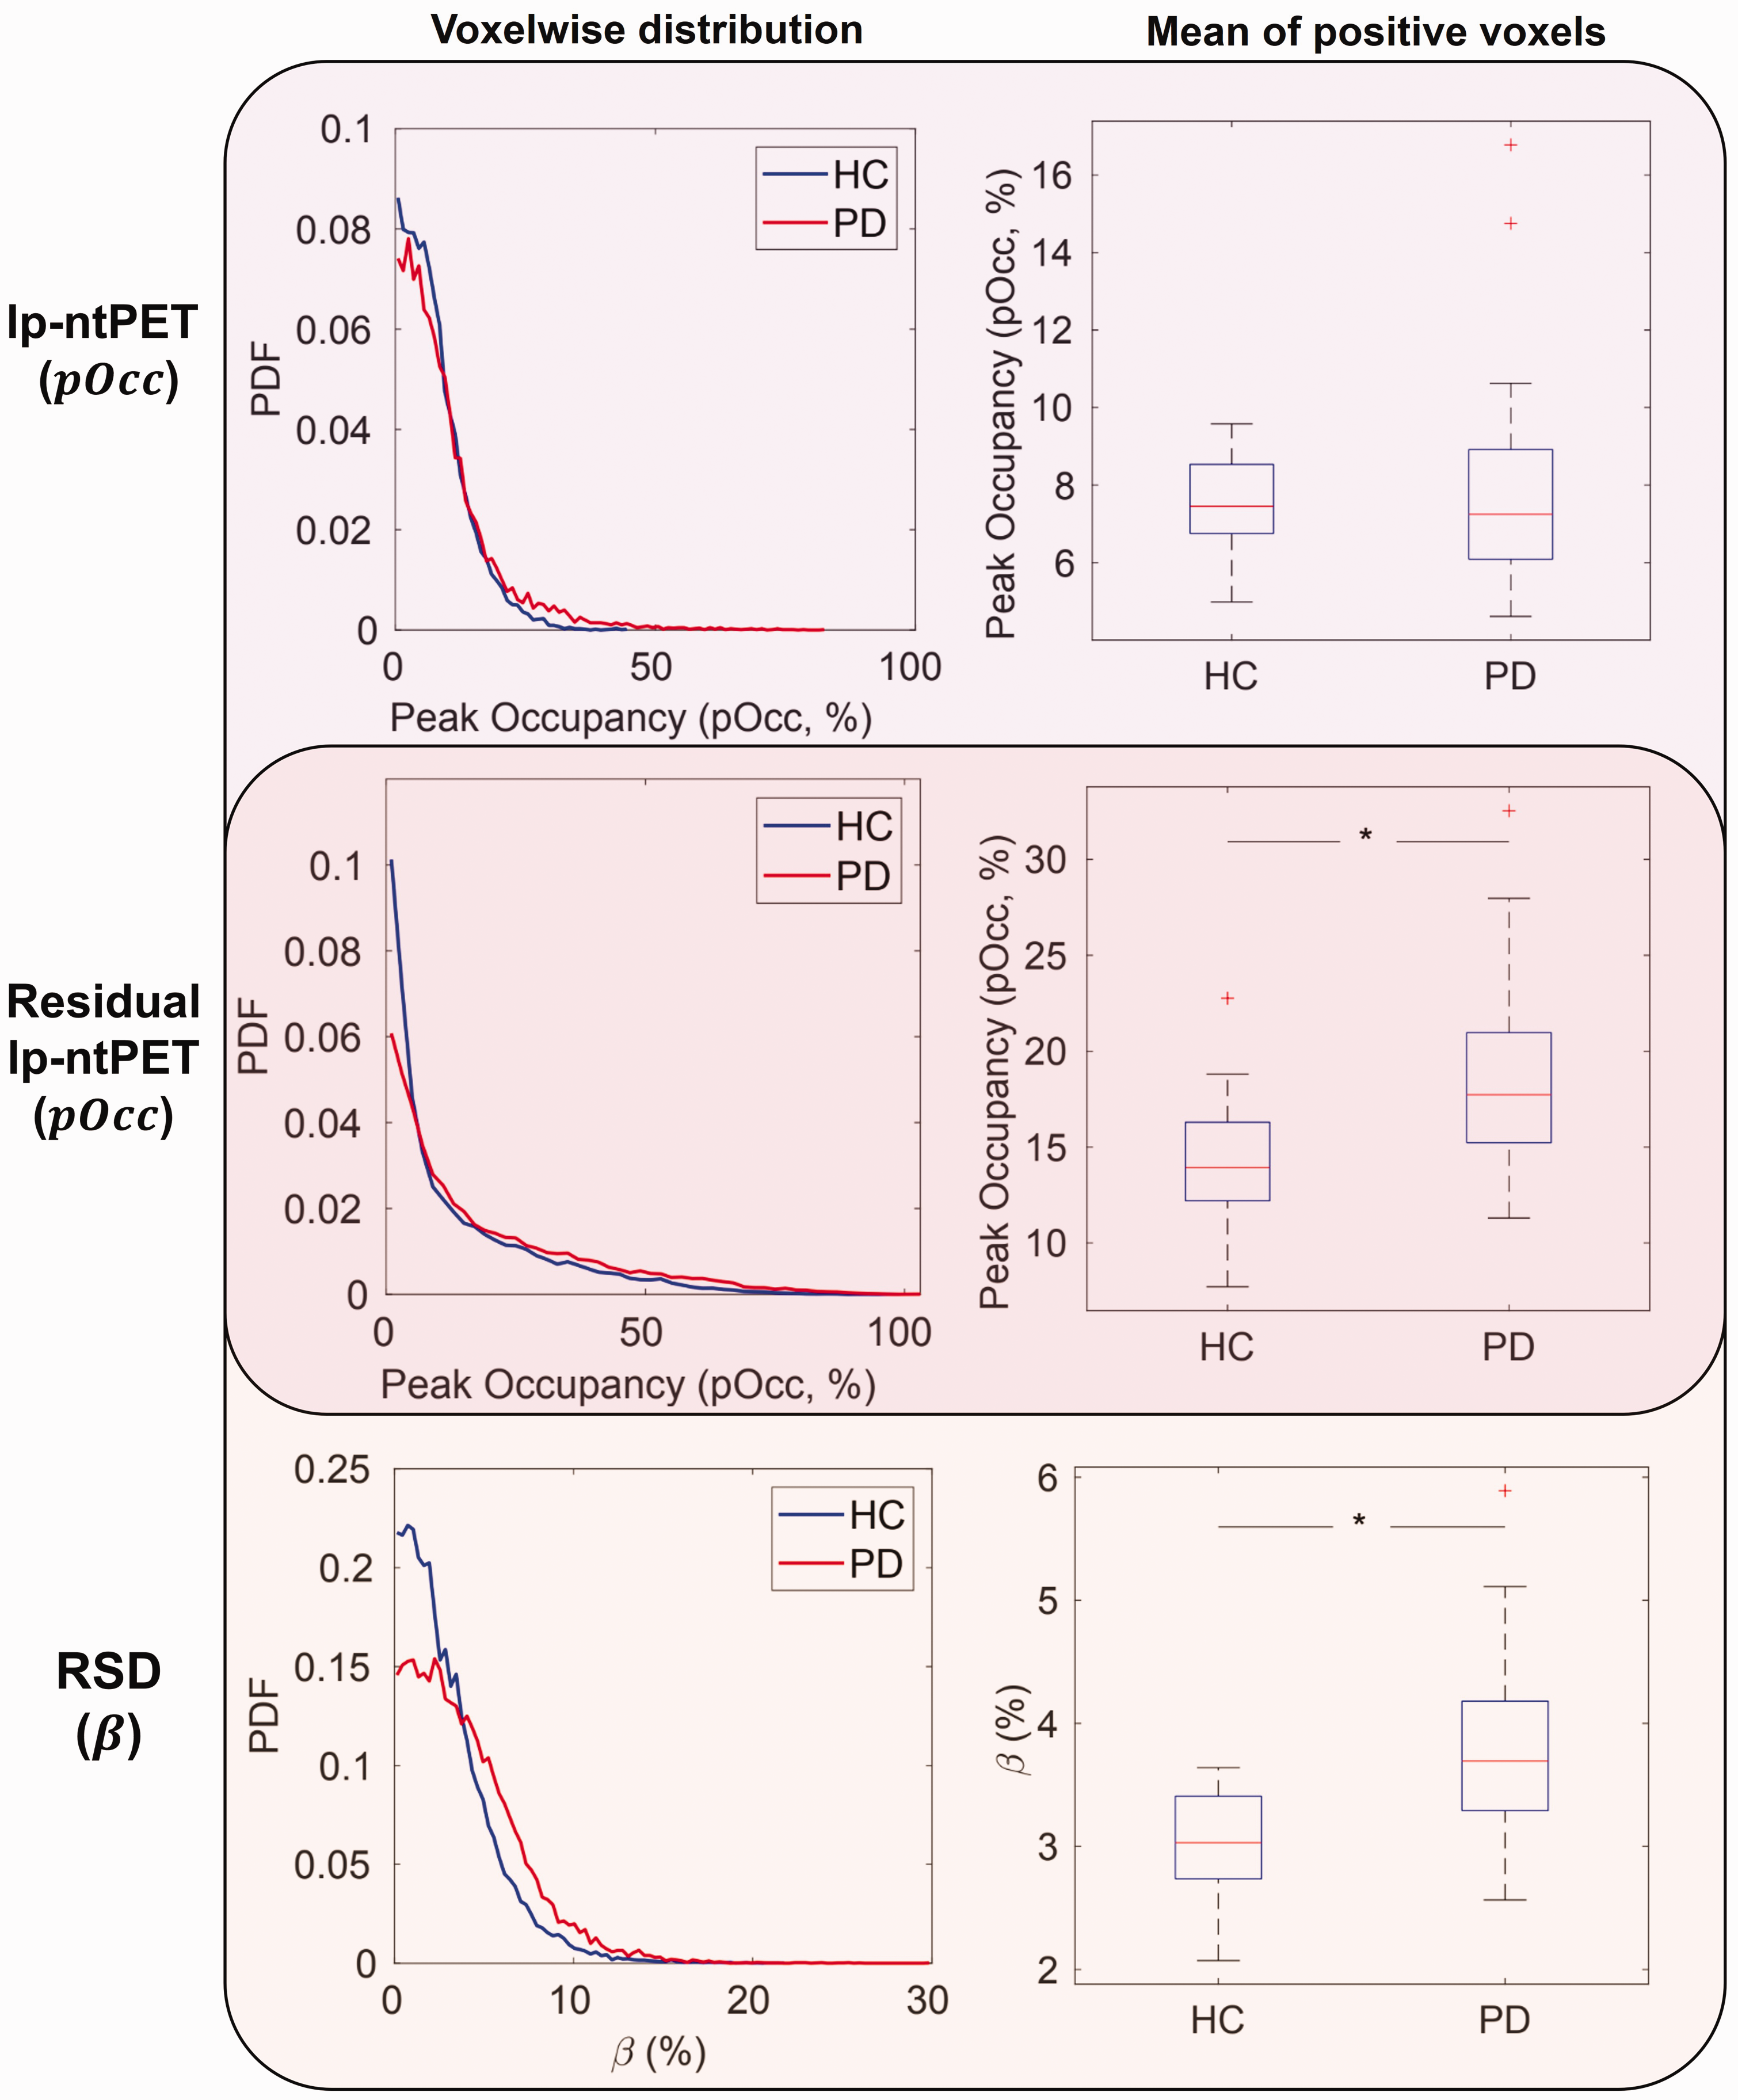
Comparison of metrics and use of residuals in humans. Peak occupancy (
Discussion
Simulations
RSD-Hybrid-IMRTM outperformed our previous approach, RSD-k-means, for all simulated scenarios of differing spatial release patterns. This improvement primarily stems from the solutions posed in Table 1, leading to more consistent and general baseline TAC predictions. lp-ntPET and RSD-Hybrid-IMRTM performed similarly for detecting global DA release as shown by the ROC curves of Figure 2(a), however localized release patterns were found more reliably with RSD-Hybrid-IMRTM, consistent with earlier results comparing lp-ntPET with RSD-k-means. 15
Quantitative tracking of DA release was also improved by RSD-Hybrid-IMRTM. Previous work using a Bayesian framework (b-ntPET)
36
produced similar improvements to quantitation compared with lp-ntPET, however there is an important distinction in that their work performed fitting on full-ROI TACs, while our results demonstrate that voxel-level quantitation of parameters in localized clusters can be done reliably with RSD. It is noted that release levels in this work (0–400 nM) are comparable to the range of displacement ratios from 0–10% as used in literature,
36
which corresponds to relatively low TAC alterations, and yet these subtle changes can be differentiated with
While both
Human scans
Spatial detection
In analyzing our human cohort, RSD-Hybrid-IMRTM found significant differences between HC and PD groups for both finger and foot tapping under a variety of analyses (Figure 4). Standard lp-ntPET fitting found generally similar differences as RSD-Hybrid-IMRTM between groups (Supplemental Figures 7 and 8). However, the interpretability of results is diminished compared with RSD-Hybrid-IMRTM, with higher levels of spatial noise in T-maps and probability maps, along with lower statistical power of T-maps and dice coefficients.
While there is no ground truth validation of these observed group differences, their existence is supported by the methodological improvements to baseline TAC and DA release metric predictions made in this work. Moreover, the observed group differences are also in accordance with results from the literature regarding DA activation in HC and PD: it was hypothesized that DA release in HC should predominantly manifest in the side contralateral to tapping, with ipsilateral activation expected to be present but to a lesser extent, 35 and this is indeed observed in the HC cohort (Figure 4(a)). PD subjects, on the other hand, primarily show activation in large clusters on their side ipsilateral to tapping, the spatial extent of which is largely similar for both tasks, possibly indicating a disease-compensatory release pattern that manifests independent of the type of motor function. 25 This is further supported by the overlap analysis in Figure 4(c) showing reduced functional segregation in PD, primarily on the ipsilateral side, which was robust across various sparsity thresholds. An in-depth discussion and physiological interpretation of the results obtained from the human study are outside the scope of this paper; these data are part of a larger study (manuscript in preparation) and were used here only to test the performance of the proposed methods with real human data.
The issue of false positives for human studies is typically addressed on the single-subject level with a cluster size threshold (CST) which removes clusters from a binary map with fewer voxels than the CST.7,8 For this work we forewent use of a CST in order to preserve small clusters with the potential of group-level significance within T-maps. For the dice analysis of Figure 4(c), randomly distributed false positive clusters may systematically decrease dice coefficients, though due to their presence in all scans it is not expected to affect the interpretation of group comparisons. Moreover, at higher sparsity values it is unlikely that false positives contribute significantly as their
Utility of residual space
The determination of baseline TACs with RSD acts to isolate the DA-related signal in voxel TACs by transforming relevant information contained in TACs to a residual space. While the primary metric used in this work,
Parameter estimation and basal DA
Considerations must be made when comparing results across different subject groups. As shown in Supplemental Figure 3, TAC-level metrics that vary with absolute DA release magnitude (e.g.
Supplemental Material
sj-pdf-1-jcb-10.1177_0271678X251362958 - Supplemental material for A generalized framework for in vivo detection of dopamine release using positron emission tomography
Supplemental material, sj-pdf-1-jcb-10.1177_0271678X251362958 for A generalized framework for in vivo detection of dopamine release using positron emission tomography by Jordan U Hanania, Connor WJ Bevington, Ju-Chieh (Kevin) Cheng, Dongning Su, Alexandra Pavel, A. Jon Stoessl and Vesna Sossi in Journal of Cerebral Blood Flow & Metabolism
Footnotes
Data availability statement
Funding
The author(s) disclosed receipt of the following financial support for the research, authorship, and/or publication of this article: This work was supported by the Natural Sciences and Engineering Research Council grant (240670-13) and the Pacific Parkinson’s Research Institute. TRIUMF is supported by the National Research Council Canada.
Acknowledgements
The authors thank TRIUMF staff for preparation of the radiotracers and the UBC PET/MRI Imaging Centre nurses and technologists for their assistance during the human scans.
Declaration of conflicting interests
The author(s) declared no potential conflicts of interest with respect to the research, authorship, and/or publication of this article.
Authors’ contributions
Jordan U. Hanania: Conceptualization, Data curation, Formal analysis, Methodology, Software, Visualization, Writing – original draft. Connor W.J. Bevington: Conceptualization, Data curation, Formal analysis, Methodology, Software, Writing – review & editing. Ju-Chieh (Kevin) Cheng: Formal analysis, Writing – review & editing. Dongning Su: Formal analysis, Software, Writing – review & editing. Alexandra Pavel: Investigation, Resources. A. Jon Stoessl: Conceptualization, Supervision, Resources, Funding acquisition, Writing – review & editing. Vesna Sossi: Conceptualization, Supervision, Validation, Resources, Funding acquisition, Writing – review & editing.
Supplemental material
Supplemental material for this article is available online.
References
Supplementary Material
Please find the following supplemental material available below.
For Open Access articles published under a Creative Commons License, all supplemental material carries the same license as the article it is associated with.
For non-Open Access articles published, all supplemental material carries a non-exclusive license, and permission requests for re-use of supplemental material or any part of supplemental material shall be sent directly to the copyright owner as specified in the copyright notice associated with the article.