
Abstract
Current methods using a single PET scan to detect voxel-level transient dopamine release—using F-test (significance) and cluster size thresholding—have limited detection sensitivity for clusters of release small in size and/or having low release levels. Specifically, simulations show that voxels with release near the peripheries of such clusters are often rejected—becoming false negatives and ultimately distorting the F-distribution of rejected voxels. We suggest a Monte Carlo method that incorporates these two observations into a cost function, allowing erroneously rejected voxels to be accepted under specified criteria. In simulations, the proposed method improves detection sensitivity by up to 50% while preserving the cluster size threshold, or up to 180% when optimizing for sensitivity. A further parametric-based voxelwise thresholding is then suggested to better estimate the release dynamics in detected clusters. We apply the Monte Carlo method to a pilot scan from a human gambling study, where additional parametrically unique clusters are detected as compared to the current best methods—results consistent with our simulations.
Introduction
Detection of stimulus- or task-related dopamine (DA) release is relevant for investigating neurodegeneration or response to reward/learning in both healthy subjects and those with pathological conditions such as addiction. A double [11C]raclopride (RAC—a D2 receptor antagonist) scan protocol, with one scan performed at baseline and the second after intervention, is often used to estimate the intervention-induced DA release.1,2 This approach, however, requires the dopaminergic system to be in steady-state and is not well-suited to determine transient release. An alternative approach using the linear parametric neurotransmitter PET model (lp-ntPET) 3 has been developed for this purpose: here a subject is scanned in a baseline state during tracer uptake, then presented with a task or stimulus approximately mid-scan; a transient increase in synaptic DA concentration corresponds to a transient decrease in the RAC time activity curve (TAC), which is modeled using lp-ntPET. This approach has been applied on a voxel-level,4,5 where voxel TACs are fit with two kinetic models: the multilinear reference tissue model (MRTM), 6 which does not incorporate a DA-induced perturbation in its modeling, and lp-ntPET, which does. A voxelwise comparison of the two fits using an F-test followed by significance thresholding yields a binary (not necessarily contiguous) significance mask indicating voxels of significant release. To further control for false positives, a voxel cluster size threshold (CST)4,5,7 is imposed, such that all clusters containing a number of voxels lower than the threshold size are removed. The CST thus defines the smallest detectable DA release structure.
The resultant significant clusters constitute data-defined regions of interest (ROI). The ROI-level transient release patterns elucidate unique release dynamics in the corresponding subregions of the brain; one may observe release associated with anticipation of a reward in the ventral striatum,8–10 or in the dorsal striatum from learning stimulus-action-reward associations.11–13 Previous work verified the efficacy of the voxelwise method in a smoking study, where sex differences in the location, timing, and magnitude of the DA response to smoking were found. 14
As we shall show, this approach is well-suited to detecting relatively large clusters containing relatively high DA release. However, smaller clusters containing lower release are often not detected by either the initial significance thresholding or the subsequent CST; the small signal changes are often obscured by noise and biased by partial volume effects (PVE), resulting in a subset of true release voxels having F-values below the significance threshold.
This motivated the design of a novel Monte Carlo (MC) approach that allows detection of DA release in voxels below the significance threshold—provided that the voxel behavior meets a priori criteria incorporated into a cost function. Through simulating short-lived DA release of various magnitudes, we compare the detection sensitivity (i.e. true positive rate) and parametric accuracy of the standard F-test-based method (denoted “standard” method) and the MC method. We demonstrate that the MC method can be tailored to increase detection sensitivity without increasing the CST. Additionally, since the MC method does not modify the image data, the voxel-level parametric accuracy is preserved by definition.
In such a voxelwise approach, the aim is to detect neurophysiological changes on the smallest possible volume—the voxel—yet the CST reintroduces a regional constraint on detectability. Relatively large regions with low release may also not satisfy the CST requirement, since only a portion of the region affected by DA release may be detected. It has been demonstrated that image denoising can be applied to increase detection sensitivity; however, this further increases the CST through correlating neighbouring voxels, hence extending the size of pre-existing false positive clusters.5,15 Thus, minimizing the CST is essential for ensuring regions small in size and/or having low release are reliably detected. Parametric accuracy within these clusters is also paramount to accurately compare the release dynamics subregionally, between different study cohorts, or in response to different stimuli.
In this work, we begin by assessing the CST and sensitivity in the standard method through simulation of two RAC scans. We then apply the MC method to the same simulations to demonstrate its improved performance over the standard method. Finally, we verify the efficacy of the MC method beyond our simulations by comparing the results of the standard and MC methods applied to a pilot scan from a human DA release-inducing gambling study. With the ground truth unknown in this case, the results are evaluated in terms of consistency with observations from the simulations.
Theory
Kinetic modelling
In a single-scan protocol to detect transient DA release, the voxel-level RAC TACs are fit with two kinetic models. The first, MRTM, assumes the system is in steady-state, and thus does not model system responses to transient DA release

The second model, lp-ntPET, adds an additional term accounting for transient decreases in the TAC due to DA release

The decrease in RAC binding (and hence

Together, these metrics serve as physiological proxies for the magnitude and temporal characteristics of DA-induced system responses.
Significance and cluster size thresholding
After fitting with MRTM and lp-ntPET, a voxelwise F-test is computed using the weighted residual sum of squares for each fit. TACs indicative of DA release are assumed to be significantly better fit by lp-ntPET. The probability that the additional transient term in lp-ntPET provides a better fit is given by the cumulative distribution function evaluated at the F-value. Significance thresholding at some probability, corresponding to some
A novel Monte Carlo method for improving detection sensitivity
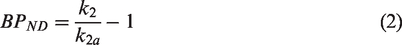
All voxels not passing the F-test significance threshold or the CST are classified as baseline voxels. The F-test assumes the F-values of all baseline voxels follow an F-distribution. In simulations of scans with both baseline and release voxels where the ground truth was known, the distribution of F-values from true baseline voxels closely follows the theoretical F-distribution, but the distribution of F-values from voxels classified (not necessarily correctly) as baseline by the detection algorithm do not, due to a large number of false negatives (Figure 1(a)). While relatively high voxel-level noise is primarily responsible for these false negatives, the problem is exacerbated by PVE correlating release voxels with nearby baseline voxels. In such voxels, the temporal pattern is contaminated by the pattern from the neighbouring baseline voxels—diminishing the DA-induced decrease in the TAC—ultimately making them harder to detect.
(a) Histogramming the F-values of ground truth baseline (i.e. non-release) voxels from simulations containing clusters of DA release, as well as the F-values of the voxels classified (not necessarily correctly) as baseline voxels by the standard detection algorithm. (b) Two representative coronal slices of the parametric
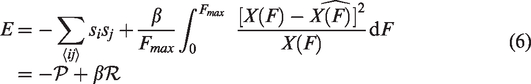
The problem, then, is to find a binary local clustering of release voxels with the global classification state of baseline voxels obeying an F-distribution. To solve this, we borrow the mathematics of MC approaches used in Ising spin models of ferromagnets.17–19 Theoretically, such models are similar: in the Ising model, clustering of neighbouring spins is promoted under the constraint of the global states obeying a Boltzmann distribution. Here we replace the spins with voxels and the Boltzmann distribution with an F-distribution. Let us denote a release voxel as having the state
We use the following iterative method, leveraging the MC Metropolis algorithm,18,19 to find the minimum of E. The method begins by initializing each voxel in a brain region randomly with Choose a voxel at random
1
and set Compute If If If Repeat for all other voxels.
This constitutes one iteration of the algorithm. We accept changes according to
As we shall show, the algorithm reaches a stable minimum cost function value after a few iterations. In subsequent iterations, likely global states—under the constraints of the cost function—are shuffled through probabilistically (introducing small oscillations in the value of the cost function), so that the percentage of iterations a voxel has
Since there is no theoretical confidence interval for
Methods and materials
Simulation design
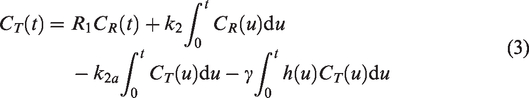
To compare the MC method to the standard method, we devise two RAC simulations (Figure 1(b) to (d)):
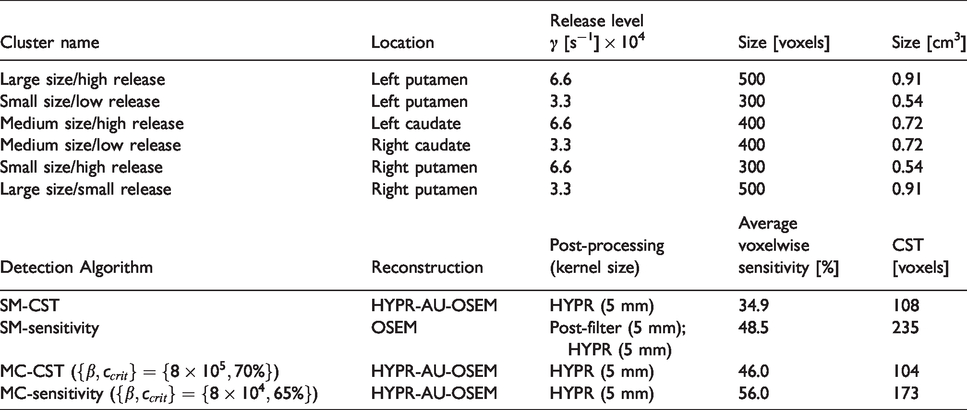
Detection algorithm and cluster naming conventions.
We generate the simulations from measured data of a healthy control RAC scan. The subject was scanned in the baseline state for 75 min after a 16 mCi bolus injection on the Siemens High Resolution Research Tomograph (HRRT).
20
An anatomical MRI was acquired on a Philips Achieva 3 T scanner, which was segmented into 41 regions using Freesurfer (surfer.nmr.mgh.harvard.edu).21–24 The segmented MRI image and the RAC image were co-registered using SPM12 (Wellcome Centre for Human Neuroimaging, https://www.fil.ion.ucl.ac.uk/spm/software/spm12), allowing us to compute regional TACs. Each TAC was fit using SRTM2
25
and the obtained kinetic parameters were used to generate noiseless TACs assigned to the voxels of each region. To simulate voxel-level TACs with DA release, we modified the baseline TACs using lp-ntPET with
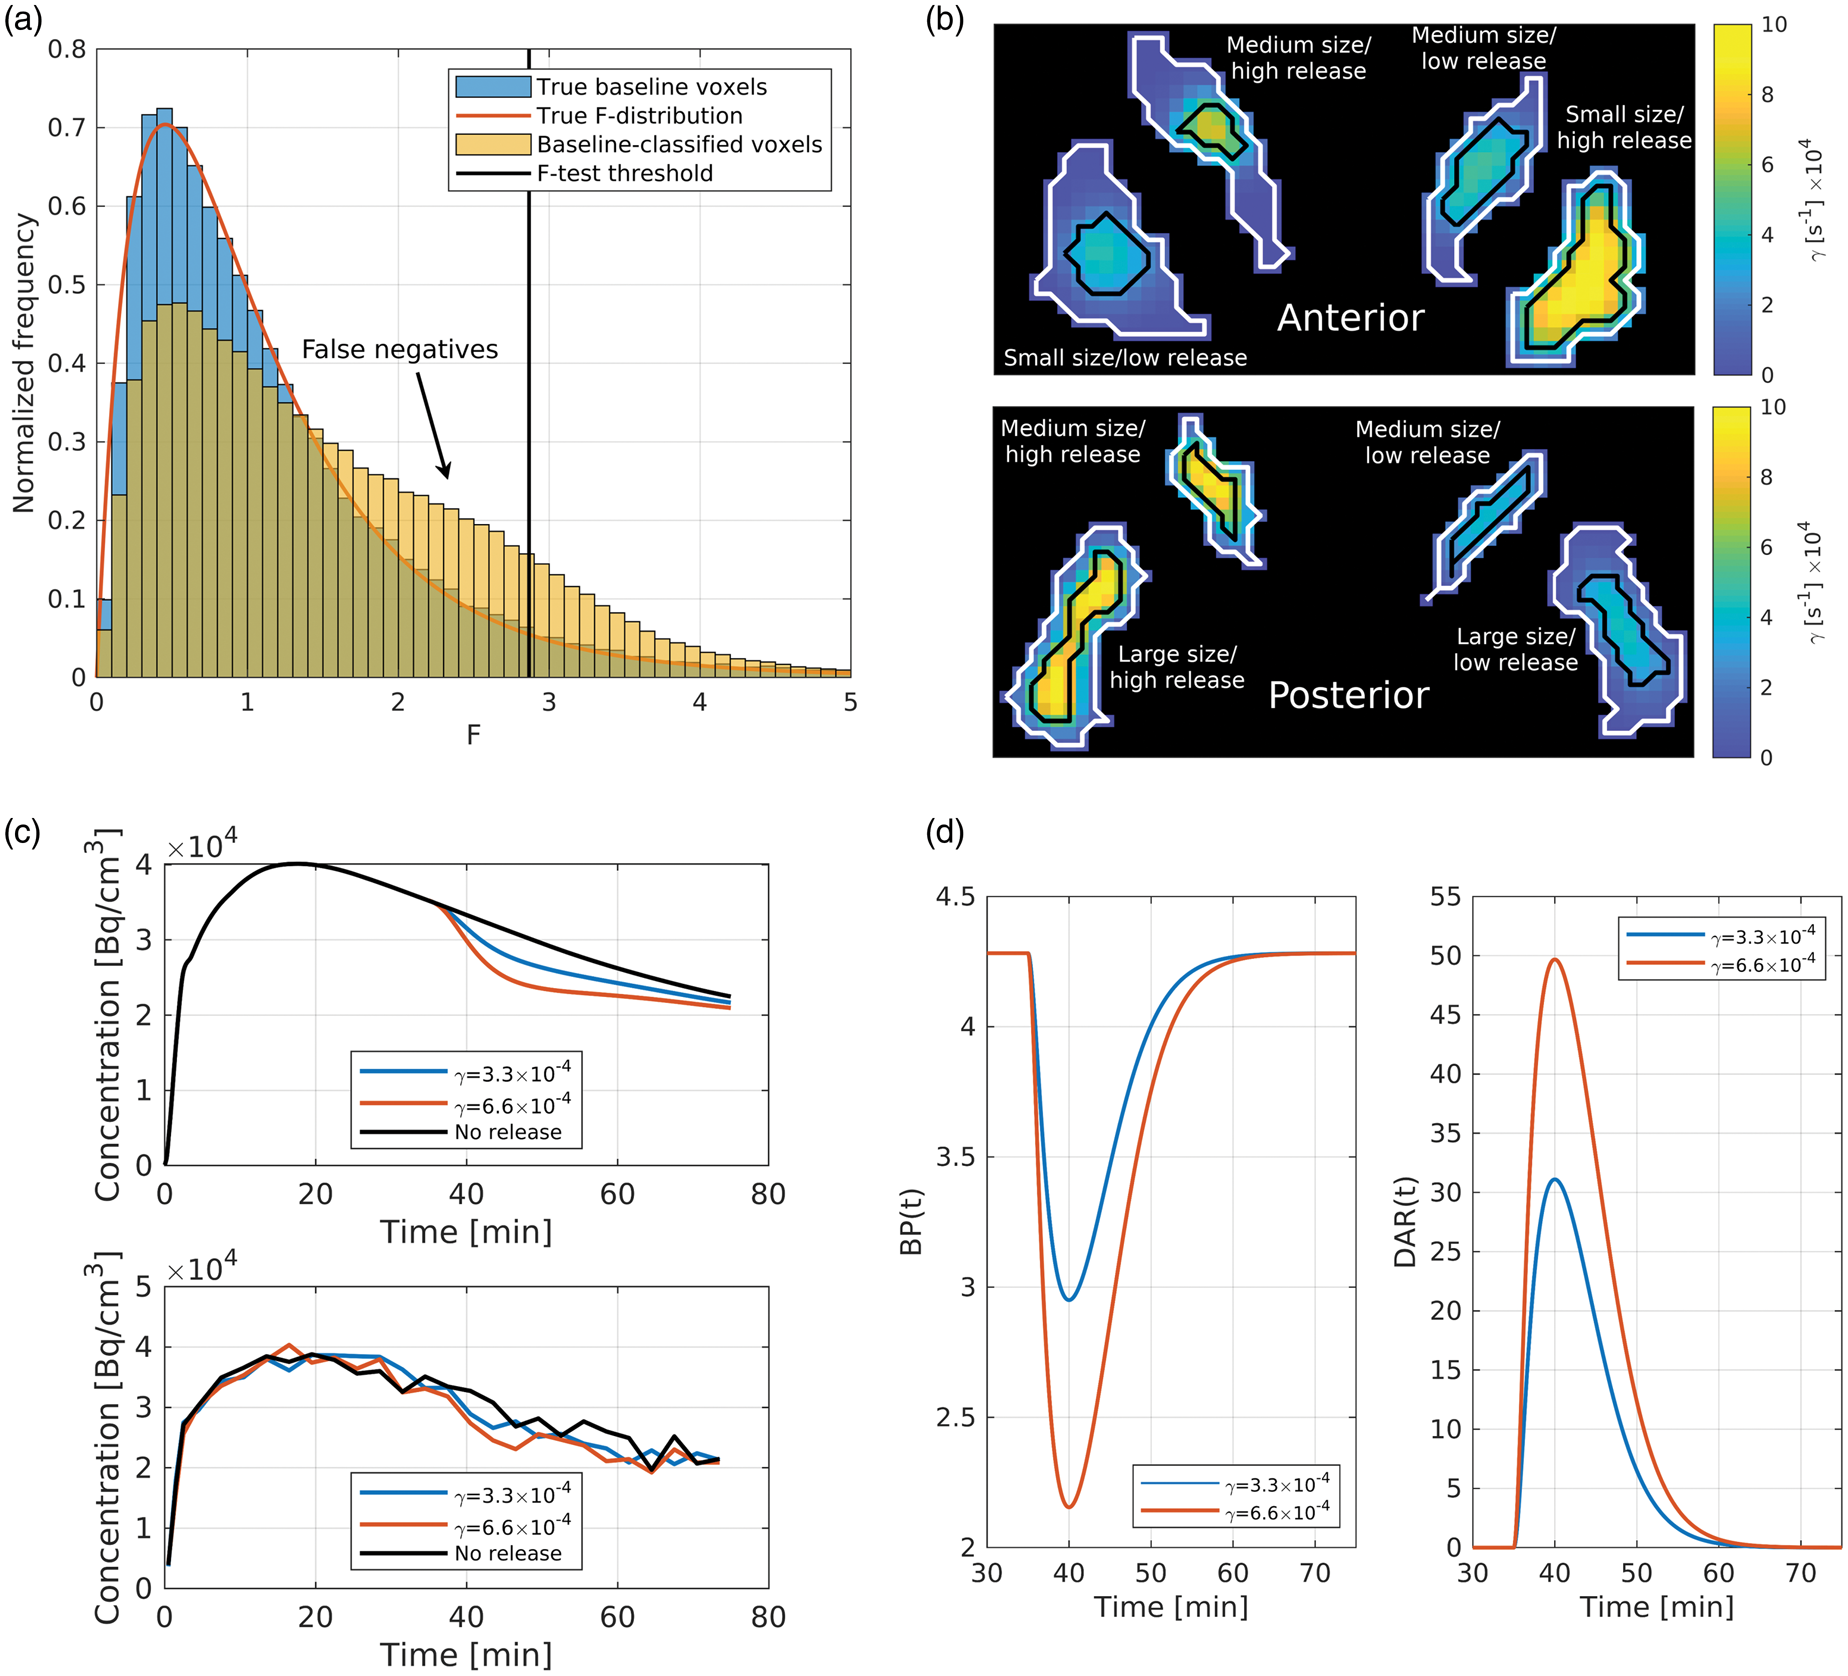
The release and baseline TACs were discretely sampled to 27 frames (1 min × 3, 3 min × 24), forming a noiseless dynamic dataset. These images were then filtered using a 2.5 mm isotropic Gaussian to simulate the point spread function (PSF) of the HRRT. These filtered noiseless images serve as our ground truth, as no PSF-modeling is included in our reconstructions. From here the images are forward-projected while including the effects of attenuation (from the attenuation map of the healthy control), detector normalization, and frame duration. Poisson noise is added to the obtained noiseless sinograms, which are then reconstructed and post-processed; 50 noisy realizations are generated for each simulation.
Previous work generated noisy simulations by adding Gaussian noise scaled to the noise levels observed on the HRRT scanner to noiseless TACs (i.e. directly in image space, thus not simulating the effects of the PSF, attenuation, normalization and reconstruction).4,5 We also add noise to our noiseless dataset in this manner (hereafter: “Gaussian noise” simulations) to evaluate consistency with published results and the effect of our more accurate data modeling on detection sensitivity outcomes.
Reconstruction and denoising protocols
Previously, 15 we found that the standard method can be optimized for sensitivity (SM-sensitivity) when the input images are reconstructed with Ordinary Poisson OSEM 26 (OP-OSEM: 16 subsets, 6 iterations), followed by a 5 mm Gaussian filter and 5 mm HighlY constrained backPRojection (HYPR) post-processing 27 for noise reduction. This maximized sensitivity comes with the trade-off of high CST and low parametric accuracy. Conversely, the standard method can be optimized for CST (SM-CST) by using a denoised reconstruction applying the HYPR operator after each update of OSEM, HYPR-AU-OSEM, 28 with a 2.5 mm kernel size followed by 5 mm HYPR post-processing, producing images with high parametric accuracy, but low detection sensitivity.
We thus apply the MC method to the HYPR-AU-OSEM images only, in an effort to maintain high parametric accuracy and low CST, while increasing the sensitivity to levels comparable to SM-sensitivity. In summary, there are two reconstruction method used for the standard method, and a single for the MC method.
Optimizing the MC method
In optimizing
Since the algorithm employed in the MC method is non-deterministic, we want to ensure that the metric of interest (detection sensitivity) has low variability after multiple trials of the same input (parametric F image). This was done by running 100 trials of the MC method applied to a single noisy realization of the cluster release simulation and taking the mean and standard deviation of the sensitivities found.
Analysis workflow
Analysis of the simulated noisy baseline data is first performed to compute the CST for each method. We adopt the previously published workflow4,5: each striatal voxel TAC is fit with MRTM and lp-ntPET, with 819 basis functions for lp-ntPET constructed from permutations of
Fits are applied using weighted linear least squares. Since HYPR post-processing uses a composite image formed from a sum of the decay-uncorrected dynamic frames to denoise each frame, we assume each decay-uncorrected denoised frame should have roughly equal noise levels. Taking this information into consideration, we use an “uncorrected” weighting scheme which performs ordinary least squares fitting on the uncorrected TACs.
Consistent with the previously published workflow, we continue by computing voxelwise F-values.
3
For the standard F-test method, we threshold at
With the CST determined, the same analysis is applied to the cluster release simulations to determine significant clusters of release. When analyzing each of the six clusters, we compute the voxelwise sensitivity: the voxel-level true positive rate, and binary sensitivity: the percentage of realizations in which any portion of the true release cluster is detected.
5
We then assess parametric accuracy and precision in the detection of the release dynamics. First, the mean absolute error (MAE) of
Further parametric thresholding
Anticipating that voxel-level 
The same operation is applied to the parametric
This approach may additionally be able to separate parametrically unique clusters that have been merged by PSF- or post-processing-induced PVE; in the “bridge” connecting the two clusters, there will exist a spatial gradient in timing parameters. Consequently, the absolute average deviation will be higher along the bridge, making these voxels more likely to be rejected by the parametric threshold.
Application to a human gambling study
To verify the performance of these methods on real human data, we analyze a pilot scan for a human study with the Vancouver Gambling Task 29 as the mid-scan stimulus. The subject was given a 20 mCi bolus RAC injection and was presented with the task 36 min into a 75 min scan on the HRRT. The same reconstruction methods were used as discussed, and the reconstructed data were corrected for detector normalization and dead-time, attenuation, scatter, randoms, and radioactive decay. Framing was 1 min × 5, 2 min × 5, 3 min × 20. An anatomical MRI was acquired on the Philips Achieva 3 T. A rigid inter-frame realignment was performed on the PET images using SPM12, before resampling the MRI to PET space and segmenting the striatum using Freesurfer.
Results
Determining
and
in the MC method
For each tested value of
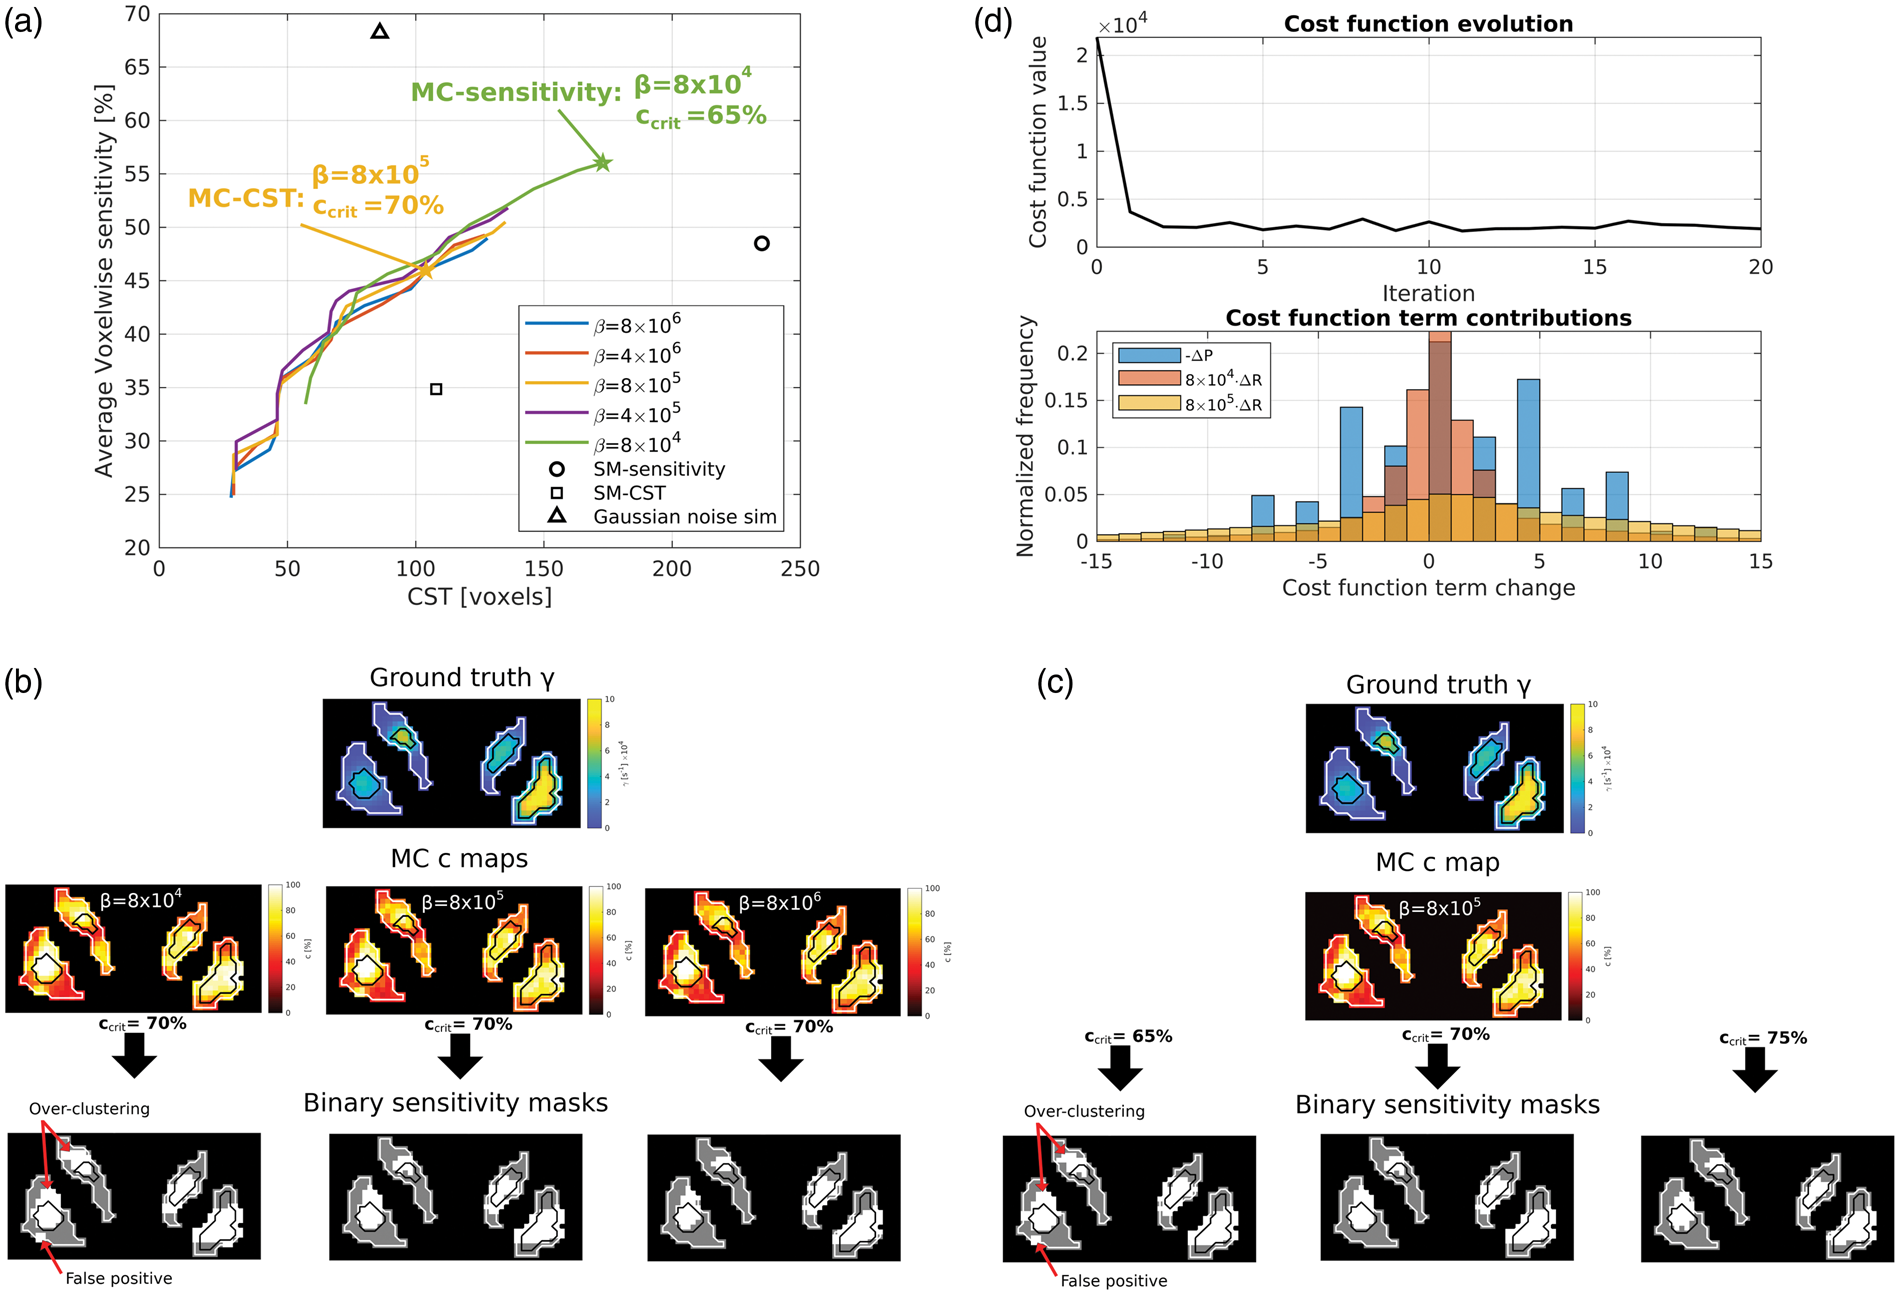
(a) Voxelwise sensitivity (averaged over all clusters in the cluster release simulation) as a function of CST for various values of
The effect of
Thus, we proceed by optimizing the MC method in a manner similar to the standard method: by using
Demonstrating cost function equilibrium and reproducibility of the algorithm
The cost function tends to reach a constant minimum value by the third iteration (Figure 2(d)). We thus use 100 subsequent iterations to calculate parametric
After running 100 trials of MC-CST on a single noisy realization of the cluster release simulation, we found a voxelwise sensitivity of
Cluster release simulation: Sensitivity
The MC methods outperform the standard methods in terms of voxelwise and binary sensitivity (Figure 3(a) to (c)). The gains are visually (Figure 3(a)) and quantitatively (Figure 3(b)) highest in the low release clusters—regardless of size; an increase of 57% is observed from SM-sensitivity to MC-sensitivity, and 43% from SM-CST to MC-CST. In the high release clusters, these improvements are 5% and 16%, respectively. As well, MC-sensitivity can be compared to SM-CST, since they use the same input images: here the improvements are 149% in low release clusters and 38% in high release clusters (Figure 3(b)), though with the trade-off of a 60% increase in CST. However, this is less than the 118% increase in CST when comparing SM-sensitivity versus SM-CST—both of which perform worse in terms of sensitivity.
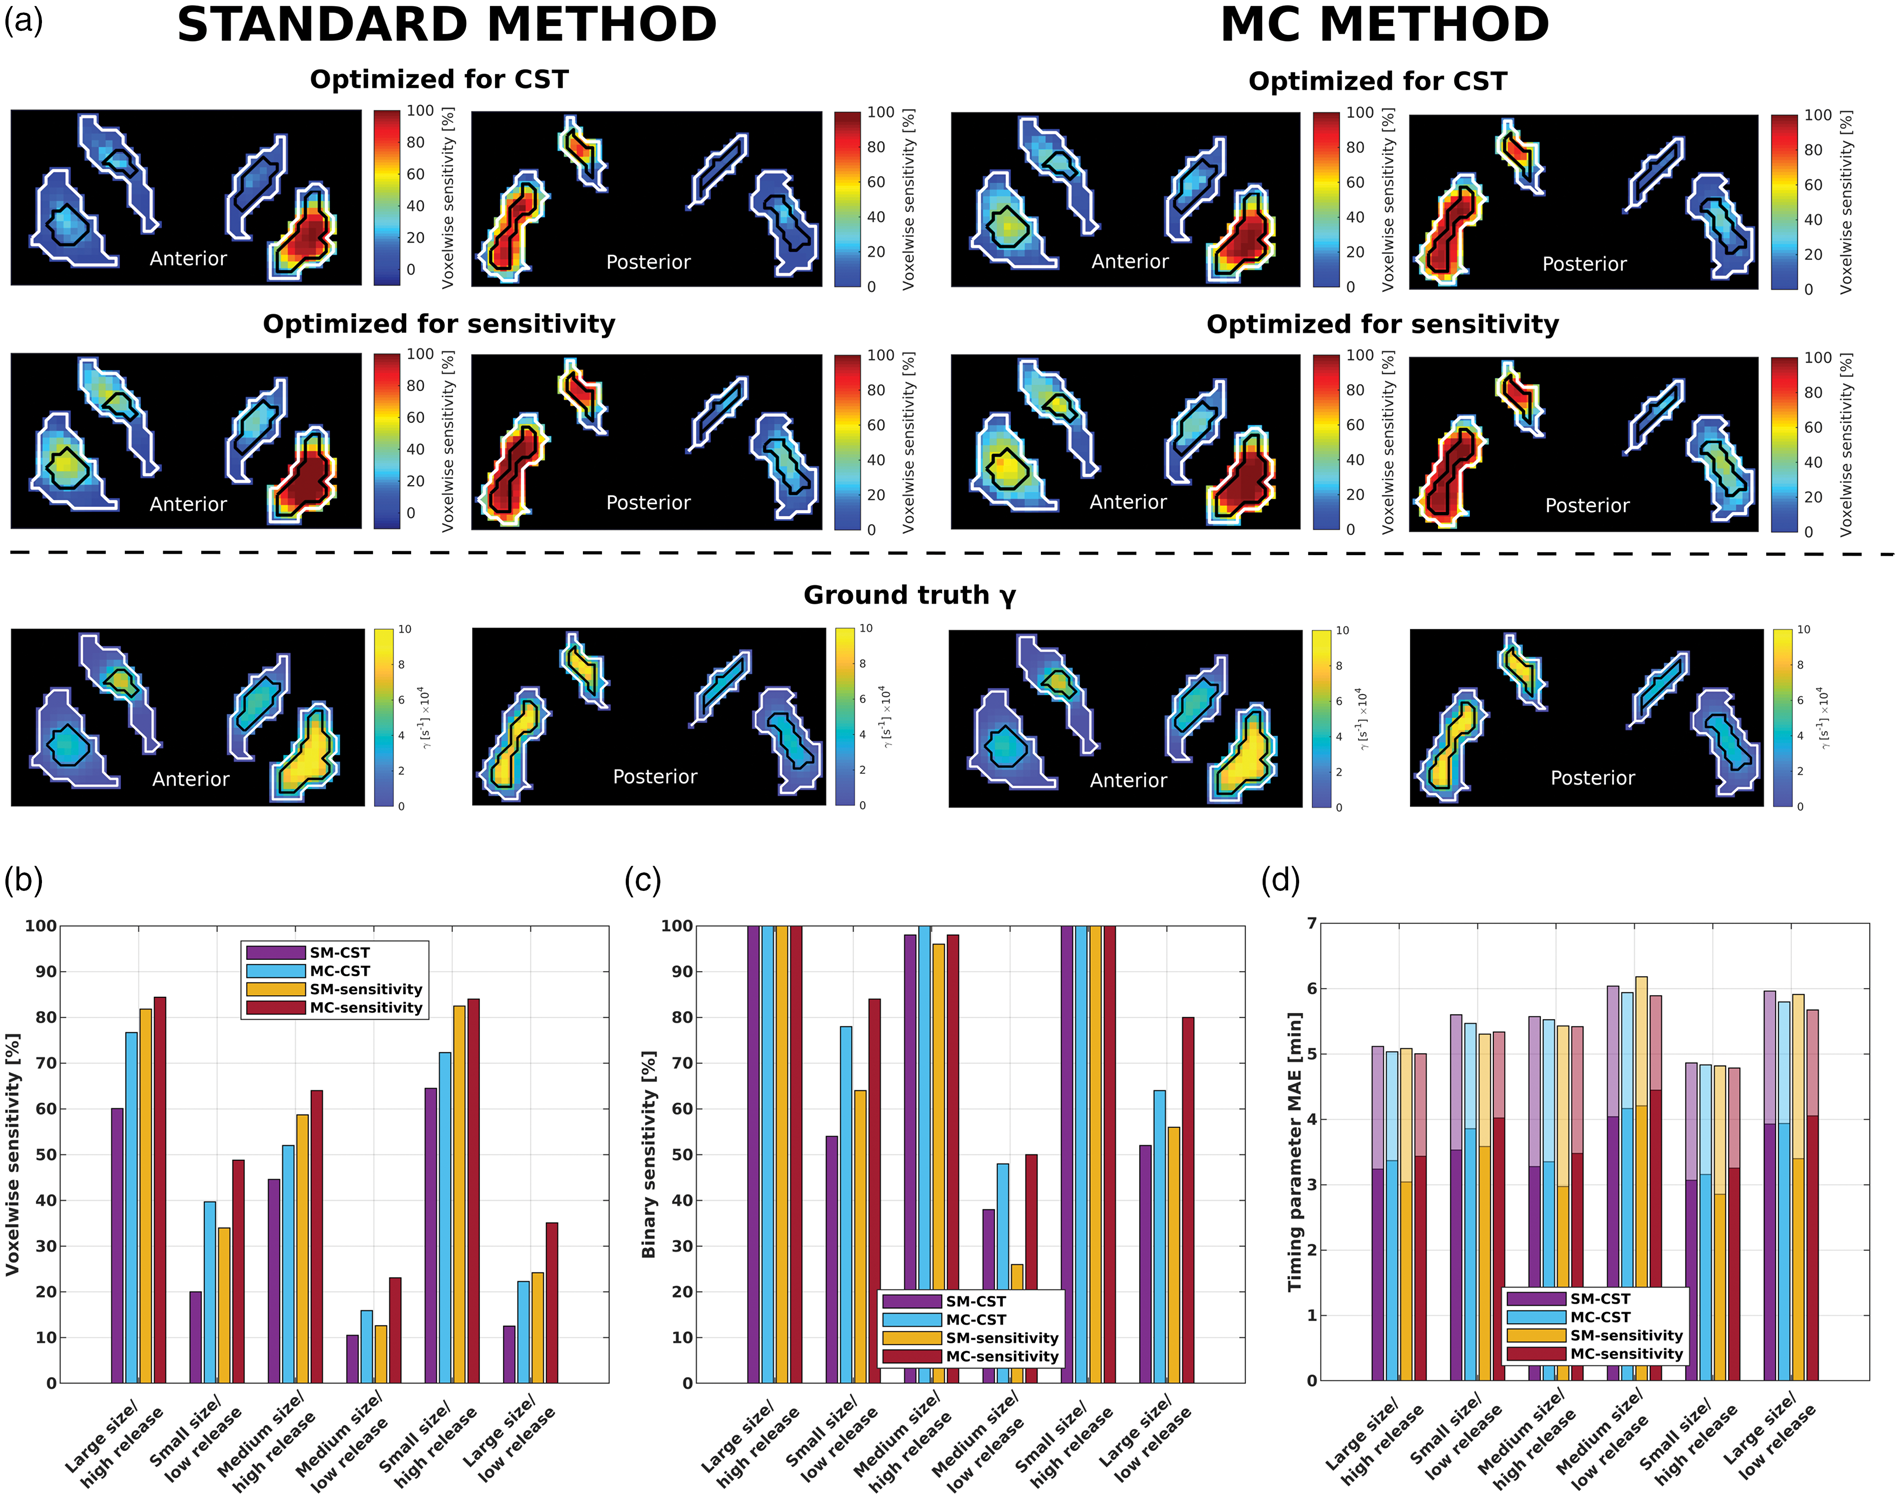
(a) Two representative coronal slices of the voxelwise sensitivity maps for each method in the cluster release simulation, alongside the ground truth maps of
More importantly, as compared to the standard method, the MC method raises binary sensitivity in the lower release clusters to an average of 82% from an average of 60% in the putamen and to 50% from 26% in the caudate when comparing MC-sensitivity with SM-sensitivity (Figure 3(c)), meaning the probability of completely missing a low release cluster in any given scan is markedly decreased. The cluster size or striatal location (i.e. putamen or caudate) does not appear to have an effect on the degree of improvement in the MC methods.
Cluster release simulation: Parametric accuracy
Over all methods,
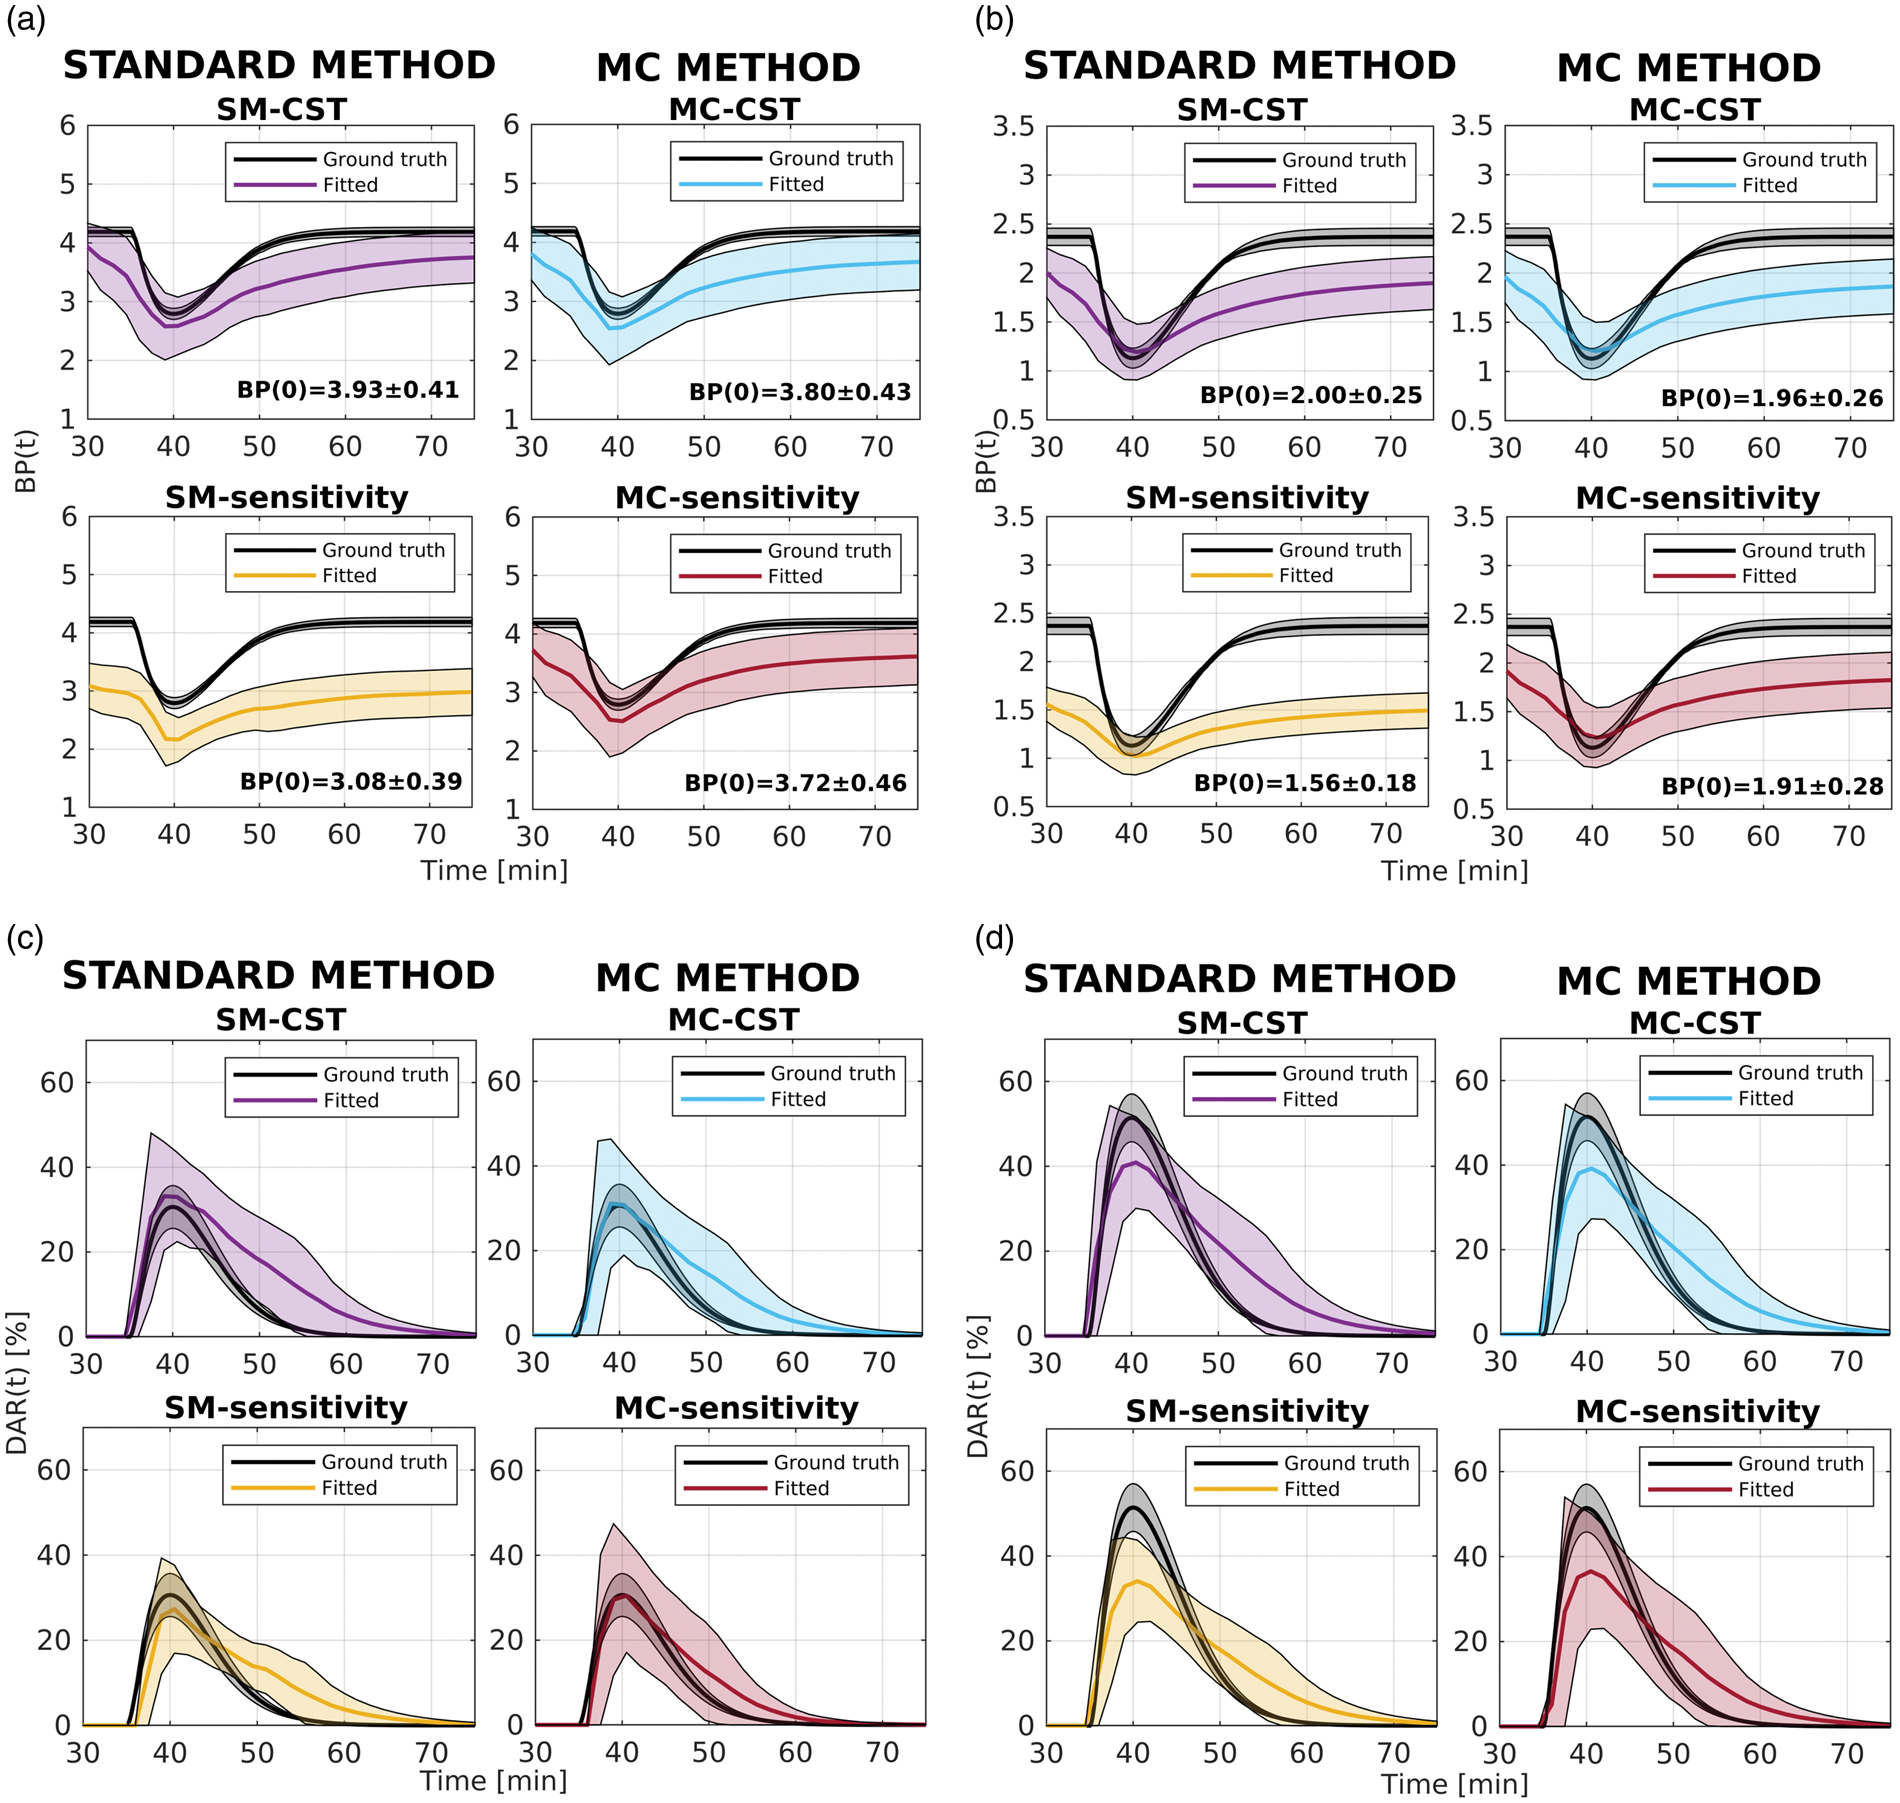
After applying voxelwise parametric thresholding, overall the new
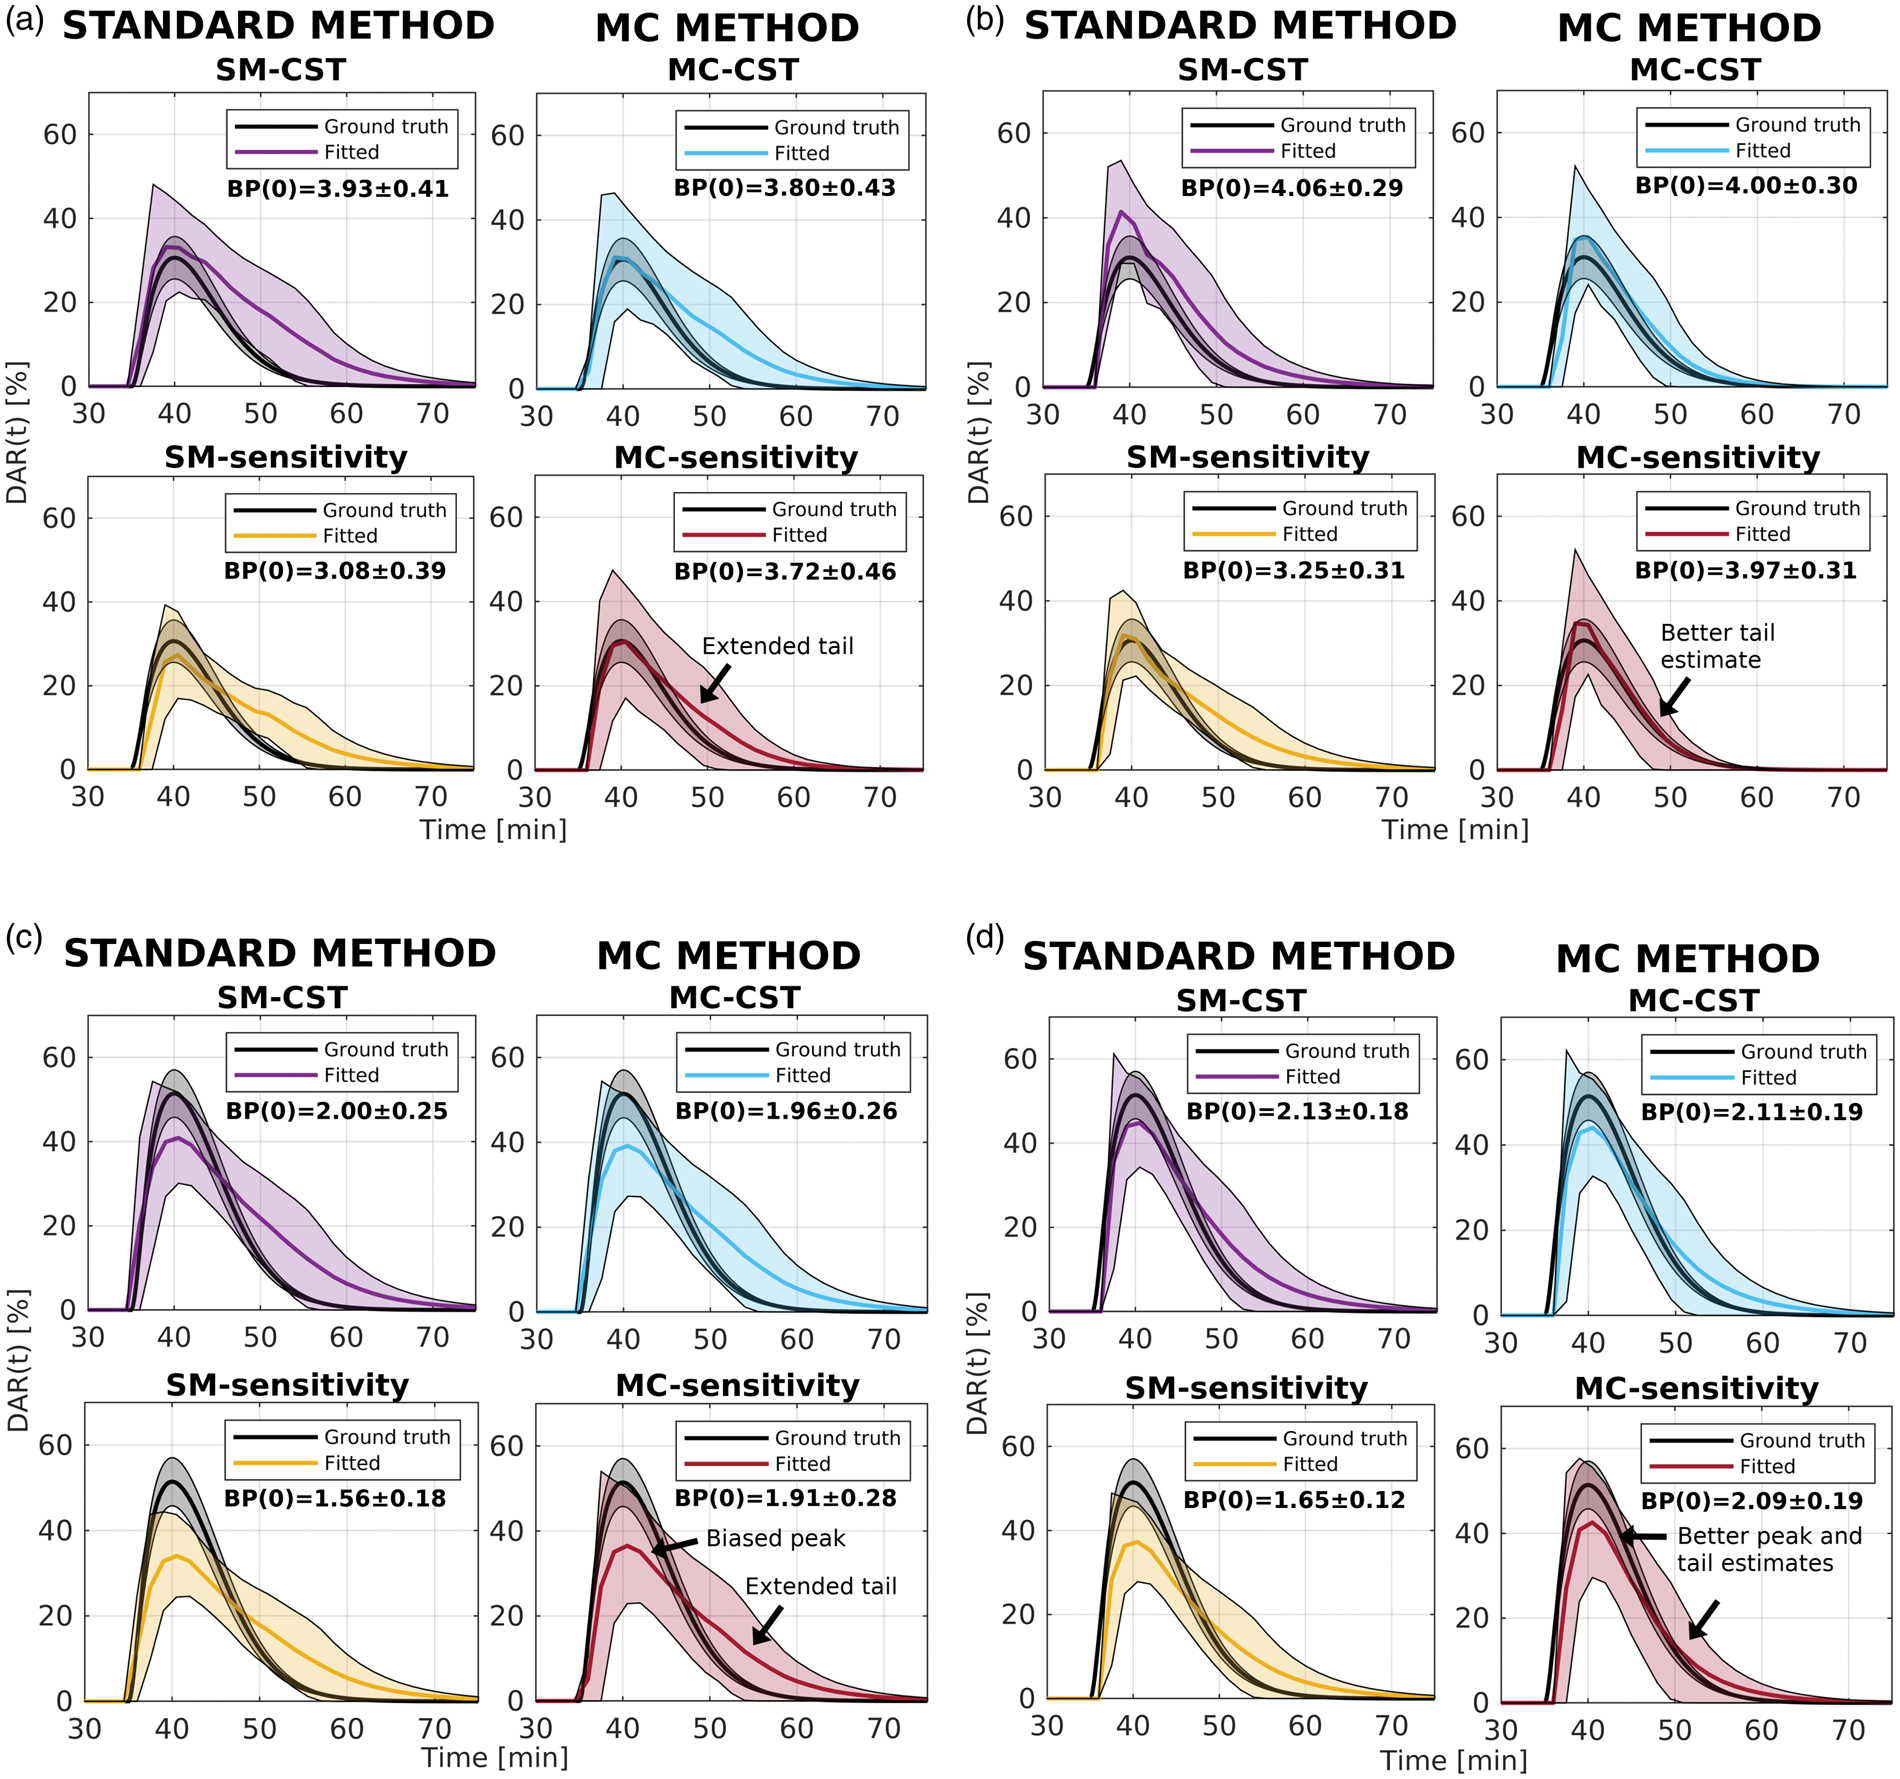
Again, the MC methods have similar biases to SM-CST and still outperform SM-sensitivity, in terms of overall accuracy in
Application to a human gambling study
In our single human dataset, provided the CST has completely removed all false positive clusters (a 90% probability of being true), the standard and MC methods followed by parametric thresholding detect seven clusters of release in response to the gambling task (Figure 6(a)): four peaking around the time of intervention (clusters 1 (right caudate), 2 (right putamen), 3 (left putamen), and 4 (caudate)); two initiating at 50 min—the end of the task—and peaking ∼5 min later (clusters 5 and 6 (both left putamen)); and one peaking ∼10 min after the intervention (cluster 7 (right ventral striatum)). All methods except SM-CST detect the regions encompassing all seven clusters. However, SM-sensitivity merges clusters 1 and 7, and cluster 5 fails the CST after parametric thresholding. Furthermore, MC-sensitivity merges clusters 5 and 6, and SM-CST does not detect clusters 5-7. Even though the ground truth is unknown, and thus direct verification of the results is not possible, these results are consistent with our simulations, where SM-sensitivity and both MC methods provide higher detection sensitivity.
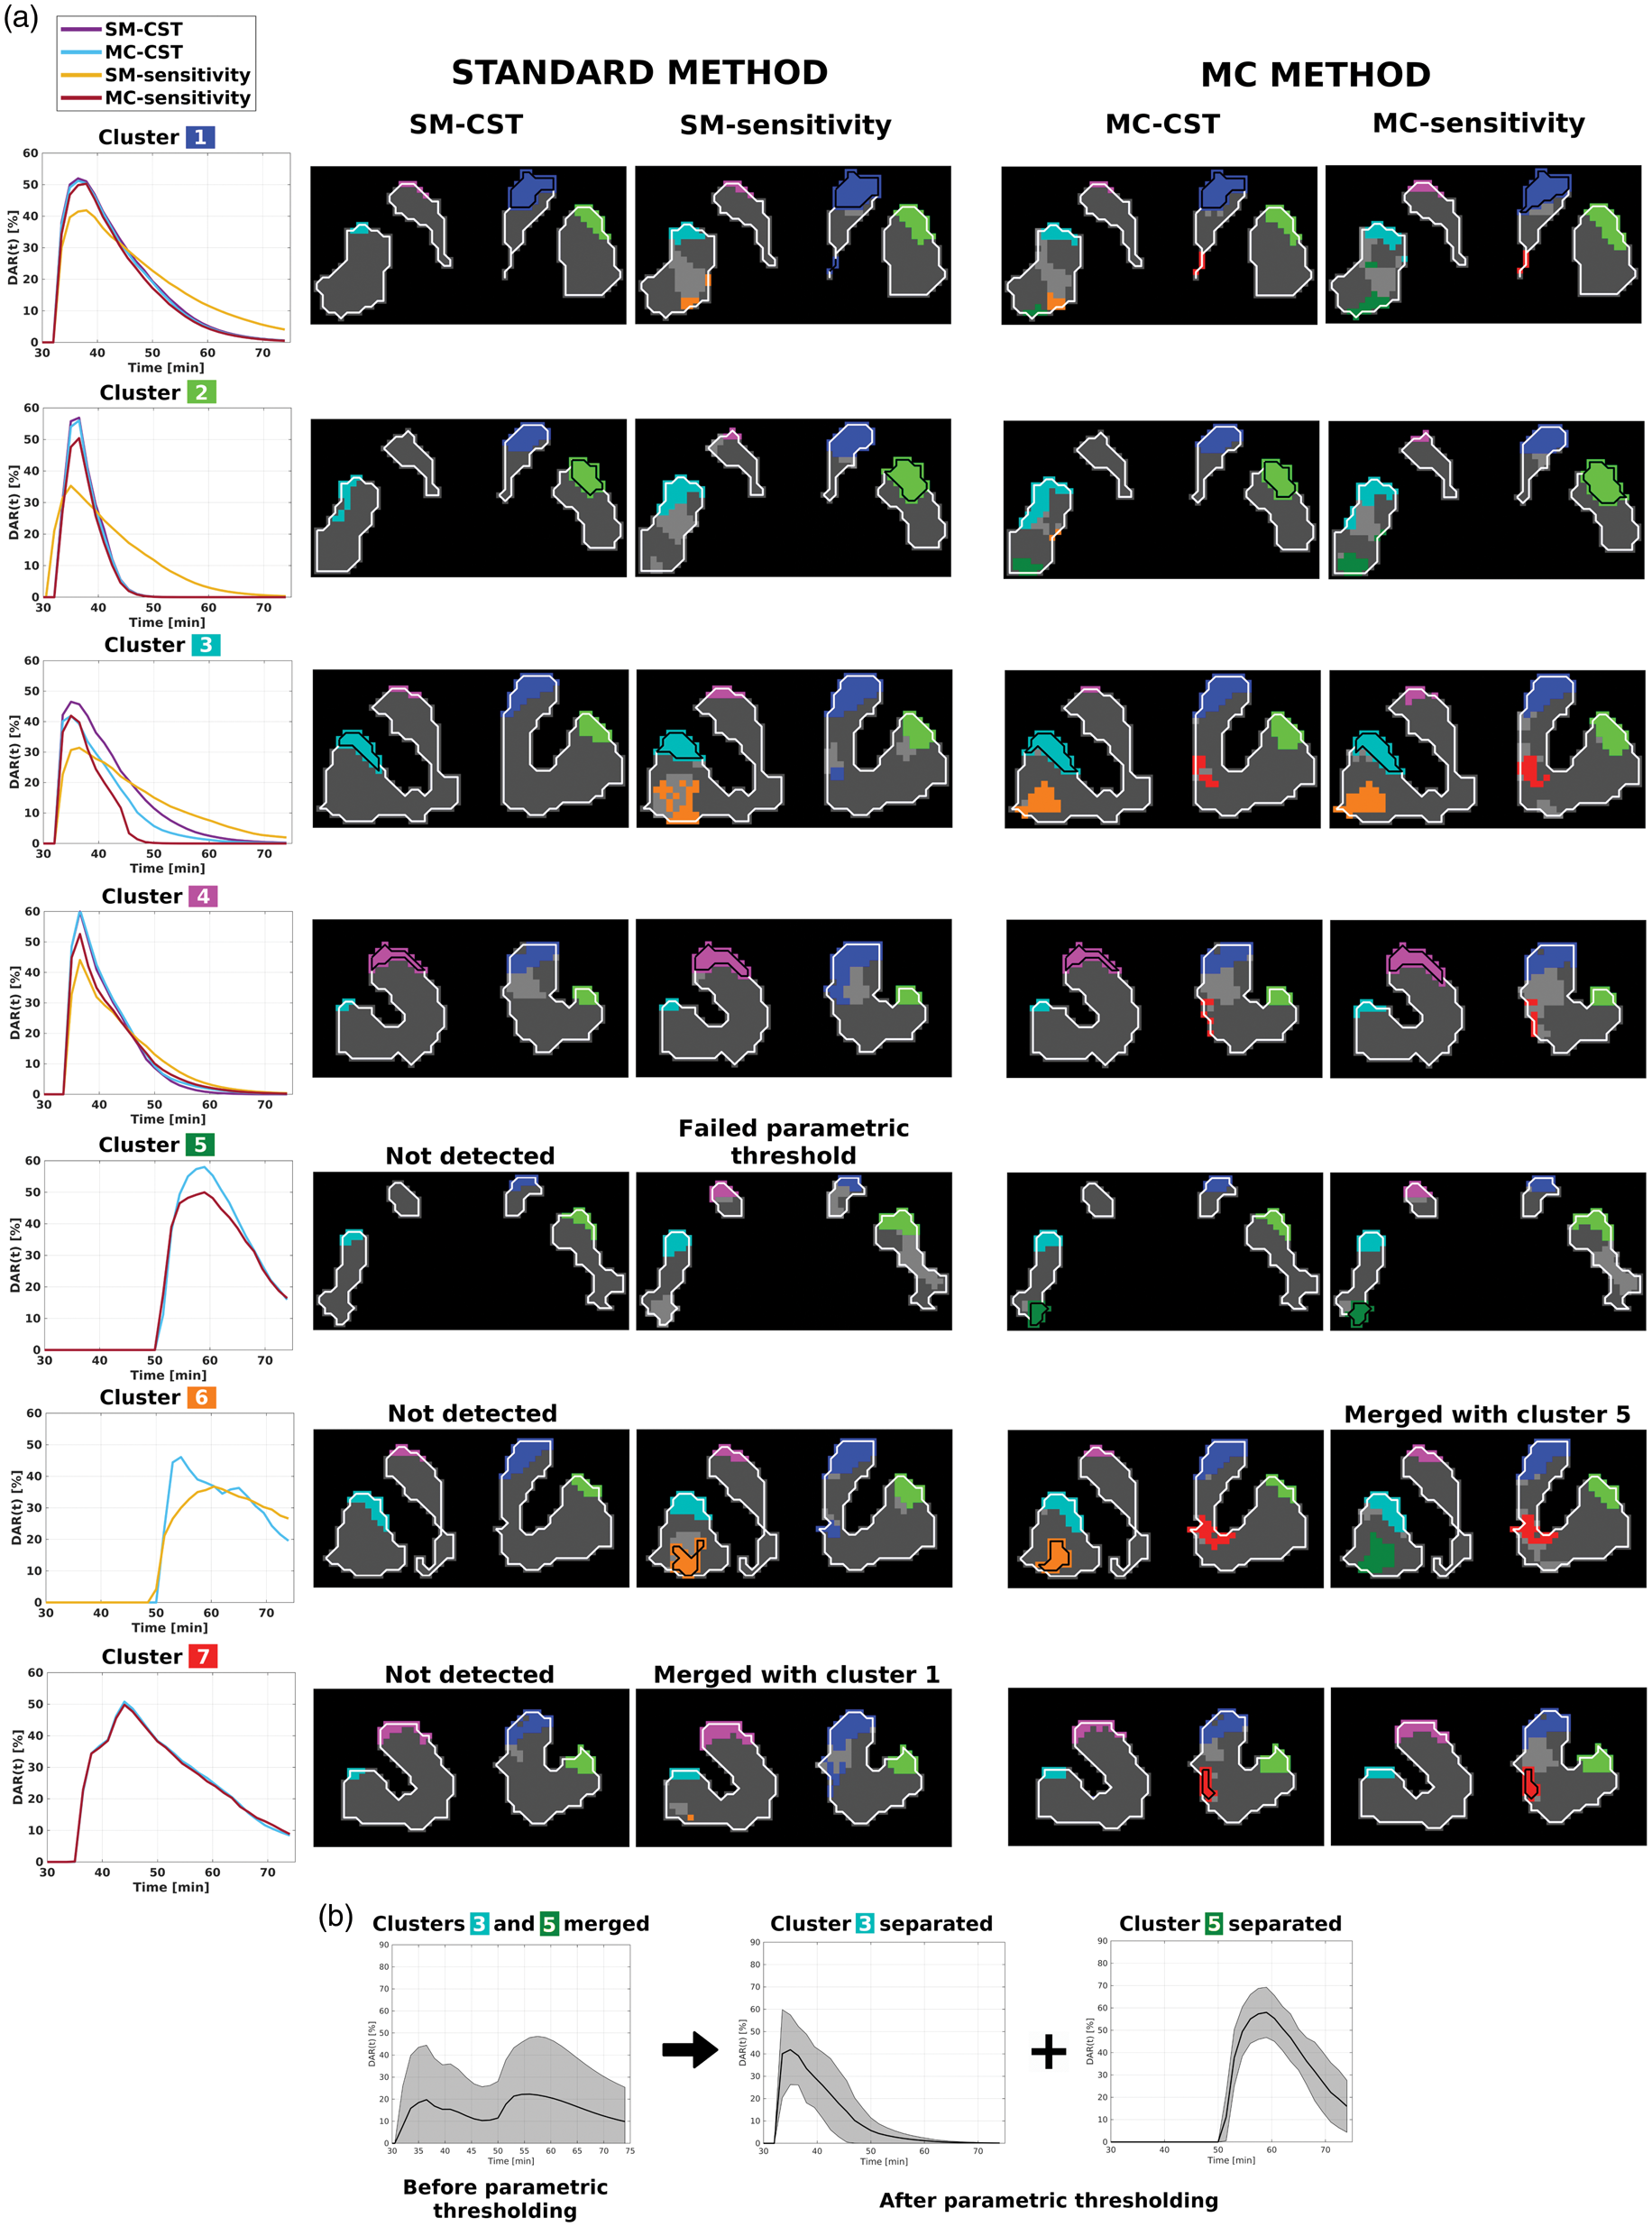
(a) A summary of the results from applying all methods with parametric thresholding to a human pilot scan with a gambling task presented at 36 min into a 75 min scan. Identified clusters are colour-coded on representative coronal slices, and baseline-classified voxels are coloured in dark gray. Voxels that were detected but failed parametric thresholding are coloured with light gray.
Parametrically, comparing
Discussion
MC method
In this work, we proposed a Monte Carlo-based modification to the standard F-test analysis method for voxelwise detection of transient DA release. Through simulation, we designed two optimizations of the MC method: one for sensitivity (MC-sensitivity) one for CST (MC-CST) and compared them to the standard method optimized for either sensitivity (SM-sensitivity) or CST (SM-CST). MC-sensitivity improves sensitivity by up to 83% over SM-sensitivity with a 26% reduction in the regional constraint on detectability (i.e. the CST). Additionally, MC-CST improves sensitivity by up to 50% over SM-CST with a similar CST. Thus, the MC methods more reliably detect DA release in response to a task or stimulus. SM-sensitivity applies a post-filter to the raw OSEM images to increase sensitivity through noise-reduction, but in a manner that also increases the CST and decreases parametric accuracy. Since the MC method does not modify the original input image, applying it to the denoised reconstruction HYPR-AU-OSEM estimates transient dopamine release levels with higher parametric accuracy than post-filtered OSEM images while achieving similar or better sensitivity. SM-CST also uses the same HYPR-AU-OSEM images, but MC-sensitivity improves sensitivity by up to 180%.
While applying the MC method to the post-filtered OSEM images also improved sensitivity without increasing its relatively large CST, we do not present these results here since similar sensitivities were achieved with lower CST and better parametric accuracy when using the MC-sensitivity. Instead of trying to improve the sensitivity through image blurring and thus sacrificing parametric accuracy, the MC method replaces the standard F-test-based significance thresholding and does not modify the denoised TACs—preserving the initial quality of the images.
The MC method can be likened to applying a spatial filter to the binary significance mask, though the kernel would be unique for each voxel, taking into account both the local parity and the global adherence to a correct F-distribution for all baseline voxels; simply filtering the binary significance mask would also improve sensitivity but simultaneously increase CST by isotropically increasing the size of both true clusters and false positive clusters, whereas the MC method will only probabilistically increase cluster size if the global deviation from a true F-distribution suggests a subset of false negative voxels exists in that region. This explains why the MC methods are able to achieve higher sensitivity and lower CST than the standard methods.
The assumption that the true baseline voxels should follow an F-distribution—incorporated into the cost function of the MC algorithm—is borne out in our simulations: a histogram of the known baseline voxels in Figure 1(a) follows the theoretical distribution closely. The F-test assumes normality in the weighted residuals. The noise in PET is Poisson in the sinogram domain, but after reconstruction and post-processing, the temporal noise in the TACs is approximately Gaussian. True release voxels will not follow an F-distribution, since they tend to violate the null hypothesis of the F-test. However, when the ground truth is unknown, release voxels with F-values below the significance threshold or part of a cluster with a size below the CST (i.e. false negatives) are added to the set of true baseline voxels, distorting the F-distribution. The MC method then aims to remove as many false negatives as possible, so that the set of remaining baseline-classified voxels follows an F-distribution.
False negatives exist primarily due to noise in the voxel TACs; the DA-induced change in the TAC is comparable to the noise level (Figure 1(c)), making detection difficult. This problem is exacerbated by PVE, which mixes the temporal patterns of release and baseline voxels to decrease the observed DA-induced change, ultimately reducing sensitivity. Evidence for this claim and a general discussion of the PVE-sensitivity relationship can be found in the Supplementary Information.
Parametric thresholding
To enhance cluster-level estimates of release dynamics, we also suggested a voxelwise parametric thresholding that excludes detected voxels in a cluster having timing parameters significantly deviating from the local neighbourhood mean. The subset of surviving voxels was shown to be a more parametrically accurate sample to calculate
Improved simulation methodology
When performing this study, we also made an important methodological observation that is extendable to other simulation studies: while designing our simulations, we demonstrated that not including the effects of attenuation, normalization, and reconstruction in the simulation resulted in a significantly decreased estimate of the CST and an increased estimate of sensitivity when compared to previous simulations that just add Gaussian noise.4,5 Therefore, simulations that do not include these effects may overestimate image quality and the predictive power of a given analysis algorithm when applied to real data.
Application to a human dataset
Applying these methods to a human scan with a gambling task as the stimulus, SM-sensitivity and the MC methods are able to detect several clusters of DA release in the striatum, though the former cannot parametrically distinguish some of these clusters; its large spatial kernel homogenizes neighbouring TACs and thus subtle parametric differences in magnitude and timing cannot be resolved. MC-sensitivity also merges two clusters found separately in MC-CST, but because both methods use the same initial images, either: (i) the two clusters are indeed one, and the lower sensitivity of MC-CST results in the single cluster being divided in two; or (ii) the two clusters are indeed unique, and this is an example of over-clustering in MC-sensitivity. However, the two clusters found by MC-CST are similar parametrically to each other and to the single cluster found by MC-sensitivity. Therefore, subsequent analysis using either method would be similar.
Other applications
Within the realm of existing applications of lp-ntPET, it may be possible to speculate that the proposed method may be more sensitive in detecting task-related differences in DA release dynamics between subject populations, such as the proposed preliminary finding related to the existence of loci of faster responses to smoking in women than men in dorsal putamen. 14
More generally however, while the theory presented in this work was tailored to detecting DA release, the mathematics of the MC approach can be adapted to any voxelwise binary classification method constrained by a statistical distribution. For instance, the F-test approach here could be extended to other tracers where nested models are compared to determine physiological responses or to fMRI analysis where “activated” voxels are determined through t- or z-tests.
Limitations
In constructing our simulated dataset, we used the lp-ntPET model itself to compute the noiseless release TACs, whereas more sophisticated models exist to describe the relationship between elevations in DA concentration and the resulting perturbations to the RAC TACs.
30
We decided to use the simpler lp-ntPET model in order to have direct knowledge of the ground truth
We assume the CSTs from our optimized
Finally, in our cluster release simulations, we did not assess true negative rates; the PSF filtering in our simulation design made it impossible to reliably classify voxels outside the cluster boundaries as release or non-release. Thus, we rely solely on sensitivity in determining the accuracy of each algorithm.
Supplemental Material
JCB905613 Supplemental Material1 - Supplemental material for A Monte Carlo approach for improving transient dopamine release detection sensitivity
Supplemental material, JCB905613 Supplemental Material1 for A Monte Carlo approach for improving transient dopamine release detection sensitivity by Connor WJ Bevington, Ju-Chieh (Kevin) Cheng, Ivan S Klyuzhin, Mariya V Cherkasova, Catharine A Winstanley and Vesna Sossi in Journal of Cerebral Blood Flow & Metabolism
Footnotes
Funding
The author(s) disclosed receipt of the following financial support for the research, authorship, and/or publication of this article: This work was funded by an NSERC Discovery grant (240670-13), an NSERC Create grant (448110-2014), a CIHR grant (PJT-156012).
Acknowledgements
CWJB thanks Richard Carson for suggesting the use of alternative weighting schemes for HYPR post-processed data. TRIUMF’s contribution to radiotracer production is gratefully acknowledged.
Declaration of conflicting interests
The author(s) declared no potential conflicts of interest with respect to the research, authorship, and/or publication of this article.
Authors’ contributions
CWJB designed the MC method, constructed the simulations, performed the analysis, and wrote the manuscript. JKC provided code for the reconstructions, guidance throughout the project, and edited the manuscript. ISK aided in simulation design and edited the manuscript. MVC and CAW contributed the pilot subject data. VS conceptualized the project, provided guidance throughout, and edited the manuscript.
Supplemental material
Supplemental material for this article is available online.
Notes
References
Supplementary Material
Please find the following supplemental material available below.
For Open Access articles published under a Creative Commons License, all supplemental material carries the same license as the article it is associated with.
For non-Open Access articles published, all supplemental material carries a non-exclusive license, and permission requests for re-use of supplemental material or any part of supplemental material shall be sent directly to the copyright owner as specified in the copyright notice associated with the article.