
Abstract
Little is known of the precise relationship between the expression of disease-related metabolic patterns and nigrostriatal dopaminergic dysfunction in parkinsonism. We studied 51 subjects with Parkinson's disease (PD) (18 non-demented, 24 demented, and 9 dementia with Lewy bodies) and 127 with atypical parkinsonian syndromes (47 multiple system atrophy (MSA), 38 progressive supranuclear palsy (PSP), and 42 corticobasal syndrome (CBS)) with 18F-fluorodeoxyglucose PET to quantify the expression of previously validated disease-related patterns for PD, MSA, PSP, and CBS and 18F-fluoropropyl-β-CIT PET to quantify caudate and putamen dopamine transporter (DAT) binding. The patients in each group exhibited significant elevations in the expression of the corresponding disease-related pattern (p < 0.001), relative to 16 healthy subjects. With the exception of cerebellar MSA (MSA-C), all groups displayed significant reductions in putamen DAT binding relative to healthy subjects (p < 0.05). Correlations between the dopaminergic and metabolic measures were significant in PD and CBS but not in MSA and PSP. In all patient groups with the exception of MSA-C and CBS, pattern expression values and DAT binding correlated with disease duration and severity measures. The findings suggest that in these parkinsonian disorders, metabolic network expression and DAT binding provide complementary information regarding the underlying disease process.
Introduction
The differential diagnosis of parkinsonism is complicated by atypical parkinsonian “look-alike” syndromes (APS) such as multiple system atrophy (MSA), progressive supranuclear palsy (PSP), and corticobasal syndrome (CBS), which can be difficult to distinguish clinically from classical Parkinson's disease (PD). From a practical standpoint, incorrect diagnosis can adversely impact long-term patient management decisions. For example, patients with advanced parkinsonism secondary to APS may be referred inappropriately for surgical procedures such as deep brain stimulation. Interventions such as deep brain stimulation carry substantial risk, but are of minimal benefit to APS patients. 1 Misdiagnosis also represents an issue for clinical trial design. The enrollment of likely non-responsive participants in randomized clinical trials of new agents can potentially compromise data interpretation, especially in the context of early phase studies. 2
A number of presynaptic dopaminergic imaging approaches have been developed for the assessment of nigrostriatal terminal loss in PD patients.
3
Nonetheless, significant presynaptic dopaminergic attrition is present in both classical PD and APS. This lack of specificity has limited the utility of dopaminergic imaging in the differential diagnosis.
4
That said, metabolic imaging data suggest that PD can be distinguished from APS, and the different forms of APS can be distinguished from one another by distinct disease-related metabolic network topographies.5–7 Disease-related metabolic covariance patterns (Figure 1) have been identified and validated for PD (PDRP),8,9 MSA (MSARP),7,10 PSP (PSPRP),
10
and corticobasal ganglionic degeneration (CBDRP).
6
Indeed, these topographies have been used in concert as the basis for an automated computational algorithm to classify clinically indeterminate cases.5,6,11
Disease-related glucose metabolic patterns. (a) PD-related covariance pattern (PDRP)8,9 was characterized by increased (red) pallidal, thalamic and motor cortical metabolic activities associated with reduced (blue) lateral premotor and parieto-occipital cortical activities. (b) Multiple system atrophy-related covariance pattern (MSARP)
10
was characterized by covarying metabolic decreases in the putamen and the cerebellum. (c) Progressive supranuclear palsy-related pattern (PSPRP)
10
was characterized by covarying metabolic decreases in the medial prefrontal cortex, frontal eye fields, ventrolateral prefrontal cortex, caudate nuclei, medial thalamus, and upper brainstem. (d) Corticobasal ganglionic degeneration-related pattern (CBDRP)
6
was characterized by metabolic reductions in the left frontal and parietal lobes, thalamus and caudate head. Patients' brains that were used to derive CBDRP were flipped left vs. right to align the more affected hemisphere to be on the left. Other disease-related patterns are relatively symmetrical. The voxel-loadings are z-scored.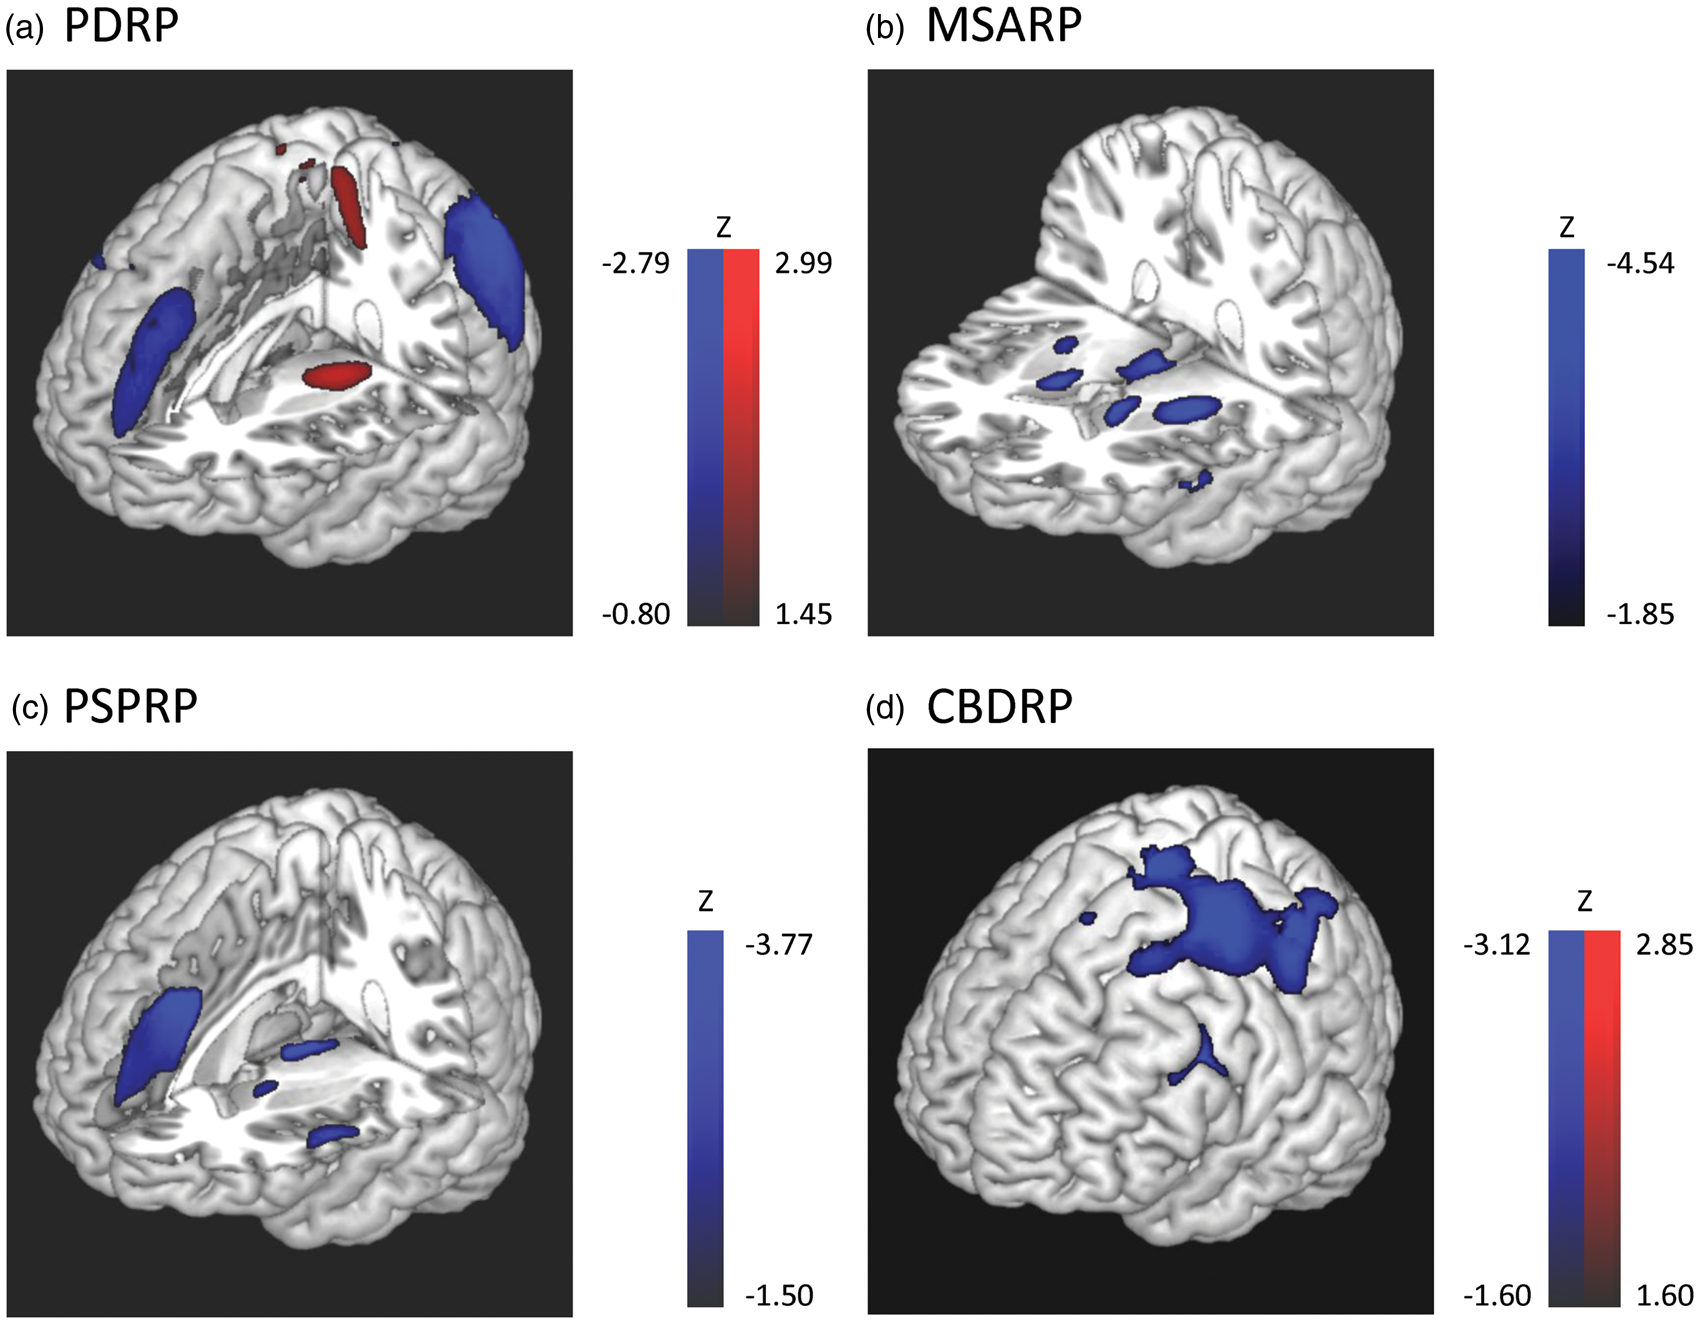
In this study, we used metabolic brain imaging with 18F-fluorodeoxyglucose (FDG) PET to measure the expression of previously validated North American PDRP, MSARP, PSPRP, and CBDRP covariance topographies in a large South Korean patient sample. The data confirmed that the specific disease patterns were expressed appropriately in this population. This study also allowed us to compare network expression in clinically defined subtypes of the parkinsonian disorders. Thus, PDRP expression levels were compared in patients with PD dementia (PDD) vs. dementia with Lewy bodies (DLB). Likewise, MSARP expression was compared in MSA patients with predominant parkinsonian or cerebellar forms of the disorder, as well as PSPRP expression in PSP patients with Richardson's syndrome vs. those with parkinsonian phenotype. 12 These subjects were also scanned with 18F-fluoropropyl-β-CIT (FPCIT) for the measurement of caudate and putamen dopamine transporter (DAT) binding. These data enabled us to examine the relationship between network expression and presynaptic nigrostriatal dopaminergic dysfunction in the different parkinsonian disorders.
Materials and methods
Subjects
Correlation between clinical and imaging variables in LBD.
q < 0.05 (FDR).
Positron emission tomography
All subjects underwent metabolic imaging with FDG PET to measure expression values (subject scores) for previously validated disease-related spatial covariance patterns for PD, MSA, PSP, and CBD. Of the total cohort (178 patients and 16 healthy subjects), the majority (173 patients and 7 healthy subjects) additionally underwent dopaminergic imaging with FPCIT PET to assess caudate and putamen DAT binding. Antiparkinsonian medications were withheld at the time of FPCIT PET imaging while FDG PET imaging was done without medication withdrawal.
FDG PET
All subjects fasted for at least 6 h before scanning. A 5-min transmission scan using a 68Ge rotating pin source and a 15-min emission scan were acquired on the ECAT HR + scanner (Siemens Medical Systems, Hoffman Estate, IL, USA) at the Asan Medical Center, 40 min after intravenous injection of 370 MBq of FDG 19 ; a standard uptake value (SUV) was calculated for each voxel as a measure of regional glucose uptake. SUV maps were warped into the standard Montreal Neurological Institute (MNI) space, and smoothed with a 10 mm Gaussian filter using SPM5 software (Wellcome Trust Centre for Neuroimaging, Institute of Neurology, London, UK). Expression values (subject scores) for the PDRP,5,8 and for the MSARP, PSPRP, and CBDRP, the major APS-related metabolic topographies,6,11 were computed in each scan as described elsewhere. 20 The PDRP was identified by spatial covariance analysis of metabolic images from a combined group of 33 PD and 33 healthy volunteer subjects8,9; the MSARP from a combined group of 10 MSA and 10 healthy volunteers 10 ; the PSPRP from 10 PSP and 10 healthy volunteers 10 ; and the CBDRP from 10 CBS and 10 healthy volunteer subjects. 6 For the CBDRP, an asymmetry index was computed for each scan based upon the difference in pattern expression that was present between hemispheres. 6 Expression values for each pattern was standardized (z-scored) with reference to corresponding values from 16 South Korean healthy volunteer subjects (age 58.4 ± 6.1 years) scanned on the same tomograph.
FPCIT PET
Image acquisition began 3 h after intravenous injection of FPCIT (185 MBq) using Biograph 40 TruePoint PET/CT camera (Siemens Medical Systems, Hoffman Estate, IL, USA). Three-dimensional (3D) emission PET data were acquired for 10 min as described in detail elsewhere. 21 FPCIT PET images were warped into MNI space using an in-house template 22 and SPM5 software. Regions-of-interest for the putamen, caudate and cerebellum (reference region) are placed on each normalized FPCIT PET image using automated anatomical labeling. 23 Standard uptake ratio (SUR) values were calculated by dividing the right/left averaged SUV for the caudate and the putamen by the corresponding cerebellar values. The ratio of caudate to putamen SUR values was also computed for each subject.
Statistical analysis
Group differences in the expression of each of the disease-related covariance patterns were identified using one-way ANOVA with post hoc Bonferroni tests. The same analysis was repeated using the general linear model employing age as a covariate. Analogous group comparisons were performed using caudate and putamen FPCIT SUR values. Group differences were considered significant at p < 0.05 incorporating the Bonferroni correction for multiple comparisons.
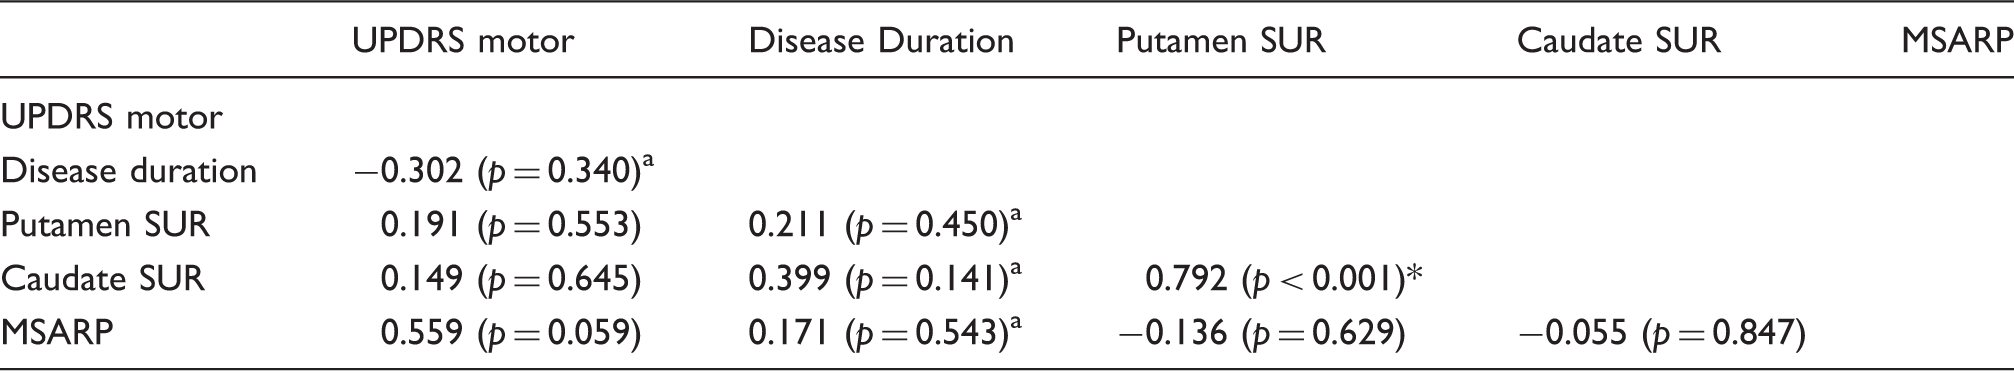
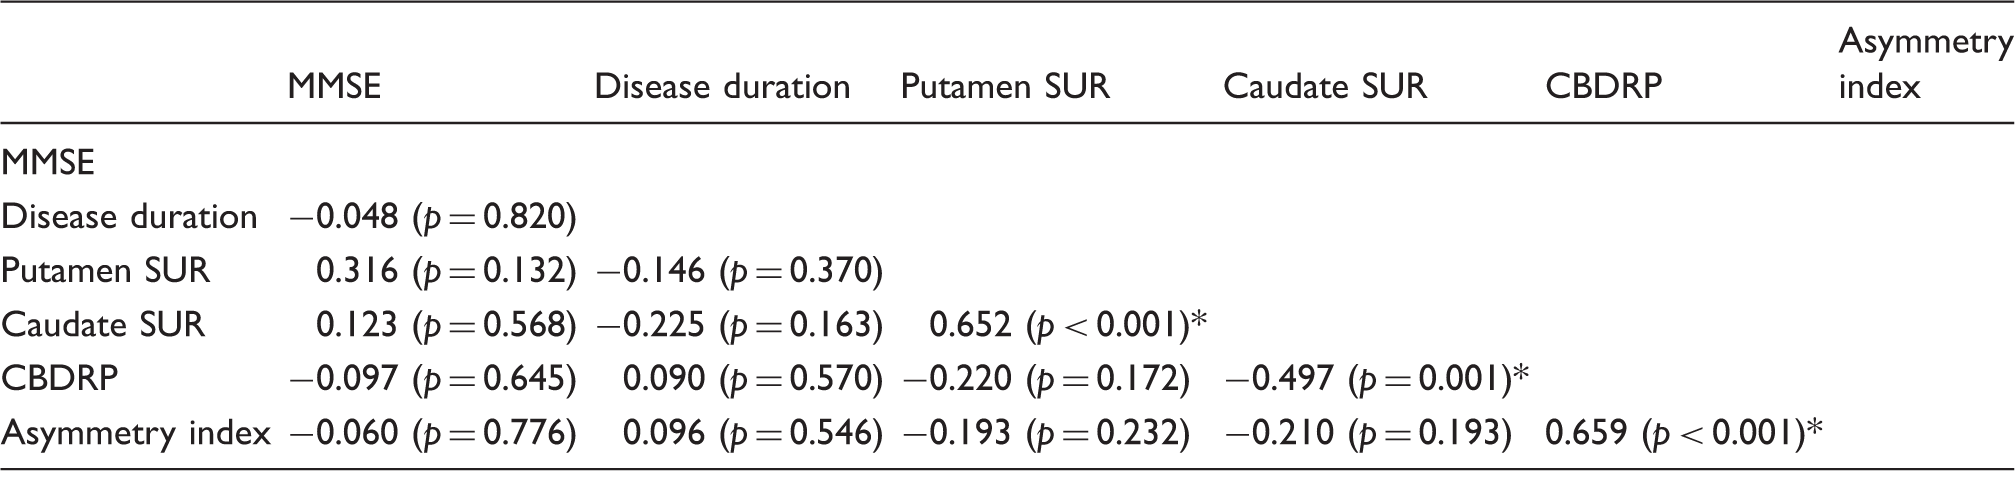
In each group, these measures were correlated with symptom duration and with disease severity ratings (composite UPDRS motor ratings for LBD [PDND, PDD, and DLB] and MSA-P; MMSE for PSP and CBS) by computing Pearson product-moment correlation coefficients. Correlations between caudate and putamen FPCIT SUR values and pattern expression values in each group were also computed using the same method. Correlations were considered significant for p < 0.05, incorporating a false discovery rate (FDR) correction for multiple comparisons. For MSA-C, the sample size was small (n = 15) and the disease duration was not normally distributed (Shapiro-Wilk test, p = 0.002), thus Spearman's rho was employed for correlation analysis.
Results
Metabolic network expression
PDRP
A significant difference in PDRP subject scores (Figure 2(a)) was present across groups (F(7,186) = 46.651, p < 0.001), with higher pattern expression in LBD patients relative to healthy volunteer subjects (p < 0.021; post hoc Bonferroni test). Within the LBD group, PDRP expression was greater in PDD and DLB patients relative to their non-demented counterparts (p < 0.001; post hoc Bonferroni tests). PDD and DLB subjects were older on average than PDND (p = 0.004 and p = 0.005, respectively; post hoc Bonferroni tests). Nonetheless, inclusion of age as a covariate did not change the significance of the result (F(7,185) = 42.550, p < 0.001). Of note, significant reductions in PDRP expression were seen in both MSA subgroups relative to PDND subjects (MSA-P: p < 0.015; MSA-C: p < 0.001; post hoc Bonferroni tests). Significant changes in PDRP expression levels were not seen, however, in PSP and CBS compared to PDND patients (p = 1.0). Of note, PDRP expression levels were relatively low in the current PDND cohort, which may relate to the fact that these subjects were scanned while on dopaminergic medication.
24
Differences in PDRP and MSARP scores across diseases. (a) PDRP: One-way ANOVA showed significant effect of group (F(7,186)=46.651, p < 0.001). As expected, all LBD patients (PDND, PDD and DLB) showed significantly elevated PDRP scores compared to healthy control subjects (NL) (p < 0.021; post hoc Bonferroni). PDD and DLB patients showed greater PDRP scores compared to the PDND (p < 0.001; post hoc Bonferroni) although non-significant differences in UPDRS motor scores were observed across the groups (F(2, 43)=0.733, p = 0.486). Both MSA-P (p = 0.015; post hoc Bonferroni) and MSA-C (p < 0.001) patients showed significantly lower PDRP score which was in line with previous discrimination study
11
while they are significantly different from each other (p = 0.002). However, both PSP and CBS patients were not significantly different from PDND (p = 1.0; post hoc Bonferroni). *Significantly different from NL (p < 0.05; post hoc Bonferroni test). $Significantly different from PDND (p < 0.05; post hoc Bonferroni test). (b) MSARP: One-way ANOVA showed significant effect of group (F(7,186)=19.865, p < 0.001). As expected, both MSA-P and MSA-C patients showed significantly elevated MSARP scores compared to NL (p < 0.001; post hoc Bonferroni). MSARP score was significantly lower in all LBD groups (p < 0.001; post hoc Bonferroni), but it was not significantly different from PSP (p = 1.0) and CBS (p = 0.745) compared to MSA-P. No significant difference was detected between MSA-P and MSA-C (p = 1.0; post hoc Bonferroni). *Significantly different from NL (p < 0.05; post hoc Bonferroni test). $Significantly different from MSA-P (p < 0.05; post hoc Bonferroni test).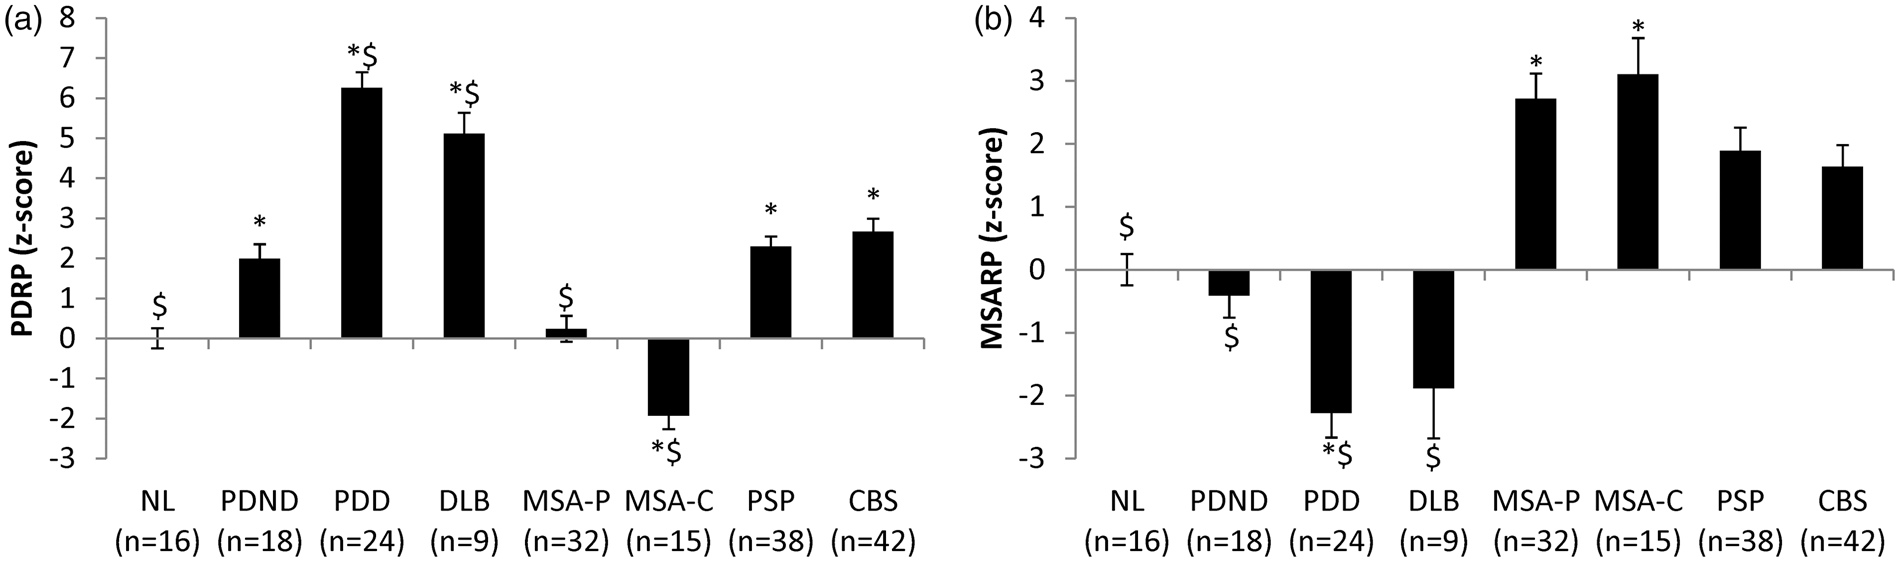
MSARP
Significant differences in MSARP subject scores (Figure 2(b)) were present across groups (F(7,186) = 19.865, p < 0.001; one-way ANOVA), with significant increases in pattern expression in MSA-P and MSA-C patients relative to healthy control subjects (p < 0.001; post hoc Bonferroni tests). MSARP expression in MSA-P did not differ from corresponding values in MSA-C patients (p = 1.0).
PSPRP
Significant group difference in PSPRP expression (Figure 3(a)) were also observed (F(7,186) = 18.741, p < 0.001; one-way ANOVA), with higher values in PSP patients relative to the other groups (p < 0.001; post hoc Bonferroni tests) with the exception of CBS. In this group, PSPRP expression was similar to that measured in PSP patients (p = 1.0). No significant difference was observed between the subtypes of PSP (Richardson's syndrome vs. parkinsonism; t(36) = −0.637, p = 0.528).
Differences in PSPRP scores and CBDRP asymmetry index across diseases. (a) PSPRP: One-way ANOVA showed significant effect of group (F(7,186)=18.741, p < 0.001). PSPRP score was significantly higher in PSP patients compared all other groups (p < 0.001; post hoc Bonferroni) except CBS (p = 1.0). *Significantly different from NL (p < 0.05; post hoc Bonferroni test). $Significantly different from PSP (p < 0.05; post hoc Bonferroni test). (b) CBDRP asymmetry index: One-way ANOVA showed significant effect of group (F(7,186)=9.373, p < 0.001). Only CBS patients showed significantly increased CBDRP asymmetry index compared to NL (p < 0.001; post hoc Bonferroni) while all other disease groups showed significantly lower asymmetry index compared to the CBS patients (p < 0.013). *Significantly different from NL (p < 0.05; post hoc Bonferroni test). $Significantly different from CBS (p < 0.05; post hoc Bonferroni test).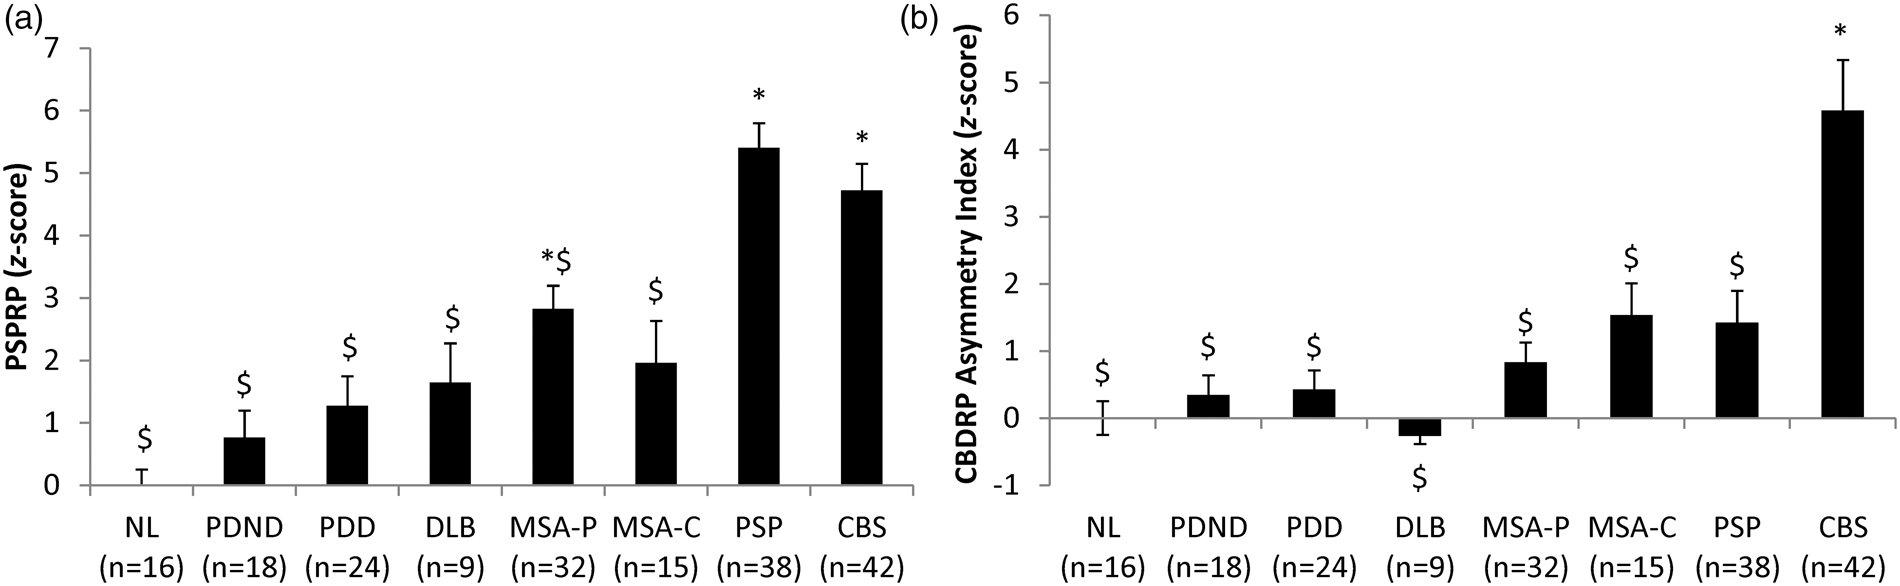
CBDRP
For CBDRP, an asymmetry index was computed in each subject based upon hemispheric pattern expression values (see Methods section). A significant group difference (F(7,186) = 9.373, p < 0.001; one-way ANOVA) was evident for this measure (Figure 3(b)), with elevated CBDRP asymmetry values in CBS relative to other patients (p < 0.013) and healthy volunteer subjects (p < 0.001; post hoc Bonferroni tests).
Dopaminergic integrity
Significant group differences in putamen DAT binding (Figure 4) were observed across groups (F(7,172) = 22.908, p < 0.001; one-way ANOVA). Abnormal reductions in this measure were present in all patient groups (p < 0.001; post hoc Bonferroni tests) with the exception of MSA-C. In this group, putamen DAT binding did not differ from normal (p = 0.258); nigrostriatal dopaminergic function was greater in MSA-C than in the other patient categories (p < 0.001). Disease-related reductions in putamen DAT binding remained significant (p < 0.001) following adjustment for individual differences in age.
Differences in FPCIT standard uptake ratio of the putamen across diseases. One-way ANOVA showed significant effect of group (F(7,172)=22.98, p < 0.001). As expected, all patient groups showed significantly decreased FPCIT uptake in the putamen (p < 0.001; post hoc Bonferroni) except MSA-C patients (p = 0.258). Compared to the PDND, only MSA-C patients showed significantly higher FPCIT uptake (p < 0.001; post hoc Bonferroni). *Significantly different from NL (p < 0.05; post hoc Bonferroni test). $Significantly different from PDND (p < 0.05; post hoc Bonferroni test).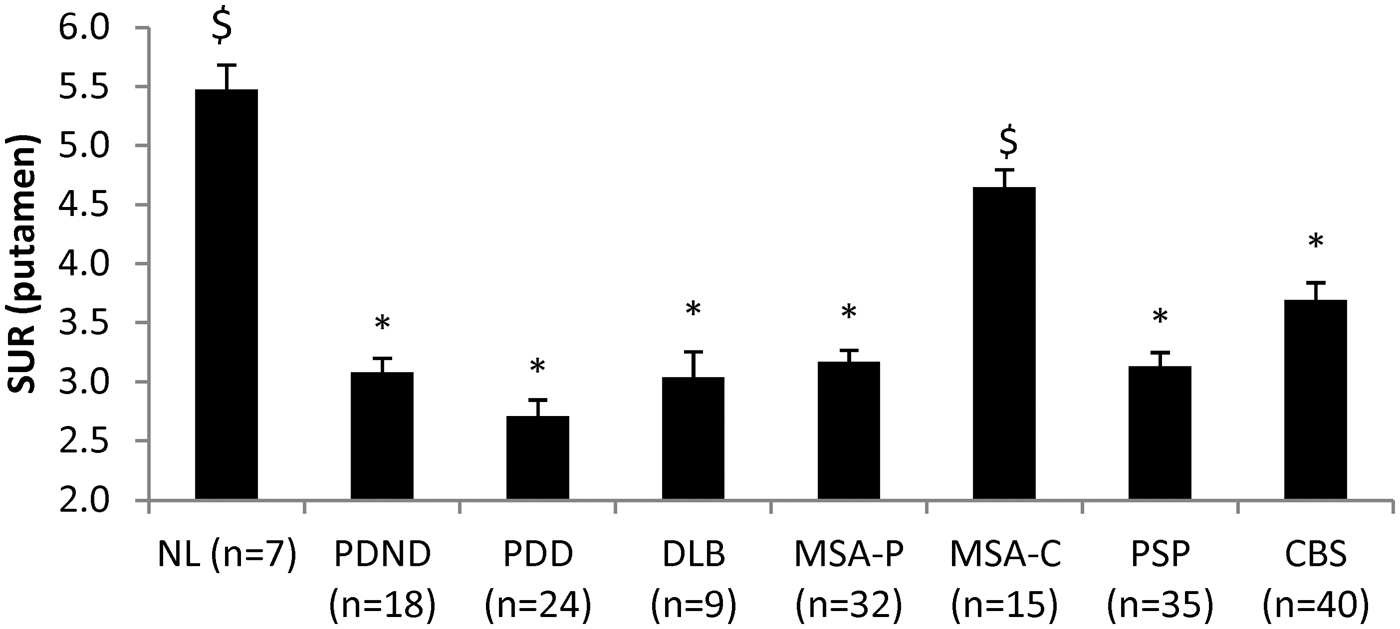
Analogous group differences (F(7,172) = 13.125, p < 0.001; one-way ANOVA) were seen for caudate DAT binding (Supplementary Figure 1), with abnormal reductions in all groups (p < 0.001) with the exception of MSA-C (p = 1.0; post hoc Bonferroni tests). Caudate DAT binding was similar for PDD and DLB patients (p = 1.0). Of note, reductions compared to PDND in this measure were significant for PDD (p = 0.04) but not for DLB (p = 1.0; post hoc Bonferroni tests). Disease-related reductions in caudate DAT binding remained significant (p < 0.04; post hoc Bonferroni tests) following adjustment for individual differences in age.
The putamen to caudate DAT binding ratio (Supplementary Figure 2) also exhibited a significant group difference (F(7,172) = 9.309, p < 0.001; one-way ANOVA); abnormal reductions in this measure were seen in the PDND, PDD, DLB, and MSA-P groups (p < 0.04; post hoc Bonferroni tests). Nonetheless, significant differences in the ratio measure were not observed across these patient groups (p = 1.0). Of note, putamen/caudate ratio values did not differ from normal in MSA-C, PSP, and CBS (p = 1.0; post hoc Bonferroni tests). Adjustment for individual subject differences in age did not alter the significance of the observed findings.
A significant main effect of group was seen for the asymmetry index in the putamen (F(7,172) = 2.372, p = 0.024) with a trend-level difference in the caudate (F(7,172) = 1.832, p = 0.084) (Supplementary Figure 3). Post hoc analysis, however, showed no significant difference between individual groups (p > 0.06).
Relationships between network expression, striatal DAT binding, and disease severity
LBD
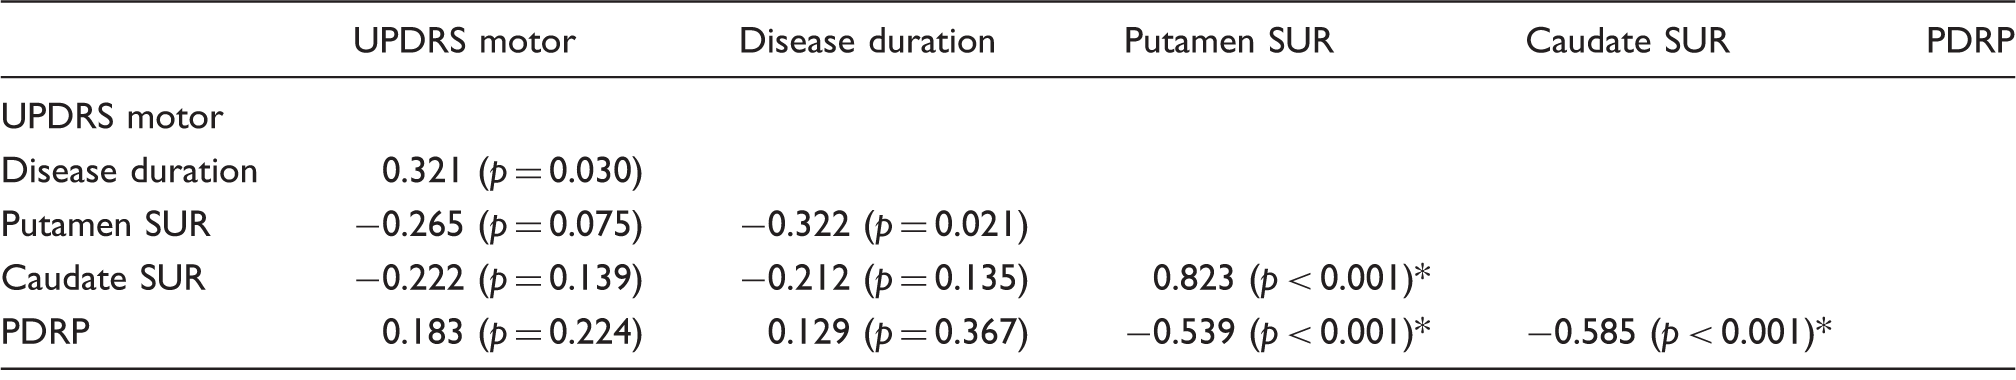
Putamen DAT binding values in LBD patients (Table 1) correlated weakly with disease duration (r = −0.322, p = 0.021); a trend-level correlation with UPDRS motor ratings was also observed in these patients (r = −0.265, p = 0.075). PDRP expression values did not correlate with the duration or severity of motor signs (p > 0.1). That said, a significant inverse relationship was noted between putamen DAT binding and PDRP expression in the LBD subjects (r = −0.539, p < 0.001; q < 0.05, FDR).
MSA
Correlation between clinical and imaging variables in MSA-P.

q < 0.05 (FDR).
Correlation between clinical and imaging variables in MSA-C.
Spearman's Rho; otherwise Pearson's correlation.
q < 0.05 (FDR).
PSP
Correlation between clinical and imaging variables in PSP.
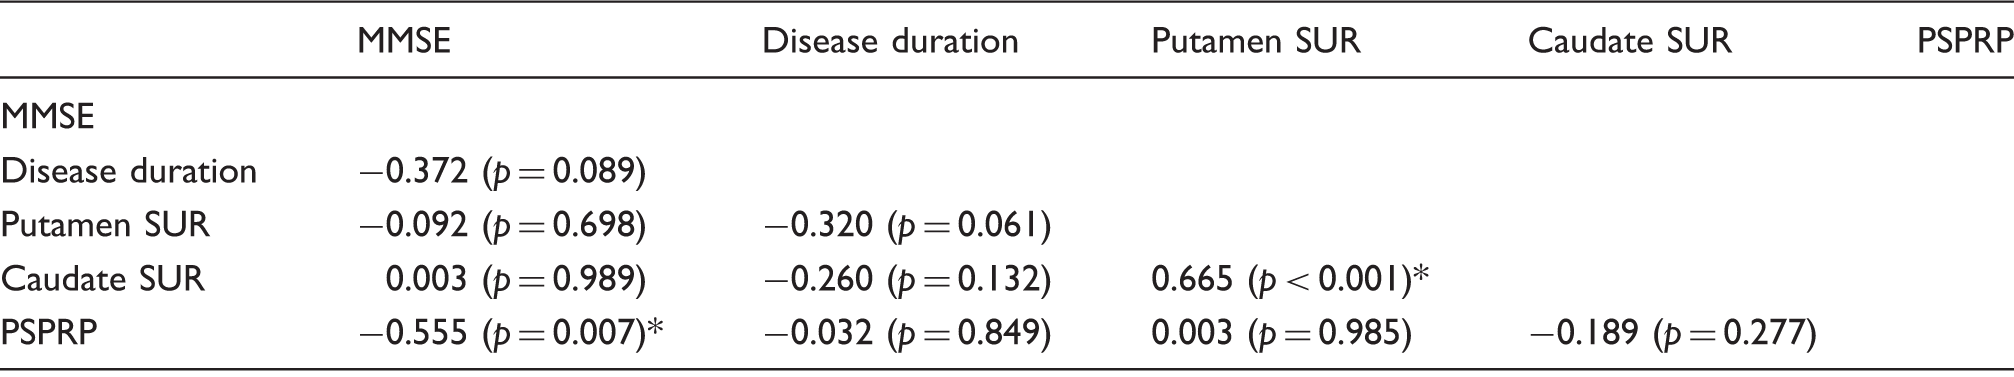
q < 0.05 (FDR).
CBS
Correlation between clinical and imaging variables in CBS.
q < 0.05 (FDR).
Discussion
The findings demonstrate the generalizability of previously characterized spatial covariance patterns as metabolic imaging markers of the parkinsonian movement disorders. Indeed, the same abnormal brain networks seen in association with these diseases in North American patients were also consistently expressed in their South Korean counterparts. Thus, as previously observed, patients with LBD (PDND, PDD, and DLB) exhibited increased PDRP expression,5,8,25,26 whereas those with MSA and PSP had characteristic elevations in the corresponding disease-related patterns.7,10,11 In contrast to the relatively symmetrical network topographies associated with PD, MSA, and PSP, CBD is characterized by highly specific hemispheric asymmetries. 6 As previously noted, 6 hemispheric asymmetries in CBDRP expression discriminated patients with CBS from those with PSP and other forms of parkinsonism. Lastly, the FPCIT PET data confirm the sensitivity of putamen DAT binding to early dopaminergic attrition in parkinsonism.11,22 This measure, however, may not reliably differentiate between LBD and atypical forms of the parkinsonism. Of note, significant group differences in DAT binding asymmetry index were not present in these data, although a trend toward relatively greater asymmetry was found in the caudate for CBS and in the putamen for PDND. These findings suggest that DAT binding asymmetry measurements are likely to have limited utility in the differential diagnosis of parkinsonian syndromes. The issue may relate to the inherent variability of asymmetry measurements in small brain structures. Indeed, using absolute values for caudate/putamen DAT binding asymmetry in the current group of healthy volunteer subjects, we noted very high values in a number of normal individuals. This variability may pose a challenge for automated computerized algorithms based on these measures.
FDG PET in conjunction with previously validated disease-related network markers distinguished the various patient groups. Indeed, pattern expression values computed prospectively in the current sample were specific for the disease in question. Thus, PDRP expression was abnormally elevated in each of the subgroups (PDND, PDD, and DLB) comprising the LBD cohort. We note that PDRP expression was somewhat lower than previously reported in PD subjects of comparable symptom duration.5,27 This difference in pattern expression may be attributable to the effects of dopaminergic medication, which in contrast to prior metabolic network studies was not withheld prior to FDG PET. This may in part explain why PDRP expression in PDND was not significantly higher than in PSP and CBS patients. This, however, is in keeping with our prior observation that expression values for a single disease-related pattern may not be adequate to differentiate between multiple disorders. 28 Indeed, accurate differential diagnosis is best achieved using more than one disease-related pattern for this purpose.6,11,29 The effect of levodopa on PDRP expression is known to differ across PD subjects. 30 By lowering pattern expression to varying degrees in LBD patients, levodopa treatment may also explain the weak or absent correlations of PDRP scores with putamen DAT binding and UPDRS motor ratings that were observed in this group.
Interestingly, PDRP expression values did not differ significantly for the DLB and PDD subgroups. Similarly, relative to PDND, cognitively impaired patients in both of these diagnostic categories displayed comparable increases in the expression of the PD cognition-related metabolic pattern (data not shown).5,8 While subtle metabolic differences between PDD and DLB cannot be excluded, the data support a shared network-level functional pathology for the two conditions. 31 We also note that PDRP expression score was higher in PDD and DLB compared to PDND despite negligible differences in motor ratings across these groups (F(2,43) = 0.733, p = 0.486; one-way ANOVA). This accords with prior findings in that correlations between PDRP expression and motor ratings tend to be moderate in size, explaining only 40–50% of the shared variance in these measures. Thus, as demonstrated in two recent studies of subjects with REM sleep behavior disorder, PDRP expression may be significantly elevated in individuals with preclinical disease in whom motor signs have yet to emerge.32,33 The combined group covariance mapping algorithm used to identify the PDRP isolates linearly independent topographies that separate patients from control subjects. In this regard, the search for a significant disease pattern is entirely data driven, and is not limited to motor-related topographies.8,20 Given that PD is increasingly recognized as a multi-spectrum disorder, these is no reason to expect that the dominant source of disease-related variances represented by the PDRP resides exclusively in the motor domain. In this context, even though motor disability ratings were similar for PDND, DLB, and PDD, the latter two groups can be regarded generically as more progressive phenotypes, with relatively greater levels of PDRP expression.
In addition to LBD, significant changes in metabolic network expression and striatal DAT binding were observed in MSA-P patients. The current findings accord well with prior MSA imaging studies.34–36 Indeed, we found that reductions in putamen DAT binding were similar for MSA-P and LBD patients; correlations of this measure with disease duration and UPDRS motor ratings were of borderline significance in the two patient groups. That said, in keeping with findings from an earlier North American MSA cohort, 7 MSARP expression in the current MSA-P sample correlated significantly with concurrent UPDRS motor ratings. While a significant correlation (p < 0.001) was observed between putamen DAT binding and PDRP expression in LBD, an analogous dopaminergic relationship with MSARP values was not present in the MSA-P cohort. In PD, motor manifestations are associated with loss of presynaptic dopaminergic function, and, indirectly, with the downstream network-level changes embodied in the abnormal PDRP topography. In MSA, parkinsonism relates primarily to postsynaptic changes in MSARP regions. However, despite significant reductions in putamen DAT binding in MSA-P patients, these changes did not correlate with the corresponding increases in MSARP expression seen in these individuals. In contrast to MSA-P, MSA-C subjects did not exhibit significant reductions in caudate and putamen DAT binding. Nonetheless, comparable increases in MSARP expression were observed in both MSA-P and MSA-C. Thus, the data suggest that while increases in MSARP expression may characterize both MSA subtypes,7,11 it is likely that specific topographic variants of this network can be detected which discriminate between these clinical phenotypes.
PSP subjects exhibited significant reductions in DAT binding involving both caudate and putamen, 37 which resulted in higher (more “normal”) putamen/caudate ratio values relative to the LBD groups. This was consistent with early dopaminergic imaging findings. 38 Nonetheless, this group difference may not be sufficiently specific for accurate discrimination of typical vs. atypical parkinsonism at the single subject level. 39 As with MSA-P, PSP patients exhibited a weak, borderline relationship between putamen DAT binding and symptom duration; correlation with MMSE scores was not significant in this patient group. That said, in conformity with prior metabolic imaging studies,6,10,11 the current PSP cohort was characterized by elevated PSPRP expression, which correlated with individual differences in overall cognitive status as assessed by the MMSE. PSPRP values in this group, however, did not correlate with either symptom duration or caudate/putamen DAT binding measures. We additionally note that by analogy to the MSARP, significant PSPRP elevations were seen in the two major clinical forms of PSP: the oculomotor dominant Richardson's syndrome and the parkinsonian variant, which phenotypically resembles classical PD. 12 In PSP, as in MSA, a common generic disease network is expressed by patients with the disorder, irrespective of clinical presentation. As recently reported in an independent patient sample, 6 PSPRP expression is also elevated in CBS subjects. Given the significant clinical and regional metabolic asymmetries that define the CBS phenotype, 40 it is perhaps not surprising that these patients were distinguished from PSP and the other diagnostic groups by a measure that captures hemispheric differences in the expression of the disease-specific CBDRP covariance topography. 6 Significant correlations between CBDRP expression values (for the whole brain and for hemispheric asymmetry) and disease duration, MMSE, and putamen DAT binding were not discerned for this group. Interestingly, however, whole-brain CBDRP values correlated significantly with caudate DAT binding (p < 0.001). The relevance of this finding to the pathophysiology of CBS is not known. Nonetheless, astrocytic plaques, the pathological hallmark of CBS in prefrontal and premotor cortex and cerebellum, are also found in the caudate nucleus. Indeed, the distribution of pathological changes in CBS paralleled the observed network correlations: astrocytic plaques were ten-fold more frequent in the caudate relative to the putamen. 41
Conclusion
In aggregate, the metabolic imaging data confirm the specificity of the previously characterized disease-related network topographies in parkinsonian subjects with LBD or atypical parkinsonian look-alike conditions. Dopaminergic imaging, on the other hand, provides complementary information concerning the level of nigrostriatal dopaminergic dysfunction that is present in each patient category. At the group level, the findings demonstrate the relevance of the various networks as imaging descriptors of the underlying neurodegenerative process. That said, the utility of these measures as diagnostic markers can be determined only through an analysis of classification accuracy at the single case level. 11 These results will be the topic of a future publication.
Footnotes
Funding
The author(s) disclosed receipt of the following financial support for the research, authorship, and/or publication of this article: This work was supported by the Ministry of Education and Science (South Korea) and Asan Institute for Life Sciences (Seoul, South Korea).
Acknowledgments
The authors wish to thank the staff members of Asan Medical Center for data acquisition and Ms. Yoon Young Choi for her valuable assistance with manuscript preparation/editing.
References
Supplementary Material
Please find the following supplemental material available below.
For Open Access articles published under a Creative Commons License, all supplemental material carries the same license as the article it is associated with.
For non-Open Access articles published, all supplemental material carries a non-exclusive license, and permission requests for re-use of supplemental material or any part of supplemental material shall be sent directly to the copyright owner as specified in the copyright notice associated with the article.