
Abstract
Quantification of dopamine transporter (DAT) with [18F]FE-PE2I PET is an important progression marker for Parkinson’s disease (PD). This study aimed to validate a novel correction (SUVRc) for a less-biased estimate of SUVR by accounting for [18F]FE-PE2I clearance-rate, in independent cross-sectional (38 PD, 38 controls), test-retest (9 PD) and longitudinal cohorts (21 PD). SUVRc was calculated as
Introduction
Parkinson’s disease (PD) is a neurodegenerative disease characterized by the selective degeneration of dopaminergic neurons in the pars compacta of the substantia nigra (SN) and striatal terminals, with reduction of the dopamine transporters (DAT). DAT imaging plays a crucial role in the assessment of nigrostriatal degeneration in patients with Parkinsonism as it provides in vivo assessment of presynaptic dopaminergic system integrity. [18F]FE-PE2I([18F]-(E)-N-(3-iodoprop-2-enyl)-2β-carbofluoroethoxy-3β- (4′-methyl-phenyl) nortropane) is a positron emission tomography (PET) ligand with high affinity and selectivity for DAT. 1 The better spatial resolution of PET vs. SPECT2,3 and faster kinetic properties compared to [11C]PE2I, 4 make [18F]-FE-PE2I PET a suitable tool for DAT imaging and quantification, which could improve on DAT SPECT in clinical practice.
The use of a simplified reference tissue model (SRTM) derived parameters, including binding potential relative to non-displaceable radioligand in tissue (BPND) or distribution volume ratio (DVR), for DAT quantification with [18F]FE-PE2I has already been validated in several studies.5 –8 Compartment modeling, however, requires long scan-time to acquire dynamic data, which is less feasible in a clinical practice, particularly in patients with neurodegenerative disorders. An alternative approach to reduce scan-time for [18F]FE-PE2I PET has been investigated.7,8 It makes use of standardized uptake value ratio (SUVR), defined as the ratio of activity concentration in a target tissue to reference tissue during a specified time-window. SUVR is generally well-correlated with BPND or DVR, but is usually biased, overestimating DVR at late time window5,7,8 due to radioligand clearance in tissue. 9
Recently, Honhar et al. proposed a method that improves SUVR quantification by correcting for radioligand clearance in tissue (corrected SUVR or SUVRc). Their method demonstrated reduction of mean SUVR bias across regions and subjects for [18F]FE-PE2I in 40–60 minutes cross-sectionally.
10
The detailed derivation of the correction for SUVR has been reported.
10
In brief, SUVRc is calculated as follows (equation (1)).
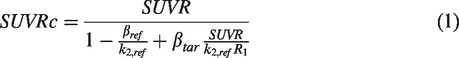
The denominator on the right-hand side of equation (1) represents the correction needed in SUVR due to non-equilibrium tracer kinetics from the reference and target regions. Note that if the tracer was at true equilibrium or steady-state kinetics, β
ref
= β
tar
= 0, and we would have the trivial result that SUVRc = SUVR (no correction needed). Two terms in the denominator correct for the effects of tracer clearance on SUVR. For example, a faster clearance of the radiotracer in the target tissue compared to reference tissue leads to a more positive bias in SUVR (numerator), which is then corrected by a higher value of the denominator due to the third term, and vice-versa. R1 and k2,ref can be approximated

While equation (2) has been conceived empirically, it underscores the inverse relationship between the target availability (in SUVR units) within a tissue and the clearance of the radiotracer within it, i.e., the radiotracer should have a smaller clearance rate in tissue with higher target availability. Using this idea, the clearance rate of the tracer from any brain tissue can be expressed as a linear function of a known clearance rate from a composite tissue, and the difference between the target availability (in inverse of SUVR units) amongst the two tissue types. This does assume the existence of a composite region for which the tracer clearance rate is known or can be reliably estimated from data collected within SUVR time-window, which in practice is true for relatively large regions with high tracer uptake. Note that this regression estimator contains a parameter called the radiotracer constant,
In this study, we validated SUVRc in independent cross-sectional, longitudinal, and test-retest cohorts of [18F]FE-PE2I PET in HC and PD. The outcome measure of interest was the corrected SUVR using data at a late acquisition time-window (50–80 min). We compared diagnostic performance of SUVRc50–80 min with DVR and early SUVR (15–45 min), which has been shown to be one of the best time-windows, offering strong correlation with DVR, relatively low bias, and good reproducibility, as well as reliable longitudinal assessment in previous reports. 8
Material and methods
Patients
The participants included in this study were part of three studies approved by the Ethics Committee of the Stockholm Region, by the Swedish Ethical Review Authority, by the Radiation Safety Committee of the Karolinska University Hospital, Stockholm, Sweden, and by the Swedish Medicinal Product Agency. The studies were registered as Clinical Trials in the EudraCT database: EudraCT 2011-002005-30 (EPN Dnr: 2011/703-31/2), EudraCT 2017-001585-19 (EPN Dnr: 2017/878-31/4), and EudraCT 2017-003327-29 (EPN Dnr: 2017/1605-31). The studies were conducted according to the ethical standards of the Ethics Committee of the Stockholm Region and the Swedish Ethical Review Authority and were in line with the Declaration of Helsinki. Patients provided written informed consent for study participation after detailed explanation from the investigator.
Demographic and clinical data are summarized in Table 1. In short, the total cohort consists of thirty-eight PD patients (median age, 67 years; range: 45–79 years) and thirty-eight age- and sex-matched healthy controls (median age, 66 years; range: 43–74 years). The cross-sectional, test-retest (n = 9, median age, 68 years; range: 54–74 years) and longitudinal (n = 21, median age, 67 years; range: 47–74 years) DAT PET data for the three cohorts have already been reported.11 –13 All participants underwent the same screening procedure, i.e. exclusion of clinically relevant comorbidities, psychiatric conditions, illicit drug abuse or alcoholism, as assessed by structured interview, physical examination, blood tests, electrocardiogram, and brain MRI. Mini-Mental State Examination was performed to exclude cognitive decline. PD patients fulfilled the clinical diagnosis of PD according to the UK Parkinson’s Disease Brain Bank criteria. 14 The re-analysis of the data with the new method was approved by the Swedish Ethical Review Authority.
Demographics and clinical characteristics.
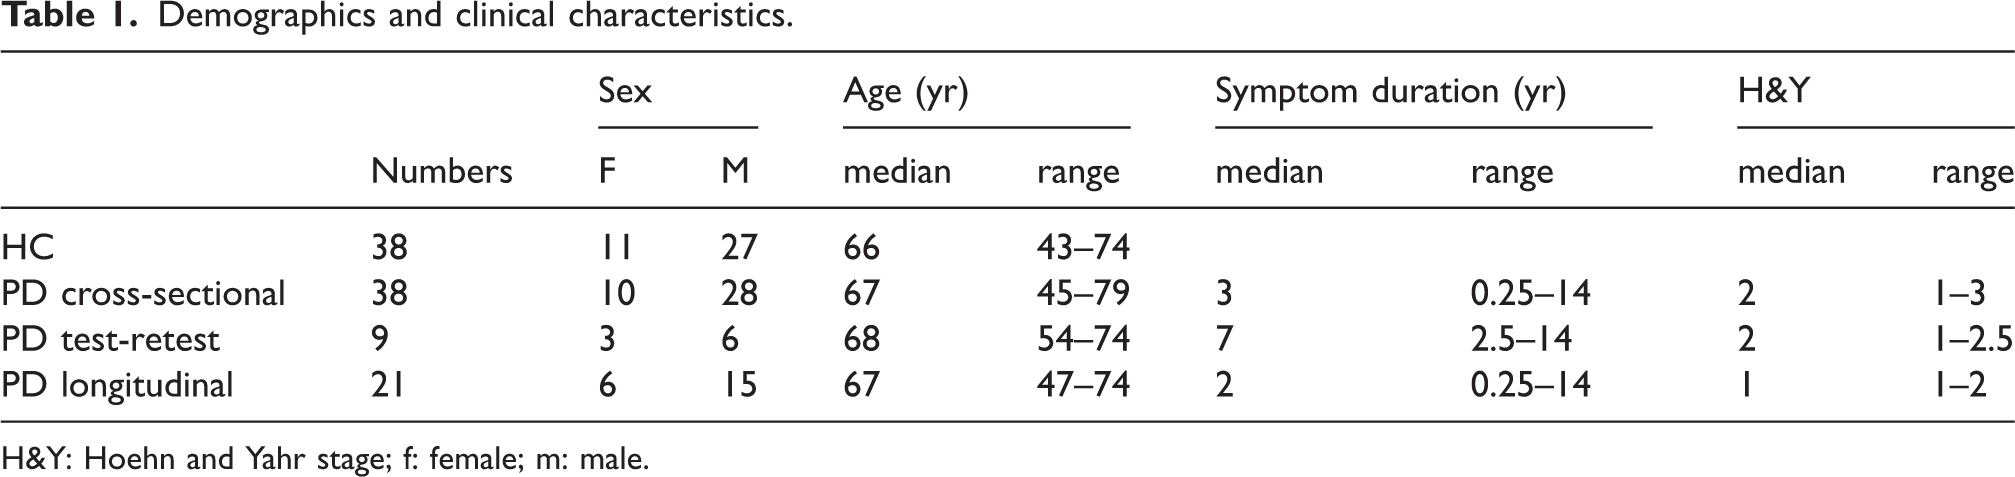
H&Y: Hoehn and Yahr stage; f: female; m: male.
MRI acquisition
All participants underwent brain MRI scans on a 3-Tesla system (Discovery MR750; GE Healthcare) prior to PET examination as part of the initial evaluation and to delineate anatomic brain regions of interests (ROI). The T1-weighted sequence has 176 slices of 1 mm thickness, field of view 256 × 256 mm, resolution 1 × 1 × 1 mm, inversion time 450 ms, echo time 3.18 ms, and repetition time 8.16 ms.
PET acquisition
The radioligand [18F]FE-PE2I was prepared with the methods described previously. 15 Dynamic PET measurements were obtained using a high-resolution research tomograph (HRRT) system (Siemens Medical Solutions). A 6-min transmission scan with a Cs-137 source was performed for attenuation correction. [18F]FE-PE2I was injected as i.v. bolus over 10 s, and the catheter was flushed with 10 mL NaCl. Emission data were acquired in list mode over 93 min. PET data were reconstructed in 37 frames of increasing duration (8 × 10 s, 5 × 20 s, 4 × 30 s, 4 × 60 s, 4 × 180 s, 12 × 360 s) using three-dimensional ordinary Poisson ordered subset expectation maximization with 10 iterations and 16 subsets including modelling of the system’s point spread function. 16 Frame-to-frame motion correction of reconstructed images was applied as previously described. 17 Two subgroups of PD patients underwent a second [18F]FE-PE2I PET examination with the average scan interval of 12 ± 8 days (test–retest cohort) or of 2.3 ± 0.5 years (longitudinal cohort).
Image analysis and DAT quantification
Image processing and analysis were performed using an in-house pipeline named Solena written in MATLAB (MATLAB r2014b, The MathWorks, Inc.). Within Solena, T1-weighted MP-RAGE sequences of each individual were segmented with FreeSurfer (FreeSurfer v6.0.0, https://surfer.nmr.mgh.harvard.edu/) 18 and the generated segmentation masks were used to define ROIs of the caudate nucleus, putamen, accumbens area and cerebellum as the reference region. A Functional MRI of the Brain Software Library template (https://fsl.fmrib.ox.ac.uk/fsl/fslwiki/Atlases/striatumconn) was used for the delineation of the sensorimotor striatum (SMS). An in-house developed template was used for the delineation of the substantia nigra (SN). 19 Subsequently, MRI and dynamic PET images were co-registered.
For DAT quantification, regional dynamic PET data were analyzed with the simplified reference tissue model (SRTM) using the cerebellum as reference region to estimate distribution volume ratio (DVR).20,21 SUVR was computed based on 50–80 minutes and 15–45 minutes of PET data. 8
Correction of regional SUVR
To calculate SUVRC, k2,ref = 0.10 min−1 (median k′2 SRTM across brain regions and subjects) 22 , R1 = 1 was used, βref was estimated using a single exponential fit to 50–80 minutes of cerebellar time activity curve, and βtar was computed using the regression model (equation (2)) with a = 0.0024 min−1 in both HC and PD cohort. The volume-weighted average of the caudate and putamen served as the composite region as previously described. 10
Statistical analysis
All analyses were performed using the statistics software R (R version 4.3.2, https://www.r-project.org/). We use descriptive statistics such as means with standard deviations or medians with range for continuous variables.
Cross-sectional cohort and control subjects
Linear regression analysis and 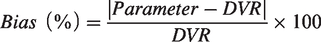
Coefficient of variance (CV) of outcome measures were calculated as standard deviation divided by mean of each group. Lin’s concordance coefficient (LCC) was used to evaluate the agreement between two continuous variables by measuring both precision and accuracy. The formula for LCC is:
Where 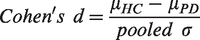
Receiver operating characteristic (ROC) analysis was performed to assess the diagnostic performance of the parameters, with the area under the ROC curve (AUC) used as a metric for comparison between methods.
Test-retest cohort
For test-retest cohort, test-retest variability (TRV) was calculated as
Longitudinal cohort
Annual longitudinal percent change (ALC) of each parameter was calculated using the formula below, considering the interval between the two PET scans.
Results
Part I: Validation in cross-sectional cohort
Comparison between SUVRc50–80 min and SUVR50–80 min
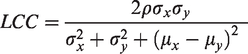
Bias and standard deviation of bias in SUVRc50–80 min with respect to DVR (gold standard) in different regions, compared to SUVR50–80 min, are shown in Figure 1 and Table 2. SUVR50–80 min consistently overestimated the DVR across all regions in HC (mean: 48.31% range: 28.32–53.80%) and in the PD group (mean: 29.91% range: 20.45–39.80%). A much lower bias was observed for SUVRc50–80 min across all regions in HC (mean: −0.80% range: −9.69–11.64%, p < 0.001) and in the PD group (mean: −0.12% range: −5.04–2.97%, p < 0.001). Additionally, the standard deviation of the bias across regions was also smaller for SUVRc50–80 min (in HC : 12.72%, in PD : 7.41%) compared to SUVR50–80 min (in HC : 20.49%, in PD : 13.95%), except for the SN. As shown in Figure 2, the range of βtar values was between 0.010 and 0.011 min−1 (mean ± SD: 0.010 ± 0.002 min−1) across all regions in the HC group and between 0.013 and 0.014 min−1 (mean ± SD: 0.013 ± 0.003 min−1) in the PD group.
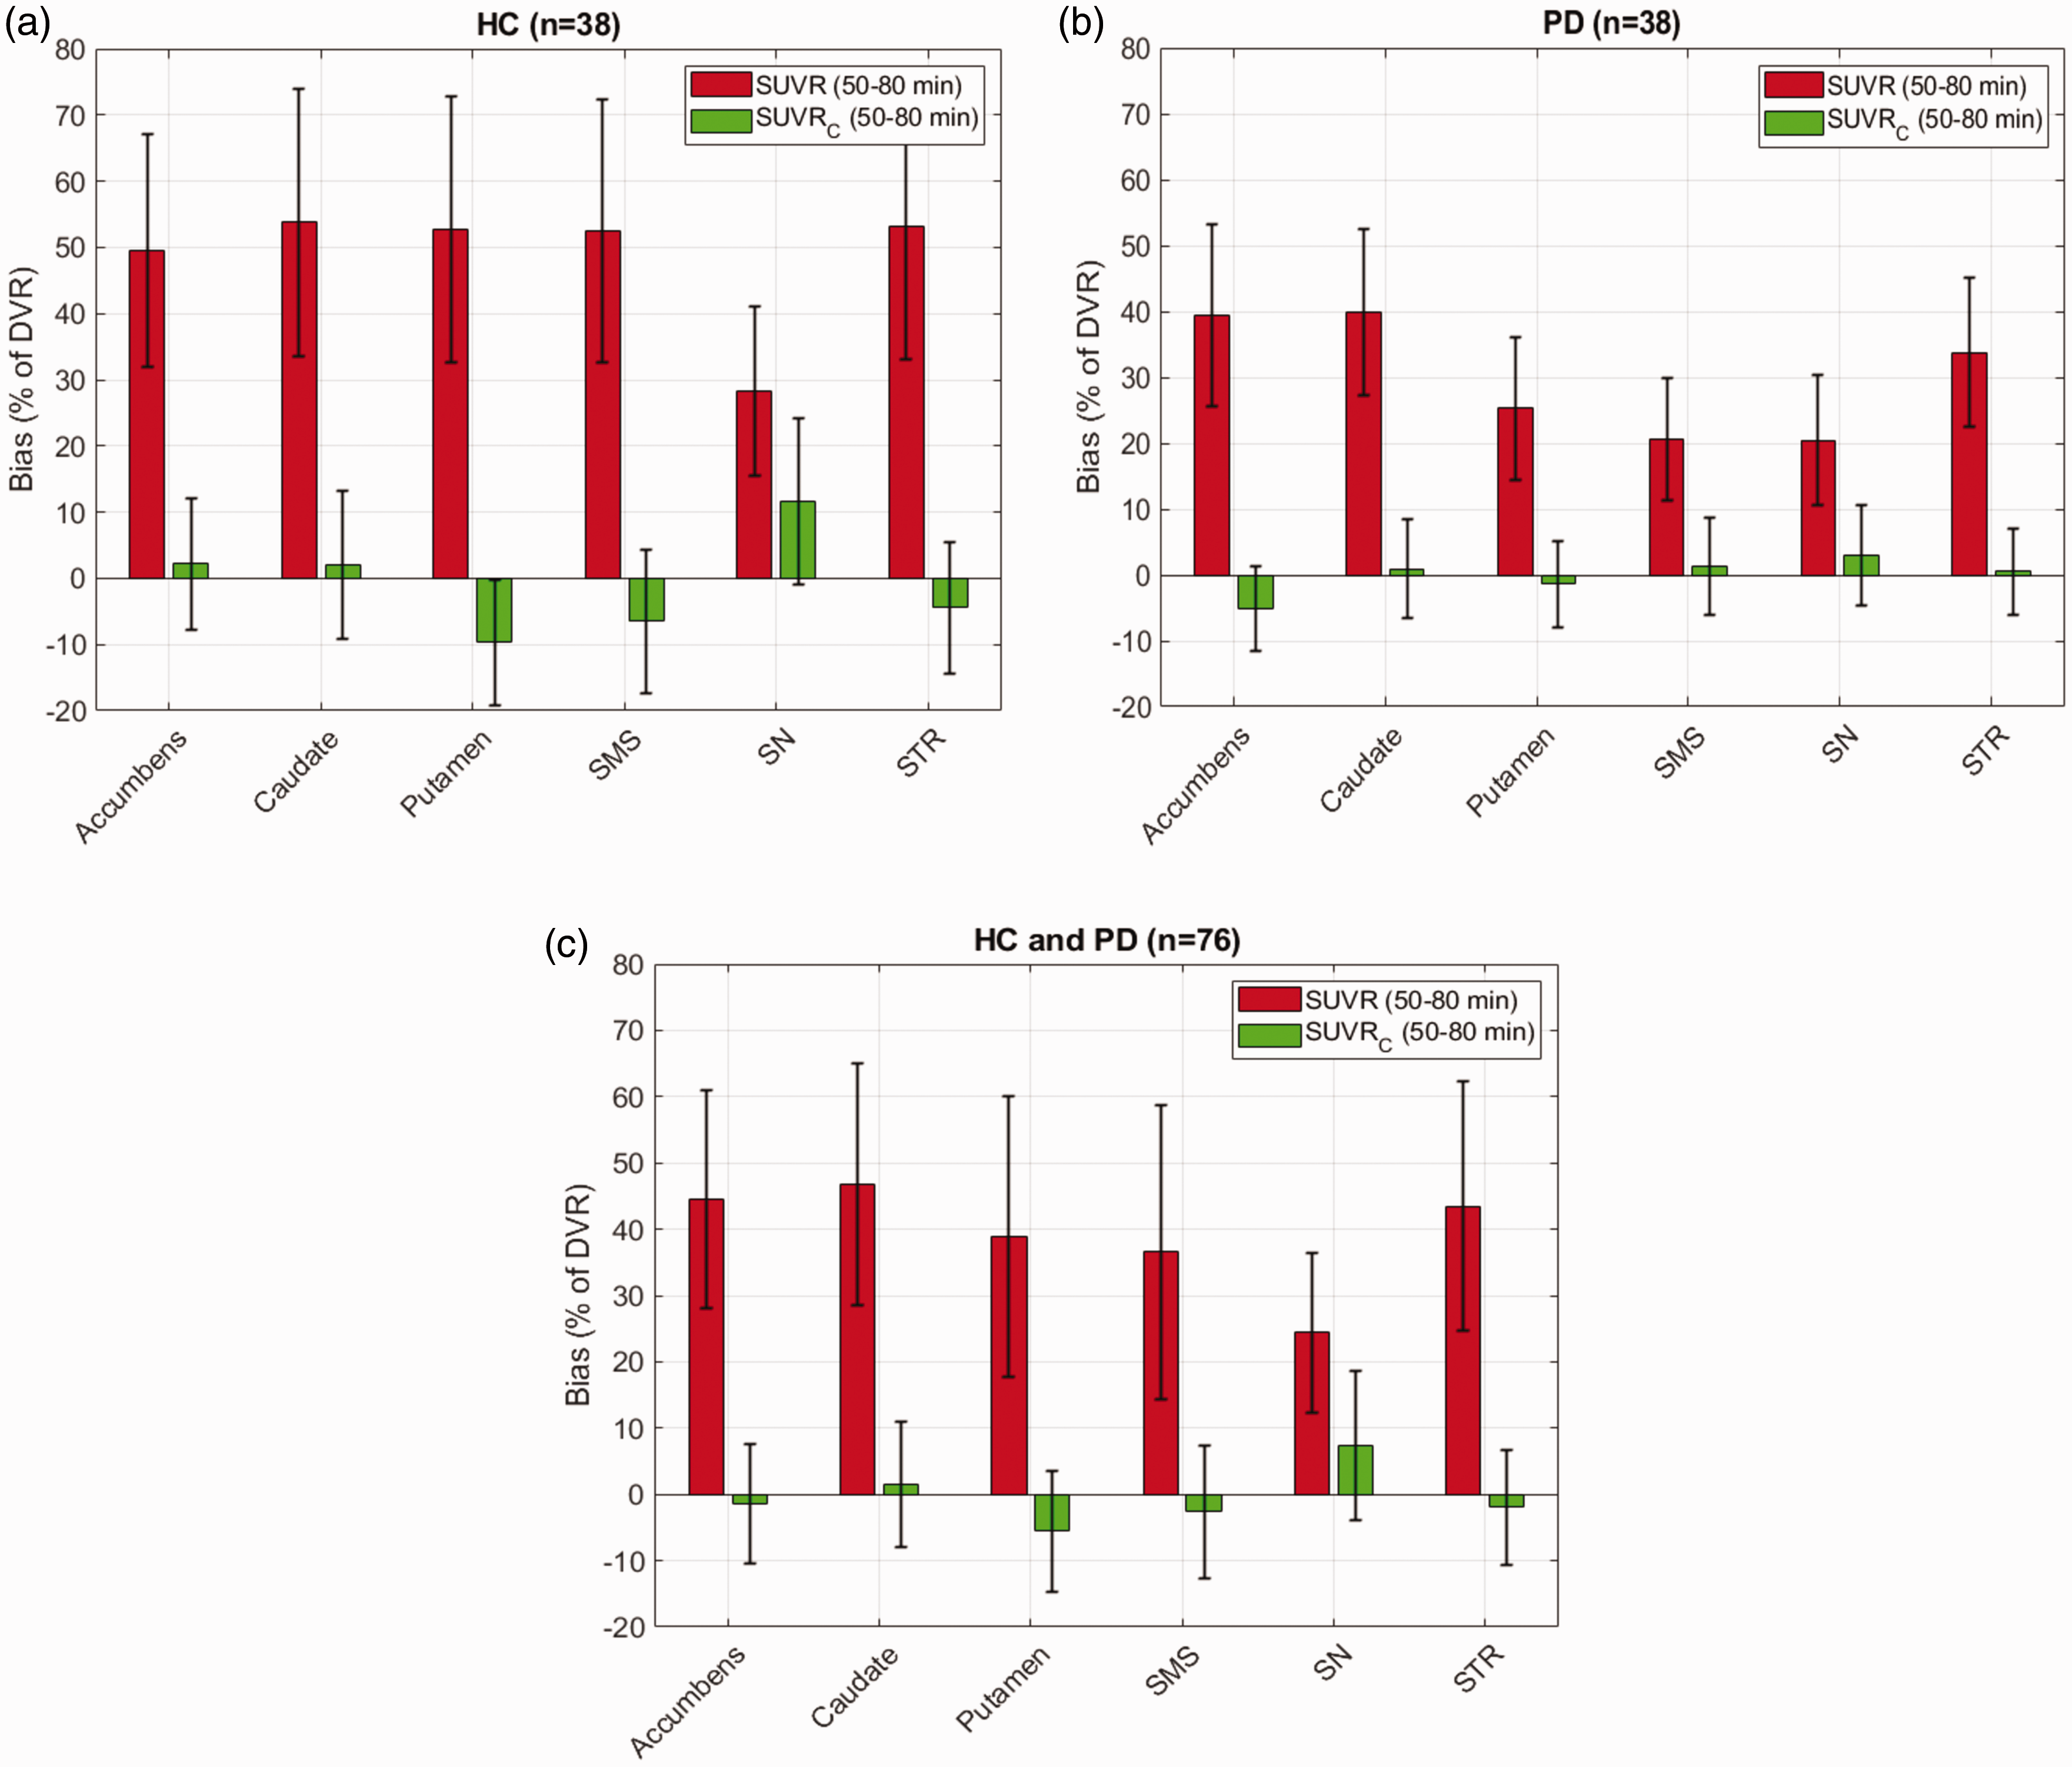
Performance of the correction formula (SUVRC) in reducing the bias and standard deviation of bias in DVR estimation in different regions for [18F]FE-PE2I compared to raw SUVR values calculated between 50–80 min post injection. Results reported separately for 38 healthy controls (HC, a) and 38 patients diagnosed with Parkinson’s disease (PD, b) and combined (c). SMS: Sensorimotor striatum; SN: Substantia Nigra; STR: Striatum.
(a) Mean bias (+SD) of SUVR50–80 min, SUVRc50–80 min and SUVR15–45 min for DVR estimation; (b) Coefficient of variance (%) of outcome measures in HC and PD; (c) Effect sizes of outcome measures in different regions; (d) AUC and confidence interval (CI) determined by ROC analysis.
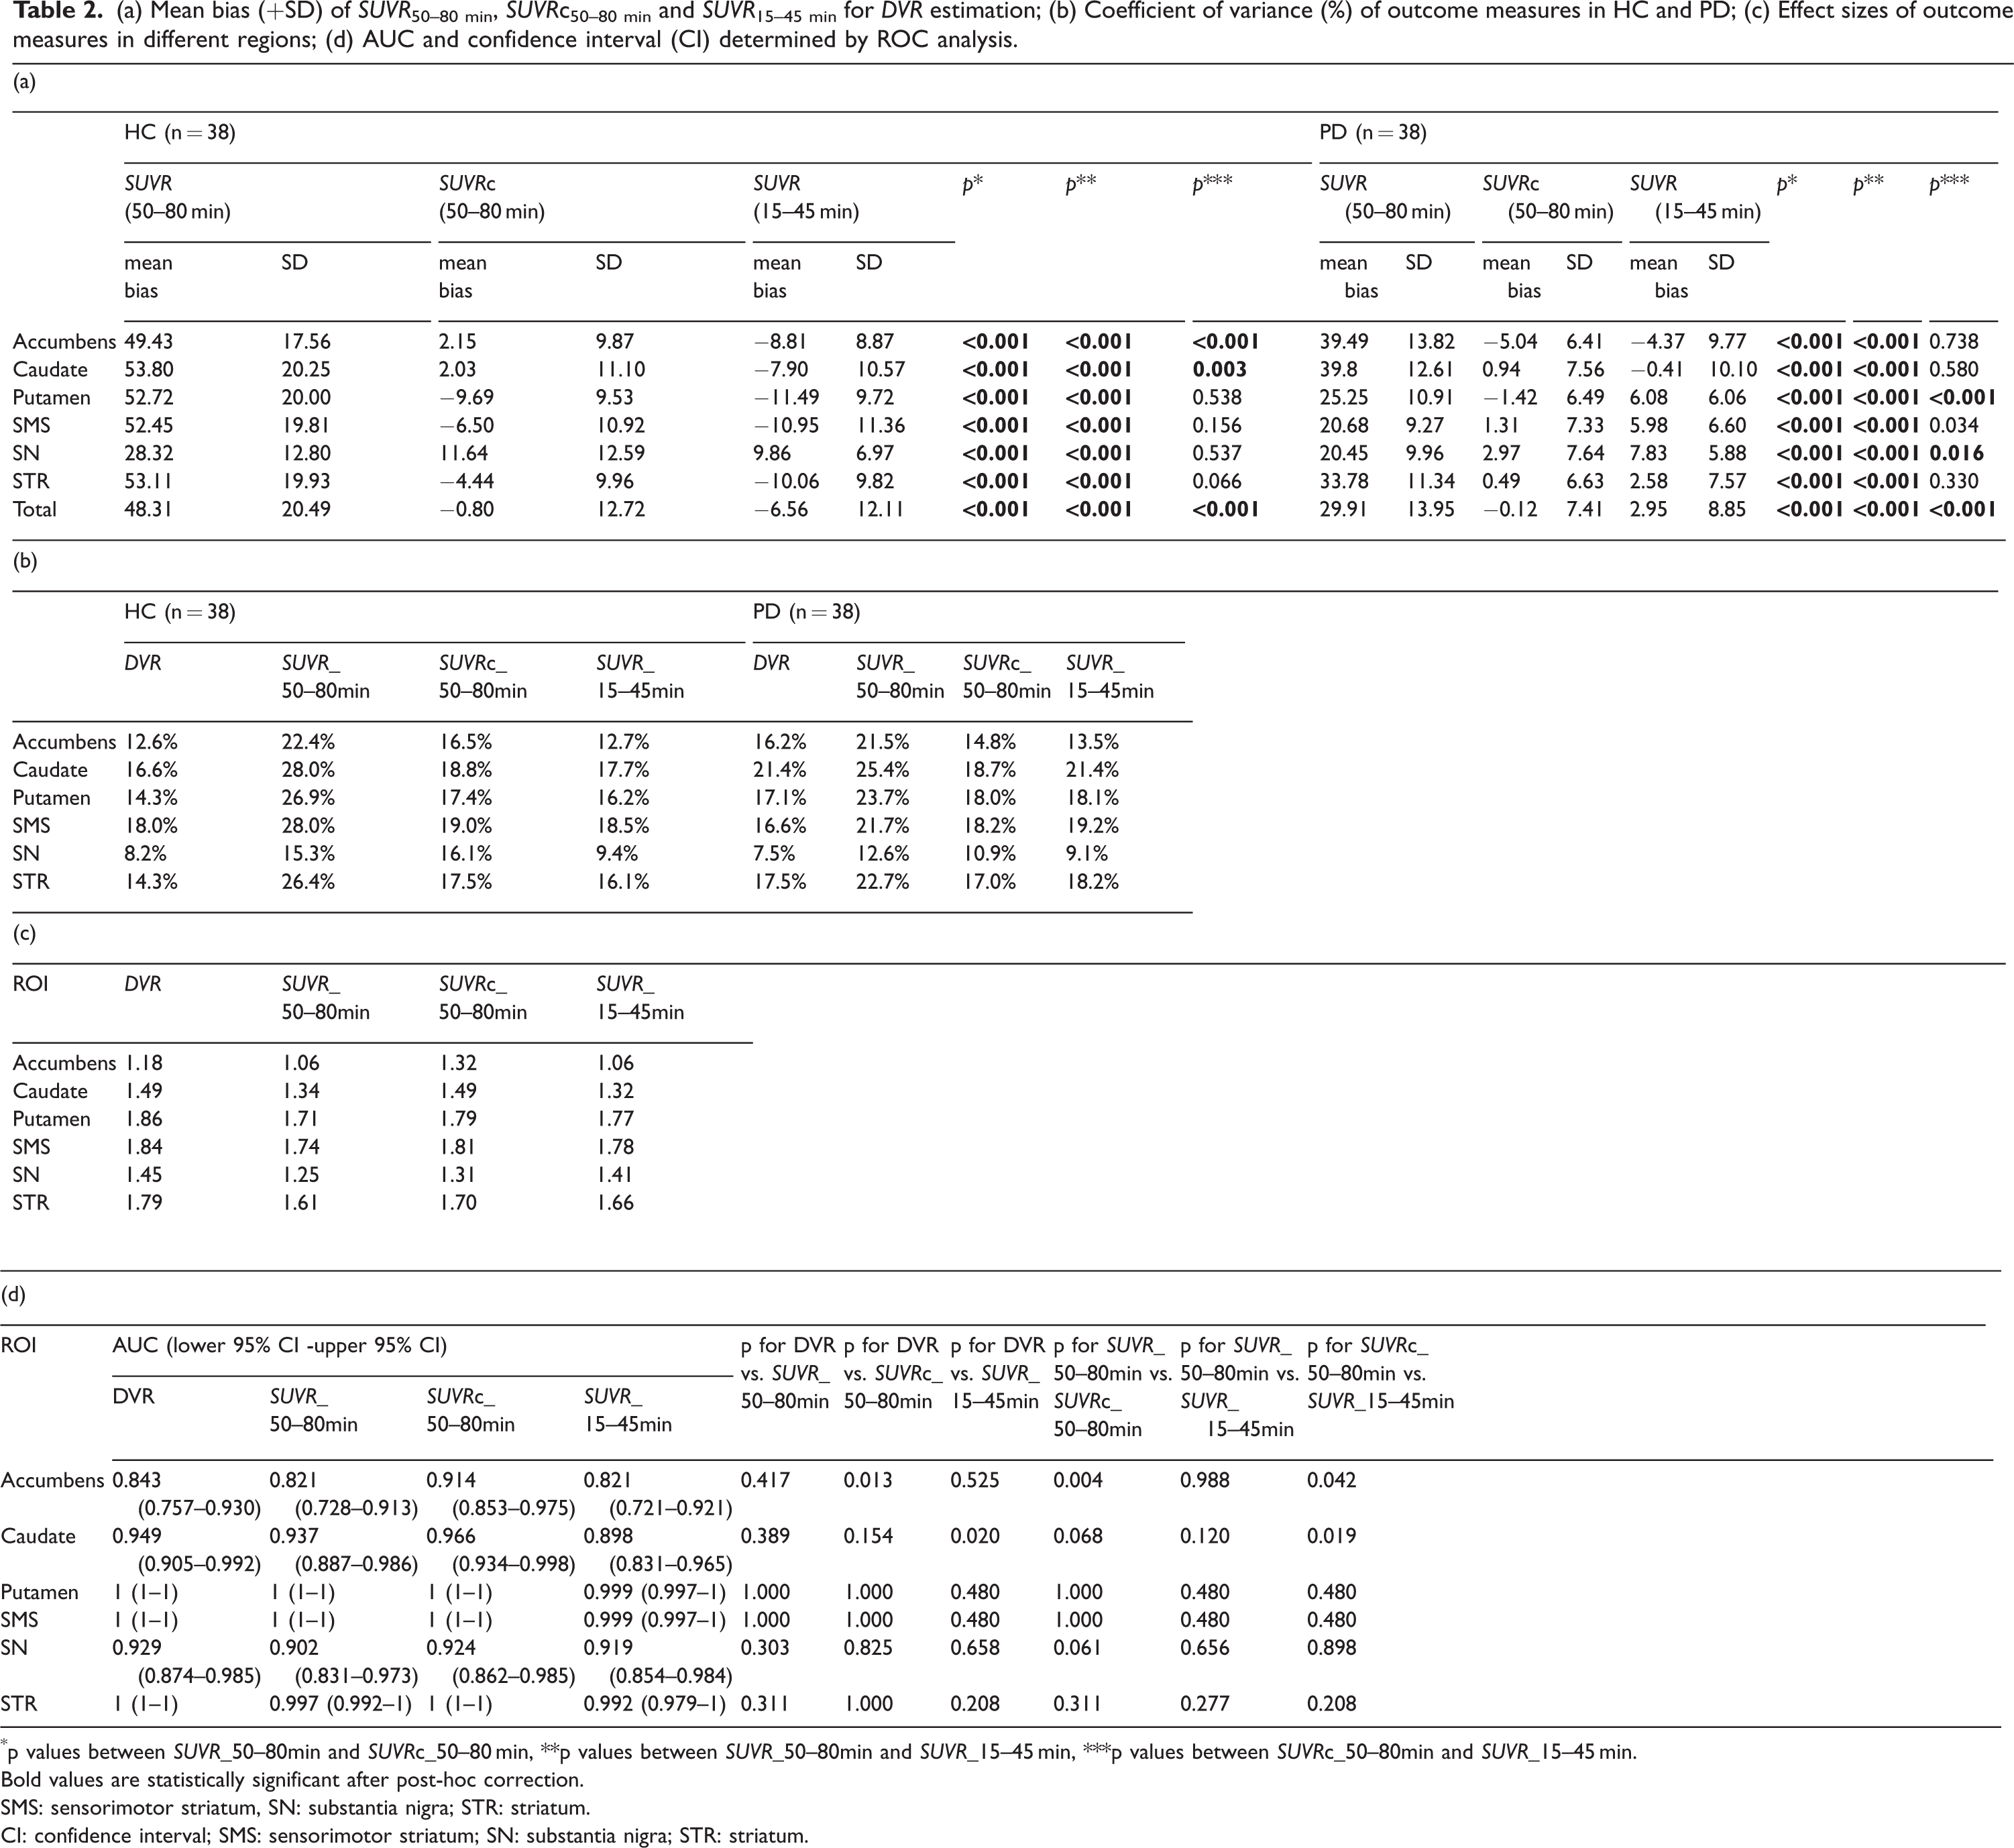
p values between SUVR_50–80min and SUVRc_50–80 min, **p values between SUVR_50–80min and SUVR_15–45 min, ***p values between SUVRc_50–80min and SUVR_15–45 min.
Bold values are statistically significant after post-hoc correction.
SMS: sensorimotor striatum, SN: substantia nigra; STR: striatum.
CI: confidence interval; SMS: sensorimotor striatum; SN: substantia nigra; STR: striatum.
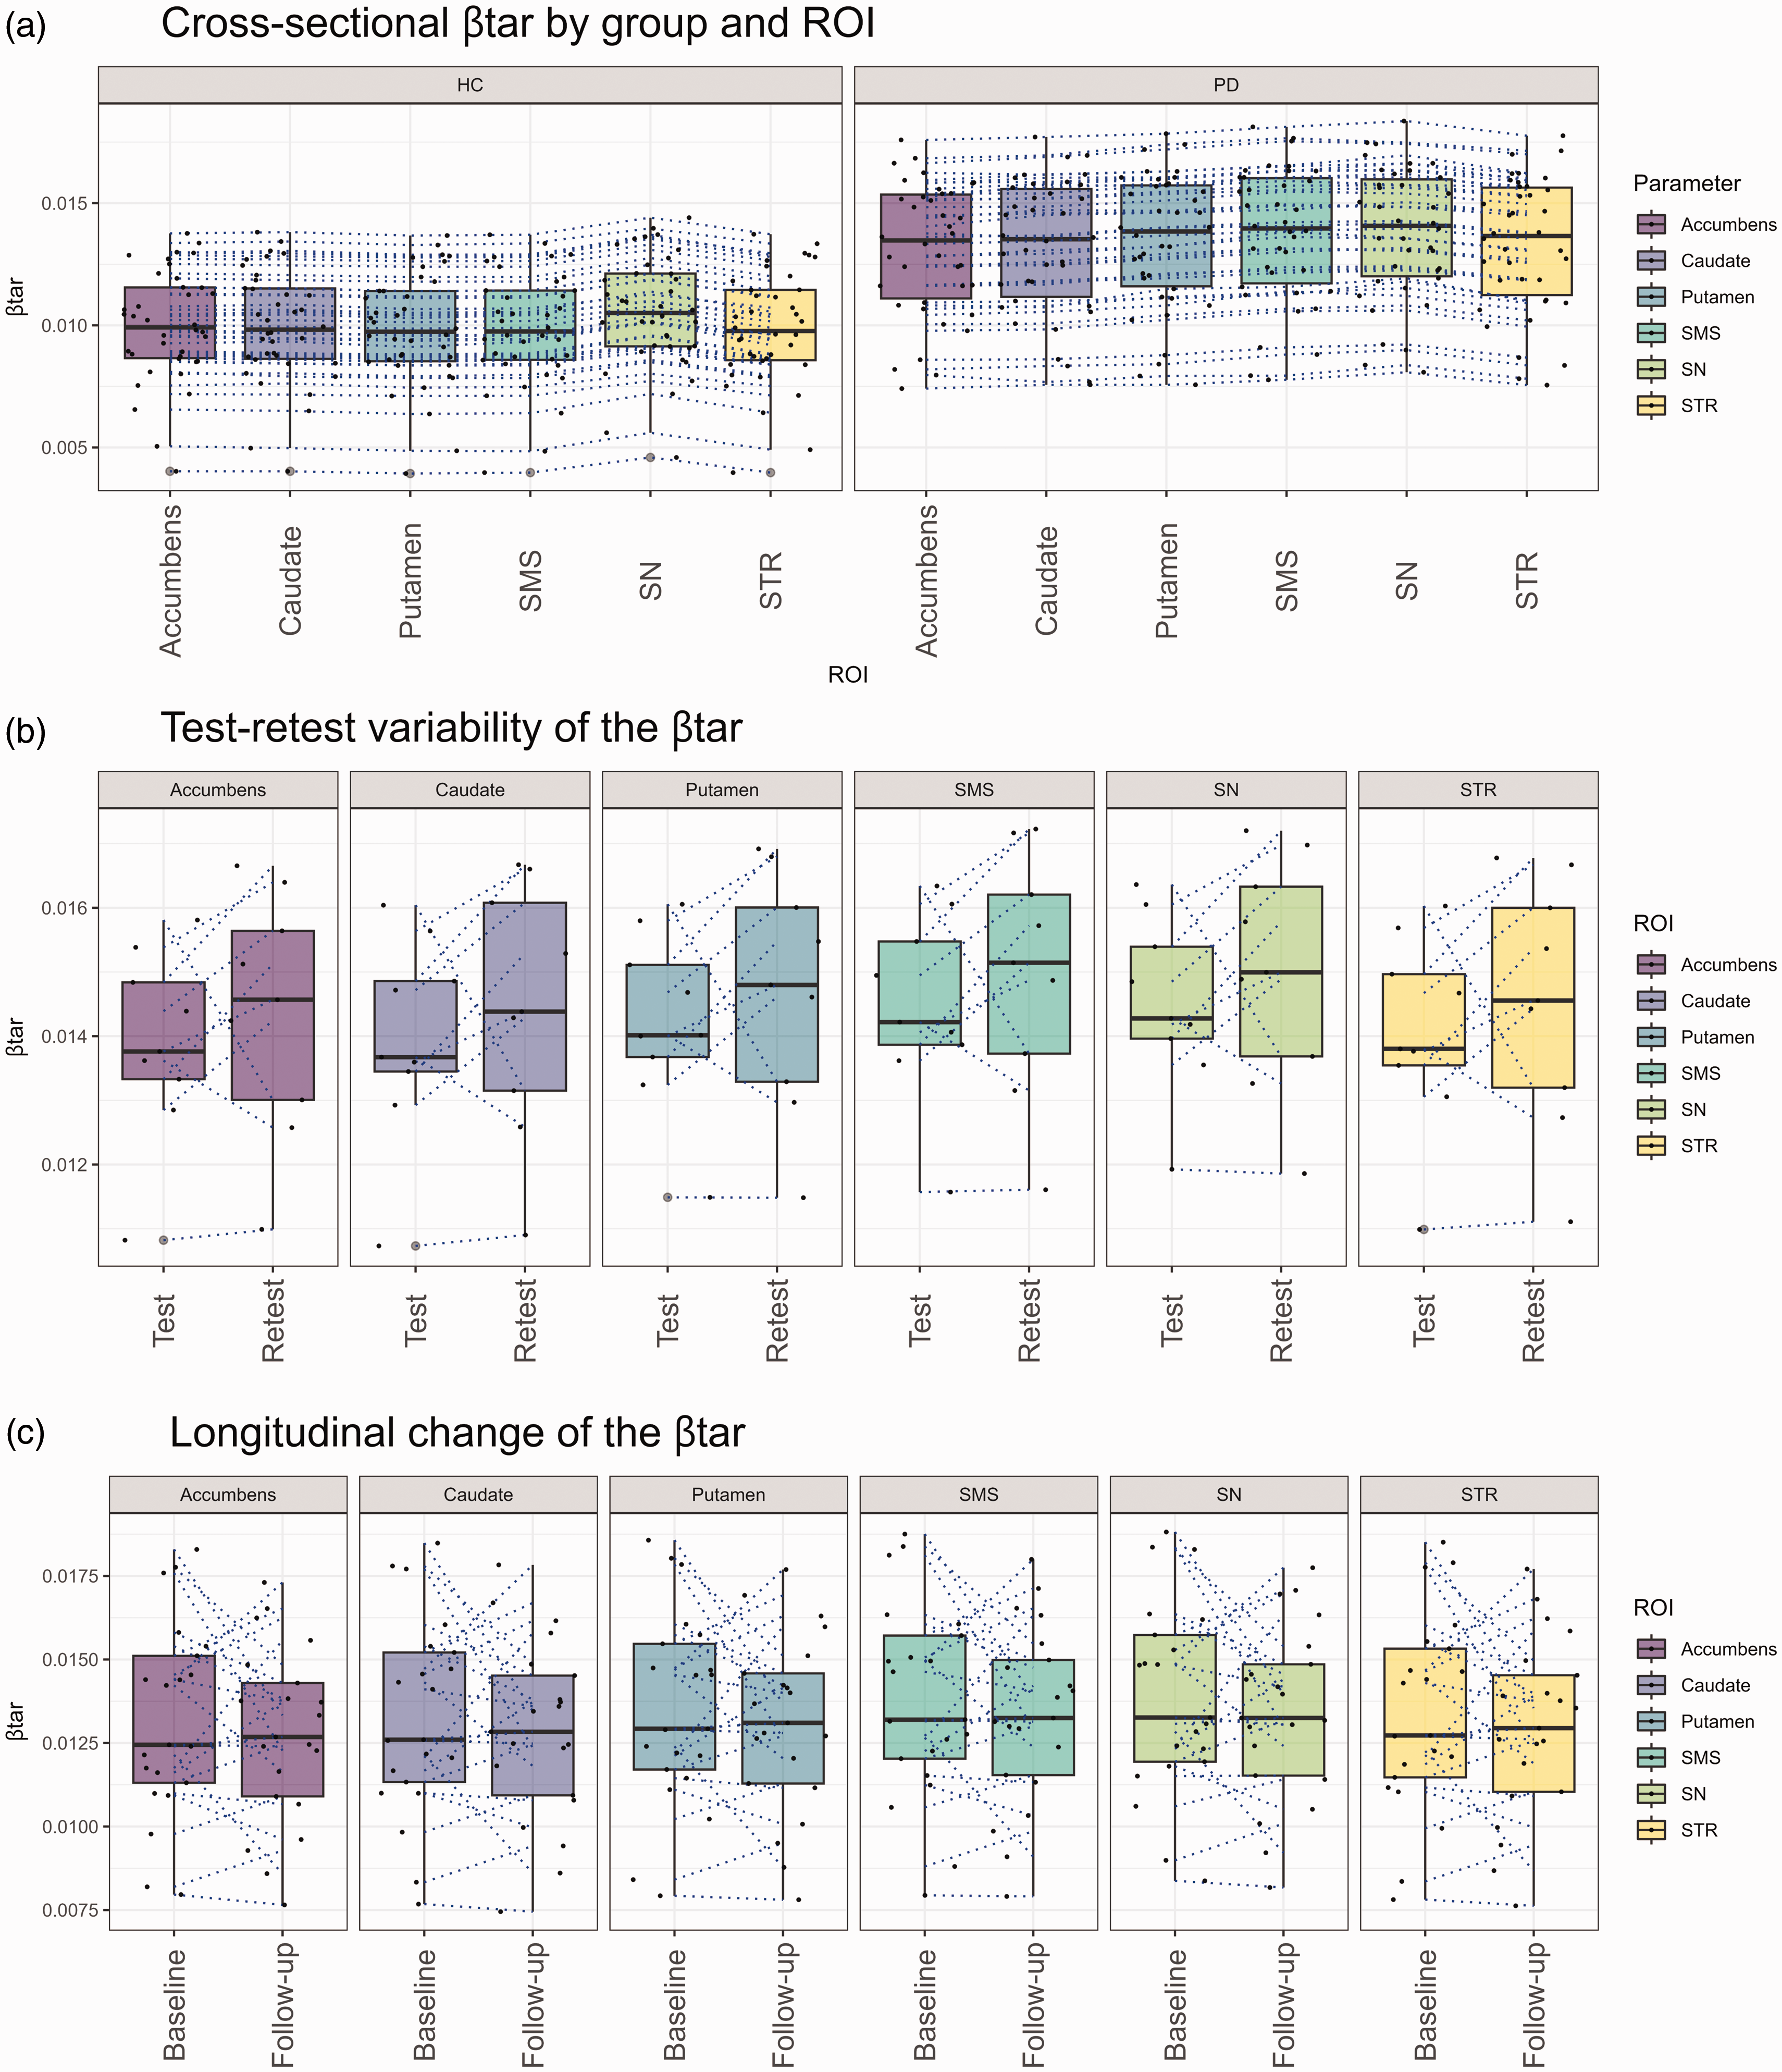
Boxplots illustrate the cross-sectional (a), test-retest (b) and 2-year longitudinal change (c) of the βtar Dotted lines represent individual trajectories between ROIs (a) test and retest (b) or baseline and follow-up (c). SMS: Sensorimotor striatum; SN: Substantia Nigra; STR: Striatum.
Comparison of SUVRc50–80 min and SUVR15–45 min
As shown in Table 2(a), in the HC and PD groups both SUVRc50–80 min and SUVR15–45 min showed reduced bias in all regions (p < 0.001) compared to SUVR50–80 min. The means bias and standard deviation of bias for SUVR15–45 min and SUVRc50–80 min across all regions were −6.56 ± 12.11% and −0.80 ± 12.72% in the HC group (p < 0.001), and 2.95 ± 8.85% and −0.12 ± 7.41% in the PD group (p < 0.001), respectively.. The bias of SUVRc50–80 min was smaller than the bias of SUVR15–45 min for the accumbens and caudate in the HC group (p < 0.001 and p = 0.003, respectively) and for the putamen and SN in the PD group (p < 0.001 and p = 0.016, respectively). In the HC group, the standard deviation of the regional bias (% of DVR units) in SUVRc50–80 min ranged from 9.53% for the putamen to 12.59% for the SN and in the case of SUVR15–45 min it ranged from 6.97% in the SN to 11.36% in SMS. In the PD group, it ranged from 6.41% in the accumbens to 7.64% in the SN in case of SUVRc50–80 min, whereas it ranged from 5.88% in the SN to 10.1% in the caudate in case of SUVR15–45 min.
Coefficient of variance (CV) of each parameter
In the HC group (Table 2b), the mean CV ranged from 8.2% to 18.0 for DVR, from 16.1% to 19.0% for SUVRc50–80 min, from 9.4% to 18.5% for SUVR15–45 min For the PD group (Table 2b), the mean CV ranged from 7.5% to 21.4 in DVR, from 10.9% to 18.7% in SUVRc50–80 min, from 9.1% to 21.4% in SUVR15–45 min.
Diagnostic performance of each parameter
Cohen’s d for group differences between the cross-sectional cohorts of PD and HC using DVR, SUVR50–80 min, SUVRc50–80 min, and SUVR15–45 min are presented in Table 2c. The effect sizes ranged from 1.18 in accumbens to 1.86 in putamen for DVR, from 1.06 in accumbens to 1.74 in SMS for SUVR50–80 min, from 1.31 in SN to 1.81 in SMS for SUVRc50–80 min, from 1.06 in accumbens to 1.78 in SMS for SUVR15–45 min.
The AUCs for discriminating between the PD and HC groups across different regions by each parameter are shown in Table 2d and Supplementary Figure 2. The AUCs ranged from 0.843 (95% confidence interval [CI]: 0.757–0.930) in the accumbens to 1.000 (95% CI: 1.000–1.000) in the putamen and SMS for DVR, with similar trends observed for other parameters.
Correlation and Lin’s concordance coefficient between DVR, SUVR50–80 min, SUVRc50–80 min and SUVR15–45 min
The correlation of SUVR50–80 min, SUVRc50–80 min and SUVR15–45 min with DVR across all regions is shown in Figure 3a to c. Correlation coefficient (r2) across all regions ranged between 0.74 (SN) and 0.93 (putamen) for SUVR50–80 min, 0.71 (SN) and 0.93 (putamen and SMS) for SUVRc50–80 min and between 0.64 (accumbens) and 0.92 (putamen) for SUVR15–45 min.
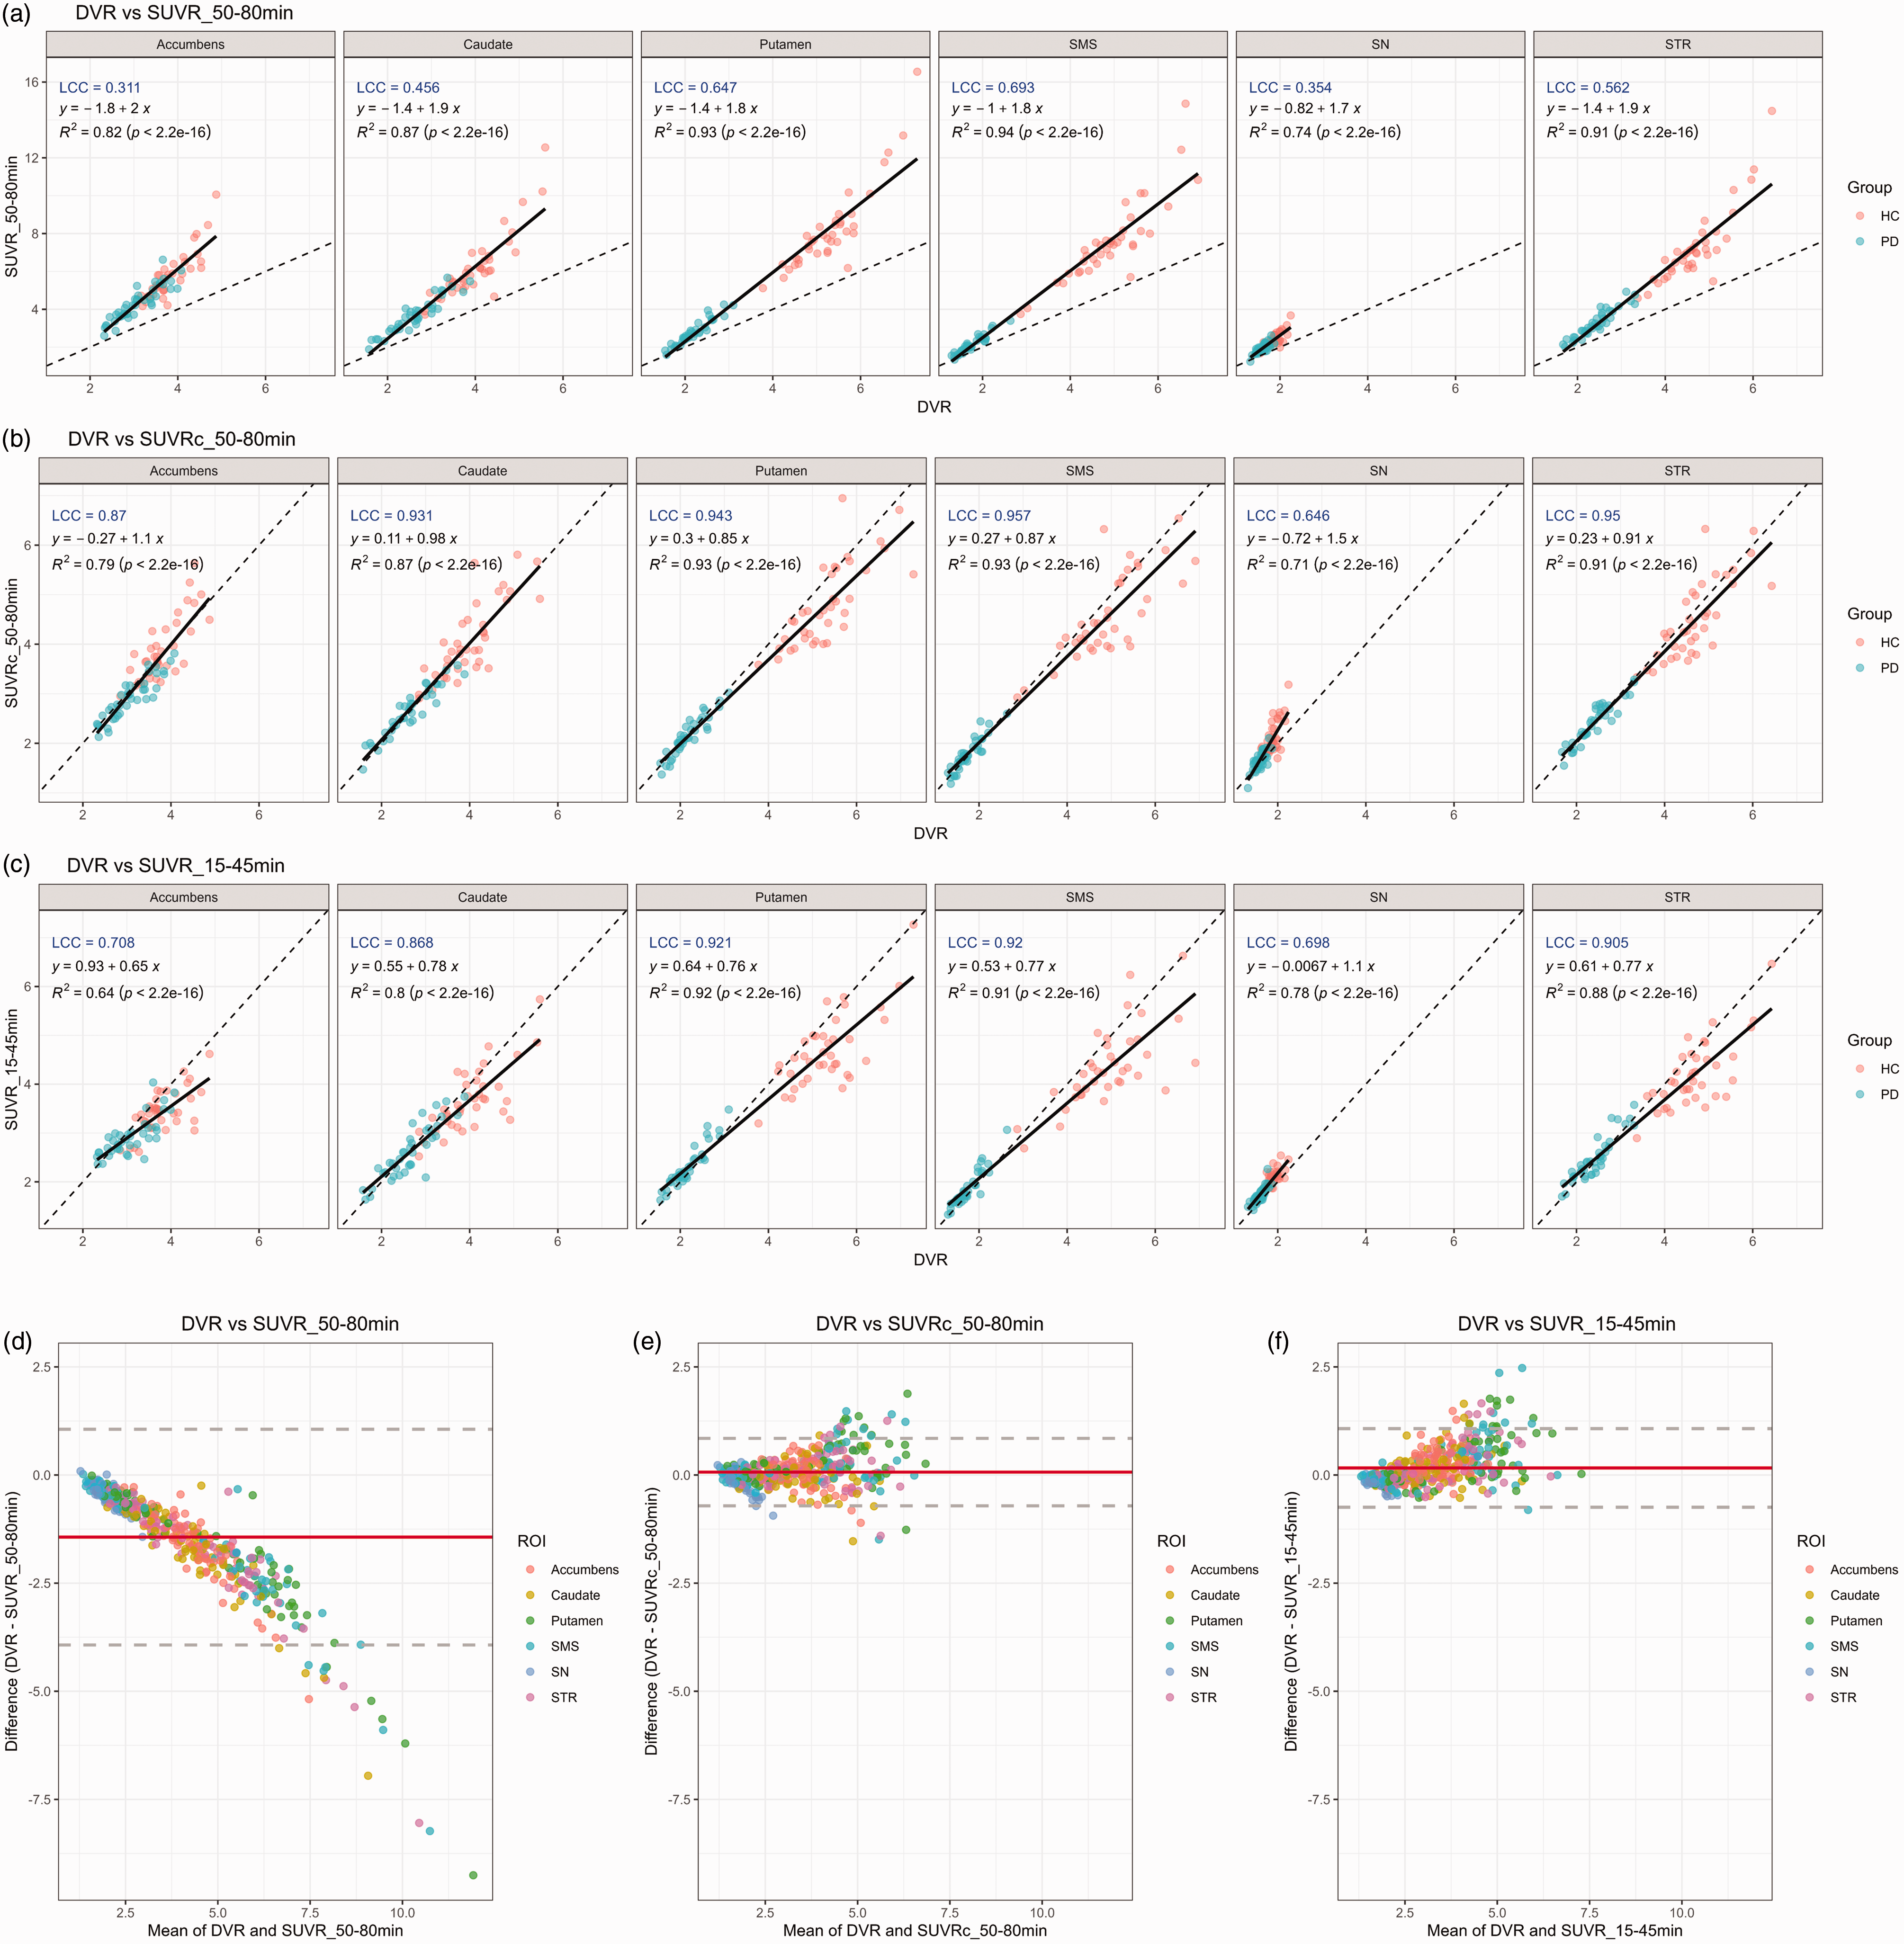
Correlation and Bland-Altman plots between DVR and SUVR_50–80min (a,d), SUVRc_50–80min (b,e) and SUVR_15–45min (c,f) by ROI on cross-sectional cohort. SMS: Sensorimotor striatum; SN: Substantia Nigra; STR: Striatum.
The slope ranged from 1.7 in the SN to 2.0 for the accumbens for SUVR50–80 min. SUVRc50–80 min demonstrated a higher slope in the caudate (slope = 0.98) than in the putamen (slope = 0.85), with the highest slope of 1.5 observed in the SN. Conversely, SUVR15–45 min showed almost identical slopes in the caudate (slope = 0.78) and in the putamen (slope = 0.76) with the lowest slope of 0.65 observed in the accumbens.
The LCC ranged from 0.311 in the accumbens to 0.693 in SMS for SUVR50–80 min, 0.646 in SN to 0.95 in STR for SUVRc50–80 min, and 0.698 in SN to 0.921 in putamen for SUVR15–45 min.
Bland-Altman plots between DVR, SUVR50–80 min, SUVRc50–80 min and SUVR15–45 min
The Bland-Altman plots in Figure 3d to (f) illustrate the agreement between DVR and SUVR50–80 min, SUVRc50–80 min, and SUVR15–45 min across various brain ROIs, respectively. SUVR50–80 min (Figure 3d) showed a downward bias, where the difference (DVR - SUVR50–80 min) decreased as the mean values increase, indicating a systematic overestimation of SUVR50–80 min compared to DVR, particularly at higher binding levels. Whereas SUVRc50–80 min (Figure 3e), and SUVR15–45 min (Figure 3f) demonstrated a minimal bias, with most were clustered within the mean difference line (red) and fewer deviations outside the limits of agreement (dashed gray lines). This suggest a better agreement between DVR and SUVRc50–80 min, as well as SUVR15–45 min, compared to SUVR50–80 min.
Part II: Test-retest variability
TRV across all regions are presented in Table 3a. The TRV of the striatum was 3.2 ± 2.5% (DVR), 6.4 ± 5.7% (SUVR50–80 min), 6.8 ± 5.9% (SUVRc50–80 min) and 3.9 ± 3.2% (SUVR15–45 min). The mean βcomposite for test and retest conditions (across subjects) was 0.014 ± 0.002 min−1 and 0.015 ± 0.002 min−1, respectively (Table 3b). The mean CV of βcomposite for test and retest conditions were 6.0 ± 3.3% and 9.7 ± 7.1%, respectively. Changes in βtar between test and retest conditions for each ROI are shown in Figure 2b. The mean difference and TRV of βcomposite were 0.001 ± 0.001 min−1 (range: 0.000–0.003) and 9.2 ± 5.1%. The correlations and LCCs are shown in Supplementary Figure 3.
Test-retest variability (%, n = 9) by region of interest for each outcome measure (a) and for βcomposite (b).
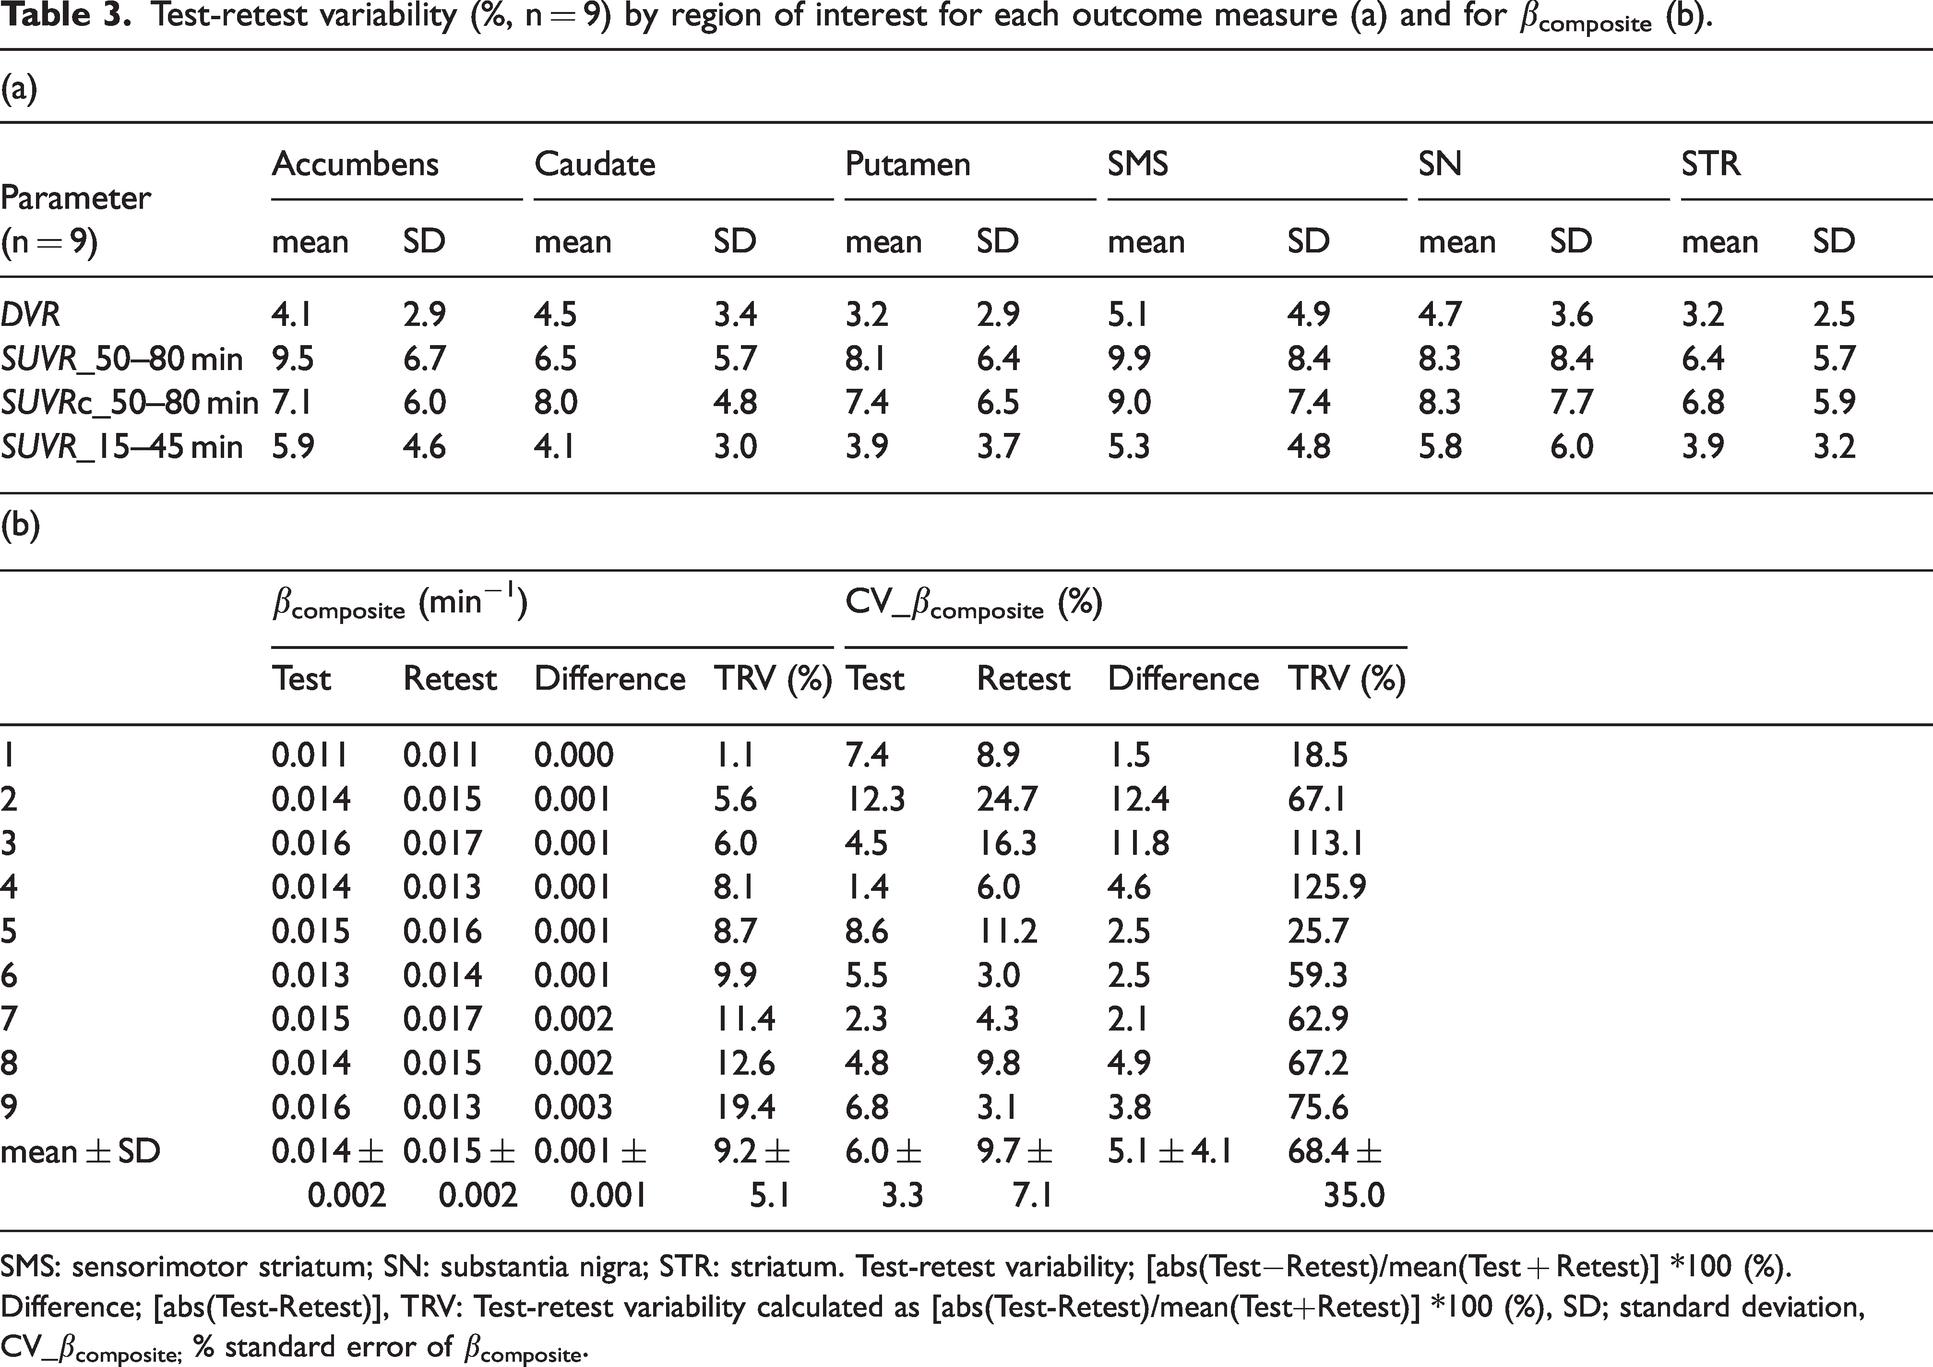
SMS: sensorimotor striatum; SN: substantia nigra; STR: striatum. Test-retest variability; [abs(Test−Retest)/mean(Test + Retest)] *100 (%).
Difference; [abs(Test-Retest)], TRV: Test-retest variability calculated as [abs(Test-Retest)/mean(Test+Retest)] *100 (%), SD; standard deviation, CV_βcomposite; % standard error of βcomposite.
Part III: Longitudinal changes
ALC across all regions is presented in Table 4a. The ALC of the striatum was 4.5 ± 4.2% (DVR), 5.2 ± 6.5% (SUVR50–80 min), 4.4 ± 4.1% (SUVRc50–80 min) and 4.2 ± 4.1% (SUVR15–45 min). The mean βcomposite at baseline and 2-year follow-up was 0.013 ± 0.003 min−1 and 0.013 ± 0.003 min−1, respectively (Table 4b). Changes in βtar between baseline and 2-year follow-up conditions for each ROI are shown in Figure 2c. The mean difference and ALC of βcomposite were 0.000 ± 0.002 min−1 (range: −0.005–0.005) and −1.9 ± 8.3%. The βcomposite for the striatum and SN increased in 61.9% (13/21) and 57.1% (12/21) of cases, respectively. The mean ± SD of CV of βcomposite at baseline and 2-year follow-up were 9.4 ± 4.9% and 8.5 ± 3.4%, respectively. The correlations and LCCs are shown in Supplementary Figure 4.
Annual longitudinal changes (%, n = 21) by region of interest for each outcome measure (a) and for βcomposite (b).
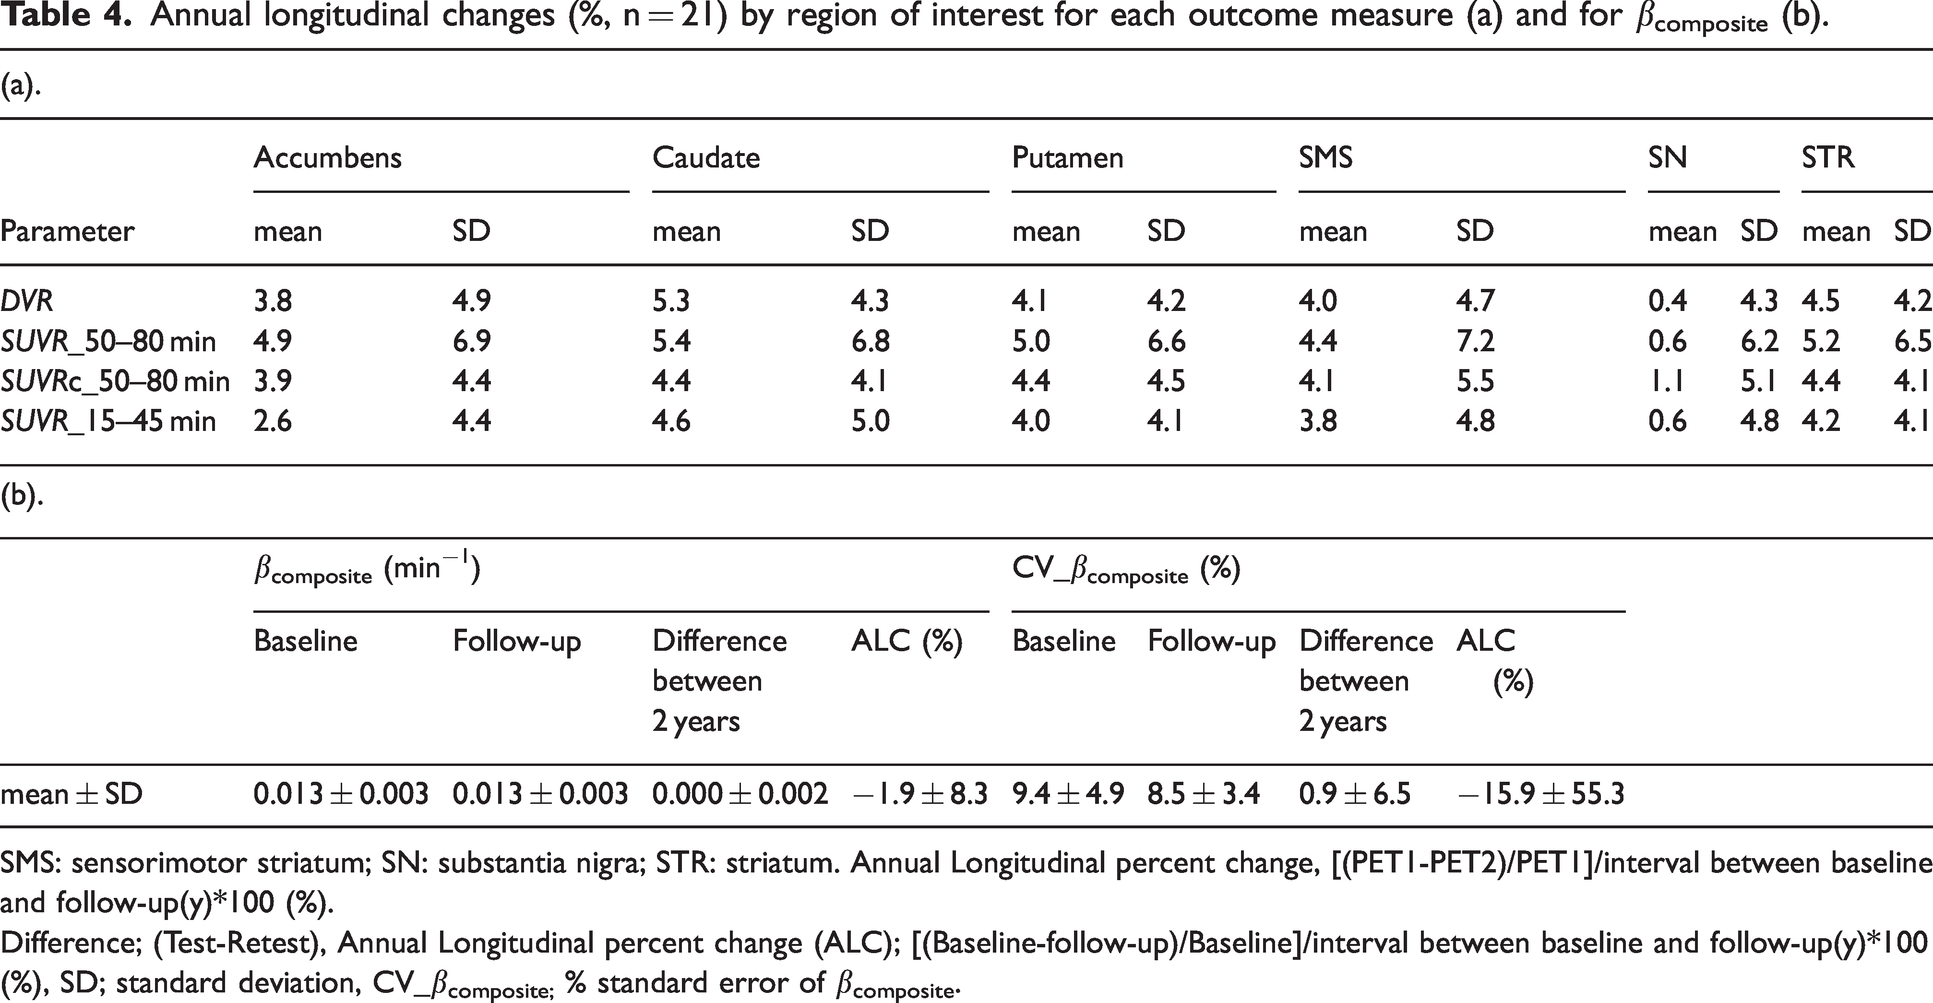
SMS: sensorimotor striatum; SN: substantia nigra; STR: striatum. Annual Longitudinal percent change, [(PET1-PET2)/PET1]/interval between baseline and follow-up(y)*100 (%).
Difference; (Test-Retest), Annual Longitudinal percent change (ALC); [(Baseline-follow-up)/Baseline]/interval between baseline and follow-up(y)*100 (%), SD; standard deviation, CV_βcomposite; % standard error of βcomposite.
Discussion
This study validated a correction method for SUVR (SUVRc) at late time-window, which accounts for non-equilibrium effects related to tracer clearance, in independent cross-sectional, test-retest and longitudinal (over 2 years) cohorts of HC and PD examined with [18F]FE-PE2I PET. In the present study, we extended the time-window to 30 minutes, within the time interval of 50 to 80 minutes.
SUVRc values were compared to DVR and early SUVR (15–45 min), both outcome measures that provide reliable test-retest variability and longitudinal assessment as previously reported 8 . The necessary parameters for the correction formula can be derived from a combination of previous literature estimates and a relatively short range of dynamic PET data during the late time window, enabling straightforward implementation. In the cross-sectional cohort, applying this correction method reduced both bias and variability in corrected SUVR quantification in line with previous reports by Honhar et al. 10
The formula appears to provide robust estimates for different reconstruction methods, ROI templates, and definition of the reference region. SUVR50–80 min overestimated DVR more in this study than previous report, probably attributed to the later time window that was used. This effect was more pronounced in the HC group than in the PD group, which is expected given that clearance rates are influenced by volume of distribution (VT) values. βtarget was higher in the PD group compared with the HC group across all regions (p > 0.001), which likely contributed to the lower Cohen’s d for SUVR50–80 min, compared to SUVRc50–80 min.
Compared to SUVR50–80 min, both SUVRc50–80 min and SUVR15–45 min reduced the bias in the estimation of DVR. SUVRc50–80 min exhibited a stronger correlation compared to SUVR15–45 min across all striatal subregions, except in the SN. The linear regression analysis done in relation to DVR showed that while the slope of the SUVR15–45 min was rather consistent across regions, the slope of the SUVRc50–80 min showed more variability across the main striatal subregions, including the caudate and putamen. This variability is likely related to the individual variance of βtar across the ROIs in the cross-sectional cohort, as shown in Figure 2a. Methodological factors, such as inaccuracies in βtar estimation in some regions due to constraints like the linear form of the regression estimator, could explain regional variability in performance of SUVRc50–80 min. Although it was not statistically significant, the highest βtar was observed in the SN both in HC and PD as expected for a lower DAT binding region.
Test-retest variability of SUVRc50–80 min was higher than the test-retest variability of DVR and SUVR15–45 min. Although the numerical difference of βtar between test and retest of the striatum were 0.001 ± 0.001 min−1, the test-retest variability was 9.2 ± 5.1% with a range from 1.1 to 19.4%. As equation (1) is more sensitive to errors in βtar, even small changes in βtar could lead to increase bias (Supplementary Figure 5).
To mitigate errors in βtar, the clearance rate was determined through linear regression based on the radiotracer clearance rate from a composite region instead of estimating it directly from the noisy time-activity curve during a relatively short SUVR time window of 20 min. In the present study, we extended the time window to 30 minutes, within the time interval of 50 to 80 minutes. Yet, βtar remains vulnerable to minor changes in the time-activity curve of the composite region. Additional evaluation is needed to ensure the stability of βtar between the test and retest PET examinations.
In longitudinal data, the mean and SD in ALC of SUVRc50–80 min was similar to the mean and SD in ALC of DVR and SUVR15–45 min, while SUVR50–80 min showed the highest standard deviation. The mean ALC of SUVR50–80 min was similar to the mean ALC of DVR, SUVRc and SUVR15–45 min, but the SD of ALC of SUVR50–80 min was higher than SD of all the other outcome measures. The ALC of βtar was −1.9 ± 8.3% on average which is smaller than ALC of DVR or SUVRc50–80 min suggesting that changes in βtar have low impact on changes in SUVRc.
About two-thirds of PD subjects showed an increase in βtar at follow-up which is expected for reduced DAT binding. There have been no previous studies on the longitudinal changes in [18F]FE-PE2I clearance rates in the striatum and SN. Cross-sectional analysis showed that PD patients had higher βtar than healthy controls, as shown in Figure 2a. However, in about one-third of the longitudinal cohort, βtar decreases, which is likely due to errors in estimating this variable. Additional efforts should be done in order to stabilize βtar for longitudinal assessment of DAT availability using SUVRc.
It is important to note that the regression-based estimator (equation (2)) is an empirical construct, and the derivation of the SUVR correction formula (equation (1)) is independent of it. Several strategies can be explored in future to further improve the estimate of βtar, and thereby improve the accuracy of SUVR correction. First, our current regression estimator approximates a simple one-parameter linear relationship between βtar of a region and the inverse of its SUVR. For some regions where radiotracer kinetics are markedly different (such as SN for [18F]FE-PE2I), this regression estimator may benefit from the inclusion of a quadratic term, with a second constant (slope of quadratic term) that would need to be estimated from pilot data. Alternately, as the reference region and composite region represent two extremes of radiotracer uptake, another strategy could be to obtain an additional estimate for βtar by replacing the composite region by the reference region in the regression estimator and generating a final estimate for βtar by proportionately combining the two estimates based on the SUVR of the target region. This could ensure a greater role of the reference region (low binding region) in the estimation of βtar of other low binding regions. Second, Bayesian strategies with a stronger prior for βtar in regions where the current regression estimator leads to higher errors could lead to better estimation without the need to alter the form of the estimator. Finally, strategies involving deep neural networks could be employed to predict regional (or voxel-wise) βtar values from βcomposite and SUVR images. These strategies, either alone or in combination, have the potential to further refine the SUVR correction approach.
Validation of the SUVR correction can provide useful insights for its translation to other radiotracers. First, this approach is useful for PET tracers used as diagnostic markers, such as amyloid and tau imaging, considering that determining positivity or negativity has a significant clinical impact 23 and that short scans are approved for clinical purpose.24,25 Furthermore, about 10% of the amyloid PET scans showed equivocal findings which is partially explained by suboptimal static imaging time due to individual variance of tissue clearance.26,27 The approach presented in this study could also be suitable for PET tracers with slower kinetic properties than [18F]FE-PE2I or for PET tracers for which a wide range of time-windows is used across centers (for instance, tau imaging), with the expectation that a slower clearance of the tracer might lead to a more reliable estimation of βtar. 28 Second, this approach could be important for achieving more accurate quantification as a prognostic marker. For example, lecanemab, an FDA-approved disease-modifying drug for early Alzheimer's disease, has demonstrated a reduction in amyloid burden on PET, as measured in centiloids derived from SUVR, in a trial substudy. 29 Therefore, this SUVR correction method could be helpful for ensuring accurate measurement of SUVR, which is crucial for assessing longitudinal changes and monitoring treatment efficacy.
Conclusions
This study validated a correction method for SUVR that accounts for non-equilibrium effects related to tracer clearance in a diverse set of cohorts, including cross-sectional, longitudinal, and test-retest groups examined with [18F]FE-PE2I PET. The necessary parameters for the correction can be derived from a combination of existing literature estimates and a brief dynamic PET scan during the late time window, facilitating straightforward implementation. In the cross-sectional cohort, employing this correction method minimizes both bias and variability in corrected SUVR quantification. Although the correction method was associated with larger test-retest variability than DVR, the mean and SD of longitudinal changes in SUVRc were similar to those in DVR. The method proposed in this study can be used in cross-sectional studies with [18F]FE-PE2I, but its use in longitudinal studies should be considered with caution, considering the sensitivity of SUVRc to errors in βtar. .
Supplemental Material
sj-pdf-1-jcb-10.1177_0271678X251322407 - Supplemental material for Correcting SUVR bias by accounting for radiotracer clearance in tissue: A validation study with [18F]FE-PE2I PET in cross-sectional, test-retest and longitudinal cohorts
Supplemental material, sj-pdf-1-jcb-10.1177_0271678X251322407 for Correcting SUVR bias by accounting for radiotracer clearance in tissue: A validation study with [18F]FE-PE2I PET in cross-sectional, test-retest and longitudinal cohorts by Minyoung Oh, Praveen Honhar, Richard E Carson, Ansel T Hillmer and Andrea Varrone in Journal of Cerebral Blood Flow & Metabolism
Footnotes
Ethics approval
All procedures performed in studies involving human participants were in accordance with the ethical standards of the institutional and/or national research committee and with the principles of the 1964 Declaration of Helsinki and its later amendments or comparable ethical standards.
Data availability
Data will be provided upon reasonable request to the corresponding authors.
Funding
The author(s) disclosed receipt of the following financial support for the research, authorship, and/or publication of this article: Open access funding provided by Karolinska Institutet. This study was supported by funds from the Swedish Foundation for Strategic Research, by a grant from the Astra Zeneca Translational Science Center at Karolinska Institutet, by a grant from the Swedish Parkinson’s Disease Foundation, by the Swedish Science Council, and by a private donation.
Declaration of conflicting interests
The author(s) declared no potential conflicts of interest with respect to the research, authorship, and/or publication of this article.
Authors’ contributions
All authors contributed to the study conception and design. PH, REC, ATH conceived and developed the correction formula. Material preparation, data collection, simulations and data analysis were performed by MO, PH, REC, ATH and AV. MO and PH drafted the initial manuscript. MO, PH, REC, ATH, AV reviewed and approved the final version of this manuscript.
Informed consent
Informed consent was obtained from all individual participants included in the study.
Supplementary material
Supplemental material for this article is available online.
References
Supplementary Material
Please find the following supplemental material available below.
For Open Access articles published under a Creative Commons License, all supplemental material carries the same license as the article it is associated with.
For non-Open Access articles published, all supplemental material carries a non-exclusive license, and permission requests for re-use of supplemental material or any part of supplemental material shall be sent directly to the copyright owner as specified in the copyright notice associated with the article.