
Abstract
Quantitative parametric images of O-(2-[18F]fluoroethyl)-L-tyrosine kinetics in diffuse gliomas could be used to improve glioma grading, tumour delineation or the assessment of the uptake distribution of this positron emission tomography tracer. In this study, several parametric images and tumour-to-normal maps were compared in terms of accuracy of region averages (when compared to results from nonlinear regression of a reversible two-tissue compartment plasma input model) and image noise using 90 min of dynamic scan data acquired in seven patients with diffuse glioma. We included plasma input methods (the basis function implementation of the single-tissue compartment model, spectral analysis and Logan graphical analysis) and reference tissue methods (basis function implementations of the simplified reference tissue model, variations of the multilinear reference tissue model and non-invasive Logan graphical analysis) as well as tumour-to-normal ratio maps at three intervals. (Non-invasive) Logan graphical analysis provided volume of distribution maps and distribution volume ratio maps with the lowest level of noise, while the basis function implementations provided the best accuracy. Tumour-to-normal ratio maps provided better results if later interval times were used, i.e. 60–90 min instead of 20–40 min, leading to lower bias (2.9% vs. 10.8%, respectively) and less noise (12.8% vs. 14.4%).
Introduction
Diffuse gliomas exhibit increased uptake and retention of O-(2-[18F]fluoroethyl)-L-tyrosine ([18F]FET), an amino acid tracer that can be visualised with positron emission tomography (PET). In a previous study, the optimal plasma input model for describing [18F]FET kinetics was identified. 1 However, VOIs have to be defined beforehand and tracer uptake distributions cannot be assessed. The currently recommended 2 [18F]FET PET standardized uptake value (SUV) image at 20–40 min shows good contrast between lesions and healthy tissue. Interpatient differences are reduced by normalizing tumour uptake to that in a contralateral healthy region. Indeed, a tumour-to-normal ratio at 20–40 min is widely used for tumour delineation. 3 At the same time, many other studies have used a dynamic scanning protocol, mostly for discriminating different tumour types based on uptake patterns. 3 Several methods exist for “catching” tracer kinetics into parametric images. In theory, parametric images are more accurate than SUV images or tumour-to-normal maps, and may be better for glioma grading or delineation. Yet Logan graphical analysis has been the only parametric method for quantifying [18F]FET uptake so far.4–6
The aim of this study was to determine the accuracy of parametric images and tumour-to-normal maps for quantifying [18F]FET uptake. Results obtained using the previously identified plasma input model were used as reference. In addition, image noise characteristics of the maps were taken into account.
Methods
Subjects
Data were derived from a study that has been reported previously.1,7 In short, the study population consisted of seven patients with a diffuse glioma (age range, 22–69 y; four glioma WHO 8 grade IV and three grade II). This study has been performed in accordance with the Declaration of Helsinki, approved by the Medical Ethics Committee of the VU University Medical Center and registered in the Netherlands National Trial Register (www.trialregister.nl, unique identifier NTR5354, registration date 4 August 2015). Written, informed consent was obtained from all subjects prior to inclusion.
Scanning protocol
Magnetic resonance (MR) sequences were acquired on an Achieva whole body 3.0T MR scanner (Philips Healthcare, Best, the Netherlands), equipped with a standard head coil. Each patient was scanned using a sagittal 3D fluid-attenuated inversion recovery (FLAIR) sequence (repetition time(TR)/echo time(TE)/inversion time(TI) 4800/279/1650 ms, acquired voxel size 1.12 × 1.12 × 1.12 mm3, reconstructed voxel size 1.04 × 1.04 × 0.56 mm3), and a sagittal 3D T1-weighted gadolinium-enhanced (T1G) sequence (TR/TE/TI/flip angle 7/3/950ms/12 °, acquired voxel size 0.98 × 0.98 × 1.0 mm3, reconstructed voxel size 0.87 × 0.87 × 1.0 mm3). A dynamic PET scan was acquired on either a Gemini TF-64 or an Ingenuity TF PET/computed tomography (CT) scanner (Philips Healthcare, Cleveland, Ohio, USA). Each scan started with a 1 min low dose CT scan for attenuation correction purposes. Next, a 90 min PET scan was acquired after administration of 200 MBq [18F]FET. The tracer was injected using a venous line, while an arterial line in the opposite arm was used for continuous sampling using an on-line blood sampler (Comecer Netherlands, Joure, the Netherlands). In addition, manual arterial samples were collected at 5, 10, 20, 40, 60, 75 and 90 min post injection of [18F]FET. Using the LOR-RAMLA algorithm, as provided by the manufacturer, scans were reconstructed into 22 frames (1 × 15, 3 × 5, 3 × 10, 4 × 60, 2 × 150, 2 × 300, 7 × 600 s), with an isotropic voxel size of 2 mm. Reconstructions included all usual corrections, i.e. normalization, decay, dead time, attenuation, randoms and scatter correction. The manual blood samples were used to calibrate the on-line blood curve and to correct it for plasma-to-whole blood concentration ratios and labelled metabolite fractions, thereby generating a metabolite corrected, arterial plasma input function.
Data analysis
Glioblastomas were delineated on T1-weighted gadolinium-enhanced MRI images (T1G) and lower grade gliomas on FLAIR MRI images. As described elsewhere, 1 tumour segmentations were divided into three equal sized volumes of interest (VOI) using the 33rd and 67th percentiles of the activity concentrations of [18F]FET at 20 to 40 min. A spherical reference region with a radius of 14 mm was placed in the middle of the contralateral homologous brain region. 1 Time activity curves were extracted from these regions, which were fitted to the reversible two-tissue compartment plasma input model with additional blood volume fraction using nonlinear regression. In earlier work, 1 we found that reversible models were always preferred over the irreversible model in both tumour and reference regions and that the reversible two-tissue compartment model was preferred over the reversible single-tissue compartment model in most cases. The total volume of distribution (VT) was used as outcome measure. The distribution volume ratio (DVR) was calculated by normalizing the VT to the VT of the reference region. Results for both parameters served as reference standard for the agreement analysis.
Parametric VT images were created using a basis function implementation of the reversible single-tissue compartment model (BFM),
9
plasma input-based Logan graphical analysis (Logan)
10
and spectral analysis (SA).
11
Using the contralateral reference region, reference input-based Logan analysis (RLogan)
12
was used to create a DVR map. Non-displaceable binding potential (BPND) maps were generated with basis function implementations of the simplified reference tissue model (receptor parametric mapping (RPM) and SRTM2)13,14 and using several variations of the multi-linear reference tissue model (MRTMO, MRTM, MRTM2, MRTM3 and MRTM4).15–17 MRTM2, MRTM3, MRTM4 and SRTM2 are all methods using a fixed
All maps were visually inspected for artefacts. After extracting average regional values from the parametric images, Bland–Altman analysis 18 was used to determine the accuracy, i.e. the agreement with the reference, described above. Relative differences were calculated by dividing the difference by the reference. Results were summarized by both mean and standard deviation of these relative differences.
The 3D T1G sequence was used for segmenting grey matter with SPM12. 19 The grey matter probability map of the whole brain, including cerebellum, was converted to a binary mask using an intensity cut-off of 0.9. The tumour VOI was excluded from the grey matter mask to obtain a mask with only normal appearing brain tissue. This region was used to estimate image noise in the parametric maps by means of the coefficient of variation (COV, the standard deviation divided by the mean) of the voxel values within the region. These image noise estimates were used to rank the methods with respect to image quality.
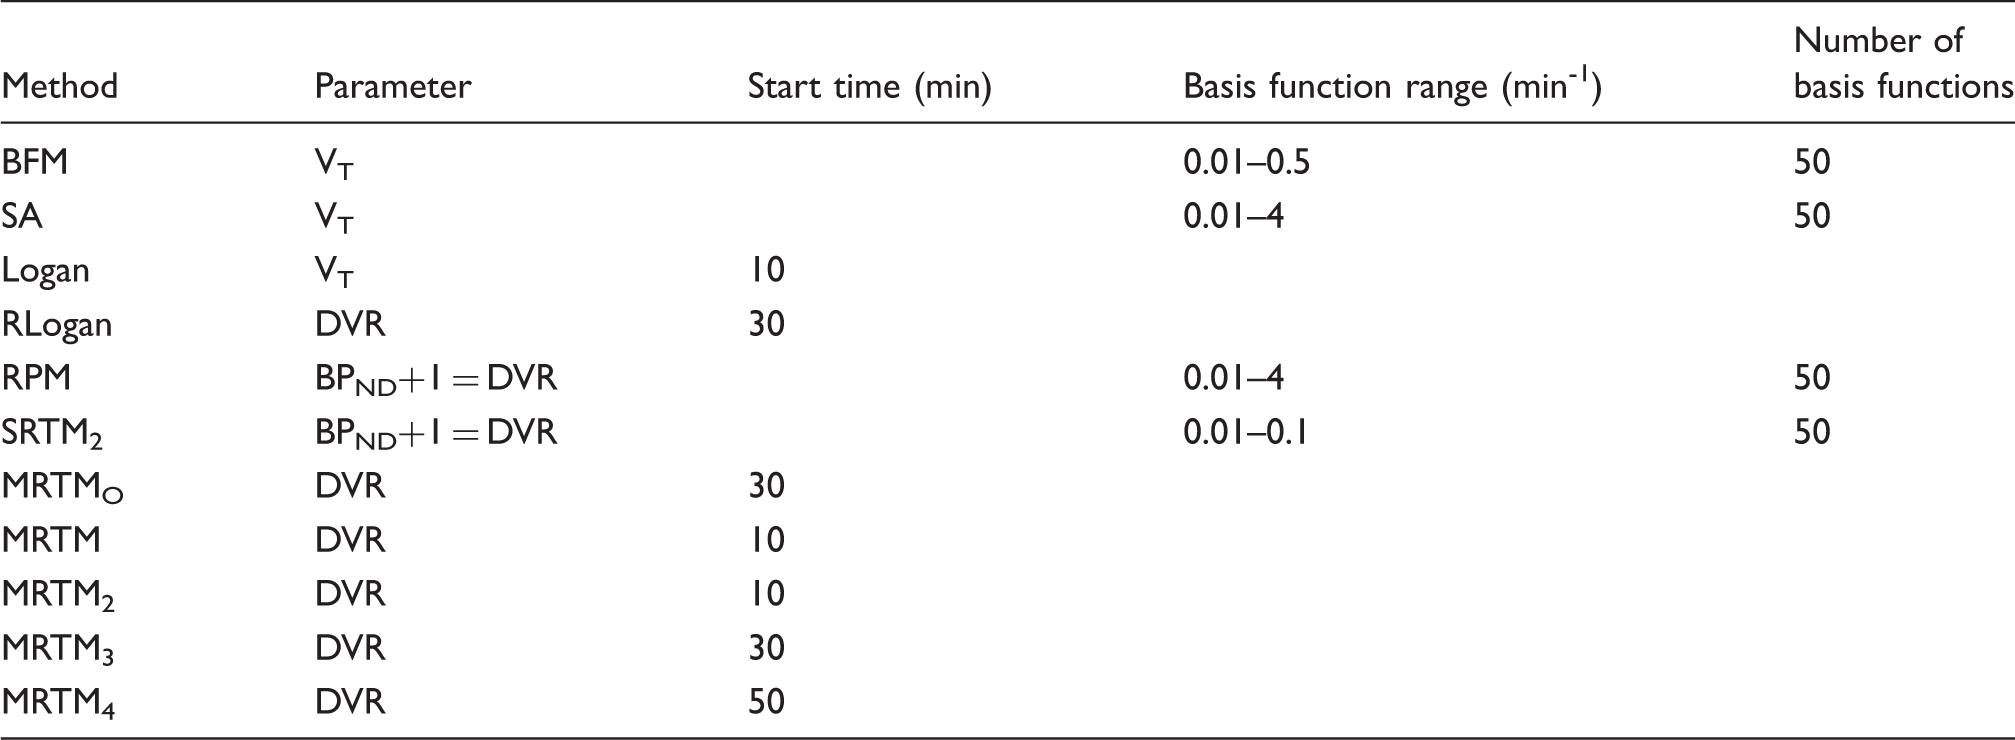
Parametric methods and settings.
Results
Typical parametric maps of all methods are shown in Figure 1, using the three intervals for the SUVr images and 90 min of data for the other methods. Upon visual inspection, it became evident the BFM maps contained an artefact: boundaries appeared due to sudden steps in VT values, forming patches throughout the brain. We will refer to this as patchiness. The RPM maps showed a similar effect and the SRTM2 maps showed some patchiness mostly in white matter. These patches can sometimes be situated near or inside the tumour region. MRTM maps suffered from ‘dot artefacts’—isolated voxels showing very high or very low values—resulting in high estimated image noise. The SUVr maps showed a decreasing contrast between tumour and normal brain for later intervals for most glioblastoma patients. The glioblastoma patient where this effect was strongest is shown in Figure 1. All results are summarized in Table 2.
Typical parametric and SUVr (tumour-to-normal) maps. Left is a patient with an oligodendrocytoma, right is a glioblastoma patient. Results.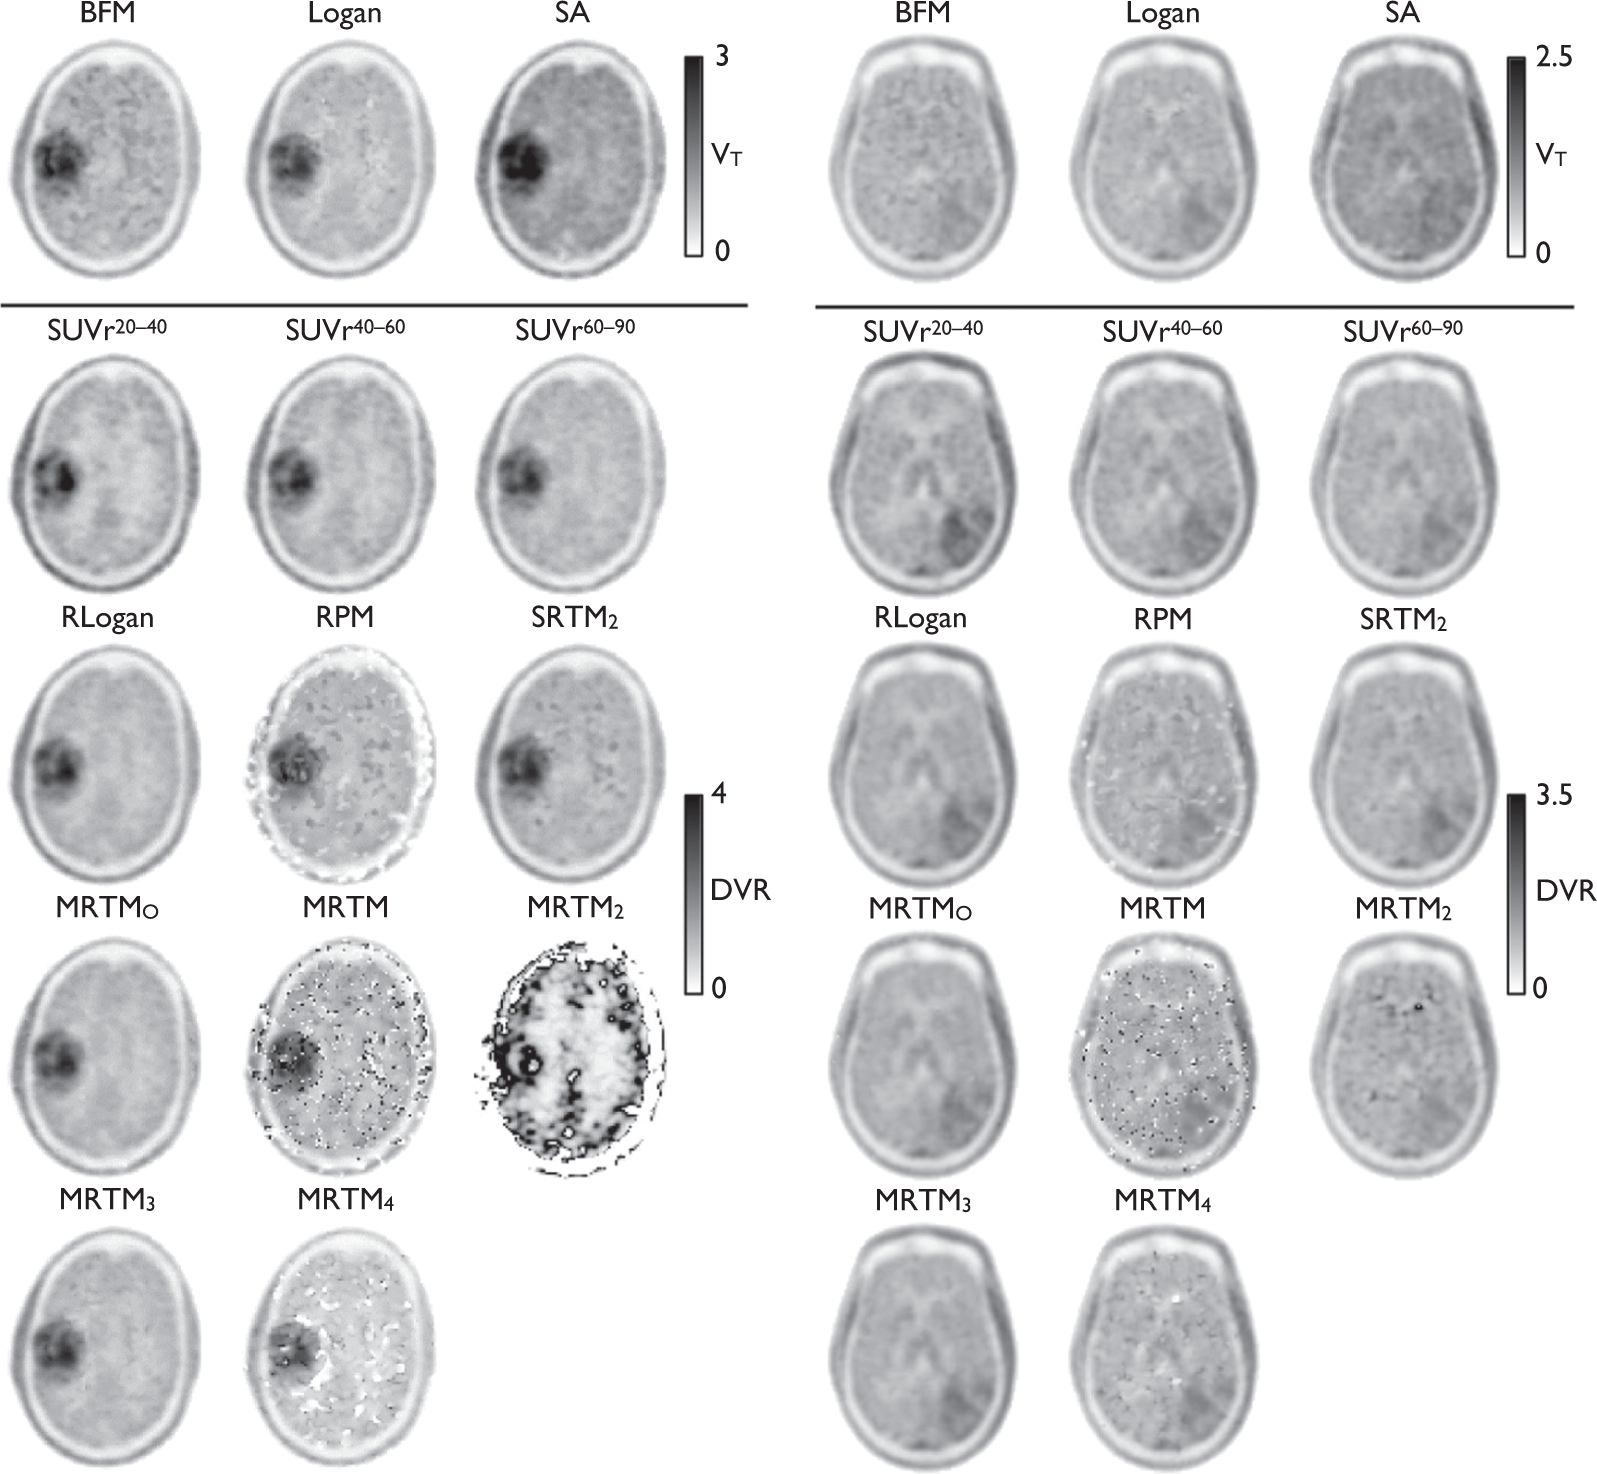
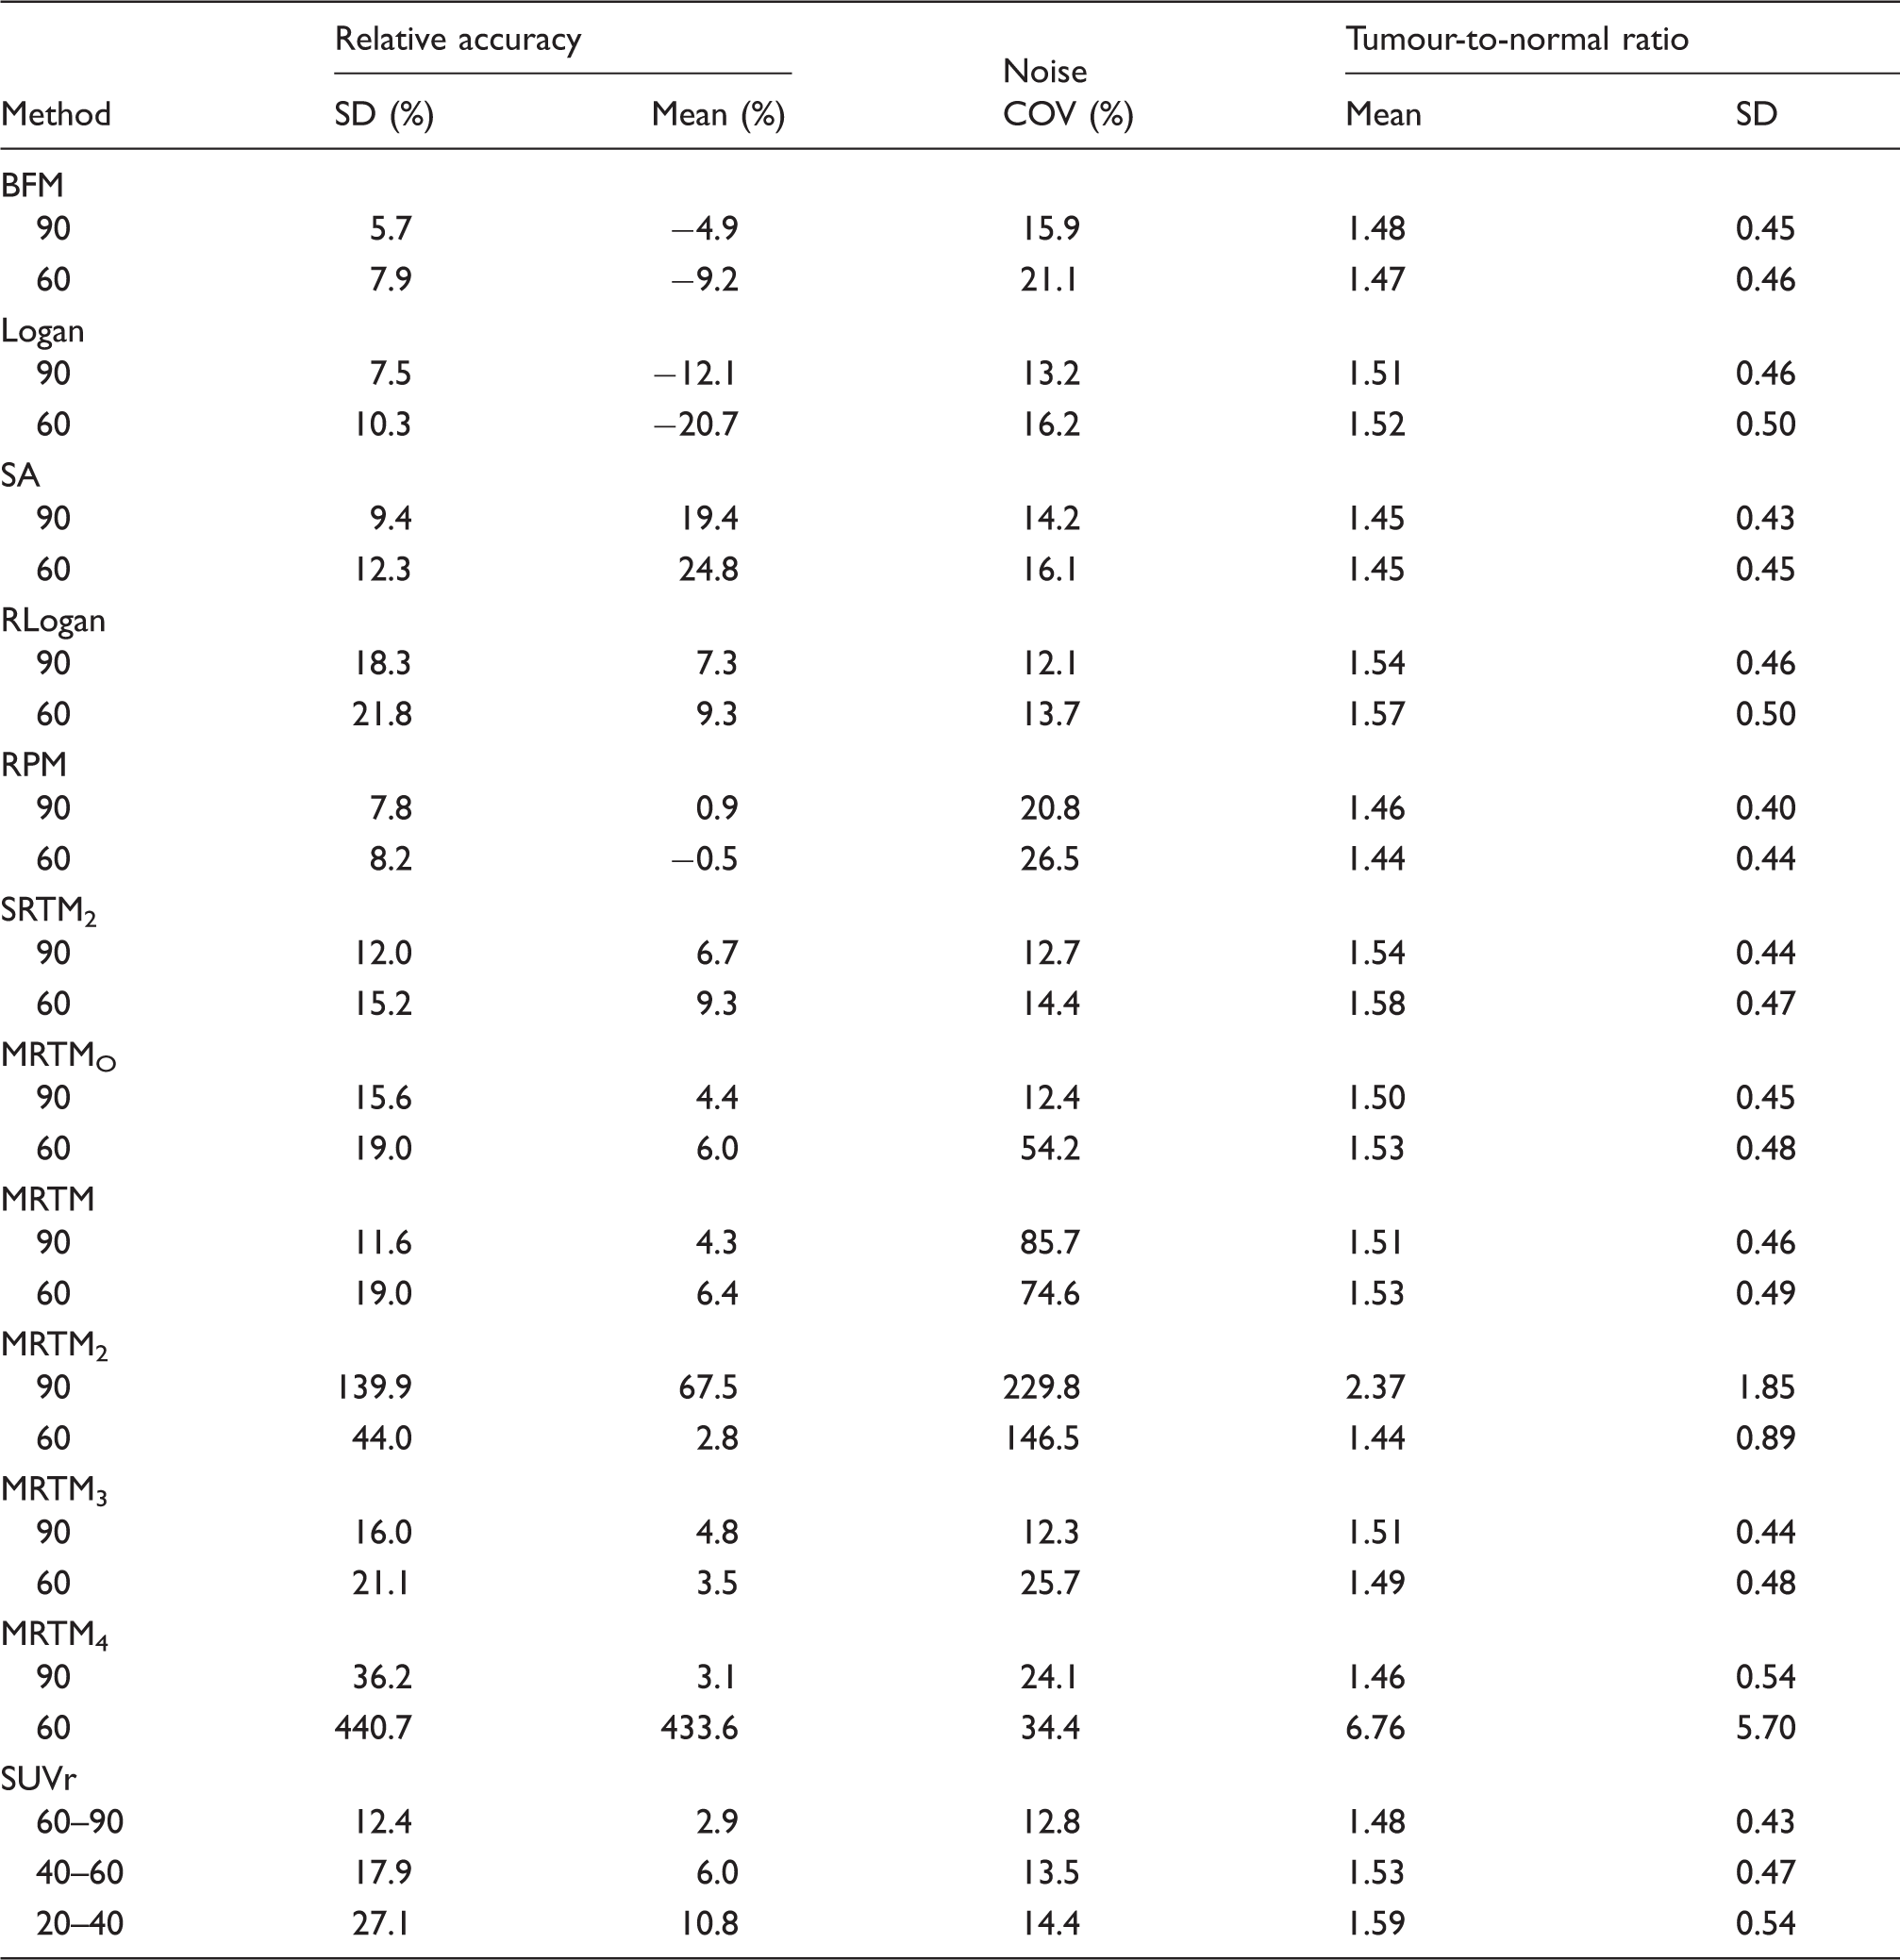
The results on accuracy for VT are shown in Figure 2(a), which shows the relative agreement with the reference standard. The highest accuracy when using 90 min of data was observed for BFM with a standard deviation of 5.7% and a small average underestimation of −4.9%. Logan shows a larger standard deviation, 7.5%, and a larger and consistent underestimation, −12%. SA had the lowest accuracy with a standard deviation of 9.4% and an average overestimation of 19%. The measured image noise, i.e. COV of every VT map is visualized in Figure 2(b). In terms of image noise, BFM was found to be the worst of the three, with an average COV of 15.9%. This is in line with visual inspection, as described above. Logan showed the lowest level of image noise with an average COV of 13.2%. SA showed an average COV of 14.2%. When using 60 min of data, the accuracy became worse for all methods, but their ranking remained the same, and the average image noise COV rises to more than 16% for all methods.
Circles represent the full 90 min dataset, triangles the first 60 min. (a) Accuracy; bars represent mean and standard deviation. Please note that the data points are from three regions inside the tumour for each subject, thus data can be correlated. (b) Noise estimated in VT maps; bars represent mean.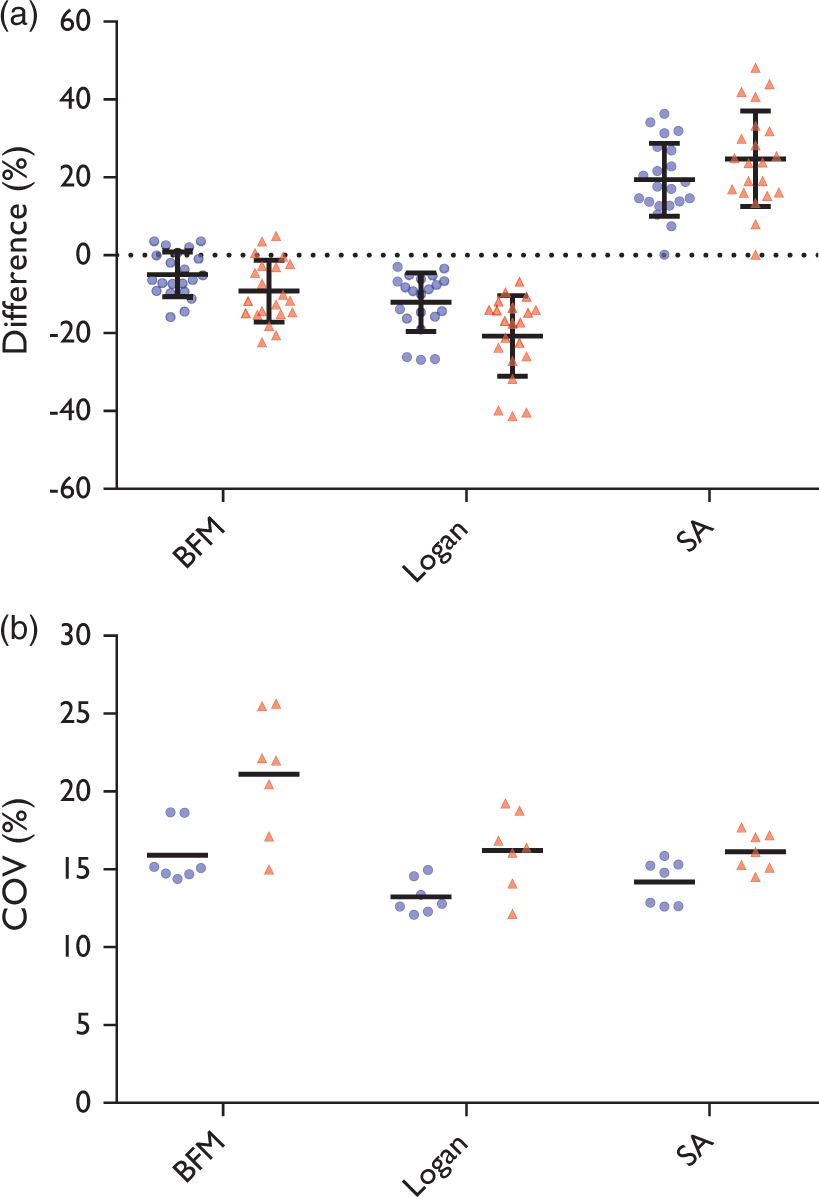
Results on accuracy and the measured COVs for DVR maps are shown in Figure 3. Using 90 min of data, RLogan provided the best maps in terms of image noise with a COV of 12.1%. In terms of agreement with results from the reference standard, however, it showed a wide range of differences with a standard deviation of 18.3% and an average overestimation of 7.3%. RPM provided the best accuracy with a standard deviation of 7.8% and a mean overestimation of 0.9%, but showed poor performance in terms of image noise. Observed image noise was less for SRTM2 maps. However, the accuracy of SRTM2 maps was poorer with a standard deviation of 12.0% and an average overestimation of 6.7%.
Filled circles represent the full 90 min dataset, filled triangles the first 60 min, open circles the time interval of 60–90 min, open triangles 40–60 min, open squares 20–40 min. (a) Accuracy; bars represent mean and standard deviation. Please note that the data points are from three regions inside the tumour for each subject, thus data can be correlated. MRTM2 and MRTM4 were excluded from this figure. (b) Noise estimated in the DVR or BPND+1 maps; bars represent mean. RPM60, 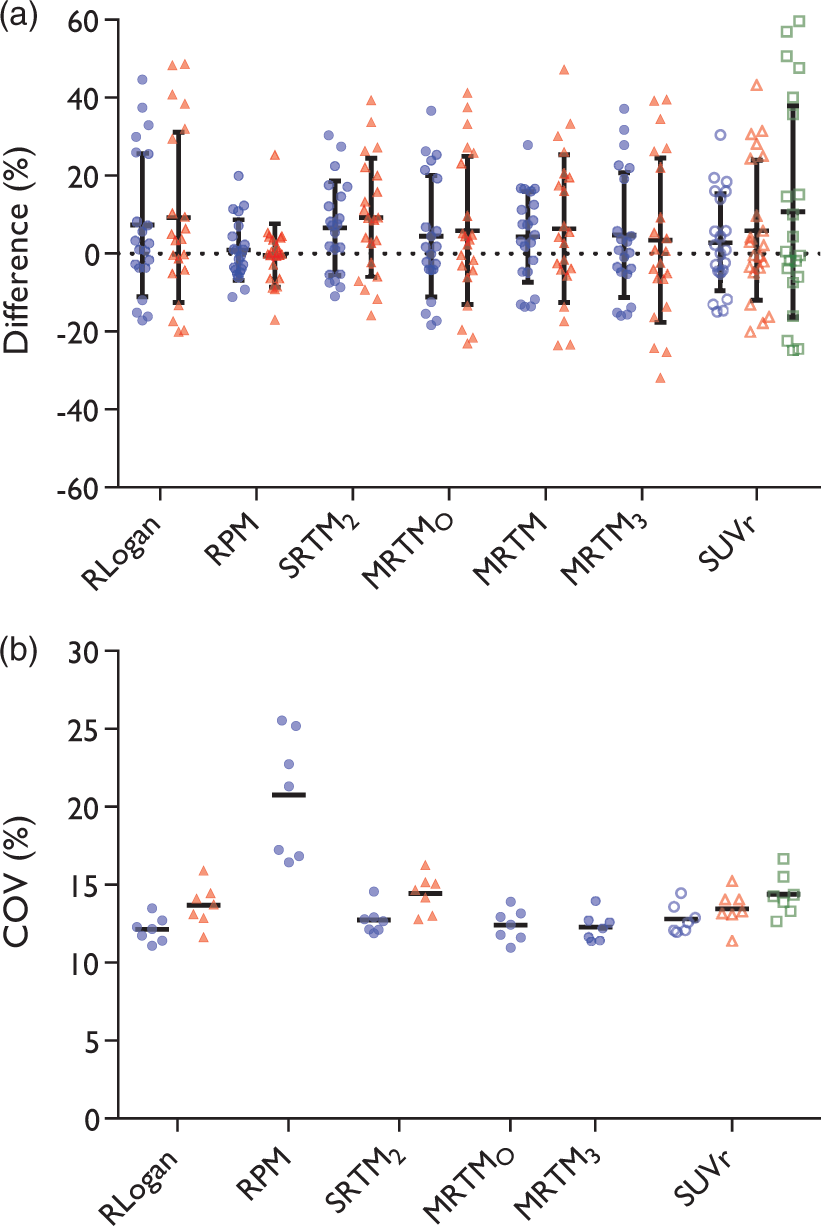
When using 90 min of data, MRTMO showed little noise, yet the standard deviation of the differences was higher than for RPM, SRTM2, MRTM and SUVr60–90. MRTM3, where the
Amongst the SUVr maps, the 60–90 min interval was the best in terms of accuracy as well as image noise. SUVr60–90 showed accuracy comparable with MRTM and SRTM2 and in terms of image noise it was comparable to SRTM2, although SRTM2 shows some abnormal patches mostly in white matter, which was not included in noise estimation.
Discussion
An important finding of this study is that, in general, less noise in the images (COV of voxel values) is associated with poorer accuracy at region level. In other words, the optimal parametric method depends on the specific application where it is used for. Some methods, however, showed better performance than others and can be recommended for further research. For estimation of VT, BFM showed the best accuracy, while in terms of noise, Logan plots show the best performance. For estimation of DVR, MRTMO, MRTM3 and RLogan plots showed good results in terms of image noise, but performed relatively poor in terms of accuracy, i.e. these methods showed some larger variance in differences with the reference. RPM showed the best accuracy, followed by MRTM, but both methods showed relatively high image noise levels. SRTM2 and SUVr60–90 showed comparable results both in terms of estimated image noise and accuracy.
Patchiness in BFM VT maps can be seen especially in areas with low tracer uptake. The rate constants are difficult to determine in these areas because k2 reaches the lower limit. Although lowering the limit results in fewer and smaller patches, it also results in more prominent patches because contrast with surrounding tissue becomes higher. Because some of the patches are inside or near the tumour region, BFM is ill-suited for delineation purposes. Logan VT maps show an expected systemic underestimation mainly caused by noise, as previously reported for other tracers. 20 SA does not show patches, but in terms of noise and accuracy of VT, it is inferior to the Logan maps in this study. Therefore, Logan is the most precise method for measuring VT at the voxel level. This conclusion also holds if shorter (60 min) dynamic scans are used.
The basis function implementations RPM and SRTM2 showed patchiness similar to BFM. Possibly, the patches arise from fit instability due to low tracer uptake or from the violated assumption of single tissue compartment models in both target and reference regions. SRTM2 is less affected than RPM, which indicates that the effect in RPM is partly caused by an unstable
The main purpose of MRTM is not the parametric map itself, but providing a reliable
RLogan plots showed maps with the lowest noise levels, but also with relatively low accuracy. MRTMO showed better accuracy, and only a small increase in noise. MRTM3 is comparable to MRTMO. SUVr60–90 shows the best accuracy among the remaining methods and is not much poorer in terms of noise. When only 60 min data are available, SUVr40–60 is the best method in terms of noise and only RPM60 and
SUVr is the easiest method to implement and it is used in most studies since it is the currently recommended method, although with an earlier tracer uptake interval. The present results indicate, however, that a later interval shows better agreement with DVR derived using a two-tissue compartment model with blood volume fraction. SUVr also showed less noise at later intervals. From visual inspection of the images, it is clear that the contrast between grey and white matter also decreases. Although we have tried to minimize partial volume effects by using a relatively high cut-off value for the grey matter mask, the higher contrast for earlier intervals might (partly) explain the higher image noise estimates. Although some methods show better results in terms of accuracy or image noise, the SUVr maps show relatively good results in both.
Inherent to SUVr images at later intervals is a decreased tumour-to-normal ratio in high-grade gliomas; these tumours typically show decreasing activity concentrations after an early peak, while the activity concentration in the reference region is constant after 30 min, approximately. This decreasing contrast over time can make it harder to see and delineate the tumour. In case of threshold-based delineation, the decrease can pose a problem when the ratio approaches noise levels in the image. An example of this is found in Figure 1, where the extent of the tumour is increasingly difficult to determine in the later SUVr images compared to the SUVr20–40 image. Although SUVr images at a later interval provided better quantitative performance, their application will prove problematic in some glioblastoma patients. Future research should investigate whether changing the time interval of SUVr images shows improvement in clinical applications, such as improved sensitivity or specificity in distinguishing between tumour and normal tissue, and whether or not this outweighs the problem of (too) low contrast in some patients.
Conclusion
In this study, we evaluated the performance of several parametric methods for the analysis of dynamic brain 18F-FET PET studies. It was found that the optimal method depends on the intended application. If a region-based approach is used, BFM and RPM are recommended for most accurate estimation of VT and DVR, respectively, despite patchy artefacts in the images. If quantitative maps are required for accurate estimates on voxel level, e.g. for assessing the location of tumour boundaries or assessing tracer uptake distribution, Logan graphical analysis and SUVr60–90 (tumour-to-normal maps at interval 60–90 min) are the most suitable methods for deriving VT and DVR, respectively. For tumour-to-normal maps, longer or, in case of static imaging, later scans provided better quantitative performance. Assessment of the clinical relevance of these findings is needed. Because of the good performance of SUVr, future studies could focus on the clinical evaluation of SUVr, obtained at several tracer uptake intervals.
Supplemental Material
Supplemental Material1 - Supplemental material for Quantitative parametric maps of O-(2-[18F]fluoroethyl)-L-tyrosine kinetics in diffuse glioma
Supplemental material, Supplemental Material1 for Quantitative parametric maps of O-(2-[18F]fluoroethyl)-L-tyrosine kinetics in diffuse glioma by Thomas Koopman, Niels Verburg, Petra JW Pouwels, Pieter Wesseling, Otto S Hoekstra, Philip C De Witt Hamer, Adriaan A Lammertsma, Maqsood Yaqub and Ronald Boellaard in Journal of Cerebral Blood Flow & Metabolism
Supplemental Material
Supplemental Material2 - Supplemental material for Quantitative parametric maps of O-(2-[18F]fluoroethyl)-L-tyrosine kinetics in diffuse glioma
Supplemental material, Supplemental Material2 for Quantitative parametric maps of O-(2-[18F]fluoroethyl)-L-tyrosine kinetics in diffuse glioma by Thomas Koopman, Niels Verburg, Petra JW Pouwels, Pieter Wesseling, Otto S Hoekstra, Philip C De Witt Hamer, Adriaan A Lammertsma, Maqsood Yaqub and Ronald Boellaard in Journal of Cerebral Blood Flow & Metabolism
Footnotes
Funding
The author(s) disclosed receipt of the following financial support for the research, authorship, and/or publication of this article: This work was financially supported by the Netherlands Organisation for Health Research and Development (ZonMw), grant 10-10400-98-14002. Also, financial support was provided by grant CCA2012-2-05 of the Cancer Center Amsterdam (CCA) of the VU University Medical Center and grant OAA/H1/VU 2015-7502 of the Dutch Cancer Society.
Declaration of conflicting interests
The author(s) declared no potential conflicts of interest with respect to the research, authorship, and/or publication of this article.
Authors' contributions
All authors have critically revised the manuscript and approved its final content. TK drafted the manuscript and contributed to analysis and interpretation of the data. NV has contributed to acquisition and analysis of the data. PJWP has contributed to acquisition of the data. PW has contributed to acquisition of the data. OSH has contributed to the acquisition of the data and the design of the study. PCWH has contributed to acquisition of the data and the conception and design of the study. AAL has contributed to the conception and design of the study. MY has contributed to acquisition, analysis and interpretation of the data. RB has contributed to interpretation of the data and the design of the study.
References
Supplementary Material
Please find the following supplemental material available below.
For Open Access articles published under a Creative Commons License, all supplemental material carries the same license as the article it is associated with.
For non-Open Access articles published, all supplemental material carries a non-exclusive license, and permission requests for re-use of supplemental material or any part of supplemental material shall be sent directly to the copyright owner as specified in the copyright notice associated with the article.