
Abstract
The in vivo quantification of the benzodiazepine receptor concentration in human brain using positron emission tomography (PET) and 11C-flumazenil (11C-FMZ), is usually based on a three-compartment model and on PET curves measured in a small number of large regions of interest; however, it should be interesting to estimate the receptor concentration for each pixel and to build quantified images of the receptor concentration. The main advantage is to allow screening of the receptor site localization and visual observation of the possible abnormalities. Up to now, all the methods described include complex experimental protocols, difficult to use in routine examinations. In this paper, we propose the partial-saturation approach to obtain parametric images of benzodiazepine receptor concentration and FMZ affinity. It consists of a single FMZ injection with a low specific activity, followed by Scatchard analysis. Like other parametric imaging methods, this partial-saturation approach can lead to a small percentage (<1%) of unrealistic values in receptor-poor regions; however, it is the only method that allows receptor concentration and affinity images to be obtained from a single-injection 40-min experiment without blood sampling. We also propose a second method in which the receptor concentration map is directly deduced from the PET image acquired 5 to 10 min after a partial-saturation injection. This method assumes a known and constant FMZ affinity value but requires only very simple corrections of this PET image. It is robust (negative values are never found) and quite simple to use in routine examination of patients (no blood sampling, single injection, only 10-min experiment).
The benzodiazepine receptors are usually studied in human brain using positron emission tomography (PET); 11C-flumazenil (11C-FMZ), an antagonist with a high affinity and selectivity for central benzodiazepine receptors; and a three-compartment mathematical model of the ligand-receptor interactions (Fig. 1). Several methods have been proposed to estimate all or part of the model parameters from PET curves measured in large regions of interest (Pappata et al., 1988; Savic et al., 1988; Abadie et al., 1992; Price et al., 1993; Delforge et al., 1995). Whereas experimental PET data are images, the quantification of the receptor concentrations only in some large brain regions is somehow a loss of information. Therefore, recent efforts have been devoted to a search for methods to obtain quantified images of the receptor concentration and the FMZ affinity (Blomqvist et al., 1990; Lassen et al., 1995; Millet et al., 1995). The main advantage of such images is the possible screening of both the localization and the quantitation of receptor sites in the entire brain. Therefore, possible local changes or abnormalities in patients can be investigated easily on these parametric images.
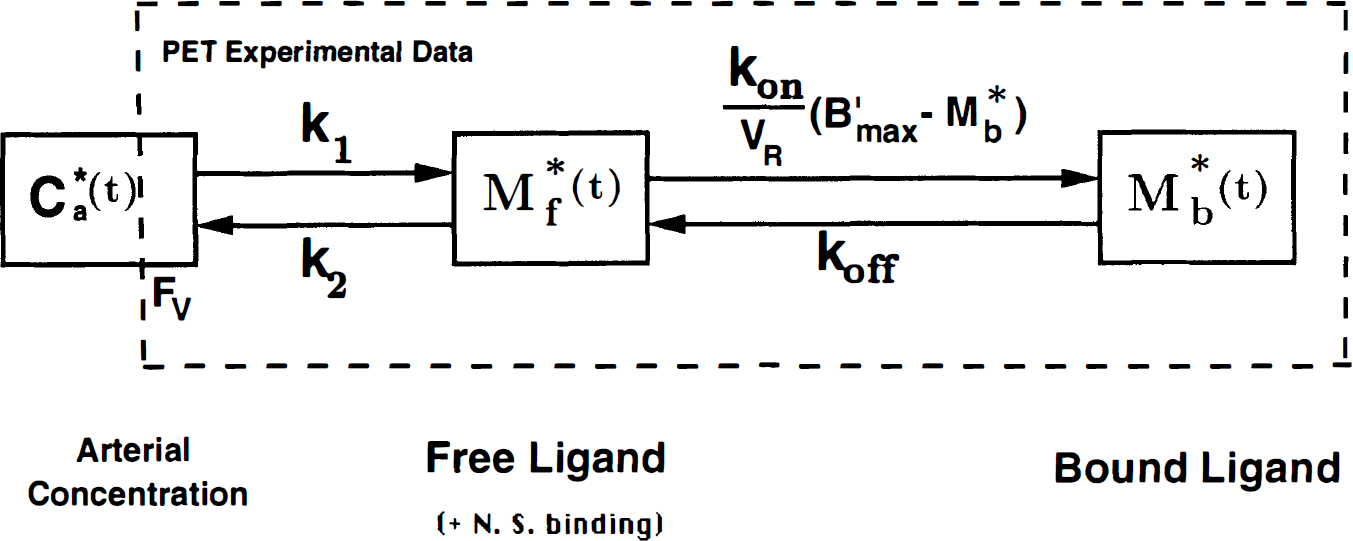
Mathematical model of the ligand-receptor interactions. All transfer probabilities of ligand between compartments are linear except the binding probability, which depends on the bimolecular association rate constant (kon), on the local free-ligand concentration (M*f(t)/VR) and on the local concentration of free receptor sites (B′max − M*b(t)). The positron emission tomography (PET) experimental data correspond to the sum of the labeled ligand in the free- and bound-ligand compartments and of a fraction FV of the blood concentration.
The study of Blomqvist et al. (1990) was the first attempt to build a quantified benzodiazepine receptor map. The experimental protocol included two experiments on the same subject, one with a high and one with a low specific activity. Estimation of the three parameters (the receptor concentration, the association and dissociation rate constants) was obtained using a kinetic approach. The free radioligand concentration was estimated from a reference region (the pons) assumed to be free of receptor sites. The images of receptor concentration and affinity obtained by Blomqvist were informative despite some negative or biased values (probably due to the neglected presence of a small concentration of receptor sites in the pons).
Recently, Lassen (1993) proposed a new method for quantification of the receptor concentration and the affinity. The experimental protocol included two experiments: a constant-infusion injection of ligand, one with a high and one with a low specific activity. Lassen deduced the relationships, giving the receptor concentration and the flumazenil affinity from the distribution volumes calculated from the two experiments. With this steady-state approach, the receptor concentration images were of good quality, but the affinity images were noisy with negative values (Lammertsma et al, 1993; Lassen et al, 1995).
The main disadvantage of these two approaches is the need to perform two experiments with different specific activities. In particular, this can lead to uncertainties related to repositioning, whose effects in the receptor-poor regions can be great.
The multi-injection approach proposed by Delforge et al. (1993, 1995) was used by Millet et al. (1995) to obtain four quantified parameter images: the receptor concentration, the FMZ affinity, and two kinetic rate constants (the k1 and k2 parameters, see Fig. 1). Because this approach is based on a global fitting procedure (and not on a comparison between two curves, which can be close and noisy), all the identified parameters have positive values, even in the receptor-poor regions. The receptor-concentration images are of good quality with relatively homogeneous patterns. Large variations (range 4–14 pmol/ml) are observed in affinity map, and a correlation between the receptor concentration and the flumazenil affinity is clearly established (Miller et al., 1995). This method performs well for the study of receptor-poor regions (all parameter values are positive). It provides complete information about abnormalities linked to a disease (estimation of one or several parameters with abnormal values in one or several areas). It can act as a reference method to test a simplified approach (as the knowledge of all the model parameters allows simulations). The main disadvantages of the multi-injection approach are the need of a blood sampling and the long duration of the examination (2 h).
This article discusses the generation of parametric images of the benzodiazepine receptor concentration using the recently proposed partial-saturation approach (Delforge et al., 1995, 1996b). The experimental protocol consists of a single FMZ injection with a low specific activity. The data analysis is based on a Scatchard plot in which the free ligand concentration is estimated from a reference region (pons) and in which the range of the bound ligand concentrations (needed for the Scatchard analysis) is obtained by the natural decrease of this concentration. This last idea was first suggested by Huang et al. (1986) and is also included, but rejected, in a paper by Iyo et al. (1991). This partial-saturation method allows estimation of both the receptor concentration and the FMZ affinity from a single 40-min experiment and without blood sampling.
Assuming a known constant FMZ affinity, a second method is proposed to obtain parametric images of the benzodiazepine receptor concentration directly from a PET image acquired between 5 and 10 min after the partial-saturation injection. Correction of this PET image is based on simple calculations. The validity of this method and of the parameter estimates is discussed. The main advantages of this approach are its robustness and its obvious interest for routine patient examination.
THEORY AND METHODS
The ligand-receptor model
The compartmental model used in this study is the usual nonequilibrium, nonlinear model (Fig. 1). It includes three compartments (the unmetabolized free ligand in plasma, the free ligand, and the specifically bound ligand in the tissue, whose concentrations are denoted by C*a(t), M*f(t) and M*b(t), respectively), and five model parameters (the benzodiazepine receptor concentration B′max and four kinetic parameters: the exchanges between plasma and tissue, k1 and k2, the apparent association and dissociation rate constants, kon/VR and koff). In brain studies, the vascular fraction Fv is often assumed to be negligible. The apparent equilibrium dissociation rate constant KdVR is deduced from the ratio of koff to kon/VR.
The parameter VR is the reaction volume that takes into account the possibility that the free ligand concentration is different in the vicinity of the receptor sites from the mean free ligand concentration in the tissue (which is the concentration measured by PET and used in the model). Therefore, the reaction volume is the tissue volume in which the free-ligand mass present in 1 ml of tissue would have been distributed with the same concentration as that in the receptor-site vicinity. It also allows taking into account a possible nonspecific binding being included in the free-ligand compartment (Delforge et al., 1996a).
The reaction volume cannot be measured directly from PET data; therefore, only an apparent affinity (1/[KdVR]) can be estimated in vivo by PET. The receptor concentration B′max appears independent of the reaction volume, however, and thus can be estimated without a VR quantification.
Principle of the partial-saturation approach
The most widely used approach to estimate the benzodiazepine receptor concentration is the equilibrium approach based on a Scatchard analysis and on an experimental protocol that includes two experiments with different specific activities (Pappata et al., 1988; Savic et al., 1988; Abadie et al., 1992; Blomqvist et al., 1990; Lassen et al., 1995). The equilibrium state is defined by the validity of the Scatchard equation. The partial-saturation approach is a new method that allows use of the Scatchard analysis from only a single-experiment, single-injection protocol. This protocol consists of a coinjection of a 11C-FMZ tracer dose (about 20 mCi) and of a FMZ partial-saturation dose (between a tracer dose and a saturation dose) (Delforge et al., 1996b). The choice of the unlabeled FMZ amount is important because it must be sufficiently large to occupy a significant percentage of receptor sites (at least 50% but preferably 70%) but not too large to observe a significant decrease of this percentage during the limited duration of the experiment (1 h at most). With the dose recommended in this study (10 μg/kg body weight), the maximum percentage of bound receptor sites ranged from 60 to 90%, depending on the receptor concentration. Data are analyzed using the usual Scatchard plot. The free-ligand concentration F, assumed to be identical in all regions, is estimated from the pons, which is considered a reference region. The bound-ligand concentration B in any region is then obtained by subtracting the free ligand concentration F from the PET-measured concentration.
The pons has often been assumed to be devoided of receptor sites; thus, the PET concentration in the pons has often been used directly as an estimate of the free ligand concentration F; however, the multi-injection study showed that the concentration of receptor sites in the pons is small but not negligible (∼4.7 pmol/ml). Because all the model parameters of the ligand kinetics in the pons have been identified (using the multi-injection approach; see Delforge et al., 1996b), it is now possible to simulate the ligand kinetics in all compartments, and thus, to deduce the percentage of the PET-measured ligand concentration in the pons which corresponds to the ligand bound to the pons receptor sites. This percentage is a function of time and of the injected FMZ dose. This curve is used in each experiment to estimate the free-ligand concentration F from the PET-measured pons concentration.
The Scatchard analysis is performed using all the (F,B) pairs obtained at various times during the experiment. Except for the early data (the Scatchard equilibrium state may not yet be reached), the points are aligned on a straight line, from which estimations of B′max (the intercept of the straight line with the B-axis) and KdVR (the inverse of the slope) are calculated.
Experimental protocol
Flumazenil (RO 15 1788) was labeled with carbon-11 using the methylation process described by Mazière et al. (1984). Specific activity of 11C-FMZ ranged from 120 to 380 mCi/μmol. Five healthy male volunteers (mean age: 27 ± 3 years), all of whom gave informed consent, were studied. None had a history of psychiatric or neurologic illness, and none had taken benzodiazepines. This study was approved by the ethics committee of our institution.
The protocol consisted of a single i.v. co-injection of about 20 to 25 mCi of 11C-FMZ and of a dose of unlabeled FMZ (10 μg/kg body weight). Thus, the global specific activities ranged from 6 and 11 mCi/μmol. The experiment lasted 1 h. No blood sampling was required.
PET measurements and data analysis
The PET studies were performed on the ECAT 953B positron tomograph, which is a brain-imaging system capable of acquiring 31 continuous slices simultaneously (Bendriem et al., 1992). Axial resolution is 5 mm (full width at half-maximum), and spatial transverse resolution on the reconstructed images, with the Hanning filter, is 8.4 mm. Transmission scans are acquired with three rotating 68-Ge/68-Ga sources and used to correct emission scans for the attenuation of 511-ke V photon rays through the tissues and the head support.
The subject's head is positioned in a head-holder such that the crossed laser beam was aligned with the AC-PC (anterior commissure-posterior commissure) plane and the PET slices were parallel to the AC-PC line. To define the AC-PC plane, a magnetic resonance imaging (MRI) study was performed for each subject on the same day, just before the PET scanning. The AC-PC plane was determined on a T1-weighted 7-mm-thick midsagittal MR image. The direction of the AC-PC plane was then reported on the subject's head by means of skin marks.
About 15 sequential PET scans (2–10 min long) were reconstructed. For the parametric images, a spatial sampling procedure was necessary to access the radioligand time-concentration curves in small regions. These regions of interest (ROIs) were composed of 4 (2 × 2) pixels. In these 4-pixel regions, radioactivity was measured, corrected for 11C decay, and expressed as pmol/ml after normalization using the specific radioactivity measured at the time of injection. The time-concentration curve corresponding to the pons was noisy as a result of a small radioligand concentration in this region. Thus, this curve was smoothed using a multiexponential function. The free-ligand time-concentration curve was deduced from the pons curve after correction for the bound ligand concentration using a simulated percentage curve (shown in Fig. 2; see “Results” section). The bound-ligand time-concentration curve in any region was then obtained by subtracting for each time the free-ligand concentration from the PET-measured concentration. The vascular fraction Fv was assumed to be negligible.
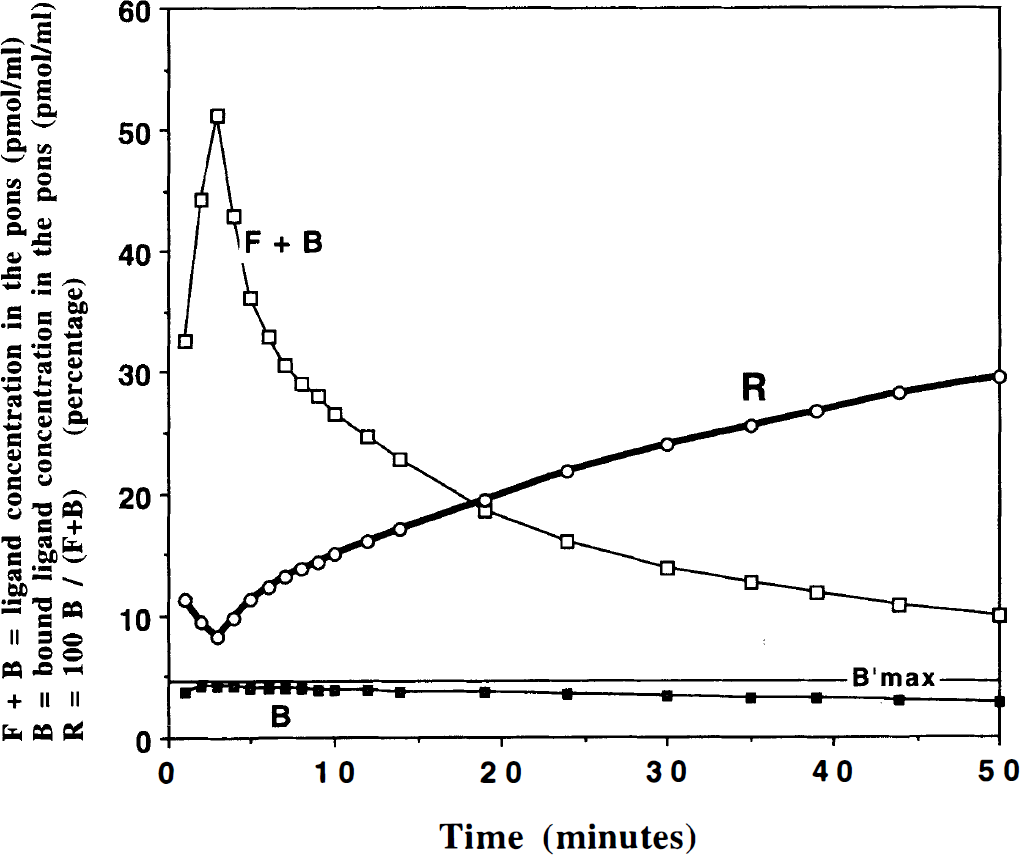
Simulated curves of the ligand concentration in the pons after injection of 10 μg of flumazenil: total concentration F + B (open squares) and concentration of the ligand bound to the pons receptor sites (closed square). This simulation was calculated using the model parameter values in the pons which were previously estimated in humans (see text). The curve R gives the percentage of ligand bound to the receptors compared with the total ligand concentration measured by positron emission tomography (PET).
The two model parameters, B′max and KdVR, were estimated by plotting the data in the Scatchard plot (B/F versus B) and by estimating the Scatchard straight line. We used three methods:
Method 1: A linear regression of the Scatchard straight line:

which is equivalent to a minimization of the cost function: (Y − (B′max − x)/KdVR)∧2.
Method 2: A nonlinear fit of the Scatchard straight line based on the minimization of the following cost function which minimizes both the errors on the X and the Y axes:
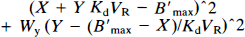
where Wy is a weight allowing to take into account the different order of magnitude of the X (bound-ligand concentration) and Y (ratio of bound/free-ligand concentrations) values.
Method 3: A nonlinear fit of the B versus F curve:

On a Sparc Station 5 (SUN MicroSystem), the calculation time for each slice was less than 1 min for the linear regression and from 30 min to 1 h for the two nonlinear methods. This procedure provided a file of estimated parameters from which parametric maps were built.
B′max images deduced from 5–10min PET image
If the apparent affinity is assumed to be a known constant, the slope of the Scatchard straight line is known; therefore, it is possible to obtain an estimate of the receptor concentration from only one point of the Scatchard plot. As a result, it is possible to deduce a receptor concentration map directly from one PET image with only very simple calculations. We propose using the PET image acquired between 5 and 10 min after a partial-saturation injection.
This method is based on the same experimental protocol (same injected doses), but it lasts only 10 min. For each pixel, the free-ligand concentration (denoted by F5–10min) and the bound-ligand concentration (denoted by B5–10min) are estimated using the method previously described (see the section entitled “Principle of partial-saturation approach”). The receptor-concentration map then is obtained directly from the following equation, which is immediately deduced from the Scatchard equation:

where KdVR is assumed to be known and constant. We propose to use a KdVR value set to 14 pmol/ml, which corresponds to the usual mean value in the receptor-rich regions. The biases introduced by this approximated constant value are studied in the “Results” and “Discussion” sections. Because this method includes only very simple calculations, the calculation time is negligible (a few seconds).
RESULTS
Estimation of the free-ligand time-concentration curve
The free-ligand concentration is deduced from the PET-measured concentration in the pons after correction for the ligand bound to the small concentration of the pons receptor sites. This correction is based on the simulation of the ligand kinetics in the pons using the model parameter values, which were previously estimated in humans (B′max = 4.7 pmol/ml, kon/VR = 0.21 ml/(pmol min), koff = 0.89 min–1, k1 = 0.27 min–1 and k2 = 0.54 min–1; see Delforge et al., 1995). The time-concentration curves of the free and the bound ligand after an injection of 10 μg/kg of unlabeled FMZ were simulated using an averaged input function deduced from previous human studies. The results are shown in Fig. 2. The concentration of the ligand bound to pons receptor sites is obviously limited by the low B′max value. It reaches its maximum rapidly (4.2 pmol/ml at 3 min) and then slowly decreases (from 4 pmol/ml at 10 min to 3 pmol/ml at 50 min). In contrast, during the same time period, the pons free ligand concentration is significantly decreasing (from 45 pmol/ml at 5 min to 7 pmol/ml at 50 min). Thus, the percentage of PET-measured ligand concentration corresponding to the ligand bound to pons receptor sites increases from 8.3% at 4 min to 29.6% at 50 min (see Fig. 2).
Figure 3 gives an example of the PET-measured concentration in the pons (solid points). This curve has been smoothed using a biexponential function (dotted line) and corrected (at each time) for the ligand bound to pons receptor sites using the percentage given in Fig. 2. This corrected curve (solid line in Fig. 3) is used as an estimate of the free-ligand concentration for all brain regions.
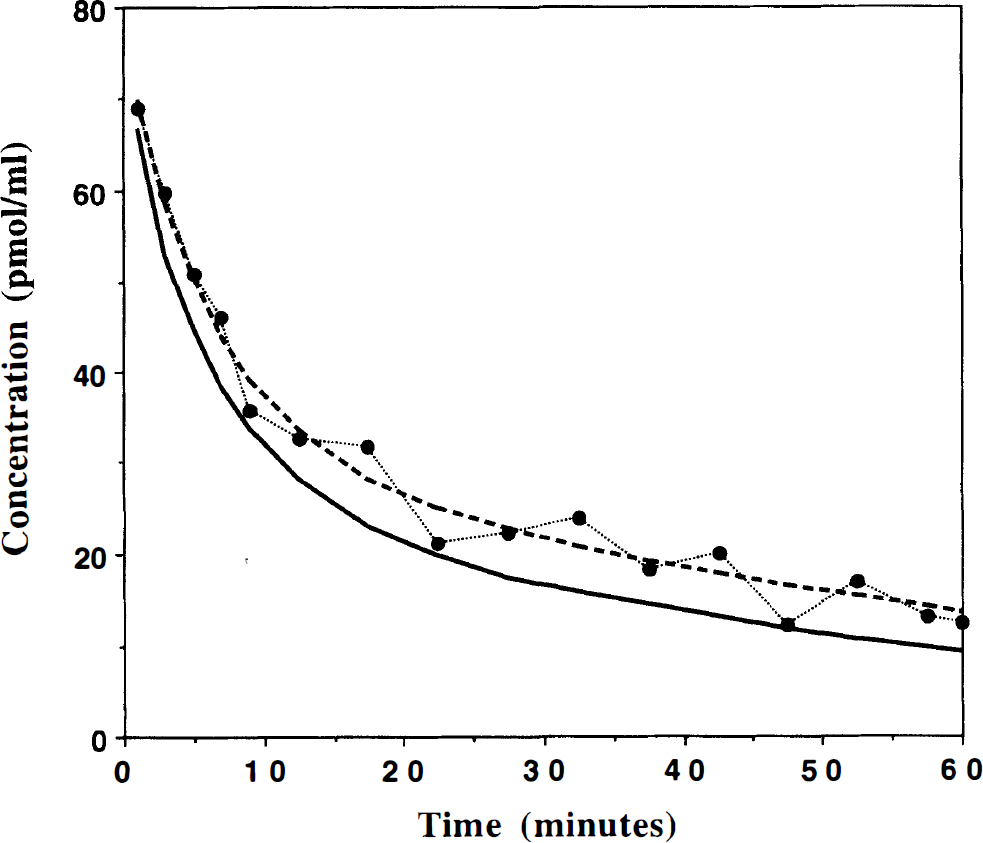
Example of positron emission tomography (PET) time-concentration curve measured in the pons after injection of 10 μg of flumazenil (FMZ) (solid points). This curve was smoothed using a biexponential function (dotted line) and corrected for the ligand concentration bound to the pons receptor sites (solid line) using the simulated percentage curve given in Fig. 2 (see text).
Choice of the parameter estimation method
The receptor concentration and the affinity are estimated from the Scatchard straight line. Therefore, the simplest method is to analyze the Scatchard plot of the data with a linear regression; however, this regression method assumes, first, that the variability of the Y values (B/F) follows a gaussian distribution with an SD that does not depend on the X values (B) and, second, that X and Y are measured independently. These two hypotheses are not verified in the experimental Scatchard plot (X and Y are not independently measured as B value is used both for X and Y estimates).
The straight line, however, is usually easily identifiable in the receptor-rich regions, and the model parameters are accurately estimated with a linear regression (Method 1). Obviously, in these receptor-rich regions, similar results are obtained with the two nonlinear fitting methods (Methods 2 and 3). Unfortunately, for the parametric imaging, because of the small number of counts in each voxel, some PET curves (corresponding mainly to regions with a low concentration of receptor sites) can be very noisy. In that case, the Scatchard plot amplifies and distorts the scatter. As a result, the slope of the straight line does not appear clearly and the parameter estimates can be unrealistic: negative values if the Scatchard plot slope is positive or very large values if the slope is too low. For example, with the PET data used to obtain the parametric maps shown in Figs. 4 and 5, about 10% of the KdVR and B′max values are negative if a linear regression is used.
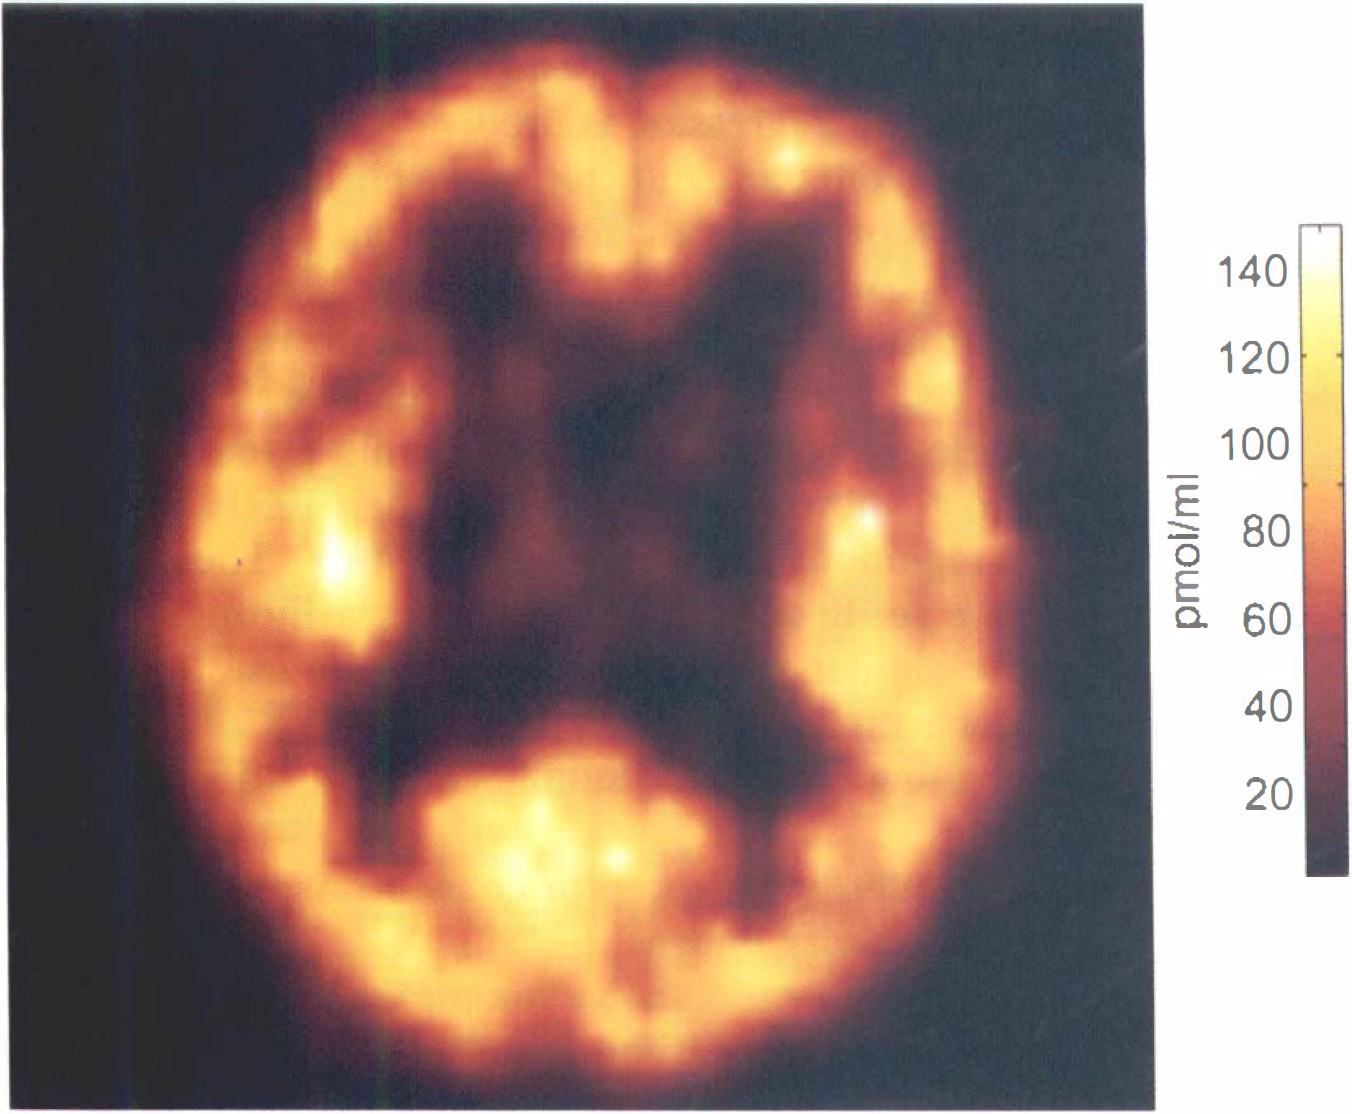
Example of quantified image of the in vivo benzodiazepine receptor concentration obtained using the partial saturation approach. This image was obtained in a normal subject from a positron emission tomography (PET) slice parallel to the AC–PC plane and at the level +15 mm.
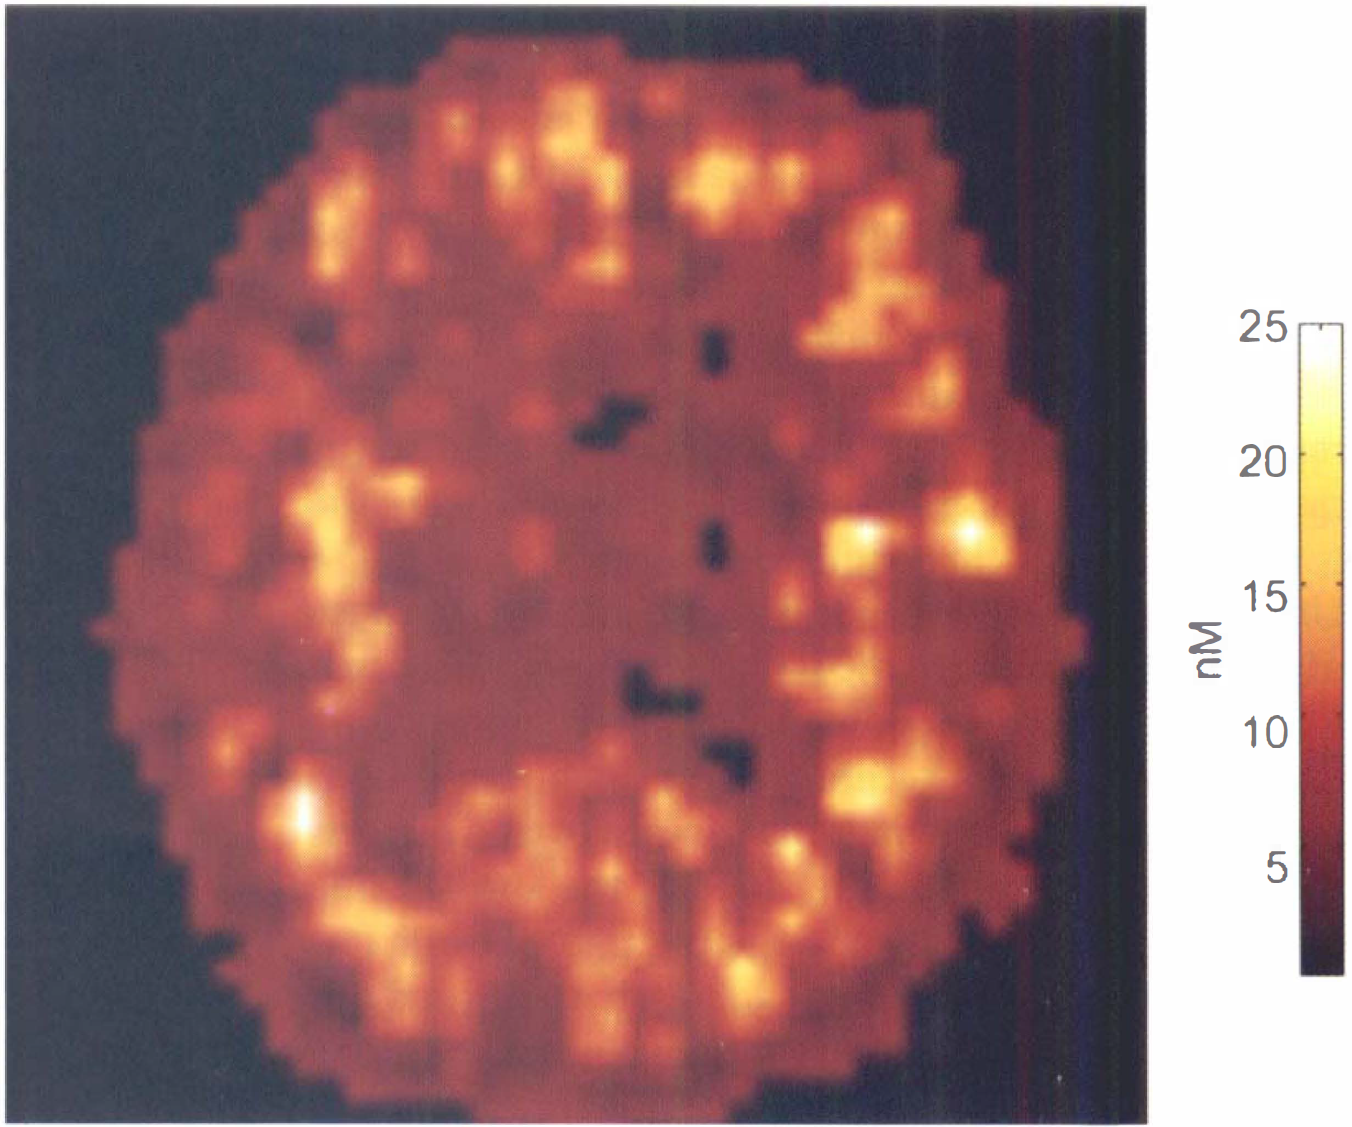
Example of quantified image of the in vivo flumazenil affinity (KdVR) obtained using the partial-saturation approach. This image was obtained in a normal subject from a positron emission tomography (PET) slice parallel to the AC–PC plane and at the level +15 mm.
To avoid these difficulties, we have tested a nonlinear fit of the Scatchard equation. The calculation time is obviously larger compared with the linear regression (∼30 times larger), but the results are better because the number of unrealistic values is dramatically reduced. In the example given in Figs. 4 and 5, there are about 1,200 small ROIs, and only 11 regions have negative values (<1%). These regions were set to zero. The two nonlinear fitting methods give similar results, but we prefer to use Method 2, which rarely gives very large KdVR or B′max values resulting from a too small Scatchard slope.
Benzodiazepine receptor concentration and FMZ affinity images
Figures 4 and 5 show examples of receptor-concentration and flumazenil-affinity images obtained in a normal subject. For the five healthy volunteers, the B′max and KdVR images are of good quality with a relatively homogeneous pattern across major gray matter structures and lower values in white matter. The 4-pixel regions in which the parameter values are negative (and thus set to zero) are always situated in regions known as receptor-poor regions. As in the multi-injection approach results (Delforge et al., 1995; Millet et al., 1995), these figures show clearly that the apparent FMZ affinity is smaller in the receptor-poor regions.
Correlation between the 5–10 min PET and B′max images
Let us consider the PET image obtained between 5 and 10 min after the partial-saturation injection, expressed as pmol/ml after correction for the 11C decay and after normalization using the specific activity. Figure 6 shows the 4-pixel by 4-pixel correlation between this PET image and the B′max image previously obtained using the partial-saturation Scatchard-analysis approach. In fact, this figure shows that these images are not only strongly correlated: the comparison with the identity straight line (solid line) demonstrates that they are quite close. The 5–10 min PET images and the B′max images can also be compared in Fig. 7 (left-hand side and middle images, respectively), in which this scale is common to the two images.
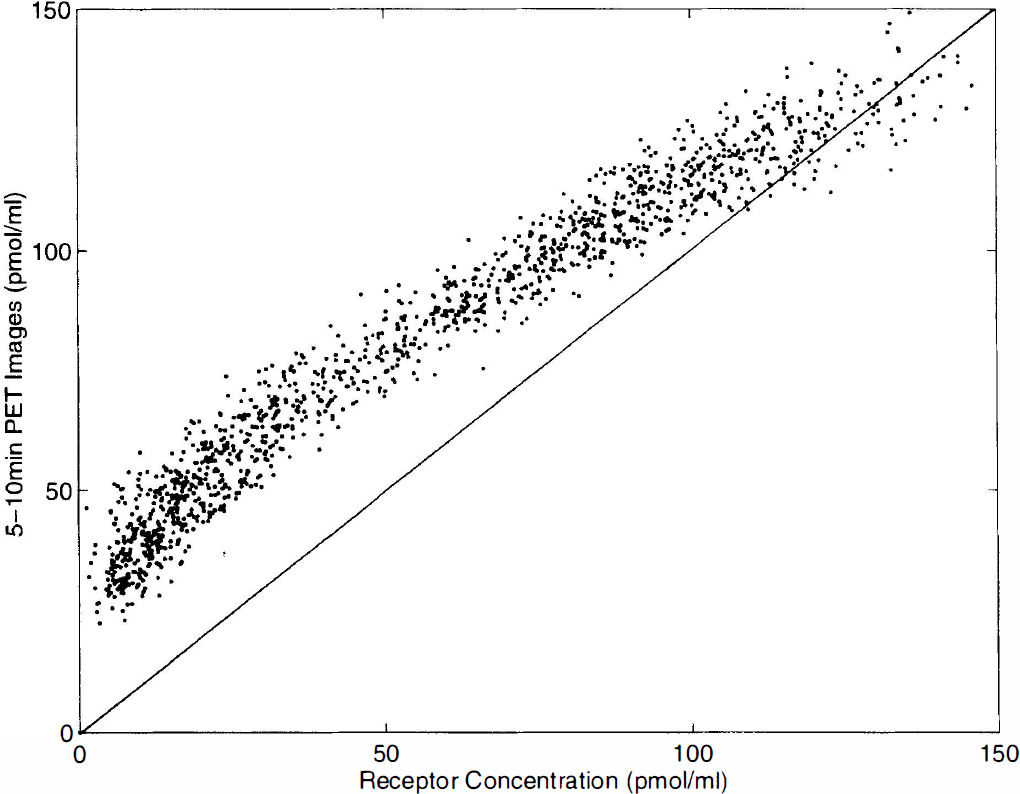
The 4-pixel by 4-pixel correlation between the concentration of ligand measured by positron emission tomography (PET) between 5 and 10 min after injection of 10 μg of flumazenil and the receptor concentration obtained with a Scatchard analysis. In both axes, data are concentrations expressed as pmol/ml. The solid straight line is the identity straight line.
This result is not surprising. The PET-measured concentrations have the same order of magnitude than the benzodiazepine receptor concentration because of the low specific activity resulting of the FMZ dose. After the partial-saturation injection, the bound ligand concentration increases and reaches a maximum about 5 to 10 min after the injection. Since the FMZ dose has been chosen such that 50 to 70% of the receptor sites are occupied by the ligand, this maximum value of the bound ligand concentration is smaller, but has the same order of magnitude than B′max. The 5–10 min PET concentration is equal to the bound ligand concentration plus the free ligand concentration. In these early times, the free ligand concentration is very large (37 pmol/ml in the Fig. 7 example, which is the mean value between 5 and 10 min, see curve in Fig. 3). As a result, the PET-measured concentration appears larger than the receptor concentration, mainly in the receptor-poor regions.
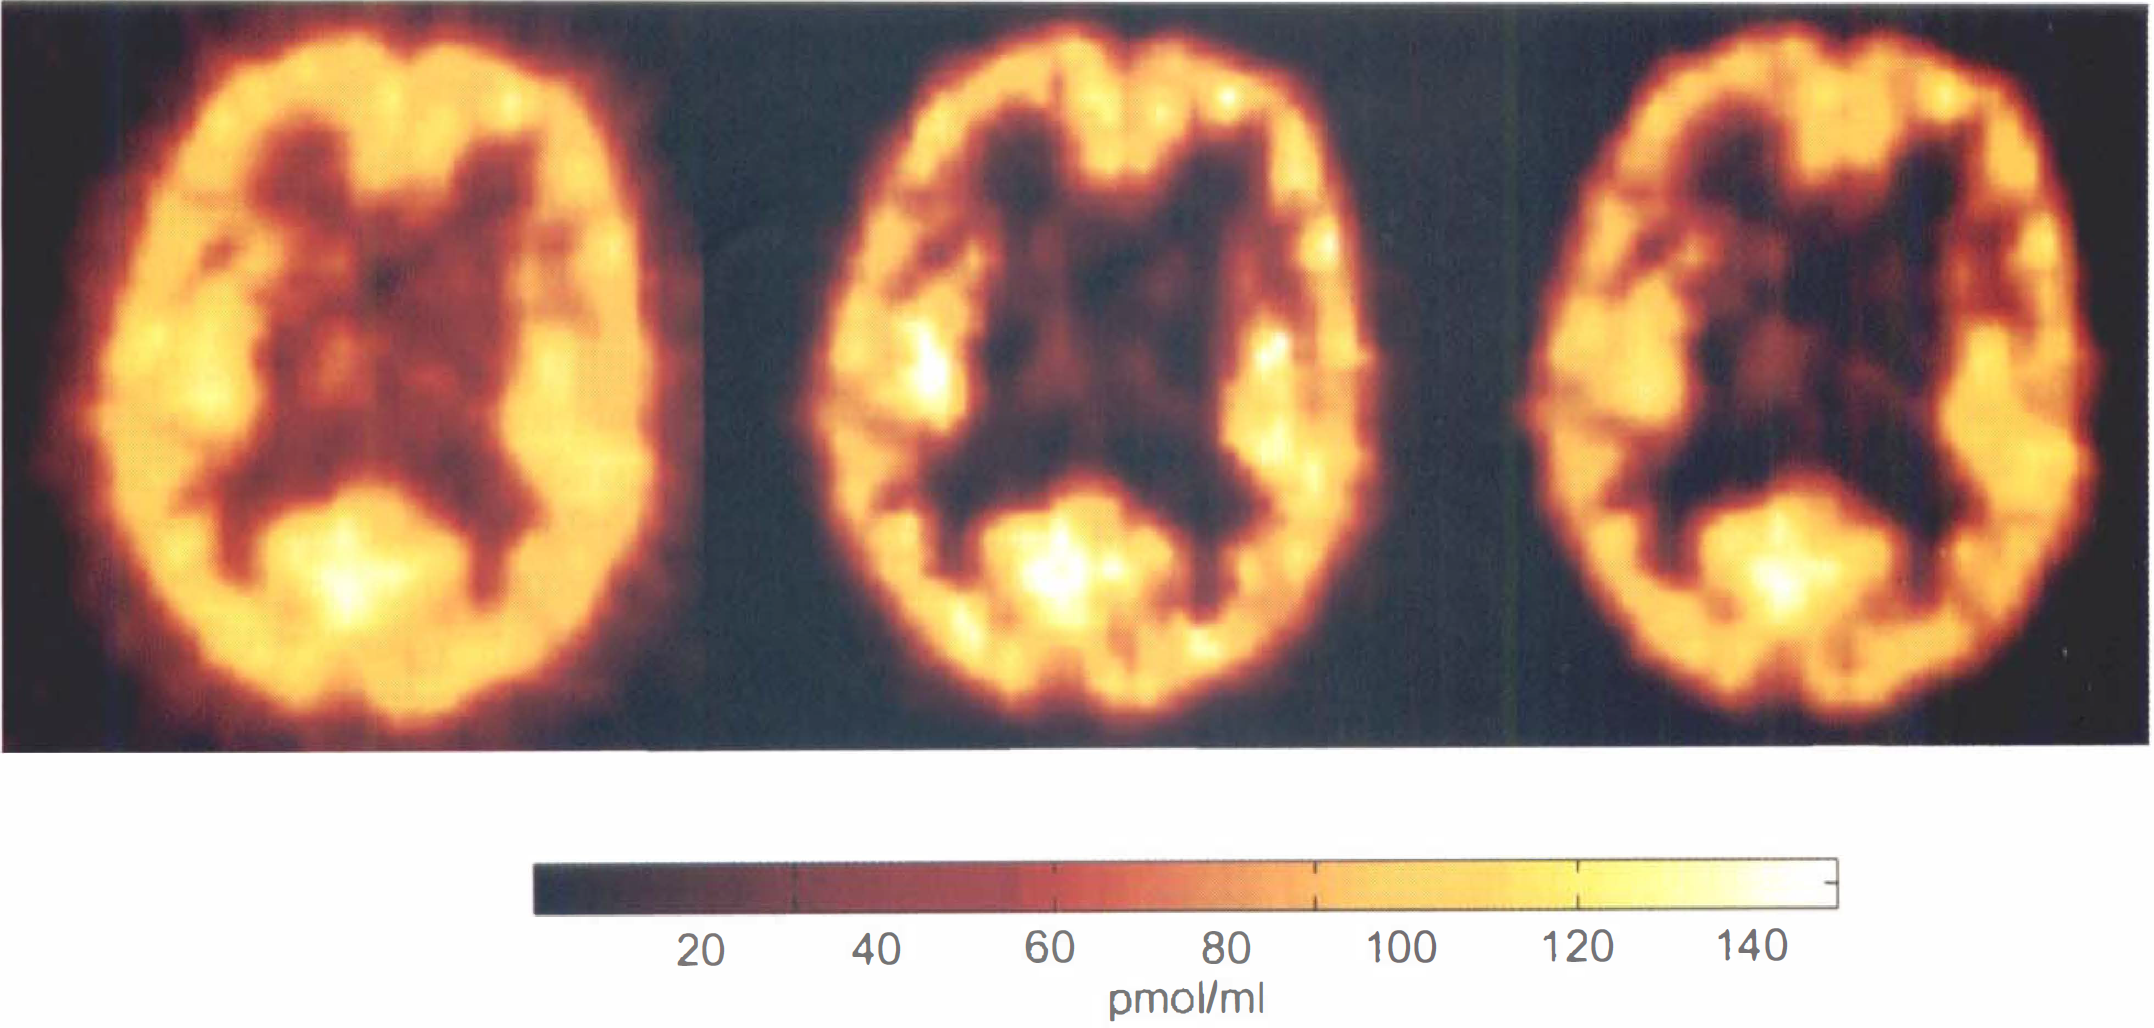
Comparison between the positron emission tomography (PET) image acquired between 5 and 10 min after injection of 10 μg of flumazenil (left-hand side), the receptor concentration image obtained with a Scatchard analysis (middle), and the 5–10 min PET image corrected for the free-ligand concentration and for an estimate of ΔB as described in the text (right-hand side).
B′max images deduced from the 5–10 min PET image
We suggest building a quantified image of the benzodiazepine receptor concentration from the 5 to 10 min PET image (expressed as pmol/ml) after two corrections. First, a correction for the free-ligand concentration F, to obtain the bound-ligand concentration B5–10min. The estimate of the free-ligand concentration is deduced from the PET-measured concentration in the pons as previously described.
Second, a correction for the difference ΔB between B5–10min and B′max, allowing estimation of B′max from B5–10min (see Fig. 8). This correction requires knowledge of the apparent FMZ affinity because the problem is to deduce the receptor concentration from only one point of the Scatchard plot. The used KdVR value was 14 pmol/ml, corresponding to the mean value in the receptor-rich regions. Figure 7 (middle and right-hand-side images) allows comparison between the corrected 5–10 min PET image and the B′max image. Figure 9 shows good correlation between these two images.
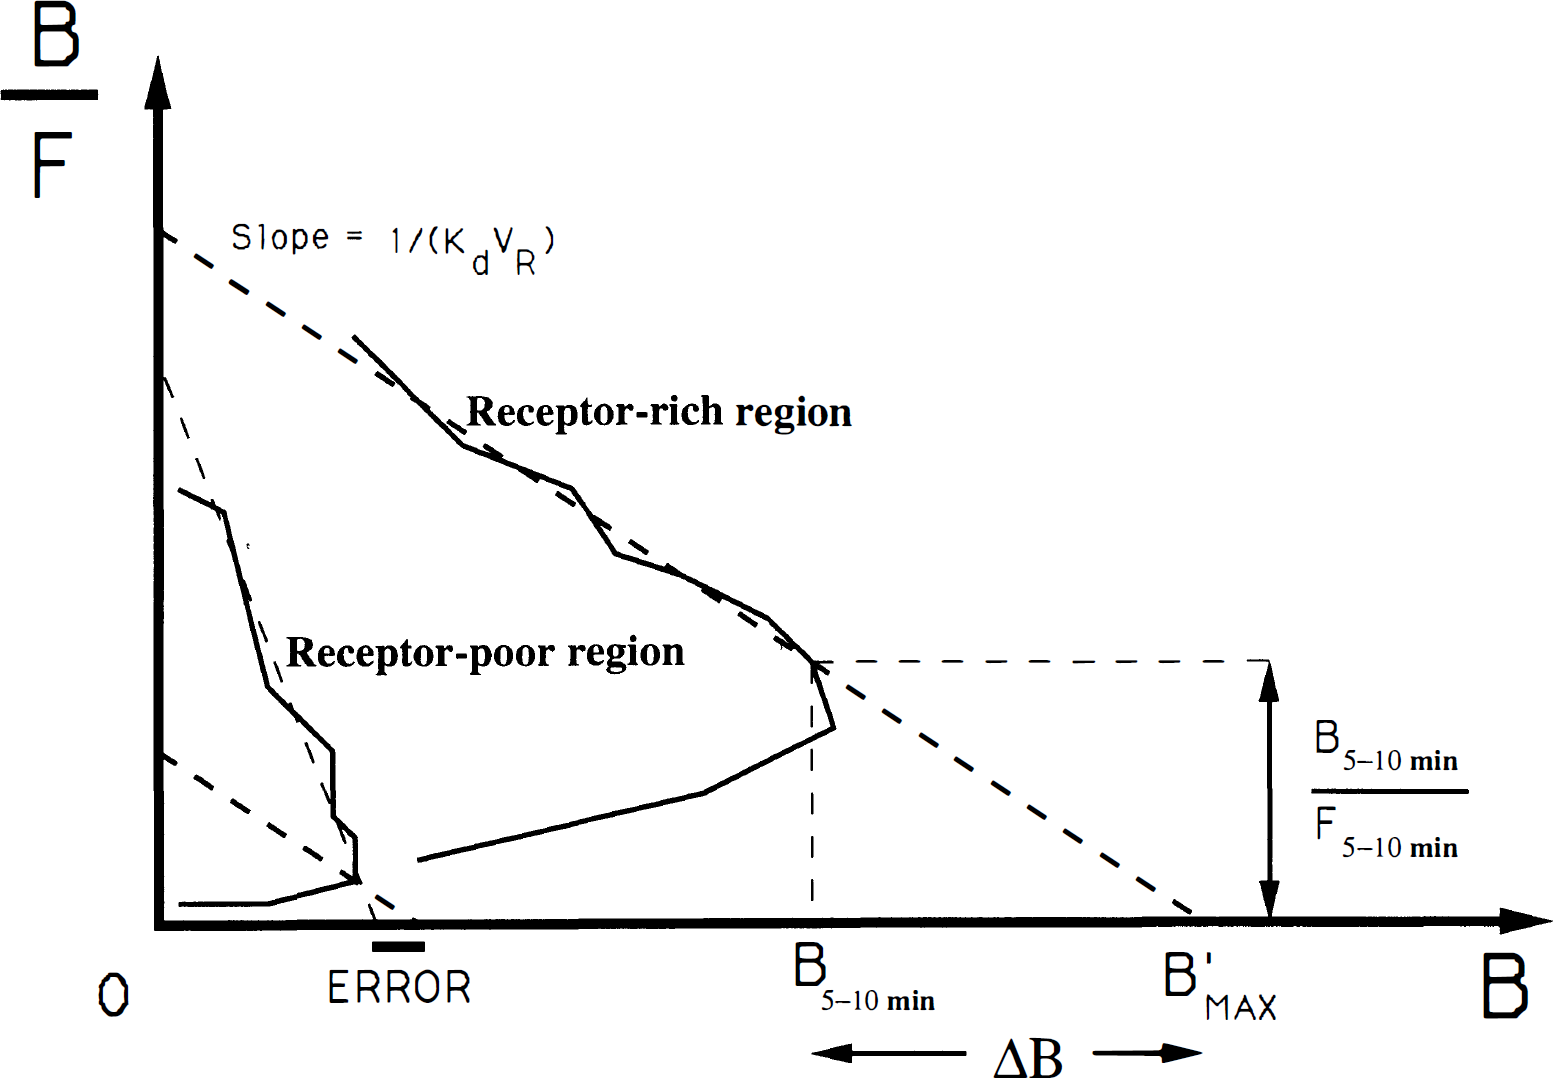
Two examples of Scatchard plot (in a receptor-rich and a receptor-poor region, respectively). If the flumazenil (FMZ) affinity (and thus the slope) is assumed to be a known constant, the receptor concentration can be deduced from only one point (B5–10min, B5–10min/F5–10min) of the Scatchard plot. In the receptor-poor regions, the use of a constant affinity corresponding to the receptor-rich regions leads to an underestimation of the slope and thus to an overestimation of the receptor concentration. Because of the small value of B/F, this error is easily acceptable in practice.
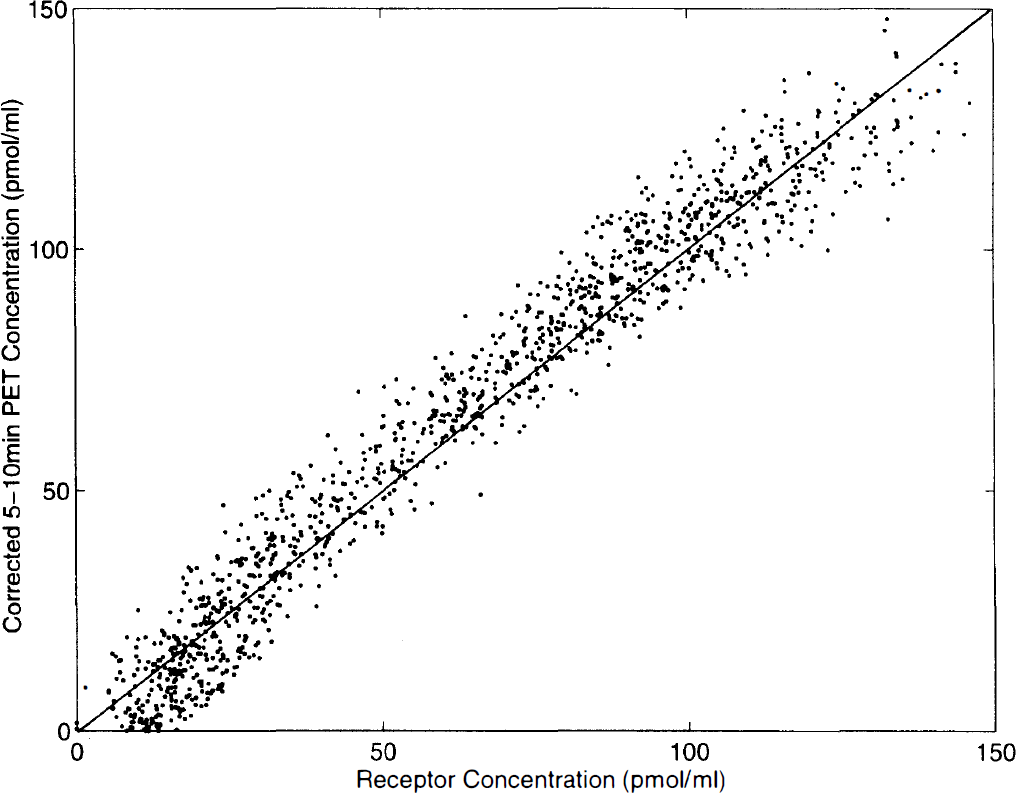
The 4-pixel by 4-pixel correlation between the receptor concentration obtained with the partial-saturation injection followed by a Scatchard analysis and the receptor concentration directly estimated from the correction of the 5–10 min PET image (see text). This image was obtained in a normal subject from PET slice parallel to the AC–PC plane and at the level +15 mm. The solid straight line is the identity straight line.
Receptor concentration in some region of interest
To estimate the biases resulting from the two hypotheses (a constant affinity and the value of this affinity, respectively), we compared the receptor concentration in various ROIs with the three methods; first, the Scatchard method (B′max and KdVR are two parameters); second, the corrected 5–10 min PET image approach with constant KdVR set to 14 pmol/ml; third, the corrected 5–10 min PET image approach with constant KdVR but estimated for each patient from the Scatchard method. The means and the SD of the receptor concentration estimates obtained from the five volunteers are given in Table 1. An example of the parameter estimates obtained for one volunteer is given in Table 2.
Comparison between the means of the receptor concentration estimates (pmol/ml) obtained in five normal subjects and in eight regions of interest
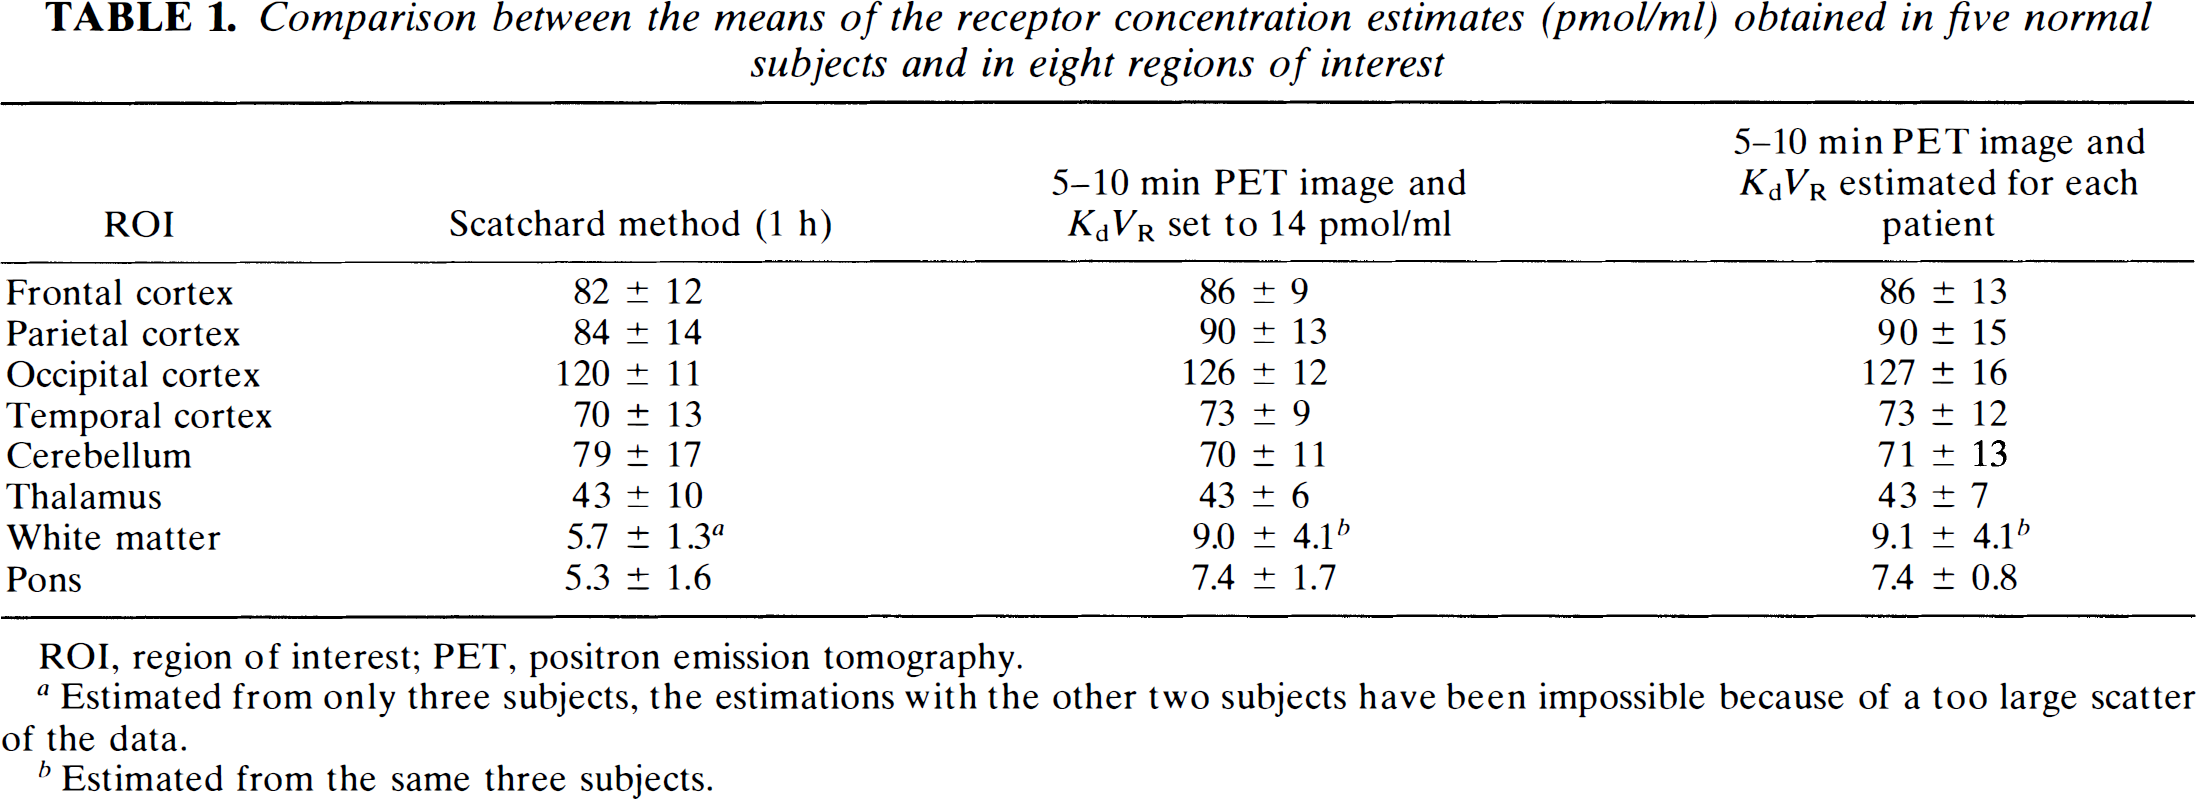
ROI, region of interest; PET, positron emission tomography.
Estimated from only three subjects, the estimations with the other two subjects have been impossible because of a too large scatter of the data.
Estimated from the same three subjects.
Comparison between the estimates of the receptor concentration (pmol/ml) obtained in eight regions of interest in one normal subject
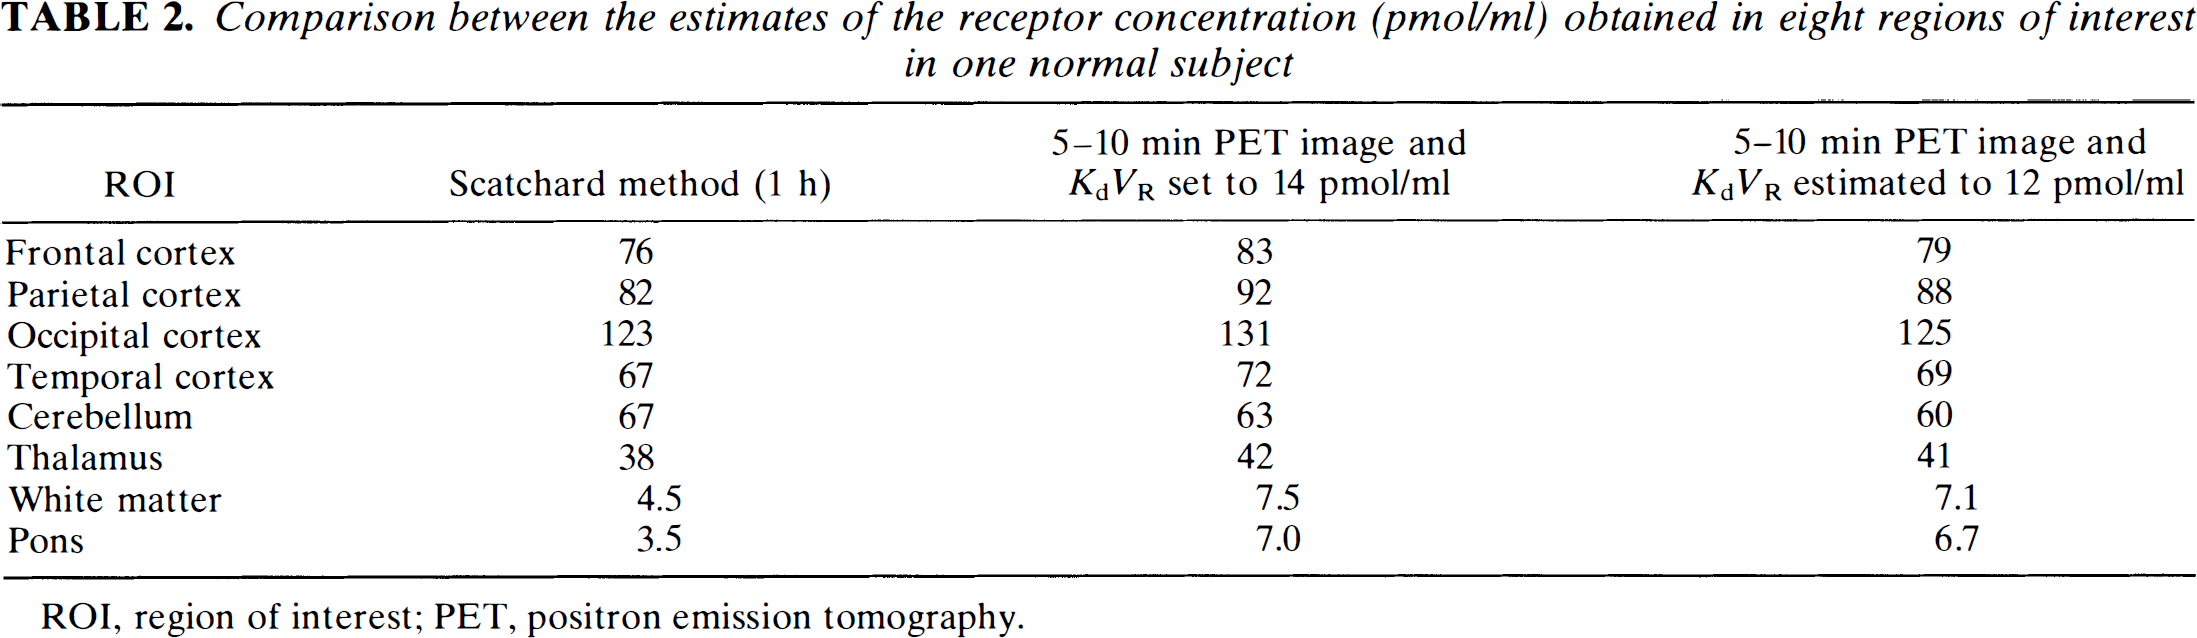
ROI, region of interest; PET, positron emission tomography.
DISCUSSION
Hypotheses of the partial-saturation approach
The hypotheses of the partial-saturation approach are the usual hypotheses of the Scatchard analysis and of the reference region method. A complete discussion about these hypotheses is given in a number of references (Pappata et al., 1988; Savic et al., 1988; Abadie et al., 1992; Lassen et al., 1995; Delforge et al., 1996b).
The Scatchard analysis assumes that a equilibrium state between the free- and the bound-ligand compartments (defined by the validity of the Scatchard equation) is reached. The Scatchard equation is usually deduced from the differential equations describing the model kinetics by assuming that the derivative of the bound-ligand concentration as a function of the time is null (i.e., by assuming that the bound ligand concentration is constant). This condition is exactly obtained by the perfusion method proposed by Lassen et al. (1993, 1995). Previous studies (Delforge et al., 1993, 1995), based on simulations using the model parameter values estimated by the multi-injection approach, however, concluded that the Scatchard equation is valid for the FMZ kinetics a few minutes (from 5 to 20 min depending on the injected dose and the receptor concentration) after the FMZ injection. In fact, by using the model differential equations, it is easy to prove that the Scatchard equation is valid if the exchanges between the tissular compartments are rapid compared with the variation of the concentration in these compartments (i.e., if the derivative of the bound-ligand concentration as a function of the time dMb*(t)/dt, is low compared with the transfers between the two compartments, which can be estimated by koffMb*(t), see Delforge et al., 1993. The simulations using human parameter values and FMZ partial-saturation doses show that the derivative dMb*(t)/dt is less than 1 or 2% of the koffMb*(t) value and that the resulting bias is negligible (Delforge et al., 1995). With the FMZ partial-saturation dose used in this paper, the Scatchard equilibrium is usually reached in all regions 5 min after the injection.
The estimation of the free-ligand concentration from the PET-measured concentration in a reference region assumes (a) that this reference region has no receptor site (or, as proposed here, can be corrected for the small concentration of ligand bound to the receptor sites); (b) that the distribution volumes (defined by k1/k2) are identical in all regions, including the reference region; and (c) that the presence of specific binding has no effect on the free-ligand concentration.
The pons has often been used as a reference region without correction (Savic et al., 1988; Blomqvist et al., 1990; Abadie et al., 1992; Price et al., 1993), but the presence of receptor sites has been pointed out by several methods (Persson et al., 1989; Delforge et al., 1995). Few estimates of the benzodiazepine receptor density in the pons measured in vivo are available. Using a steady-state approach, Lassen found an estimate of the receptor concentration in the brainstem (2 ± 2 pmol/ml, Lassen et al., 1995). The multi-injection approach estimates the receptor concentration in the human pons at 4.7 ± 1.7 pmol/ml (Delforge et al., 1995). In the present study, we propose to correct the PET-measured pons concentration for the non-negligible concentration of ligand bound to the pons receptor sites. Such a concentration is estimated from the pons concentration using a correction function (which was previously simulated using the model parameters estimated in normal volunteers; see Fig. 2). This correction function, variable with time, is obviously more accurate than the constant correction previously proposed, although in practice the results are not very different (Delforge et al., 1996b).
The second assumption of the reference region method is the identity of the distribution volume in all regions. For the flumazenil-benzodiazepine receptor interaction model, this hypothesis is supported by the estimates of the distribution volumes previously obtained in human (Delforge et al., 1995; Price et al., 1993).
The last hypothesis assumes that the specific binding has no significant effect on the free-ligand concentration. This hypothesis was tested with flumazenil (Delforge et al., 1993, 1995). It was proved that the influence of the free receptor sites on the free-ligand concentration became very low from 5 to 10 min after the injection. After this time, the free-ligand concentration in the receptor-rich regions is slightly higher than the concentration in the receptor-poor region. This difference results from a larger quantity of the ligand molecules that arrive in the free ligand compartment after dissociation from receptor sites. In a full-saturation experiment in baboons, this difference was estimated at about 6% (Delforge et al., 1993), but in humans, using the reference region method, our simulations showed that this percentage is less than 2%.
Quantification of B′max and KdVR using the Scatchard analysis
The validity of the B′max and KdVR estimates obtained with the partial-saturation Scatchard-analysis approach using ROIs was previously justified by the agreement between these results and the previously published estimates obtained using other approaches (Delforge et al., 1996b). The experimental protocol lasted 1 h, but the Scatchard straight line is usually accurately defined from the first 30 to 40 min, thus, it is possible to reduce the experimental time without significant modification of the results. For routine examination, 40 min seems the best compromise between short scanning time and accurate results.
A possible bias can result from the approximated bound-ligand concentration in the pons. In particular, the simulated correction function (which allows estimation of the free-ligand concentration) is independent of patients and thus does not integrate patient variability and pathological conditions. Previous studies, however, have shown that the parameter bias resulting from the free-ligand concentration uncertainties concerns mainly the affinity estimates. In an example given by Delforge et al. (1995), the direct estimation of the free ligand, without correction for the small concentration of pons receptor sites, led to B′max and KdVR overestimations of about 16 and 50%, respectively. Another simulation showed that a 20% error in the free ligand estimate leads to a negligible bias for B′max but to a 10% bias for the FMZ affinity (Delforge et al., 1996a). Therefore, except for special diseases in which the brainstem is affected (in such a case, the use of the multi-injection approach can be useful), the influence of the variability of the receptor concentration in the pons has little influence on the receptor-concentration estimate, but it can have a significant effect on the affinity estimate.
The Scatchard analysis can give noisy results for the receptor-poor regions. For example, the Scatchard plot with white-matter data was unusable in two subjects (Table 1). This difficulty is common in all approaches based on calculations of differences between ligand concentrations provided by two experiments (with different specific activities) or by two regions (one of which being a reference region), as these differences between two close and noisy PET measures are often not significant compared with the experimental uncertainties. Thus, the results obtained with the partial-saturation approach in the receptor-poor regions cannot be considered precise estimates; however, for the validity of the parametric images, it is necessary that the uncertainties in the receptor-poor regions be reasonable (a 20–30% error seems acceptable in the regions including <20 pmol/ml of receptor sites).
The receptor concentration found in the pons (5.3 ± 1.6 pmol/ml) is close to the value used for the simulation (4.7 pmol/ml) and is obtained with a good SD. Because the pons was previously used as the reference region, however, this value is probably related to the model parameter used to simulate the percentage of free ligand. Therefore, it cannot be considered as a new result independent of the value previously obtained by the multi-injection approach. Table 1 gives an estimate of the receptor concentration in the white matter (5.7 ± 1.3 pmol/ml). To the best of our knowledge, no in vitro estimate of the benzodiazepine receptor concentration in white matter is available. The pons has been studied more because the great advantage of using the pons as the reference region is that the pons ROI is anatomically easy to define in PET or MRI images (Litton et al., 1994). The only in vivo result is given by Lassen et al. (1995), who found no receptor in the white matter (0 ± 1 pmol/ml); however, the presence of receptor sites in the white matter was pointed out by Persson et al. (1989), who compared the PET time-concentration curves obtained with and without a protection dose (10-mg dose of FMZ injected 10 min before the labeled FMZ injection). Moreover, the small but non-negligible concentration of receptor sites in the white matter is also supported by the similar or larger PET concentration usually measured in the white matter compared with the concentration obtained in the pons.
The nonspecific binding of FMZ, which is lumped with the free ligand in a single compartment, is estimated from 28 and 12% of the free-ligand concentration (Price et al., 1993; Lassen et al., 1995; Delforge et al., 1995). If it is assumed that the nonspecific binding is constant in all regions (as suggested by Lassen et al., 1995), the bound ligand concentration B appears independent of the nonspecific binding estimate. If the nonspecific binding is neglected however, the free-ligand concentration F is overestimated, which will lead to an underestimate of the ratio B/F. It results that the slope of the Scatchard plot (which allows estimation of KdVR) is underestimated. With our notations, the Scatchard plot allows estimation of KdVR and not Kd alone; thus, the effect of the nonspecific binding can be included in the concept of reaction volume, as previously suggested (Delforge et al., 1996a). The intercept with the B axis (which allows estimation of B′max) is not affected by the B/F underestimate; thus, the receptor concentration can be measured without quantification of the nonspecific binding.
Receptor maps deduced from the 5–10 min PET image
We have shown that the receptor-concentration map can be deduced directly from a 5–10 min PET image, provided the FMZ affinity can be considered known and constant. In Fig. 7, the image obtained after corrections (for F and for ΔB) of the 5–10 min PET image is similar to the B′max image obtained with a 1-h partial-saturation experiment (see also Fig. 9). For each pixel, the concentration in this corrected PET image directly gives an estimate of the receptor-site concentration, with pmol/ml as the unit. One of the interests of this method is the negligible calculation time (some seconds) resulting from the absence of fitting procedure.
In fact, assuming that the affinity is known, it is possible to estimate the receptor concentration from any point (B, B/F) of the Scatchard plot because one can deduce B′max from the Scatchard equation:
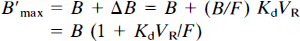
Although the order of magnitude of the FMZ affinity is well known, the hypothesis of a known and constant value does not allow to take into account patient variability. To ensure the validity of the receptor-concentration estimates, it is important to decrease the magnitude of the ΔB correction compared to the B values (obtained from PET data and thus including the patient variability). It is easy to deduce from equation 5 that
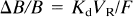
and

To minimize ΔB/B, we suggest using the PET image corresponding to the first image obtained after the equilibrium state (reached about 5 min after the partial-injection doses used in this study), F being already decreasing at this time; however, if for some patients or some diseases it is not sure that the Scatchard equilibrium state is reached 5 min after a partial-saturation injection, it is preferable to delay the time of the PET image. Delaying this beginning time has no significant effect, whereas starting the PET scan before the equilibrium state can lead to a large B′max underestimate (see Fig. 8).
The bias resulting from the constant affinity hypothesis can also be reduced by increasing the unlabeled FMZ dose. For a fixed PET image time, this leads to an increase of the bound-ligand concentration B and thus to a decrease of the ΔB correction. Indeed, the estimate of the free-ligand concentration F (assumed to be constant in all regions) obviously increases with the FMZ injected dose. For example, with a 10 μg/kg of cold FMZ and a PET image acquired between 5 and 10 min, the mean concentration F is equal to 39 pmol/ml. With KdVR set to 14 pmol/ml, the correction ΔB represents about 26% of the B′max value (see Eq. 7), which means that a 10% error on the FMZ affinity estimate leads to a 10% error on ΔB (Eq. 6 where B/F is constant) and thus to a systematic 2.6% error on the receptor concentration (26% × 10%).
Equation 7 shows clearly that correction ΔB is reduced if the FMZ dose is increased. If we assume that free-ligand estimate F is proportional to the FMZ-injected dose, doubling the FMZ injected dose (20 μg/kg) reduces the correction ΔB, which now represents about 15% of the B′max value (Eq. 7). Then a 10% error in the FMZ affinity estimate leads only to a systematic 1.5% error of the receptor concentration (15% × 10%). This error is smaller than the error obtained with 10 μg/kg (2.6%), but in practice the difference is not sufficient to justify increasing the FMZ dose.
From 5 to 10 min, the percentage of the ligand bound to pons receptor sites is low compared with the PET-measured pons concentration (∼13%; see Fig. 2). Therefore, the uncertainties on the pons receptor concentration have a small effect on the receptor concentration estimates in the ROI.
Another difficulty results from previous studies showing a correlation between the receptor concentration and the affinity (Delforge et al., 1995; Millet et al., 1995): KdVR appears smaller in regions with a small concentration of receptors. Such a result is also clear in a comparison of Figs. 4 and 5; however, the correction for ΔB is often negligible for these receptor-poor regions in which the ratio B/F is small (see an example in Fig. 8), and it is clear that the error introduced in these regions by the constant affinity leads to an overestimation of B′max but does not modify the order of magnitude of this parameter (see Fig. 9).
Figure 9 shows a good correlation between the receptor concentration deduced from the Scatchard analysis and the concentration calculated from the 5–10 min PET image. Because this last method is based on simplifying hypotheses, the presence of some biases is expected; however, Fig. 9 shows that these biases are small and acceptable for routine examinations. The small systematic bias observed in Fig. 9 (a small overestimation of the corrected 5–10 min PET concentrations compared with the receptor concentrations) mainly results from a small overestimation of KdVR (see next paragraph).
This method can also be used from images obtained from the bolus plus constant infusion paradigm proposed by Lassen, which allows an equilibrium steady state to be obtained (Lassen et al., 1995). Using a flumazenil infusion with a low specific activity, and after the period (denoted by tequi) needed to reach the steady state in all regions, the free-ligand concentration F and the bound ligand concentration B are constants. The concentration F can be estimated from the pons data, and the concentration B is deduced from the PET ROI data (see “Methods” section). Using the FMZ dose suggested by Lassen (0.6 mg/h), the bound concentration B is about 50 to 70% of the receptor concentration. By assuming a constant and known affinity, relationship 5 allows a receptor-concentration map to be obtained from the PET image acquired from tequi and the end of the experiment (1–2 h). The advantage of this equilibrium steady-state approach is the possibility of acquiring the PET image during a long time period, which can be very interesting in terms of improving the statistical properties of the PET data, in particular in the receptor-poor regions. However, the duration of this experimental protocol (from 1 and 2 h) is longer than with the 5–10 min PET image approach (only 10 min).
Comparison between the receptor concentration estimates
Table 1 gives the receptor concentration in various ROIs using the three methods: the Scatchard method (B′max and KdVR are two parameters) and two corrected 10min PET image with a constant KdVR (this parameter is set to 14 pmol/ml in the first one and estimated for each patient in the second one). The estimates of the receptor concentrations are close with the two methods assuming a constant affinity (see Table 1, columns 2 and 3). This similitude validates the estimation of KdVR to 14 pmol/ml. The differences between the Scatchard method (column 1) and the corrected 5–10 min PET images (columns 2 and 3) are more significant but in the receptor-rich regions are usually <6% and thus are less than the intersubject SD.
The corrected 5–10 min PET image leads to positive, coherent concentration estimates, even in the receptor-poor regions. This result is easily explained: In this method, the slope of the Scatchard straight line is set to a known value, which allows a coherent estimate of the receptor concentration to be obtained despite the large scattering of the Scatchard plot points. The receptor concentration in the pons (7.4 pmol/ml ±1.7 pmol/ml) is larger than the Scatchard analysis estimate (5.3 pmol/ml). This overestimation, also observed with the white matter, probably results from overestimation of the affinity in these receptor-poor regions.
An example of the parameter estimates obtained for one volunteer is given in Table 2. The mean KdVR value in the receptor-rich regions estimated from the Scatchard method is 12 pmol/ml. The B′max estimate deduced from the 5–10 min PET image is always overestimated with a percentage ranging from 2 to 13%, except for the cerebellum. The use of the 14 pmol/ml value (a KdVR overestimate of ∼17%) leads to a new 4.4% systematic overestimation of B′max, with this percentage appearing independent of the receptor concentration. This result is in agreement with the theoretical calculations reported in the previous section (26% × 17% = 4.4%).
CONCLUSION
Parametric images of the benzodiazepine receptor concentration can be an important tool for the studies of diseases; however, a noninvasive method, easily usable in routine examination (no blood sampling, single experiment, short experiment duration) is needed. The main difficulty with parametric imaging is the estimate of the model parameters in very small brain regions to obtain images with good resolution. Most approaches are based on two experiments performed with different specific activities, and thus on the comparison between two curves that are quite close and noisy in the receptor-poor regions. Such methods can lead to unrealistic results (negative or too large values). The same difficulty affects the partial-saturation approach, as the latter computes the difference between the interest and the reference region curves. Using an adapted fitting method, however, only a small number (<1%) of ROIs give unrealistic results.
The partial-saturation method followed by a Scatchard analysis presents several advantages: It allows a separate estimation of B′max and KdVR with a protocol including only a single injection, without blood sampling, and with a reduced scanning time (30 min to 1 h). This single experiment is possible because, first, a reference region is used to estimate the free-ligand concentration and, second, the natural decrease of the bound ligand concentration is used to obtain a large range of this value. Therefore, this method can be used with other ligand-receptor interactions if the free-ligand concentration can be estimated from a reference region and if the dissociation rate constant is fast enough to allow a natural decrease of the bound-ligand concentration during a 1-h experiment. Obviously, it is also necessary that the ligand can be injected with doses allowing at least 50% of the receptor sites to be occupied.
The estimate of the receptor map from the 5–10 min PET image is a robust method (negative values are never found) that is simple to use in routine examination (the experiment lasts only 10 min). It assumes, however, a known and constant affinity. This study shows that the approximations resulting from this hypothesis do not lead to significant biases in the receptor-concentration map. If for a particular disease, however, some evidence of large variability of the affinity values exists, a complete partial-saturation experiment is recommended. This method can be used without the condition previously given on the dissociation rate constant, as the natural decrease in the bound ligand concentration is not needed for this method.
Footnotes
Acknowledgment:
We thank the cyclotron and radio-chemistry staff of the Service Hospitalier Frédéric Joliot and D. Strul, H. de la Caffinière, and M. Crouzel for technical assistance.