
Abstract
Abstract
Standardized Uptake Value Ratio (SUVR) is a widely reported semi-quantitative positron emission tomography (PET) outcome measure, partly because of its ease of measurement from short scan durations. However, in brain, SUVR is often a biased estimator of the gold-standard distribution volume ratio (DVR) due to non-equilibrium conditions, i.e., clearance of the radiotracer in relevant tissues. Factors that affect radiotracer metabolism and clearance such as medication or subject groups could lead to artificial differences in SUVR. This work developed a correction that reduces the bias in SUVR (estimated from a short 15–30 min PET imaging session) by accounting for the effects of tracer clearance observed during the late SUVR time window. The proposed correction takes the form of a one-step non-linear algebraic transform of SUVR that is a function of radiotracer dependent parameters such as clearance rates from the reference and target tissues, and population averaged reference region clearance rate (
Introduction
Distribution volume ratio (DVR) is an important PET outcome for radiotracers following reference region models. 1 By definition, it is the ratio of activity concentration in a target tissue to reference tissue under equilibrium conditions. Practically, true equilibrium is seldom established within a typical PET scan duration following a bolus injection, and therefore, compartment modeling of dynamic scan data is the gold standard for estimating DVR. 2 Compartment modeling, however, requires long dynamic PET scan data, which is often impractical to implement in a clinical setting. DVR is frequently approximated by late time standardized uptake value ratio (SUVR), defined as the ratio of activity concentration in a target tissue to reference tissue during a specified short time window. Due to radiotracer clearance in tissue during the SUVR time-window, SUVR can be biased with respect to the underlying DVR value.3,4 Typically, the bias due to tracer clearance is smaller in the reference region compared to the target regions, resulting in a positive bias in SUVR at late times.
SUVR estimation is commonly established during a suitable time-window that provides minimal bias compared to DVR based on Bland-Altman and other difference plots.4,5 Previous studies also relied on pseudo-equilibrium based concepts, focusing on the time where the derivative of specific binding in a target is close to zero, to define the SUVR time interval.6 –8 However, for many radiotracers that exhibit substantial regional variation in kinetics, no single time interval sufficiently reduces the differences between SUVR and DVR across all regions of interest (ROI). Alternatively, external factors such as competing drugs 9 or disease status can affect individual radiotracer metabolism and clearance.10 –12 Finally, logistical challenges frequently complicate the ability to acquire imaging during a consistent late time window. These important factors can confound the interpretation of SUVR as a surrogate measure of the true DVR in human neuroimaging scans.
The aim of this study was to develop a theoretical approach that corrects SUVR bias in radiotracers with reversible-binding kinetics by accounting for non-equilibrium effects of tracer clearance. This approach extends a correction developed for effects of non-equilibrium tracer clearance on late time tissue-to-plasma activity in bolus-infusion protocols. 13 The theory behind this correction was extended to adapt it for correcting SUVR after a bolus injection. Next, the SUVR correction was validated using simulations and human data for the PET radiotracers [11C]LSN3172176, which has high affinity for the muscarinic (subtype M1) acetylcholine receptors, 14 and evaluation in human datasets with [18F]FE-PE2I, which has high affinity for dopamine transporter (DAT). 15 The study concludes with a general roadmap for adapting this correction to other radiotracers based on the generalizability of the most important findings.
Theory
Part 1: Correction of bias in apparent VT under non-equilibrium radiotracer clearance
Volume of distribution (VT) is defined as the ratio of radiotracer concentration in tissue (CT) to plasma (CP), at equilibrium (steady state). However, in the absence of equilibrium, a non-zero clearance rate of the radiotracer from the plasma (
The concentration of the radiotracer following a bolus injection approaches a mono-exponential clearance at late time.

At the same time, the concentration of the radiotracer in a particular target tissue is equal to a convolution of the impulse response function of the tissue with CP. For a tracer whose kinetics are well-described by a 1TCM (where generally

The instantaneous value of the clearance rate of the tracer in the same tissue (

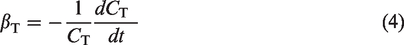
Substituting equation (2) in equation (4),

equation (5) can be rearranged to,
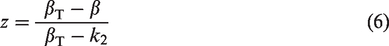
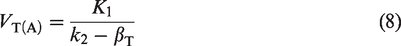
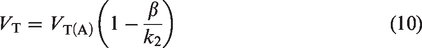
Let the apparent VT be denoted by the symbol VT(A). Then,

Substituting z from equation (6) to equation (7) and simplifying,
Since, the true VT is equal to
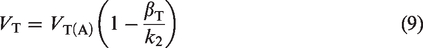
Note that this derivation did not assume transient equilibrium. However, if the additional assumption of
Part 2: Correction of bias in SUVR values under non-equilibrium radiotracer clearance
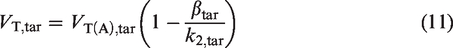
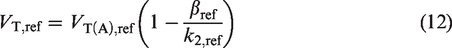
To adapt the framework developed above (equation (9)) for correction of non-equilibrium bias in SUVR values, consider two distinct tissues of interest – from target and reference regions, respectively (subscript tar-target, ref-reference). Each of these tissues can have distinct clearance rates of the radiotracer during the SUVR time window (
Dividing the two equations,
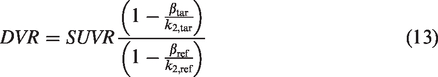
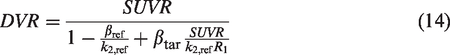
The denominator on the right side of this formula represents a correction of the non-equilibrium errors in
Materials and methods
Simulations
Simulations were used to evaluate the benefits and limitations of the proposed correction formula. Simulated data were based on published human data with [11C]LSN3172176 14. K1 was set to 0.407 mL min−1 cm−3 for all simulated regions and k2 was calculated to vary VT (K1/k2) in the range of 5 to 50 mL cm−3, with VT = 5 mL cm−3 used to simulate the cerebellum as the reference region. 14
Correction performance across varying tracer clearance rates in tissue (
Bias characterization
Simulations were performed for [11C]LSN3172176 to characterize bias in SUVR and SUVRC compared with true DVR. Noiseless simulated time activity curves were generated for tissue regions with varying DVR (range: 1 to 10) and over the range of simulated
Bias in fixed parameters: R1 and k2,ref
Simulations were also performed to evaluate the sensitivity of the correction formula to errors in the implemented values of R1 and k2,ref, which were assumed a priori to be 1 and 0.081 min−1 (population average), respectively. To account for individual variability in these parameters, the correction formula was evaluated across a wider range of R1 and k2,ref parameters: [75%, 125%] of their initially simulated values. This range encompasses the standard deviation (SD) of R1 and k2,ref observed from [11C]LSN3172176 in human healthy control data (SD: 18.2 and 15.8 percent of their respective mean values; R1 values computed over nine brain ROIs). For sensitivity analysis of R1, this parameter was varied from 0.75 to 1.25 by varying K1 for all target ROIs (K1,ref was held constant at 0.407 min−1). However, the correction was always performed with R1 = 1 to evaluate bias introduced by this a priori choice. The k2 parameter of all target regions was simultaneously varied to keep VT constant. For sensitivity analysis of k2,ref, this parameter was varied in the range of 0.081 ± 0.020 min−1 in the simulated time activity curves of the reference region. The k2 parameter of all target regions was simultaneously adjusted to simulate regions with varying DVR (range: 1 to 10). Each region’s simulated SUVR was corrected to SUVRC using the fixed value of k2,ref = 0.081 min−1 in the correction formula. Population averaged plasma arterial time activity curve was used as the input function for these simulations.
Variability in estimated parameters:
and
The tracer clearance rates in reference and target tissues,
The mean value and s.e. in
Human data
For [11C]LSN3172176, a combination of previously reported human data, 14 and data from ongoing studies on healthy subjects [overall n = 30, mean (SD) age: 39.8 (11.6) years, 14 F] who underwent a dynamic scan (High Resolution Research Tomograph (HRRT); Siemens CTI, Knoxville, TN, USA) were re-analyzed. [11C]LSN3172176 was synthesized as previously described. 14 Subjects were administered an i.v. bolus injection of [11C]LSN3172176 (injected activity: 549.4 ± 153.2 MBq; molar activity: 244 ± 136 MBq/nmol), following which imaging data and arterial blood samples were acquired for 120 minutes. Metabolite analysis was performed to estimate the parent input functions using previously published methods. 14 Kinetic modeling of dynamic data was performed using the 1TCM with metabolite-corrected plasma input function. 14 Cerebellum was used as the reference region in the computation of DVR. A time-window of 60–80 min post injection was selected for SUVR correction, consistent with the simulations.
The correction formula was further evaluated with human data from an ongoing study with the [18F]FE-PE2I tracer, in separate cohorts of subjects diagnosed with Parkinson’s disease (PD) and healthy controls. Twenty PD subjects [mean age (SD): 63.4 (7.7) years, mean disease duration: 5.1 (3.3) years, Hoehn and Yahr Scale: 2 (all patients, mild bilateral disease), 10 F] and 12 healthy controls [mean age (SD): 58 (6.1) years, 6 F] underwent a 60 min scan on the HRRT after a bolus injection of [18F]FE-PE2I (injected activity: 151 ± 33 MBq, molar activity: 164 ± 110 MBq/nmol). Kinetic modeling was performed using the simplified reference tissue model (SRTM) with cerebellum as the reference region.15,16 A late time-window of 40–60 min post injection was selected for correcting [18F]FE-PE2I SUVR since only 60 min of dynamic data were collected.
All studies operated under protocols approved by the Yale University Human Investigation Committee and the Yale University Radiation Safety Committee in accordane with the United States federal policy for the protection of human research subjets in Title 45 Part 46 of the Code of Federal Regulations (45 CFR 46). Written informed consent was obtained from all study participants after complete explanation of the procedures.
A linear-regression estimator for
Due to the high sensitivity of the SUVRC formula to errors in

Determination of the regression slope (a)
A cross-validation approach was adopted to determine
A leave-one-out cross-validation approach was adopted to calibrate
Sensitivity of the errors in DVR prediction to the choice of regression slope (a)
To characterize the effect of errors in
Correction of regional SUVR
For [11C]LSN3172176, the bias in SUVR and SUVRC compared to DVR were computed for all nine brain regions across 15 subjects in the testing dataset. DVR was calculated using the kinetic parameters from 1TCM fit to dynamic PET data (0–120 minutes) with cerebellum as the reference region. SUVR was computed based on 60–80 minutes of PET data. To calculate SUVRC,
For [18F]FE-PE2I, ground truth regional DVR was calculated based on SRTM fit to dynamic PET data (60 min). SUVR was computed based on 40–60 minutes of PET data. To calculate SUVRC,
Comparison of bias in corrected SUVR and early SUVR in [18F]FE-PE2I
To further demonstrate the benefit of using corrected SUVR in clinical studies with [18F]FE-PE2I, regional bias in SUVRC (calculated 40–60 min post injection) was compared to the bias in early SUVR (15–45 min post injection) in healthy controls and Parkinson’s disease patients. This time window for early SUVR had best agreement compared to DVR in previous studies. 17
Voxel-wise correction of SUVR
The correction formula, when used with the regression-based estimator for βtar, can be directly applied at the voxel level. Exploratory analysis was performed to assess voxel-wise performance of the correction for [11C]LSN3172176 and [18F]FE-PE2I with composite regions of temporal cortex and striatum, respectively. All images were transformed to a standard template (AAL MNI 2 mm)
18
to facilitate composite and reference region extraction and comparison across subjects. The transformation first performed a linear registration between subject’s PET and MR images, followed by a non-linear registration of subject’s structural MR image (3 T image acquired on Siemens Prisma) to a T1 in template space using previously published algorithms.
19
For each tracer, we first identified two subjects for whom the correction formula resulted in the best and worst performance across primary ROIs, quantified by the root mean square error (RMSE) across all primary ROIs. Voxel SUVR values (60–80 min p.i. for [11C]LSN3172176, 40–60 min p.i. for [18F]FE-PE2I) for these two subjects were corrected to SUVRC (
Diagnostic performance of corrected SUVR in Parkinson’s disease with [18F]FE-PE2I
The diagnostic performance of SUVR, SUVRC and DVR in differentiating Parkinson’s disease subjects from healthy controls were compared by calculating the Cohen’s d measure for group differences in the primary brain regions for [18F]FE-PE2I. Recent studies have shown that early SUVR (15–45 min) provides better agreement with DVR for [18F]FE-PE2I, 17 and better test-retest reliability and longitudinal assessment. 20 Therefore, early SUVR was also included alongwith late-time SUVR (40–60 min) in this analysis.
Results
Bias characterization
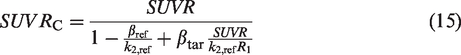
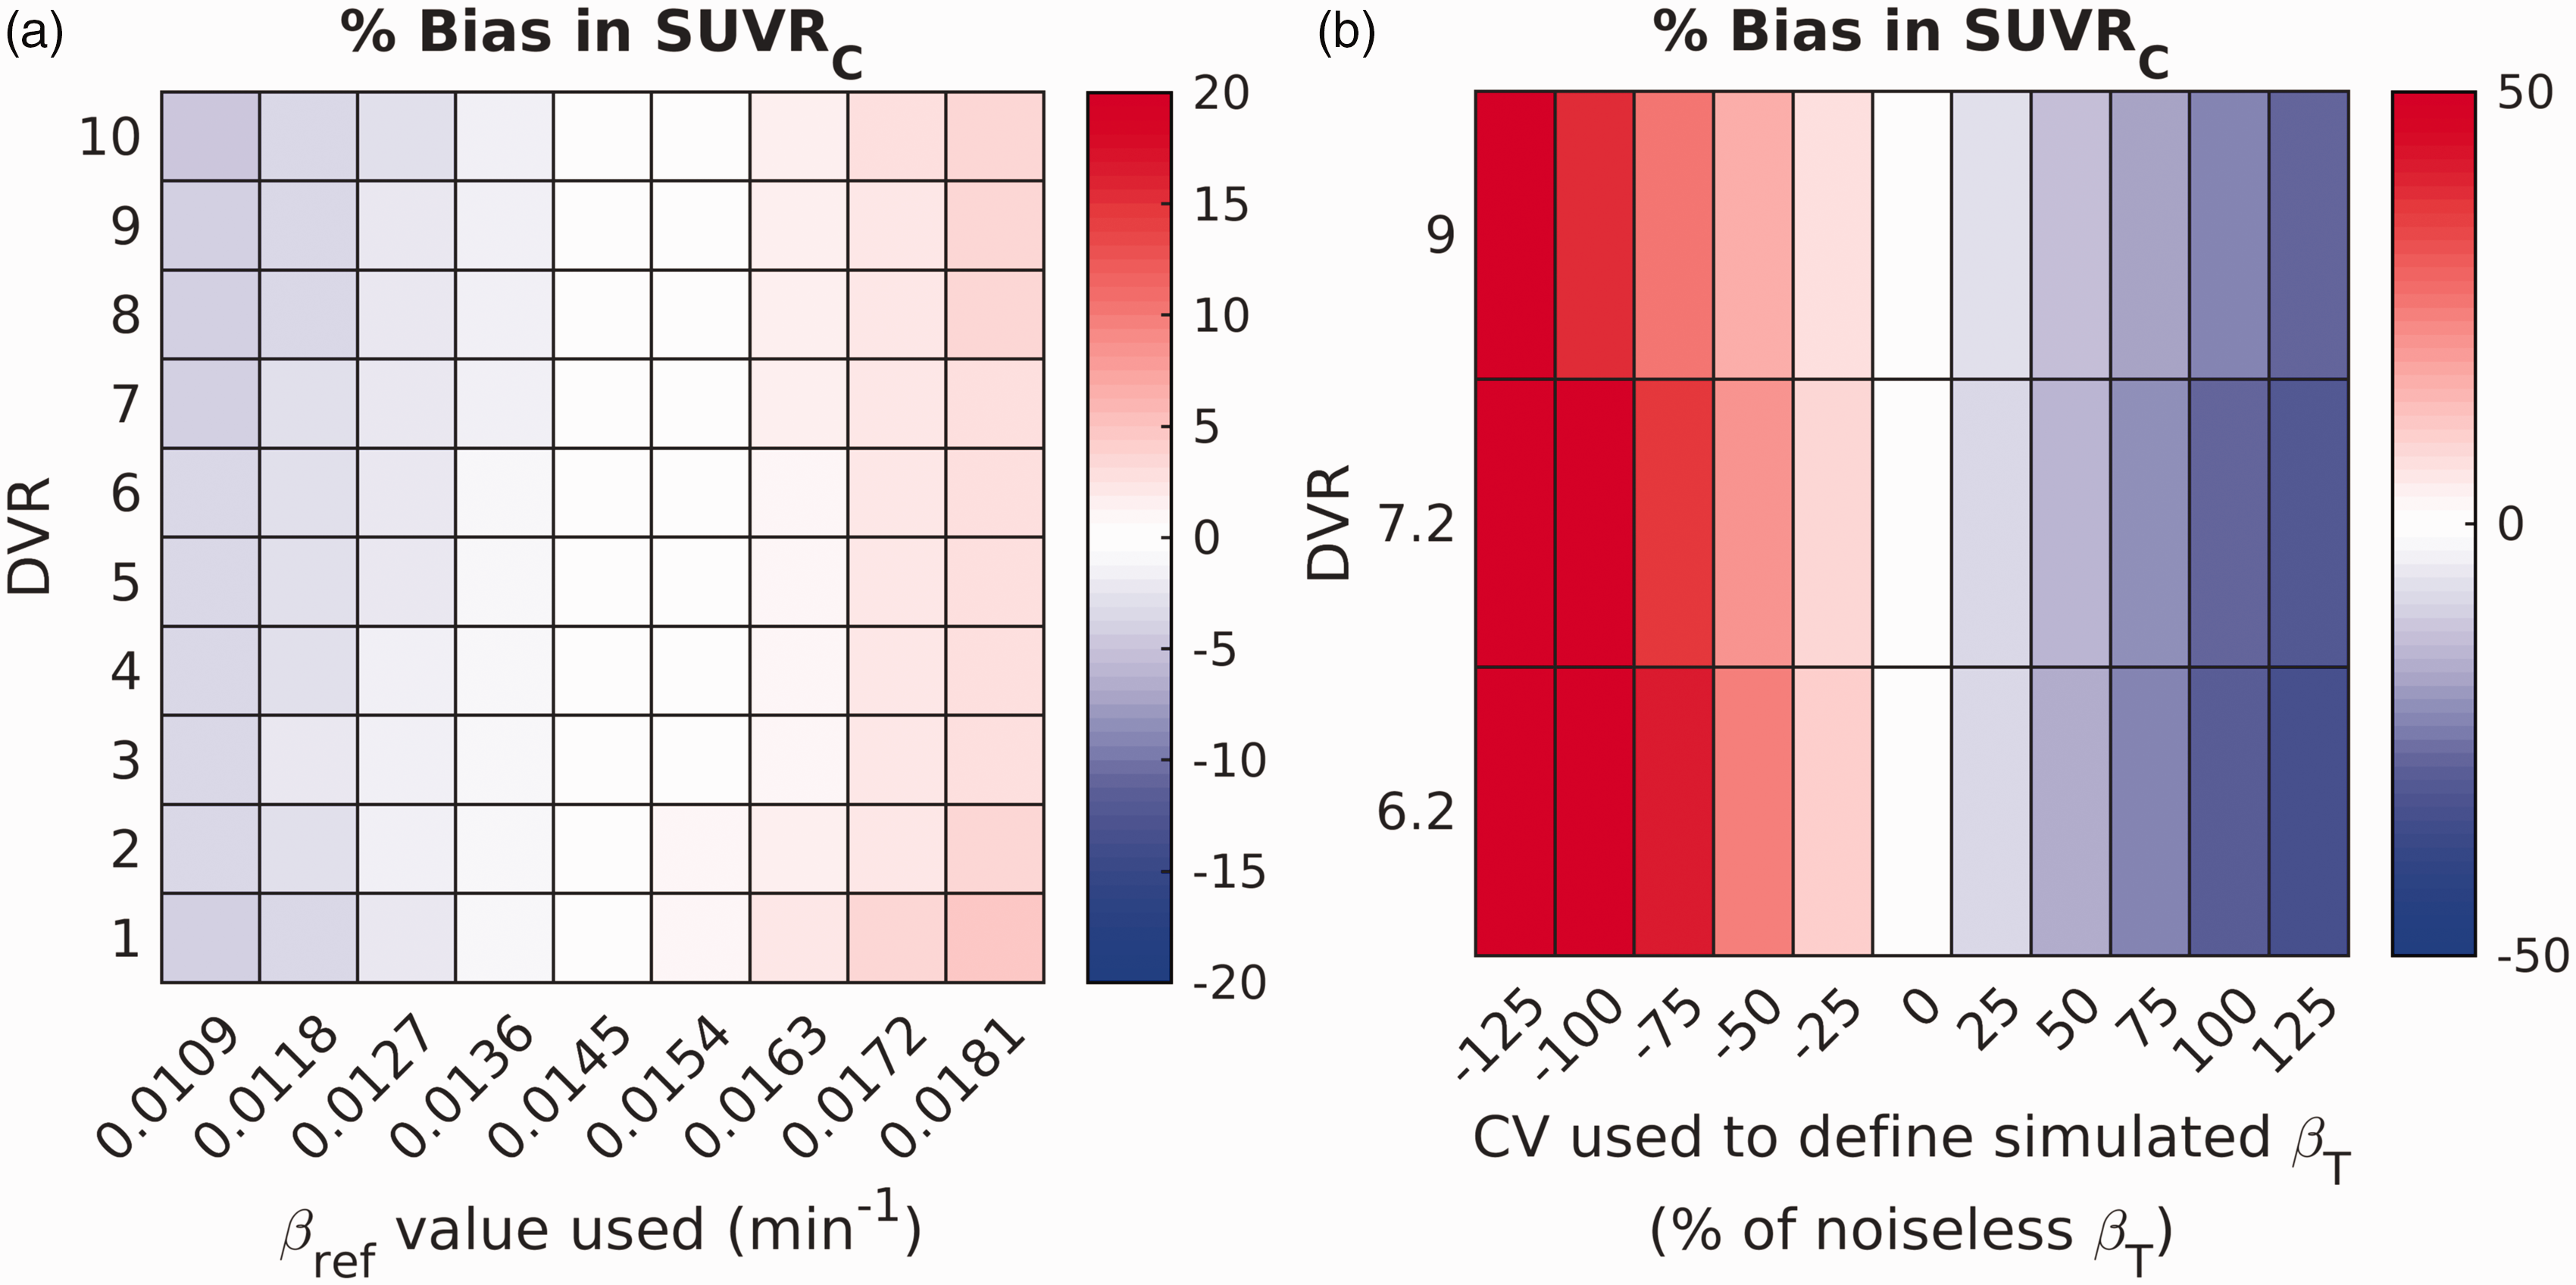
Simulations based on [11C]LSN3172176 kinetics indicated that SUVR was positively biased for all simulated regions and plasma clearance rates (see Figure 1(a)). On average (SD), SUVR overestimated DVR by 51.6% (22.4%). Recall, that β in this figure represents the terminal clearance rate of the tracer in plasma (rate constant associated with the slowest exponent in the input functions). Increasing β, however, also increases the tracer clearance rate from the tissue (βtar) during the SUVR time window. Therefore, SUVR bias increases as βtar becomes more positive. SUVRC reduced this bias to less than 1% [average bias (SD): 0.46% (0.13%); see Figure 1(b)] in all simulated regions and for all values of β (note the different display scale for SUVRC).
Heatmaps characterizing the bias in SUVR (a) and SUVRC (b) during 60–80 min time window post injection, compared to DVR, in simulations for [11C]LSN3172176 across different specific binding levels and tracer clearance rates in plasma (β). β refers to the terminal clearance of the tracer from plasma at late time (rate constant for the slowest exponential term). Color represents the percent bias in SUVR and SUVRC compared to DVR. Note the difference in color scales.
Errors in fixed parameters: R1 and k2,ref
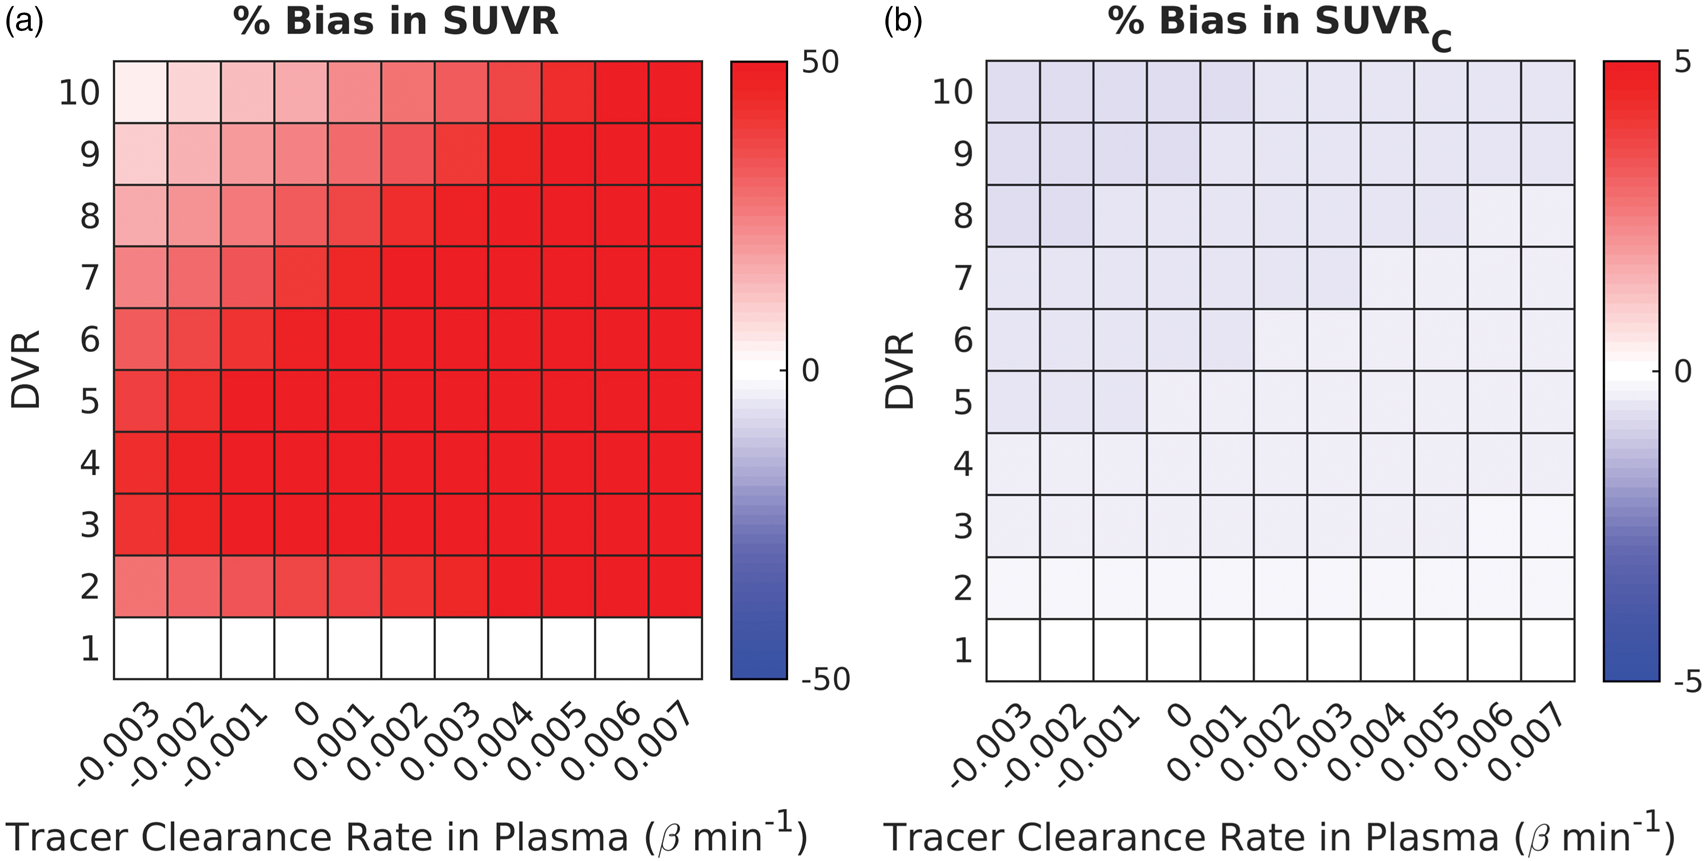
Simulations examining the effects of errors in R1 on SUVRC bias revealed a modest effect (Figure 2(a)), with the bias exceeding ten percent (range for bias: [−10.4 12.3]%) only when R1 was sufficiently (∼25%) different from 1. These findings did not change appreciably when the simulations were repeated with different input functions (data not shown). Similarly, errors in k2,ref implementation (∼25%) resulted in only a small bias in SUVRC (range for bias: [−8.3 6.5]%) for most k2,ref values (see Figure 2(b)).
Heatmaps characterizing the robustness of the correction formula to errors in R1 and k2,ref for [11C]LSN3172176. Color represents the percent bias in SUVRC, compared to DVR. a: Bias in SUVRC when the implemented value of R1 = 1 in the correction is different from the simulated R1 (simulated by varying regional K1 across all DVR values). b: Bias in SUVRC across all DVR values (y-axis) when the implemented value of k2,ref = 0.081 min−1 in the correction is different from the simulated k2,ref values. The bias in SUVRC is generally small and exceeds 10% only when the error in the simulated values of R1 and k2,ref is large (∼ 25%).
Variability in estimated parameters:
and
Errors in
Heatmap characterizing the robustness of the correction to errors in
Determination of the regression slope (a)
The regression slope of the
Sensitivity of the errors in DVR prediction to the choice of regression slope (a)
Least-squares estimation of
Correction of regional SUVR
[11C]LSN3172176 SUVR overestimated the true DVR across different brain regions in the testing dataset (mean bias: 24.6%, range: [9.6, 35.4]%; See Figure 4). With the exception of the ventral striatum (the region with highest binding), SUVRC reduced the bias across all regions (mean bias: −1.7%, range: [−16.0, 8.0]%). Reduction in the bias magnitude was statistically significant for the caudate and putamen (p < 0.01), brain regions in the cerebral cortex (p < 10−4) and the hippocampus (p < 10−5) using paired t-tests (α = 0.05, two-tailed). SUVRC also reduced the standard deviation of the bias from an average value of 15.3% (range: [10.5, 17.6]%) to 6.9% (range: [6.1,8.3] %) across ROIs (note error bars in Figure 4). Bland-Altman plot (Figure S5) confirms better agreement of SUVRC with DVR (mean difference: −0.2, range:[−1.5 1.2]) compared to SUVR (mean difference: 1.3, range:[−0.8 3.4]) in the test cohort. The highest differences between SUVRC and DVR were observed in the ventral striatum.
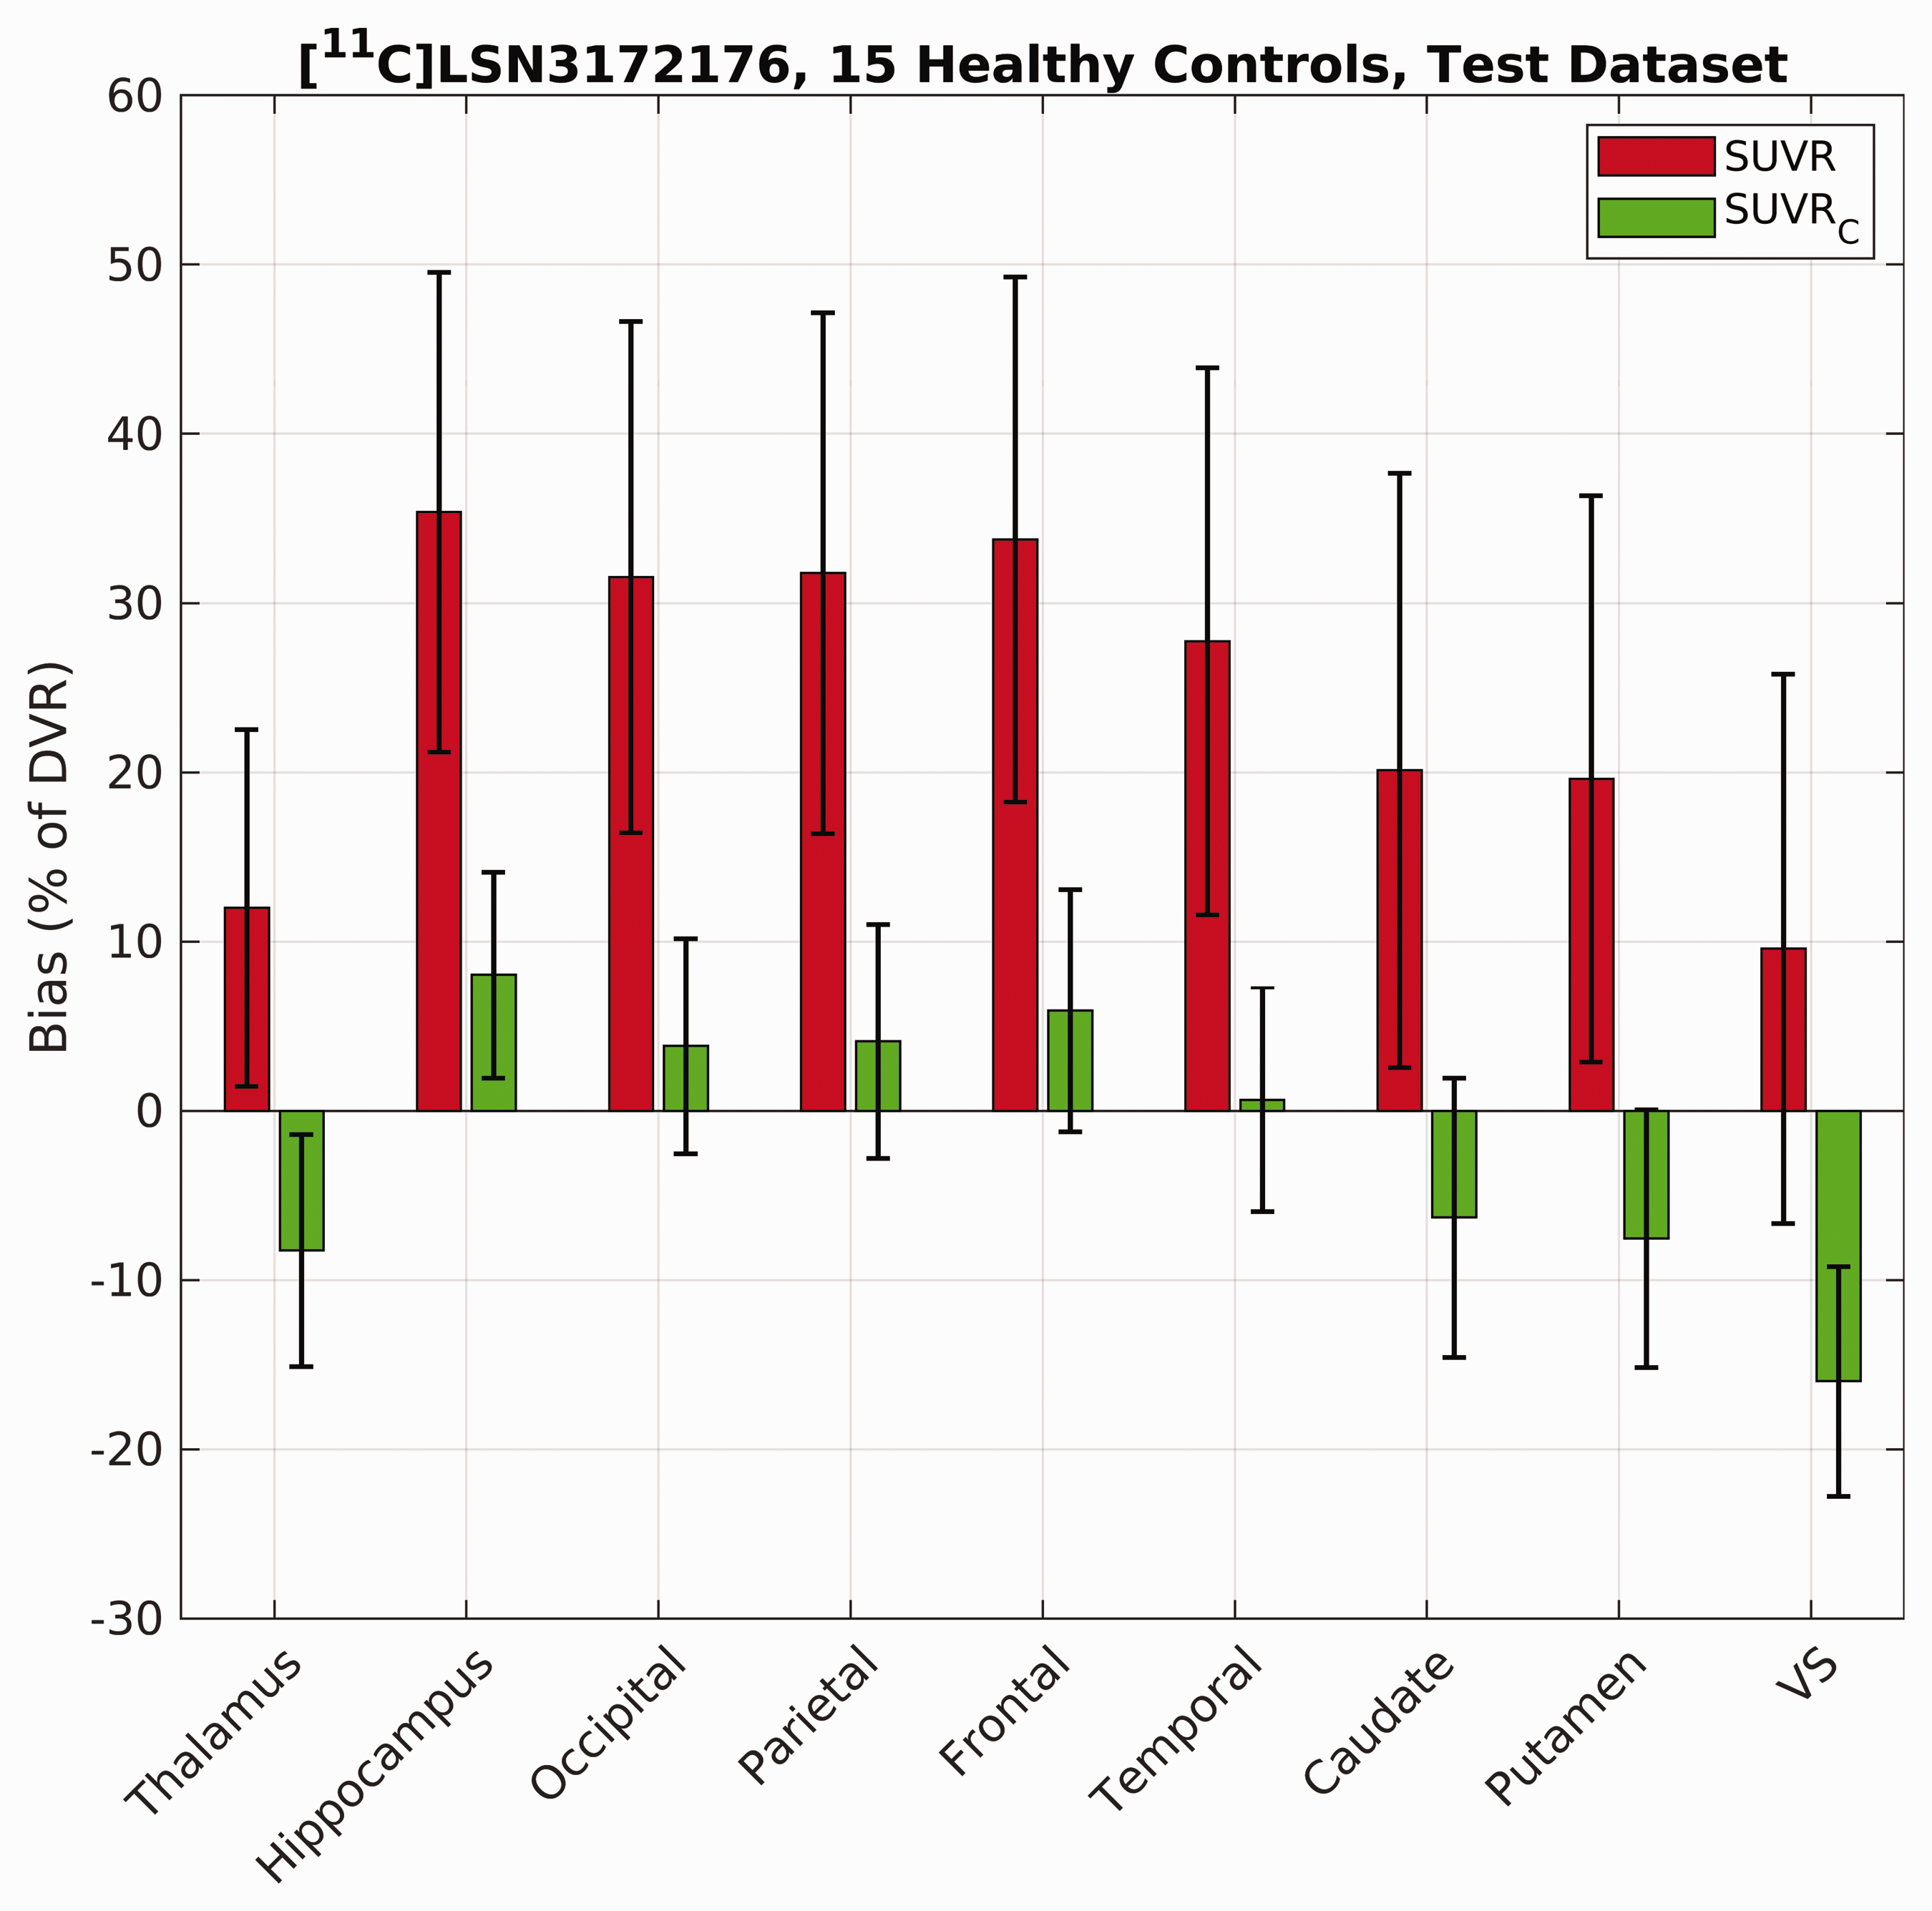
Performance of the correction formula (SUVRC) in reducing the bias and variance in DVR estimation in different brain regions for [11C]LSN3172176 compared to raw SUVR values calculated between 60–80 min post injection. Results reported across n = 15 subjects (testing dataset). VS = Ventral Striatum.
For [18F]FE-PE2I evaluated in the control and PD cohorts, SUVR overestimated the true DVR across all four brain regions (mean bias [range], HC: 28.1% [26.4, 30.4]%; PD: 25.1% [19.2, 29.9]%; see Figure 5). SUVRC reduced this bias in all brain regions in both samples (mean bias in HC: 3.0%, range: [−1.2, 8.8]%; mean bias in PD: 2.7%, range: [−0.3, 7.3]%). Reduction in the bias magnitude (absolute value of bias) was statistically significant for all brain regions and across disease states using paired t-tests (p < 10−5, α = 0.05, two-tailed). The standard deviation of the bias in SUVR was, on average, 9.5% of DVR (range: [7.3, 11.3]%) in the healthy controls, and 8.0% (range: [6.9, 9.3]%) in PD patients. SUVRC, on average, reduced this variability to 8.4% (range: [8.2, 11.1]%) in HCs, and 6.3% (range: [5.4, 6.8]%) in PD patients. Bland-Altman plot (Figure S6) confirms better agreement of SUVRC with DVR (mean difference: −0.04, range:[−0.2 0.3]) compared to SUVR (mean difference: 0.6, range:[−0.1 1.2]) in subjects with PD. The difference between SUVRC and DVR was similar in all regions.
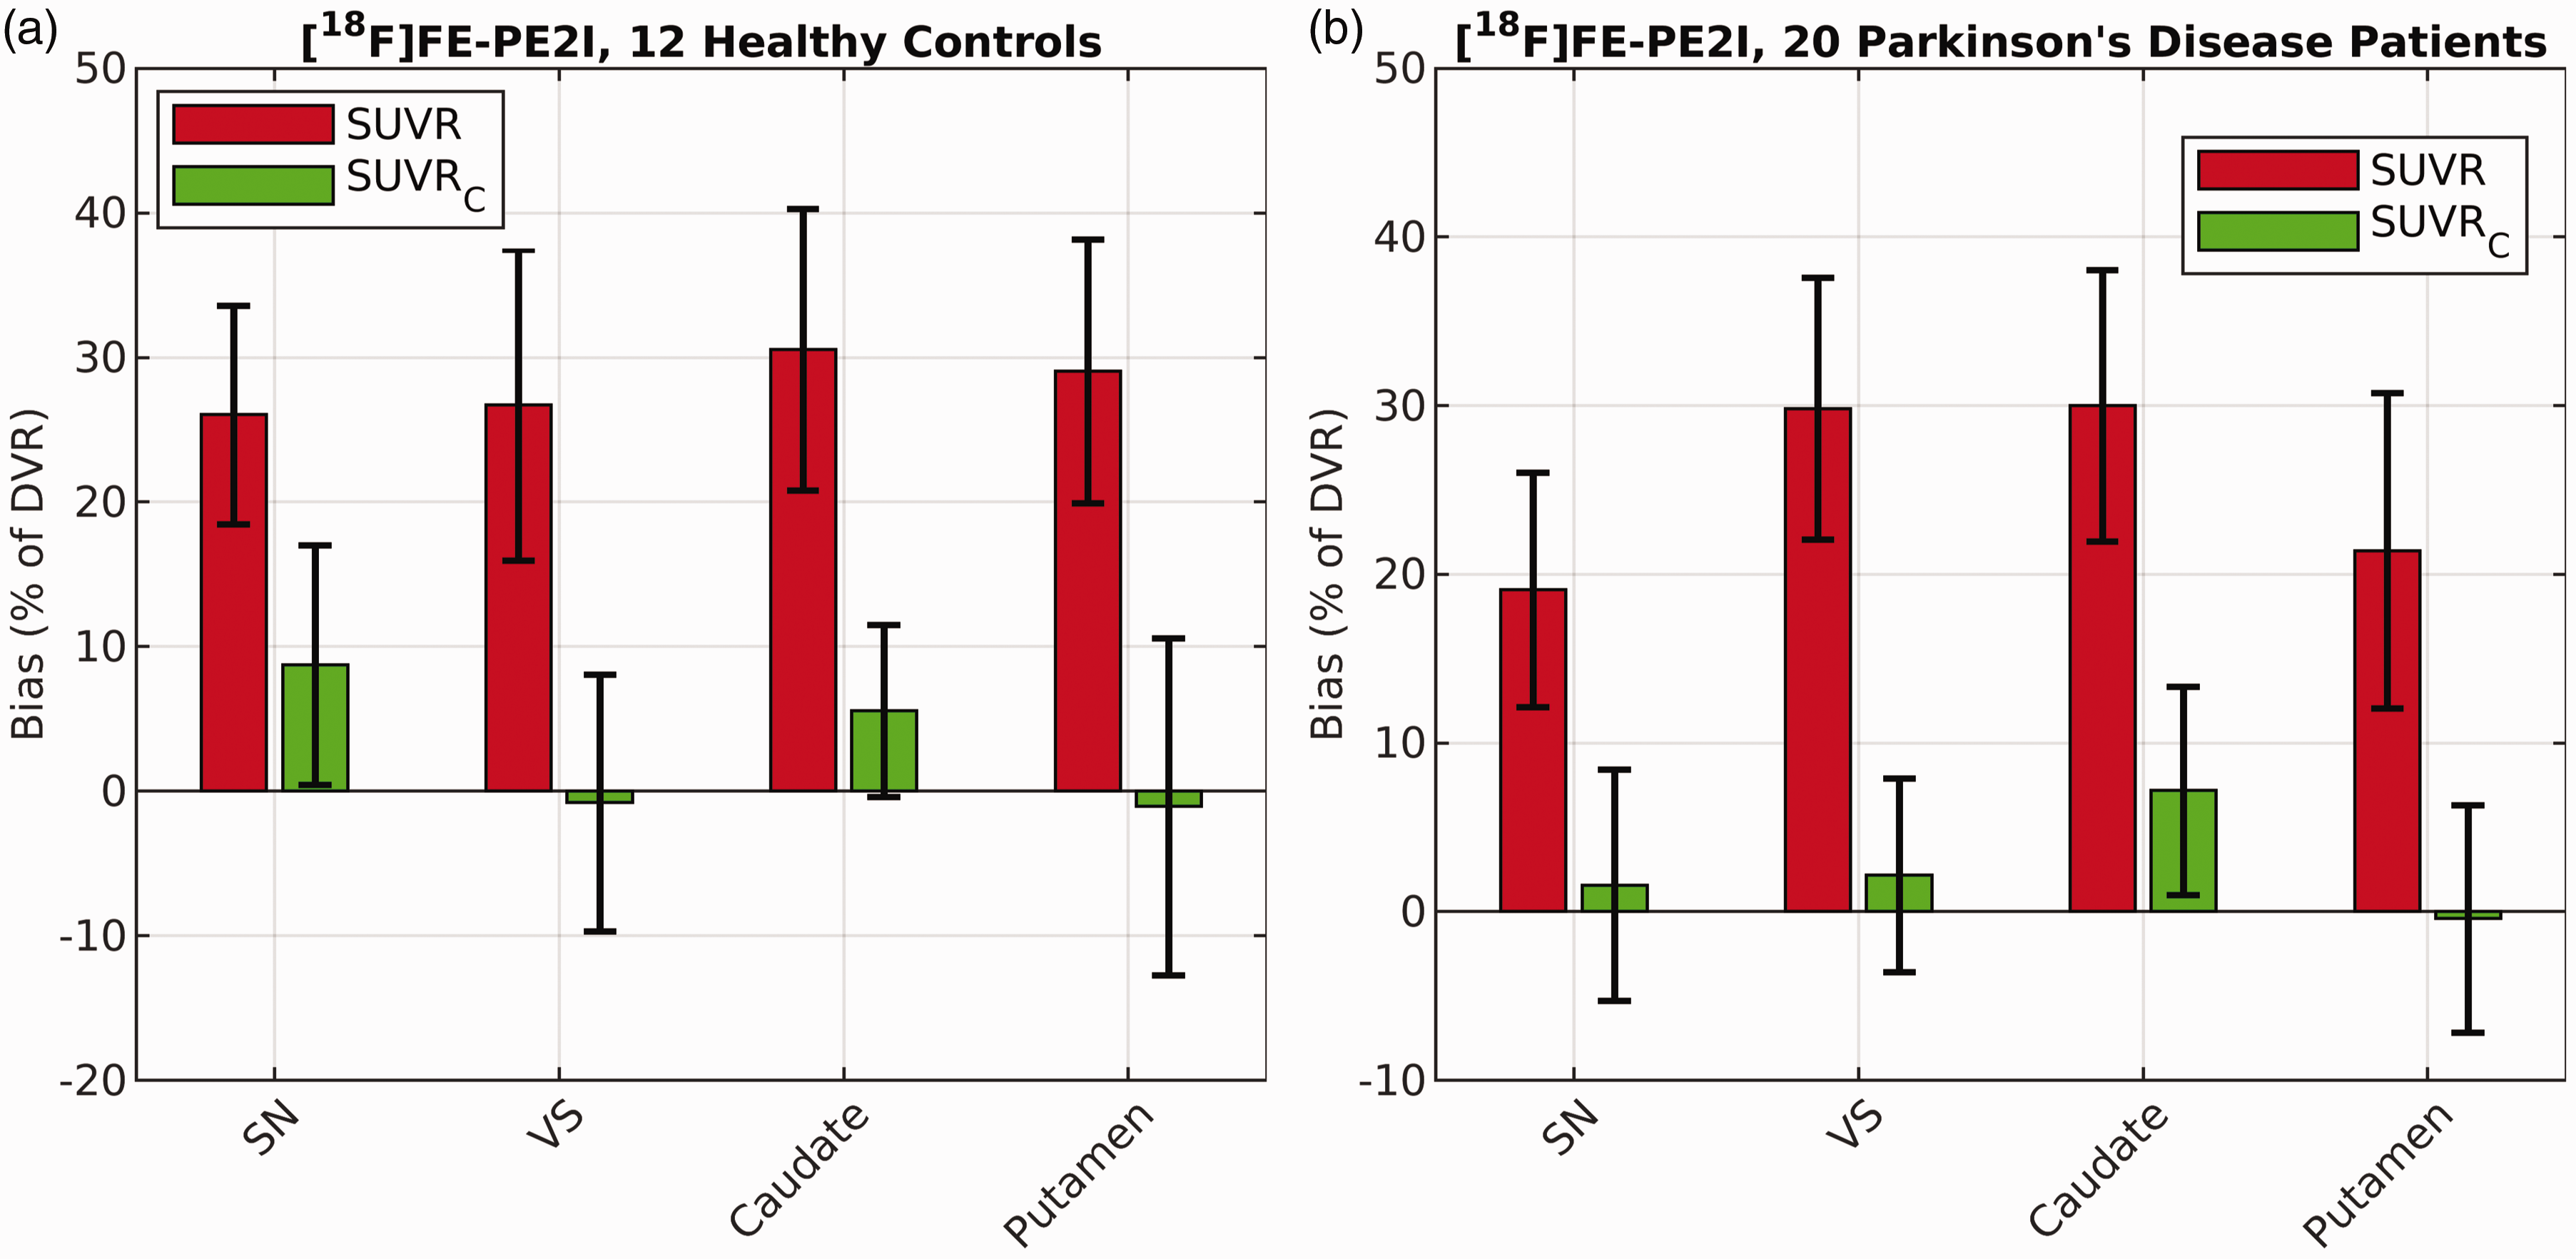
Performance of the correction formula (SUVRC) in reducing the bias and variance of bias in DVR estimation in different brain regions for [18F]FE-PE2I compared to raw SUVR values calculated between 40–60 min post injection. Results reported separately for 12 healthy controls (a) and 20 patients diagnosed with Parkinson’s disease (b). SN = Substantia Nigra, VS = Ventral Striatum.
Comparison of bias in corrected SUVR and early SUVR in [18F]FE-PE2I
A lower bias was observed for SUVRC across brain regions in each cohort (mean bias [range], HC: 3.1% [−1.1, 8.7]%; PD: 2.1% [−0.9, 6.4]%; see Figure S7), compared to early SUVR (mean bias [range], HC: −7.8% [−14.4, 6.6]%; PD: 4.7% [−1.0, 9.9]%; see Figure S7). Additionally, the standard deviation of the regional bias was also smaller for SUVRC (mean [range], HC: 8.7% [5.9, 11.6]%; PD: 6.2% [5.5, 7.1]%; see error bars, Figure S7) compared to SUVR (mean [range], HC: 9.7% [7.6, 11.2]%; PD: 7.5% [5.9, 8.8]%; see error bars, Figure S7).
Voxel-Wise correction of SUVR
Figure 6 illustrates SUVR, SUVRC, and true DVR images for [11C]LSN3172176 (A-B) and [18F]FE-PE2I (C-D) in subjects where the regional performance of the correction formula was best (A, C), i.e., smallest error with respect to DVR, and worst (B, D), respectively. Qualitatively, SUVRC images matched better with the DVR images. SUVR tends to overestimate DVR in most relevant brain voxels. Scatter plots comparing voxel SUVR and SUVRC values with the true underlying DVR values confirm that on average, SUVRC reduced the mean bias in SUVR, and standard deviation of the bias, across all voxels (Figure S8). Even in subjects with the worst performance (B, D), SUVRC performed either better than ([11C]LSN3172176), or similar to ([18F]FE-PE2I), using raw SUVR values.
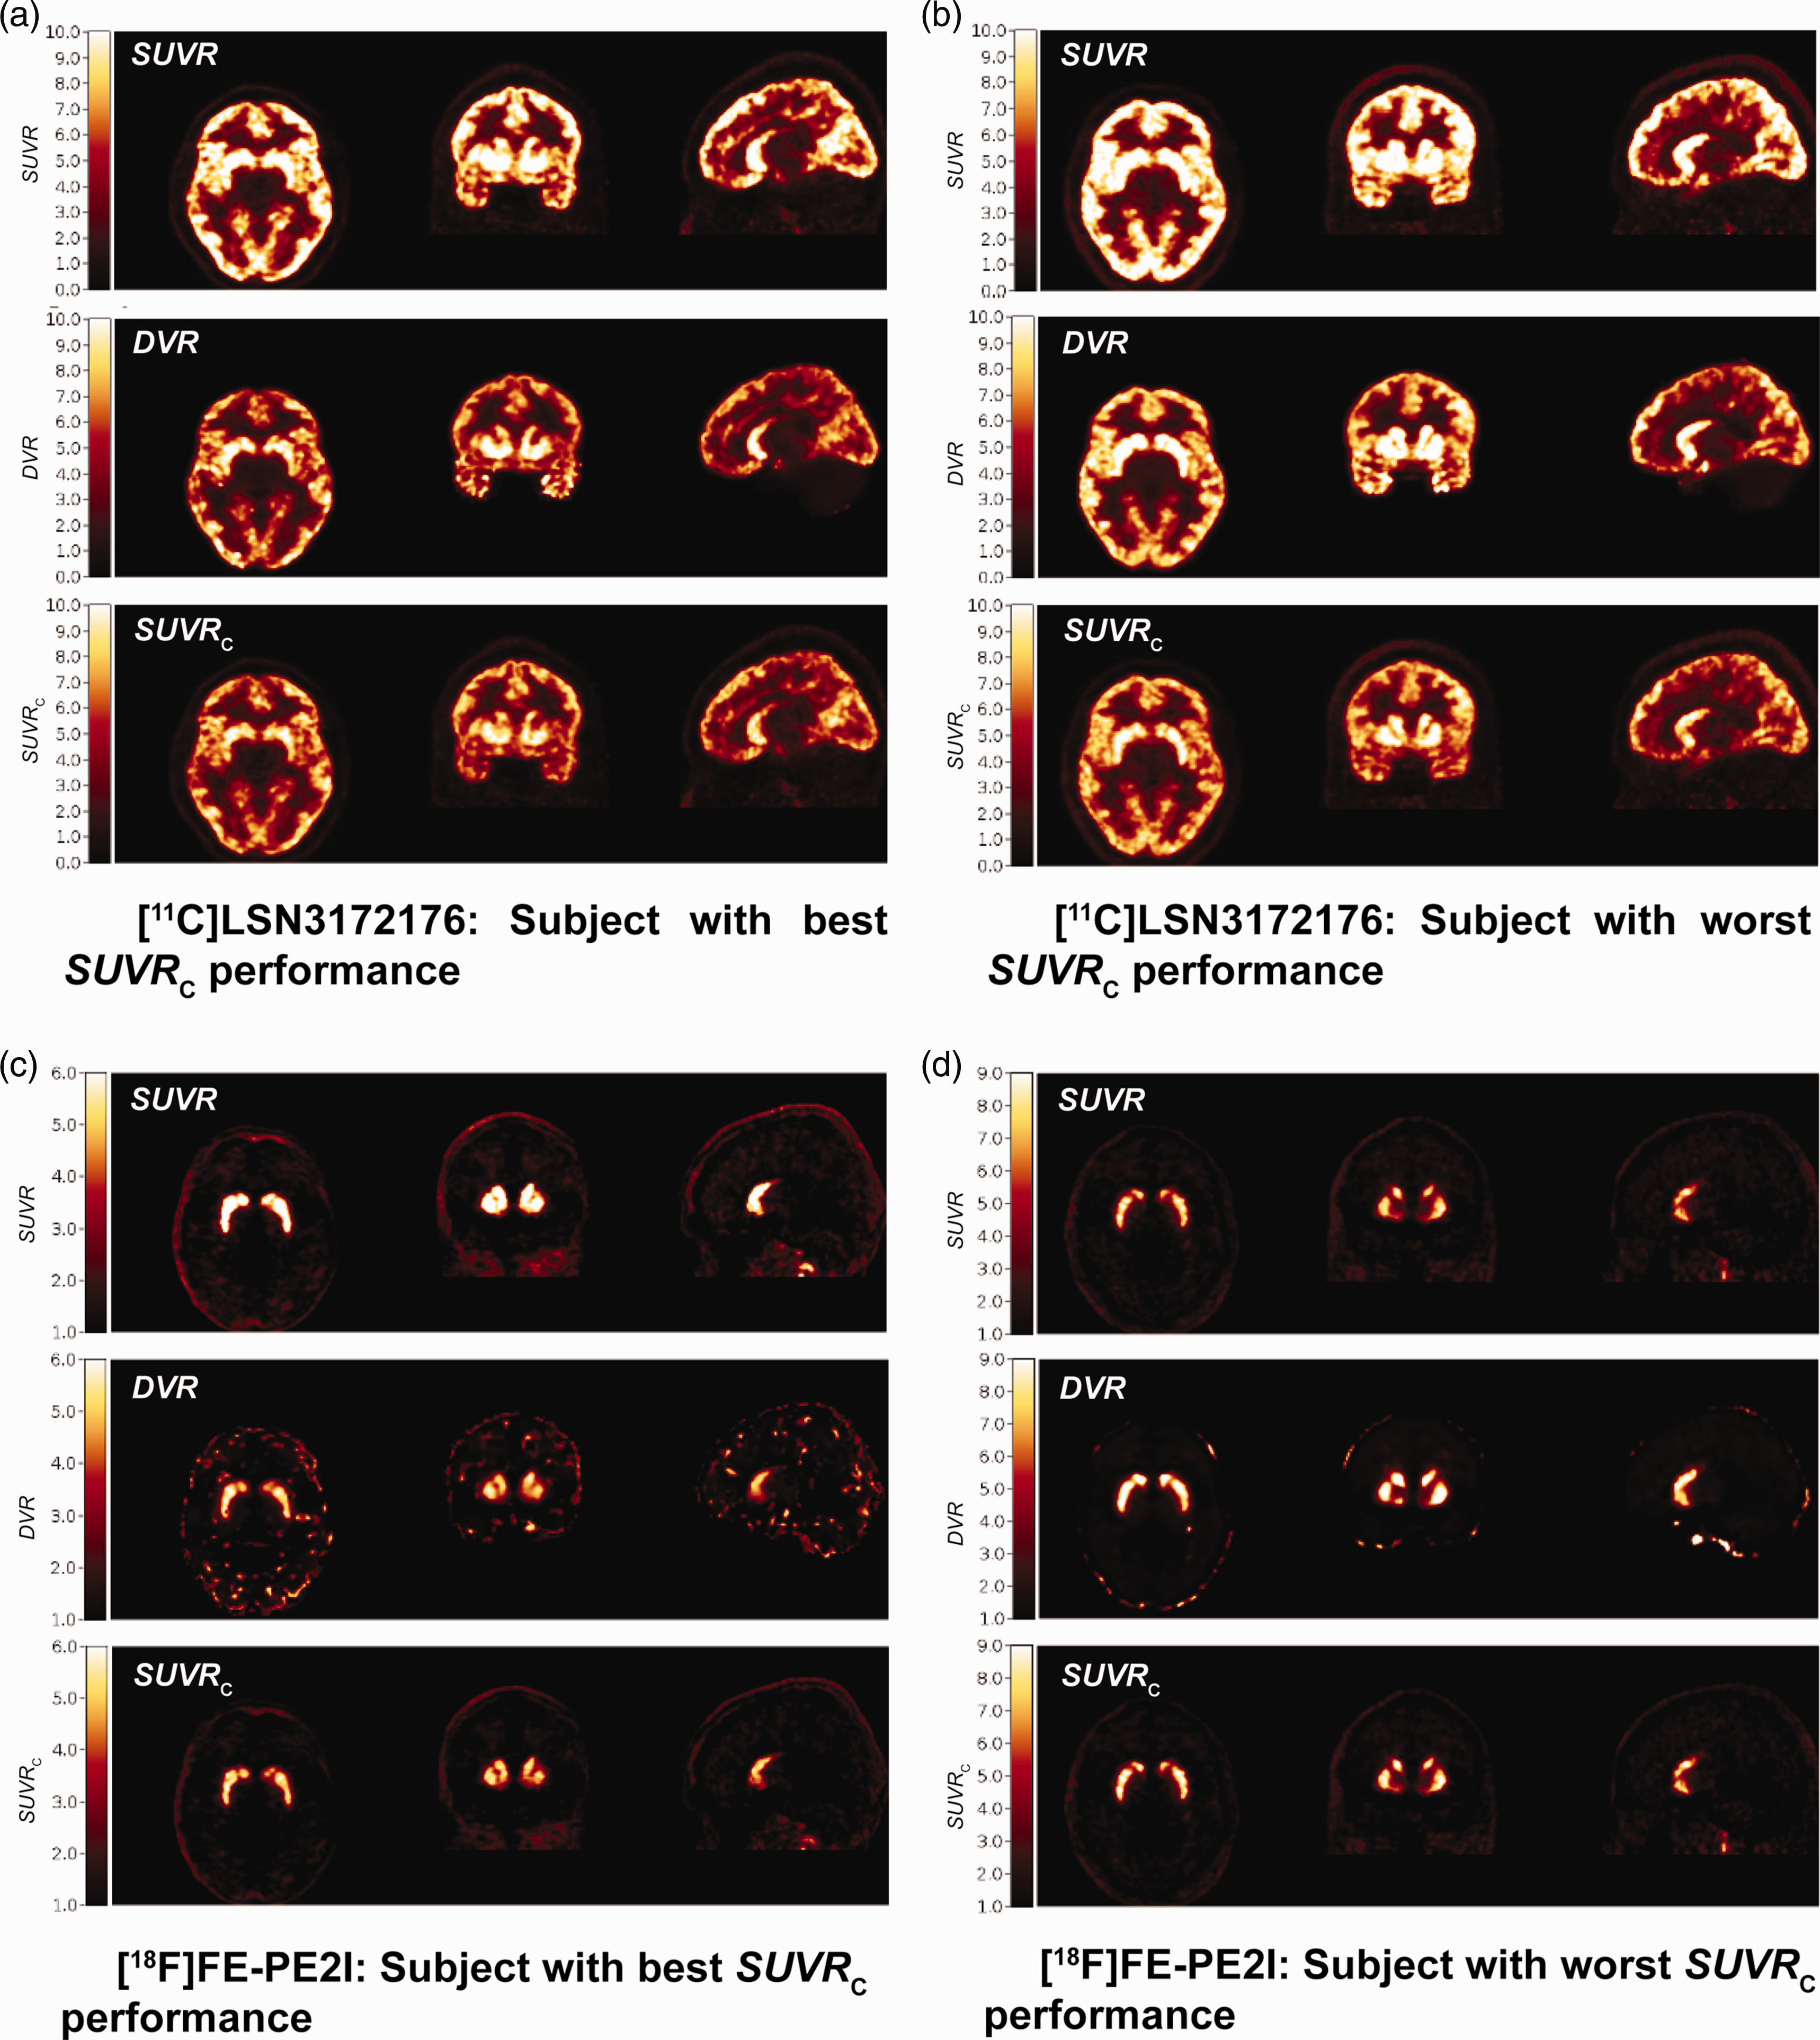
(a, b) Images comparing [11C]LSN3172176 DVR (1TCM) with raw SUVR and SUVRC images for the subjects with best (A) and worst (B) performance of the correction formula based on average root mean square errors in the estimation of regional DVR by SUVRC and (c, d) Images comparing [18F]FE-PE2I DVR (SRTM) with raw SUVR and SUVRC images for the healthy controls with best (C) and worst (D) performance of the correction formula based on average root mean square errors in the estimation of regional DVR by SUVRC. SUVR and SUVRC are calculated from only 20 min of PET data, 60–80 min post-injection for [11C]LSN3172176 and 40–60 min post injection for [18F]FE-PE2I.
Diagnostic performance of corrected SUVR in Parkinson’s disease with [18F]FE-PE2I
Table 1 compares the effect sizes (Cohen’s d) for group differences between a cross-sectional cohort of Parkinson’s disease subjects (n = 20) and healthy controls (n = 12) using early SUVR, SUVR, SUVRC and DVR. The performance of SUVRC was similar to DVR in the ventral striatum and caudate, and similar to SUVR in the putamen. In substantia nigra, the Cohen’s d value for SUVRC was inflated compared to DVR, likely due to the relatively higher bias of SUVRC in controls compared to PD subjects (Figure 5). Early SUVR had the lowest effect sizes in all regions. Further analyses performed in test-retest data and longitudinal follow-up of PD subjects would strengthen this initial evaluation of SUVRC compared to SUVR and DVR.
Effect size comparison [18F]FE-PE2I PET outcomes.
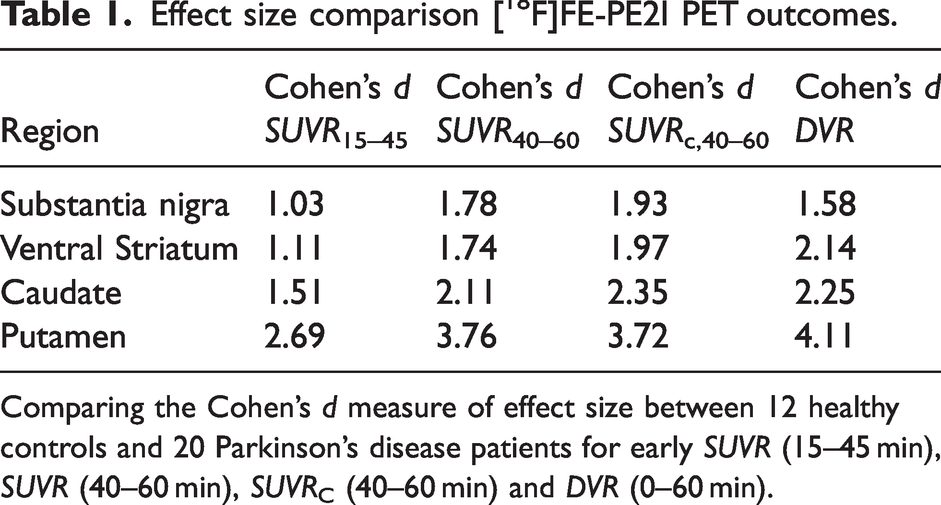
Comparing the Cohen’s d measure of effect size between 12 healthy controls and 20 Parkinson’s disease patients for early SUVR (15–45 min), SUVR (40–60 min), SUVRC (40–60 min) and DVR (0–60 min).
Discussion
This study presents an improved estimation of SUVR from a short time window of PET data based on a one-step non-linear algebraic transform. This approach corrects for non-equilibrium effects of tracer clearance that can introduce substantial bias in SUVR compared to ground-truth DVR. While the correction was strictly derived for a radiotracer following 1TCM kinetics ([11C]LSN3172176), this work also demonstrates application to a radiotracer following 2TCM kinetics ([18F]FE-PE2I), correcting SUVR values to the DVR value calculated using SRTM. For both radiotracers this correction not only significantly reduced bias in SUVR estimates, but it also reduced population-level variability in the bias for most ROIs in our study population. In addition to regional analyses, initial results suggest that correcting SUVR can also provide superior quantification than SUVR in voxel-based pipelines.
There are important applications for more accurate and precise SUVR estimates that are enabled by this correction. Lower variability in the bias, in particular, improves accuracy of PET scans for early diagnosis,21,22 and measuring longitudinal changes within a subject. 23 Additional scenarios where SUVR correction is important is when either the use of drugs or differential disease states affects radiotracer availability and metabolism. Changes in radiotracer clearance rate across subjects due to these factors could introduce differential biases in SUVR that can be minimized if SUVR for each subject is corrected for such effects. Additionally, this correction could be highly useful for radiotracers with large variation in kinetics across brain regions, such as [11C]LSN3172176 (10-fold dynamic range in VT). For such radiotracers, it is often implausible to find a time window during which regional SUVR values are close to the equilibrium DVR for all ROIs. Future studies could compare how raw and corrected SUVR values compare with DVR in clinical paradigms and with different tracers.
The validity of the correction was demonstrated in two radiotracers with established reference regions, i.e., reference regions with minimal displaceable binding. However, some radiotracers ([11C]UCB-J, [18F]FPEB) make use of pseudo-reference region approaches, where the reference region may have a small amount of specific binding. SUVR correction could be applied to correct SUVR values calculated from a pseudo-reference region to their corresponding DVR values obtained via kinetic modeling using the same reference. It should be noted, however, that typical issues encountered when using DVR from an imperfect reference can also be expected for corrected SUVR in these cases.
This work characterized the correction method for two specific radiotracers, but the general roadmap presented here can be adapted for different radiotracers in the future. Simulations characterizing correction performance indicate low sensitivity to errors in the choice of R1, k2,ref and
This approach was designed to facilitate analysis of PET data acquired during a pre-determined late time window. To assess the effects of timing for this window on SUVR correction, exploratory analysis was performed with [11C]LSN3172176 human data for SUVR correction at different times. The window starting points were varied between 60–100 min, and the duration was maintained at 20 min. The value of the regression slope (
The SUVR correction introduced in this work could be improved in future studies. For example, instead of using a least-squares approach to estimate
Conclusion
This study developed and validated a correction for SUVR that accounts for the non-equilibrium effects of tracer clearance and reduces both bias and variability in SUVR quantification. The parameters required for correction can be estimated from a combination of previous literature estimates and a short duration (∼20 min), dynamic, late time-window PET scan, and can be easily implemented for correcting regional or voxel-level SUVR estimates. This approach to correct SUVR is a promising improvement for semi-quantification of future brain PET imaging studies.
Supplemental Material
sj-pdf-1-jcb-10.1177_0271678X231196804 - Supplemental material for Improving SUVR quantification by correcting for radiotracer clearance in tissue
Supplemental material, sj-pdf-1-jcb-10.1177_0271678X231196804 for Improving SUVR quantification by correcting for radiotracer clearance in tissue by Praveen Honhar, David Matuskey, Richard E Carson, Ansel T Hillmer in Journal of Cerebral Blood Flow & Metabolism
Footnotes
Funding
The author(s) disclosed receipt of the following financial support for the research, authorship, and/or publication of this article: These studies were supported by National Institutes of Health (NIH) grants (nos. K01AA024788 and 1R01NS124819) and AbbVie.
Declaration of conflicting interests
The author(s) declared no potential conflicts of interest with respect to the research, authorship, and/or publication of this article.
Authors’ contributions
PH, REC, ATH conceived and developed TCCr. PH performed simulations and data analysis. PH and ATH drafted the initial manuscript. PH, DM, REC, ATH reviewed and approved the final version of this manuscript.
Supplementary material
Supplemental material for this article is available online.
References
Supplementary Material
Please find the following supplemental material available below.
For Open Access articles published under a Creative Commons License, all supplemental material carries the same license as the article it is associated with.
For non-Open Access articles published, all supplemental material carries a non-exclusive license, and permission requests for re-use of supplemental material or any part of supplemental material shall be sent directly to the copyright owner as specified in the copyright notice associated with the article.