
Abstract
Positron emission tomography (PET) using the tracer [18F]-fluorodeoxyglucose (FDG) is commonly used for measuring metabolic rate of glucose (MRglc) in the human brain. Conventional PET methods (e.g., the Patlak method) for quantifying MRglc assume the tissue transport and phosphorylation mechanisms to be in steady state during FDG uptake. As FDG and glucose use the same transporters and phosphorylation enzymes, changing blood glucose levels can change the rates of FDG transport and phosphorylation. Compartmental models were used to simulate the effect of rising arterial glucose, from normal to hyperglycemic levels on FDG uptake for a typical PET protocol. The subsequent errors on the values of MRglc calculated using the Patlak method were investigated, and a correction scheme based on measured arterial glucose concentration (Gp) was evaluated. Typically, with a 40% rise in Gp over the duration of the PET study, the true MRglc varied by only 1%; however, the Patlak method overestimated MRglc by 15%. The application of the correction reduced this error to −2%. In general, the application of the correction resulted in values of MRglc consistently significantly closer to the true steady state calculation of MRglc independently of changes to the parameters defining the model.
Introduction
Measurements of cerebral metabolic rate of glucose (MRglc) can be made in vivo using the fluorine-18 labeled tracer, fluorodeoxyglucose (FDG) in positron emission tomography (PET) as an indicator of brain metabolism. A standard method of quantifying MRglc is the graphical analysis technique by Patlak et al (1983), commonly known as the Patlak plot. Briefly, this method requires the measurement of regional FDG uptake over time, a measure of FDG activity in the blood plasma (e.g., from continuous arterial sampling) and a measurement of the plasma glucose concentration. The plasma glucose concentration is assumed constant throughout the duration of the scan.
In experimental protocols investigating brain metabolism it may be difficult or impossible to maintain a constant plasma glucose level for the duration of the PET acquisition. For example, studies published by the authors have used methods in which the subject's glucose level is maintained at a constant level through the uptake period using a steady rate insulin infusion and a variable rate glucose infusion (e.g., Cranston et al, 2001; Bingham et al, 2005). However, Anthony et al (2006) used a study protocol in which an insulin infusion was not available in half of the studies, and 6 of 14 subjects showed changes in plasma glucose levels over 1 mmol/L during the 90-min PET scan. The largest change was in a subject whose glucose levels rose from 6 mmol/L to a maximum of 8 mmol/L.
The purpose of this study was to estimate the effect of changing plasma glucose levels on values of MRglc calculated using the Patlak method, and to establish a method of correcting for any such errors. FDG-PET is considered the most robust noninvasive method of evaluating MRglc and no parallel in vivo techniques exist for measuring regional MRglc, which could accurately compare FDG-PET methods to actual glucose metabolism. For this reason, a simulation of FDG uptake was developed based on standard models of glucose transport and phosphorylation.
The calculations of glucose transport rates across the blood-brain barrier and phosphorylation rates in the tissue are derived from the three compartment model of FDG uptake developed by Sokoloff et al (1977) and Huang et al (1980). This model requires the steady state uptake of tracer into the tissue, in which the transport and phosphorylation rates of FDG are constant for the duration of the measurements.
One way this condition can be violated without direct neuronal stimulation is if the blood glucose level changes. Both glucose transport across cell membranes and phosphorylation are saturable processes (Lund-Andersen, 1979), therefore, a change in glucose level can change the number of available glucose transporters or hexokinase binding sites for FDG and consequently the observed uptake.
The main assumption underlying this study is that a rise in plasma glucose does not trigger an increase in MRglc. It is well known that hypoglycemia can trigger counterregulatory responses that are associated with changes in cerebral neuronal activation (Rizza et al, 1979 and Mitrakou et al, 1991). Cerebral glucose oxidation in healthy subjects, calculated using [1-11C]-D-glucose has been shown to increase significantly during hyperglycemia; however, these were at plasma glucose levels of 13.8 mmol/L (Blomqvist et al, 1998). There are no reported studies of the effects of mild hyperglycemia on cerebral glucose metabolism in healthy subjects, with plasma glucose levels similar to those found in the study by Anthony et al (2006).
Materials and methods
Models for Simulation of Glucose Kinetics
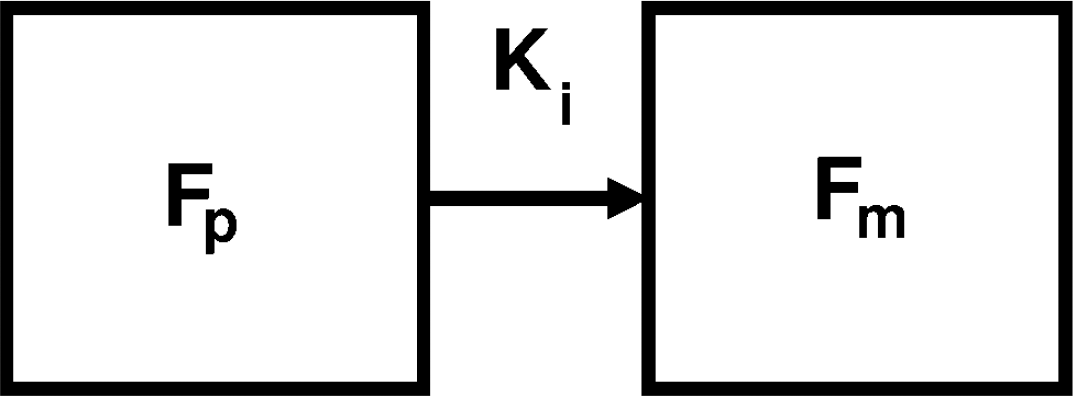
The compartmental model used to simulate glucose kinetics is shown in Figure 1. Both glucose transport and phosphorylation can be described by Michaelis-Menten kinetics (Sokoloff et al, 1977) and so, in general terms, the rate of glucose transfer from compartments A to B is given by the equation,
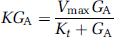
where K is the transport rate ‘constant’ between compartments A and B (e.g., K1, k2, or k3). Vmax is a constant defining the maximal transport rate, Kt is the half-saturation constant (equal to the concentration of glucose at which the rate is half Vmax), and GA is the glucose concentration in compartment A. As typical plasma FDG concentrations are negligible compared with plasma glucose, the rate constants of both glucose and FDG kinetics can be considered independent of FDG concentrations.
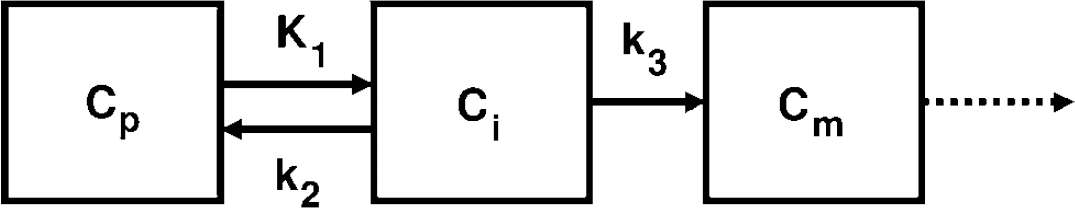
Three-compartment model by Sokoloff et al (1977) for glucose/FDG kinetics in the brain. The compartments, Cp, Ci, and Cm, are the concentrations of glucose/FDG in the plasma, in the cell, and as phosphorylated substrate (i.e., Glucose-6-P or FDG-6-P), respectively. Arrows with solid lines represent routes of transfer between the compartments available to both glucose and FDG. The dotted line shows the route of further glycolysis available to glucose only.
On the basis of equation 1 we developed a computer simulation to describe the evolution of the rate constants K1, k2, and k3, and the intracellular glucose concentration, Gi, over time in response to a continuous change in the plasma glucose concentration, Gp. If Gp is changing over time then K1-3 and Gi are also time dependent, and the rate ‘constants’ K1-3 in Figure 1 are now given by
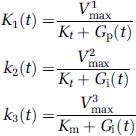
The superscripts in V j max (j = 1, 2, 3) refer to the maximal rates of transfer relating to the different rate constants. The rate of change of Gi(t) is given by
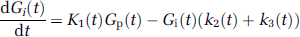
The actual metabolic rate of the model, MRact, is given by k3 x Gi.
Fluorodeoxyglucose Kinetics
The same three-compartment model shown in Figure 1 was used to simulate FDG uptake, in which the time-dependent Gi, Gp, and K1-3 are provided by the glucose simulations above. A typical uptake curve, FT, from a dynamic FDG-PET brain study in a volume of interest (VOI) in the brain comprises unphosphorylated FDG in tissue, Fi, FDG-6-P in tissue, Fm, and a small fraction, b, of FDG in blood, Fb, assumed to be equal to the arterial FDG sample. The total FDG uptake is then given by

where Fi and Fm are the FDG concentrations in the compartments and are denoted as Ci and Cm, respectively, in Figure 1.
Patlak for the Steady State Model
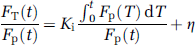
The Patlak method assumes that, under steady state conditions in which the transfer rate parameters K1, k2, and k3 are constant, after a time, t', Fi equilibrates with the concentration of FDG in the plasma, FP. Therefore, when t > t', MRglc is related to a ‘grouped’ transfer rate constant, Ki, (see Figure 2) and the equation used to derive it is given by
Two-compartment model by Patlak et al (1983) representing free FDG concentration in the plasma, Fp, and FDG-6-P concentration, Fm.
A plot of FT(t)/Fp(t) against Fp(t)dt/Fp(t) should reveal a straight line with gradient Ki and intercept η for t > t'. So MRglc is given by
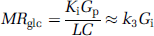
where Gp is the plasma glucose concentration and LC is the lumped constant derived by Sokoloff et al (1977). As the values of LC are not of primary concern for this study, the value will be assumed to be 1 except where stated otherwise.
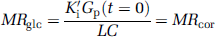
Glucose Corrected Patlak Method
According to the published values of Km, Kt, and Gi (e.g., Lund-Andersen 1979 and Barros et al, 2007) in healthy human brain cells under typical conditions, hexokinase is highly saturated, whereas values of Kt are of the same order of Gp and Gi. To avoid using highly variable published values of Km and Kt in any correction method, this modified equation assumes that the transfer system as shown in Figure 2 is completely saturated. Therefore, with changing Gp a grouped transfer rate constant, K'i that is equivalent to K had Gp not changed (i.e., from its value at t = 0) can be calculated from
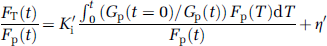
and MRglc is given by
We investigated how well this corrected method can calculate MRglc compared with no correction in the face of changing plasma glucose levels. MRglc calculated from the uncorrected and corrected methods will be denoted as MRunc and MRcor, respectively. For situations in which Gp was changing, MRunc was calculated using the mean value of Gp between tstart and tend, that is,
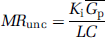
Under steady state conditions, MRunc and MRcor are equal and will be denoted as MRss.
Simulations
Plasma Glucose and Initial Kinetic Parameters
Six plasma glucose profiles were simulated as a linear rises from 5 mmol/L up to 5 (i.e., steady state), 7, 9, 11, 13, and 15 mmol/L over 2h. These profiles were denoted as GP1, GP2, GP3, GP4, GP5, and GP6, respectively.
Time dependent K1-3, G i , and MRact were calculated for each plasma glucose profile with a range of initial values. K1(t=0) was set to 0.001 ml g−1 s−1 and a range of initial values of k2 and k3 were chosen; 0.0006 to 0.002 s−1 and 0.0001 to 0.0016 s−1, respectively. Initial values of Gi were calculated from the initial values of Gp and K1-3. This assumes that the system is in steady state before the rise.
The half-saturation constants used for transport and phosphorylation, Kt and Km, respectively, were fixed at 4 and 0.05 mmol/L (typical values are presented in Barros et al, 2007 and Lund-Andersen 1979, respectively). The constants V j max (j = 1 to 3) were calculated from K t , Km, and initial values of K1-3 and Gp.
Fluorodeoxyglucose Kinetics and Patlak
For each plasma glucose profile and set of time-dependent kinetic parameters, a 2-h FDG time activity curve with 1-sec frames was simulated with b = 0.05 (equation 4) and a simulated arterial FDG curve, Fp, as described by Feng et al (1993). To investigate the effect of time on the Patlak calculation, a range of tend (15 to 120 mins) was used to calculate MRunc and MRcor, where tend - tstart = 300 s.
The effect of the kinetics on the efficacy of both Patlak methods was assessed using the ratios MRunc/MRact and MRcor/MRact. The effect solely of the correction term was assessed using the ratios MRcor/MRss, MRunc/MRss, or MRunc/MRcor.
Kinetic Constants
The published values of K t and K m are variable so a range of values either side of published values (K t = 1 to 32 mmol/L and Km = 0.001 to 1.0 mmol/L) were also used in the simulation to assess the effect on the Patlak correction (i.e., MRcor/MRunc).
The model of the LC presented in Crane et al (1983) is dependent on the values of k2, k3, and ‘transport coefficient’ and ‘phosphorylation coefficient’ denoted as TC and PC, respectively. TC is equal to the ratio of the transport rate constants of glucose and FDG and PC, the ratio of the phosphorylation rate constants of glucose and FDG. The effect of these parameters on the Patlak correction (i.e., MRcor/MRunc) was investigated using a range of TC and PC (TC = 0.2 to 2.5 and PC = 0.1 to 1.0) around the published values (Kuwabara et al, 1990) of 1.1 and 0.3, respectively.
Fluctuating Gp and Fluorodeoxyglucose Noise
Typical plasma glucose profiles are not linear so the effect of random fluctuations of Gp was also investigated. Plasma glucose samples were simulated at 5-min intervals with fluctuations of the order of those observed in real studies. Profiles were simulated with normally distributed values around the mean calculated from the base linear glucose profiles (GP1-6) and a standard deviation (s.d.) of 0.15 mmol/L (derived from profiles by Anthony et al, 2006, which showed no significant rising trend). The Gp input to the glucose model was resampled to 1-sec intervals using a spline interpolation fitting the assumption that actual plasma glucose profiles vary smoothly. About 100 randomly fluctuating glucose profiles were generated to estimate the population mean and s.d. of MRcor and MRunc.
Noise arising in typical FDG-PET scans was also simulated using noise levels representing different dynamic frame durations and different size VOIs. Noise was calculated from the simulated uptake and variance parameters derived from a phantom study on a GE Discovery ST in 3D mode with CT attenuation correction and scatter correction. 100 noisy FDG uptake curves were simulated for a 2-h uptake period with 5 mins frame durations, for each glucose profile and for each noise function, representing a 1 voxel (2 × 2 × 3.27 mm) VOI and a 100 voxel VOI.
To simulate the effects of randomly fluctuating glucose profiles or noisy FDG uptake curves, the following initial parameters were used, K1 = 0.001 ml g−1 s−1 k2 = 0.0012 s−1, k3 = 0.0008 s−1, b = 0.05. Patlak calculations were made with tstart = 30 mins and tend = 60 mins. These parameters are in the ranges of a typical FDG scan.
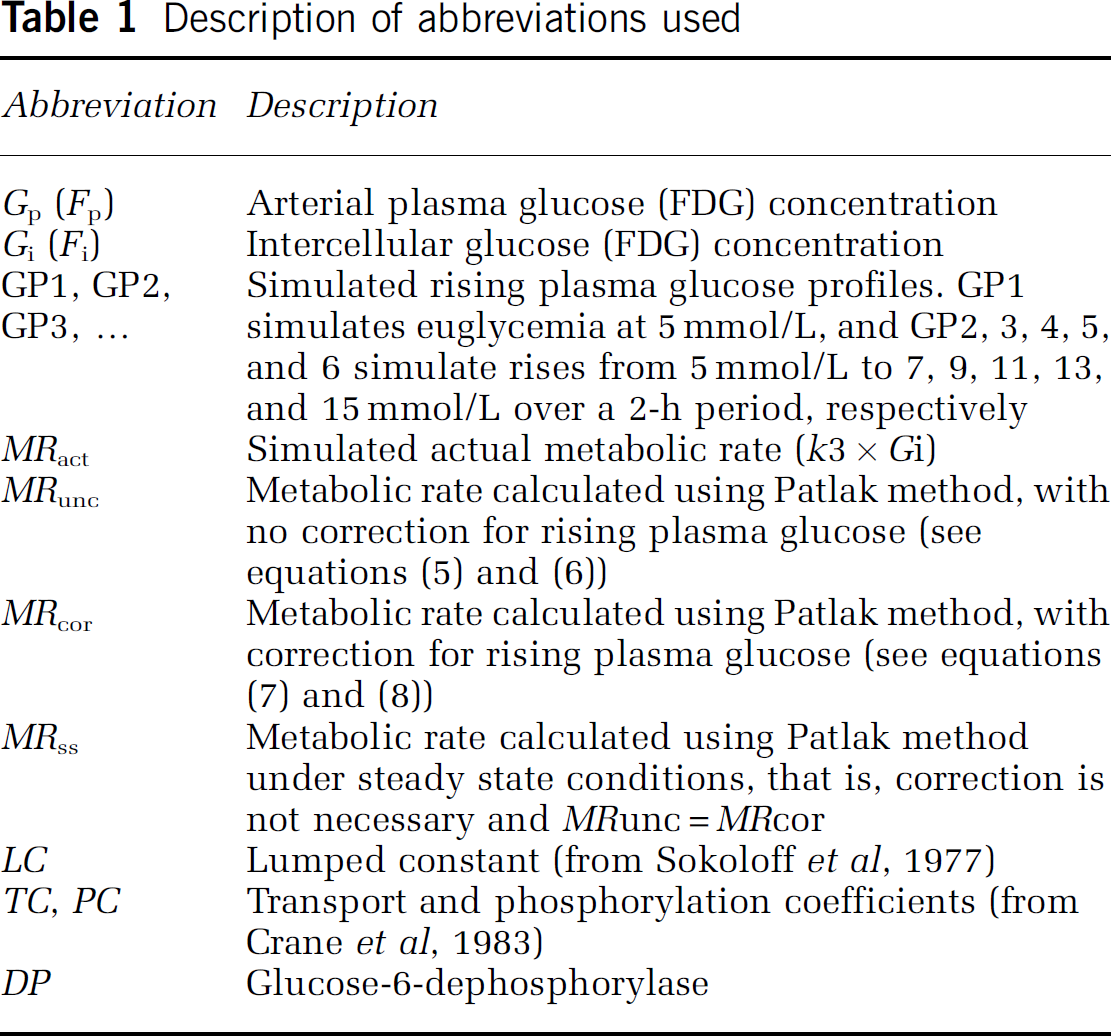
Table 1 summarizes the abbreviations and their descriptions used in the text, Figures and Table 2.
Description of abbreviations used
Estimated population means and standard deviations of MRunc/MRss and MRunc/MRss ratios
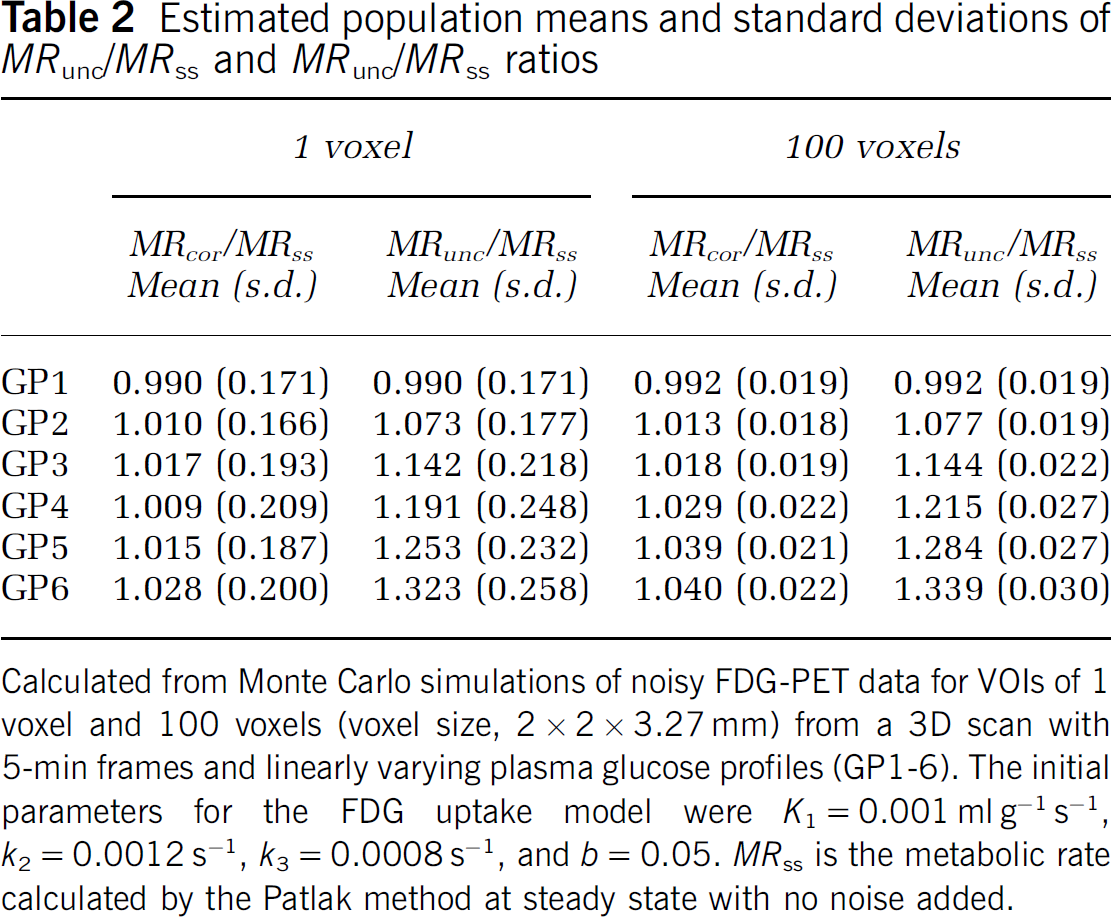
Calculated from Monte Carlo simulations of noisy FDG-PET data for VOIs of 1 voxel and 100 voxels (voxel size, 2 × 2 × 3.27 mm) from a 3D scan with 5-min frames and linearly varying plasma glucose profiles (GP1-6). The initial parameters for the FDG uptake model were K1 = 0.001 ml g−1 s−1, k2 = 0.0012 s−1, k3 = 0.0008 s−1, and b = 0.05. MRss is the metabolic rate calculated by the Patlak method at steady state with no noise added.
Results
Plasma Glucose and Initial Kinetic Parameters
Example plots of simulated Gp, Gi, k3, and MRact are shown in the top two panels of Figure 3. In nonsteady state simulations in which Gp rose linearly, Gi was approximately proportional to Gp after a small period of equilibration between the two compartments. Values of k3 fell almost inversely proportionally to the rise in Gi resulting in MRact remaining approximately constant, showing only a very small rise with Gp.
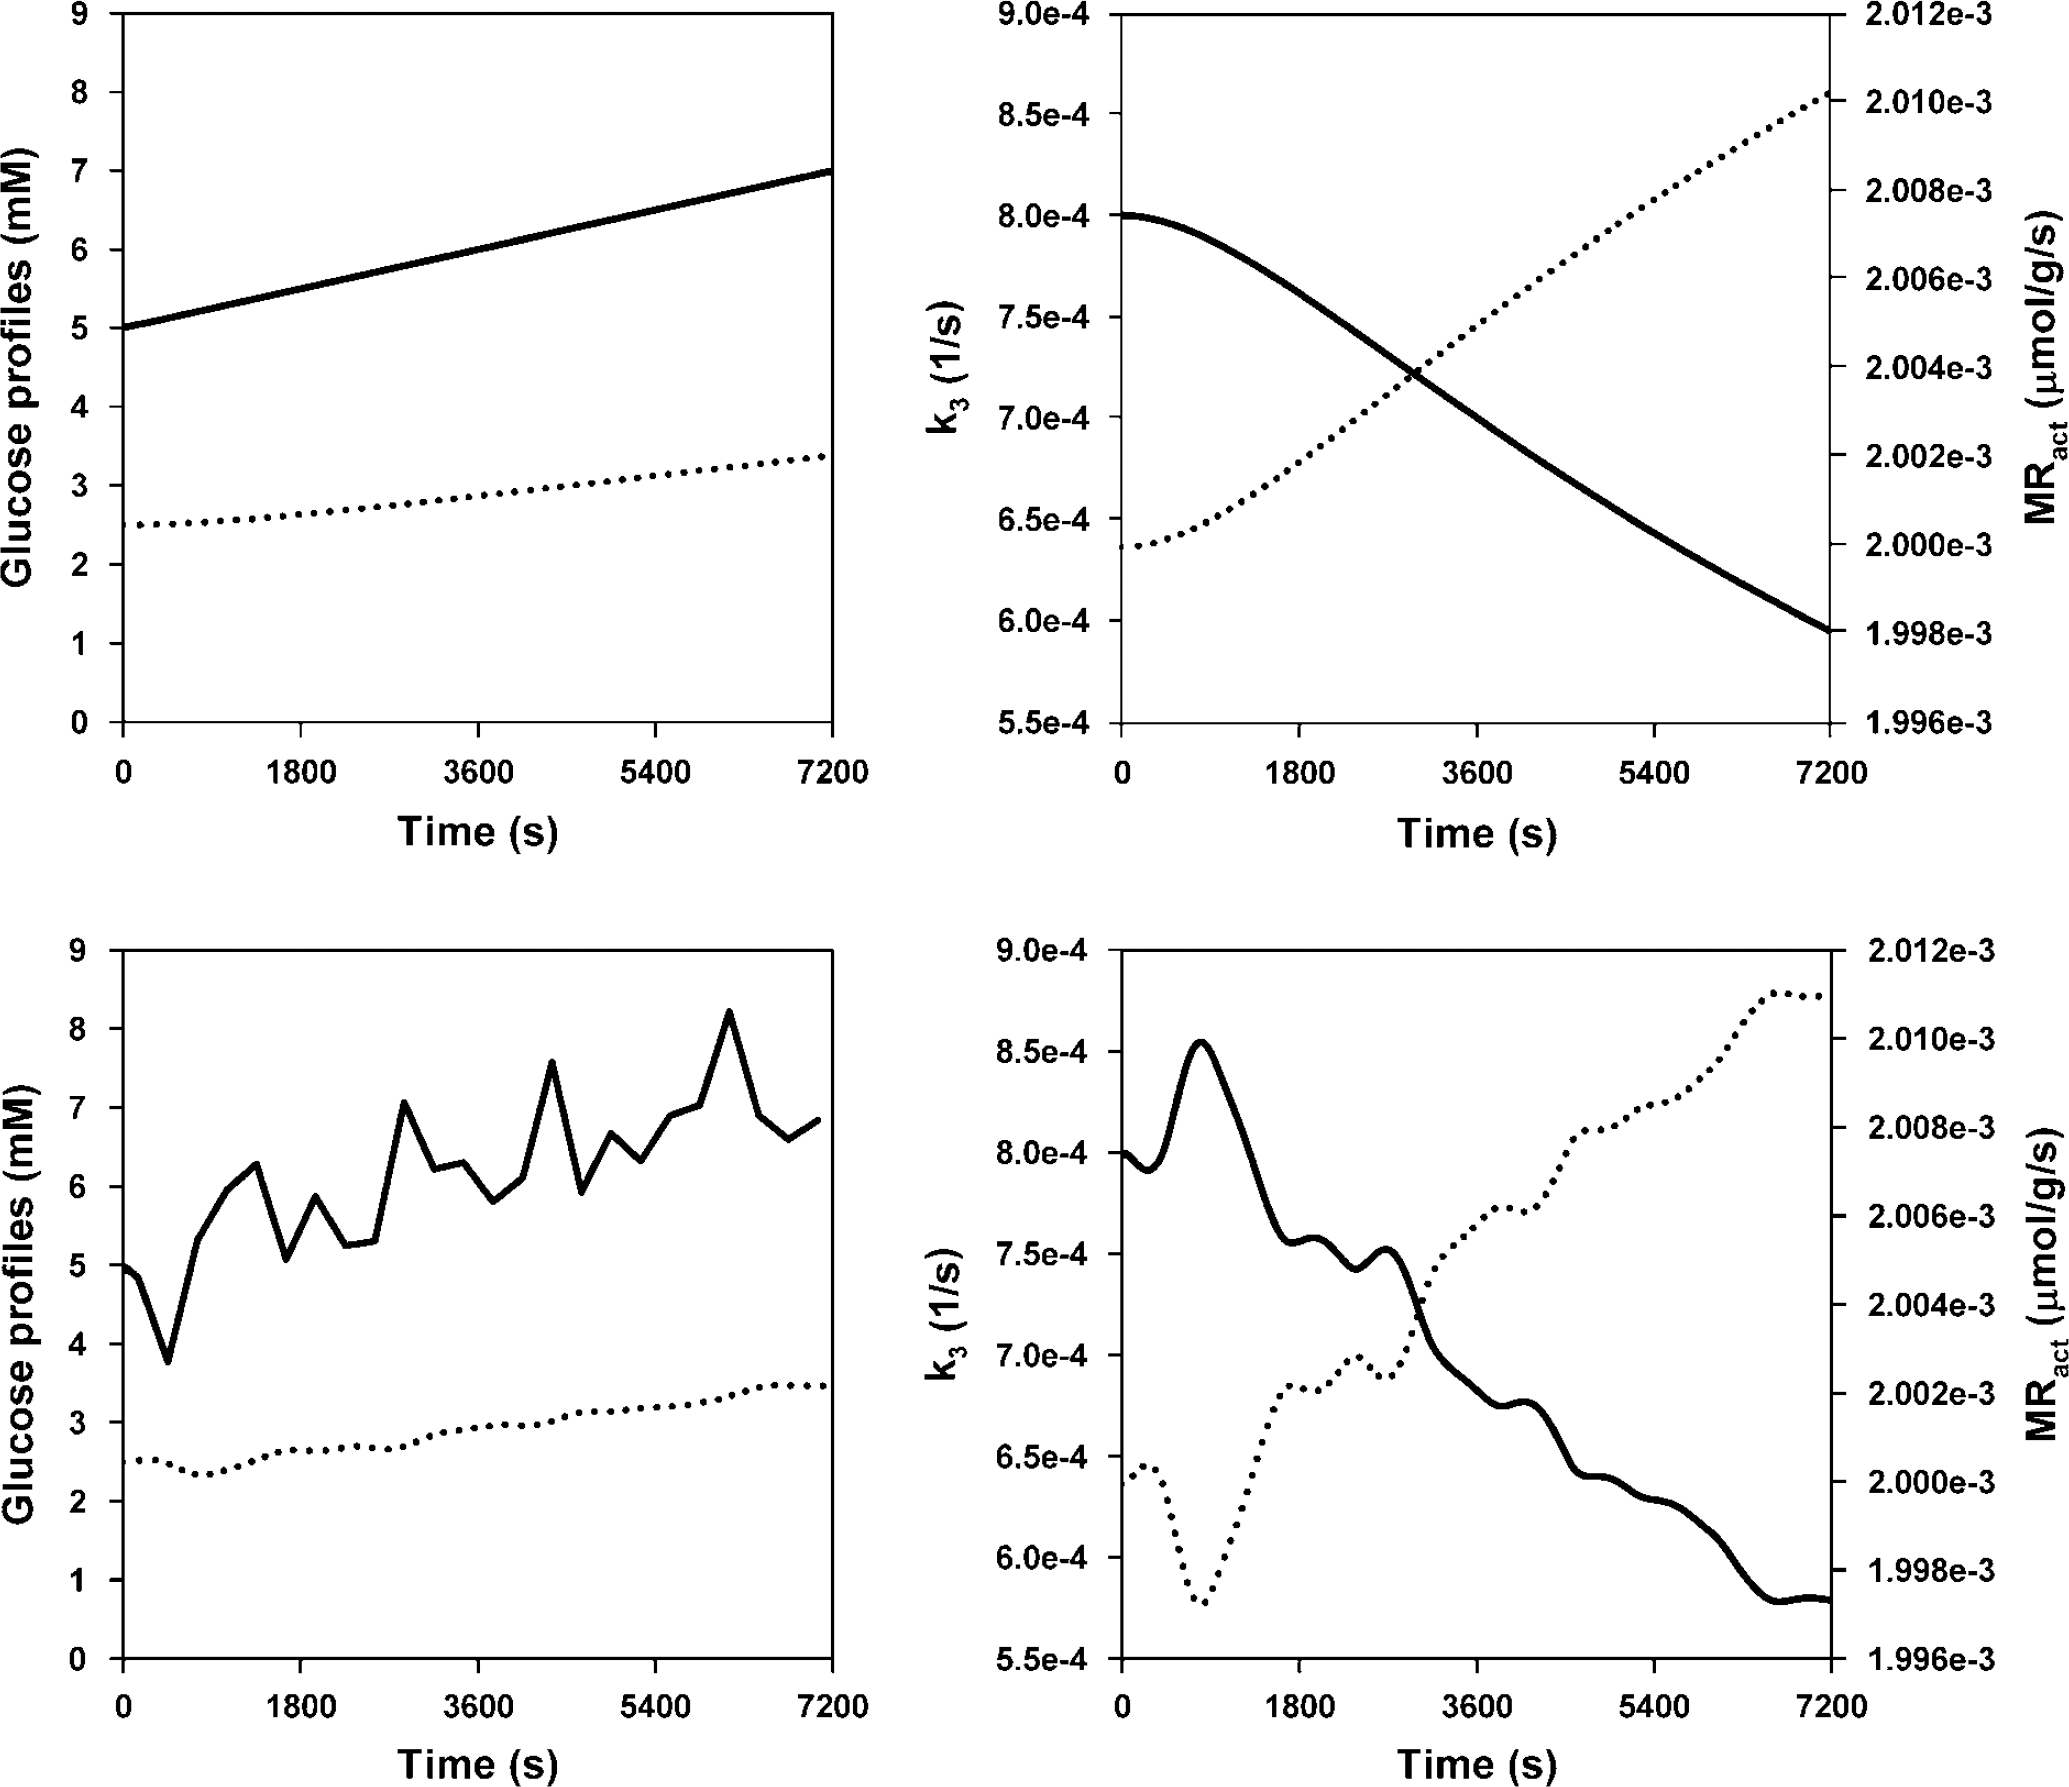
Simulation of glucose kinetics in response to a rising glucose profile. Top left: GP (solid line) and Gi (dotted line). Top right: k3 (solid line, left y-axis, s−1), and MRact (dotted line, right y-axis, μmol g−1 s−1). Bottom plots show the same parameters with a fluctuating glucose profile.
MRact rose by less than 2% over 120 mins in the most extreme cases, with the steepest rise in plasma glucose levels (GP6). The rise in MRact was mostly dependent on the Gp profile and the initial value of k3. Small initial values of k3 and large rises in Gp provoked the largest change in MRact. Substituting typical values found in our insulin study (Anthony et al, 2006) into this simulation revealed MRact increases of around 0.5% over 120 mins. As values for MRact are very stable over time, a single value equal to the mean over 120 mins is used to compare with MRss, MRunc, and MRcor.
Fluorodeoxyglucose Kinetics and Patlak
Under the steady state condition, the theoretical maximum ratio, from equation (4), of MRss to MRact is 1-b, which would occur when the intracellular FDG concentration was in equilibrium with plasma FDG. Simulated uptake used b = 0.05, so the theoretical maximum of MRss/MRact under steady state conditions was 0.95.
Steady state simulations showed MRss/MRact ratio depended on values of k2 and k3. The value of tstart also affected this ratio. The higher values of k2 and k3 gave ratios closer to 0.95 as the time taken for Fi and Fp (equation 4) to equilibrate, t‘, is lower under these circumstances (see Figure 4, top panel).
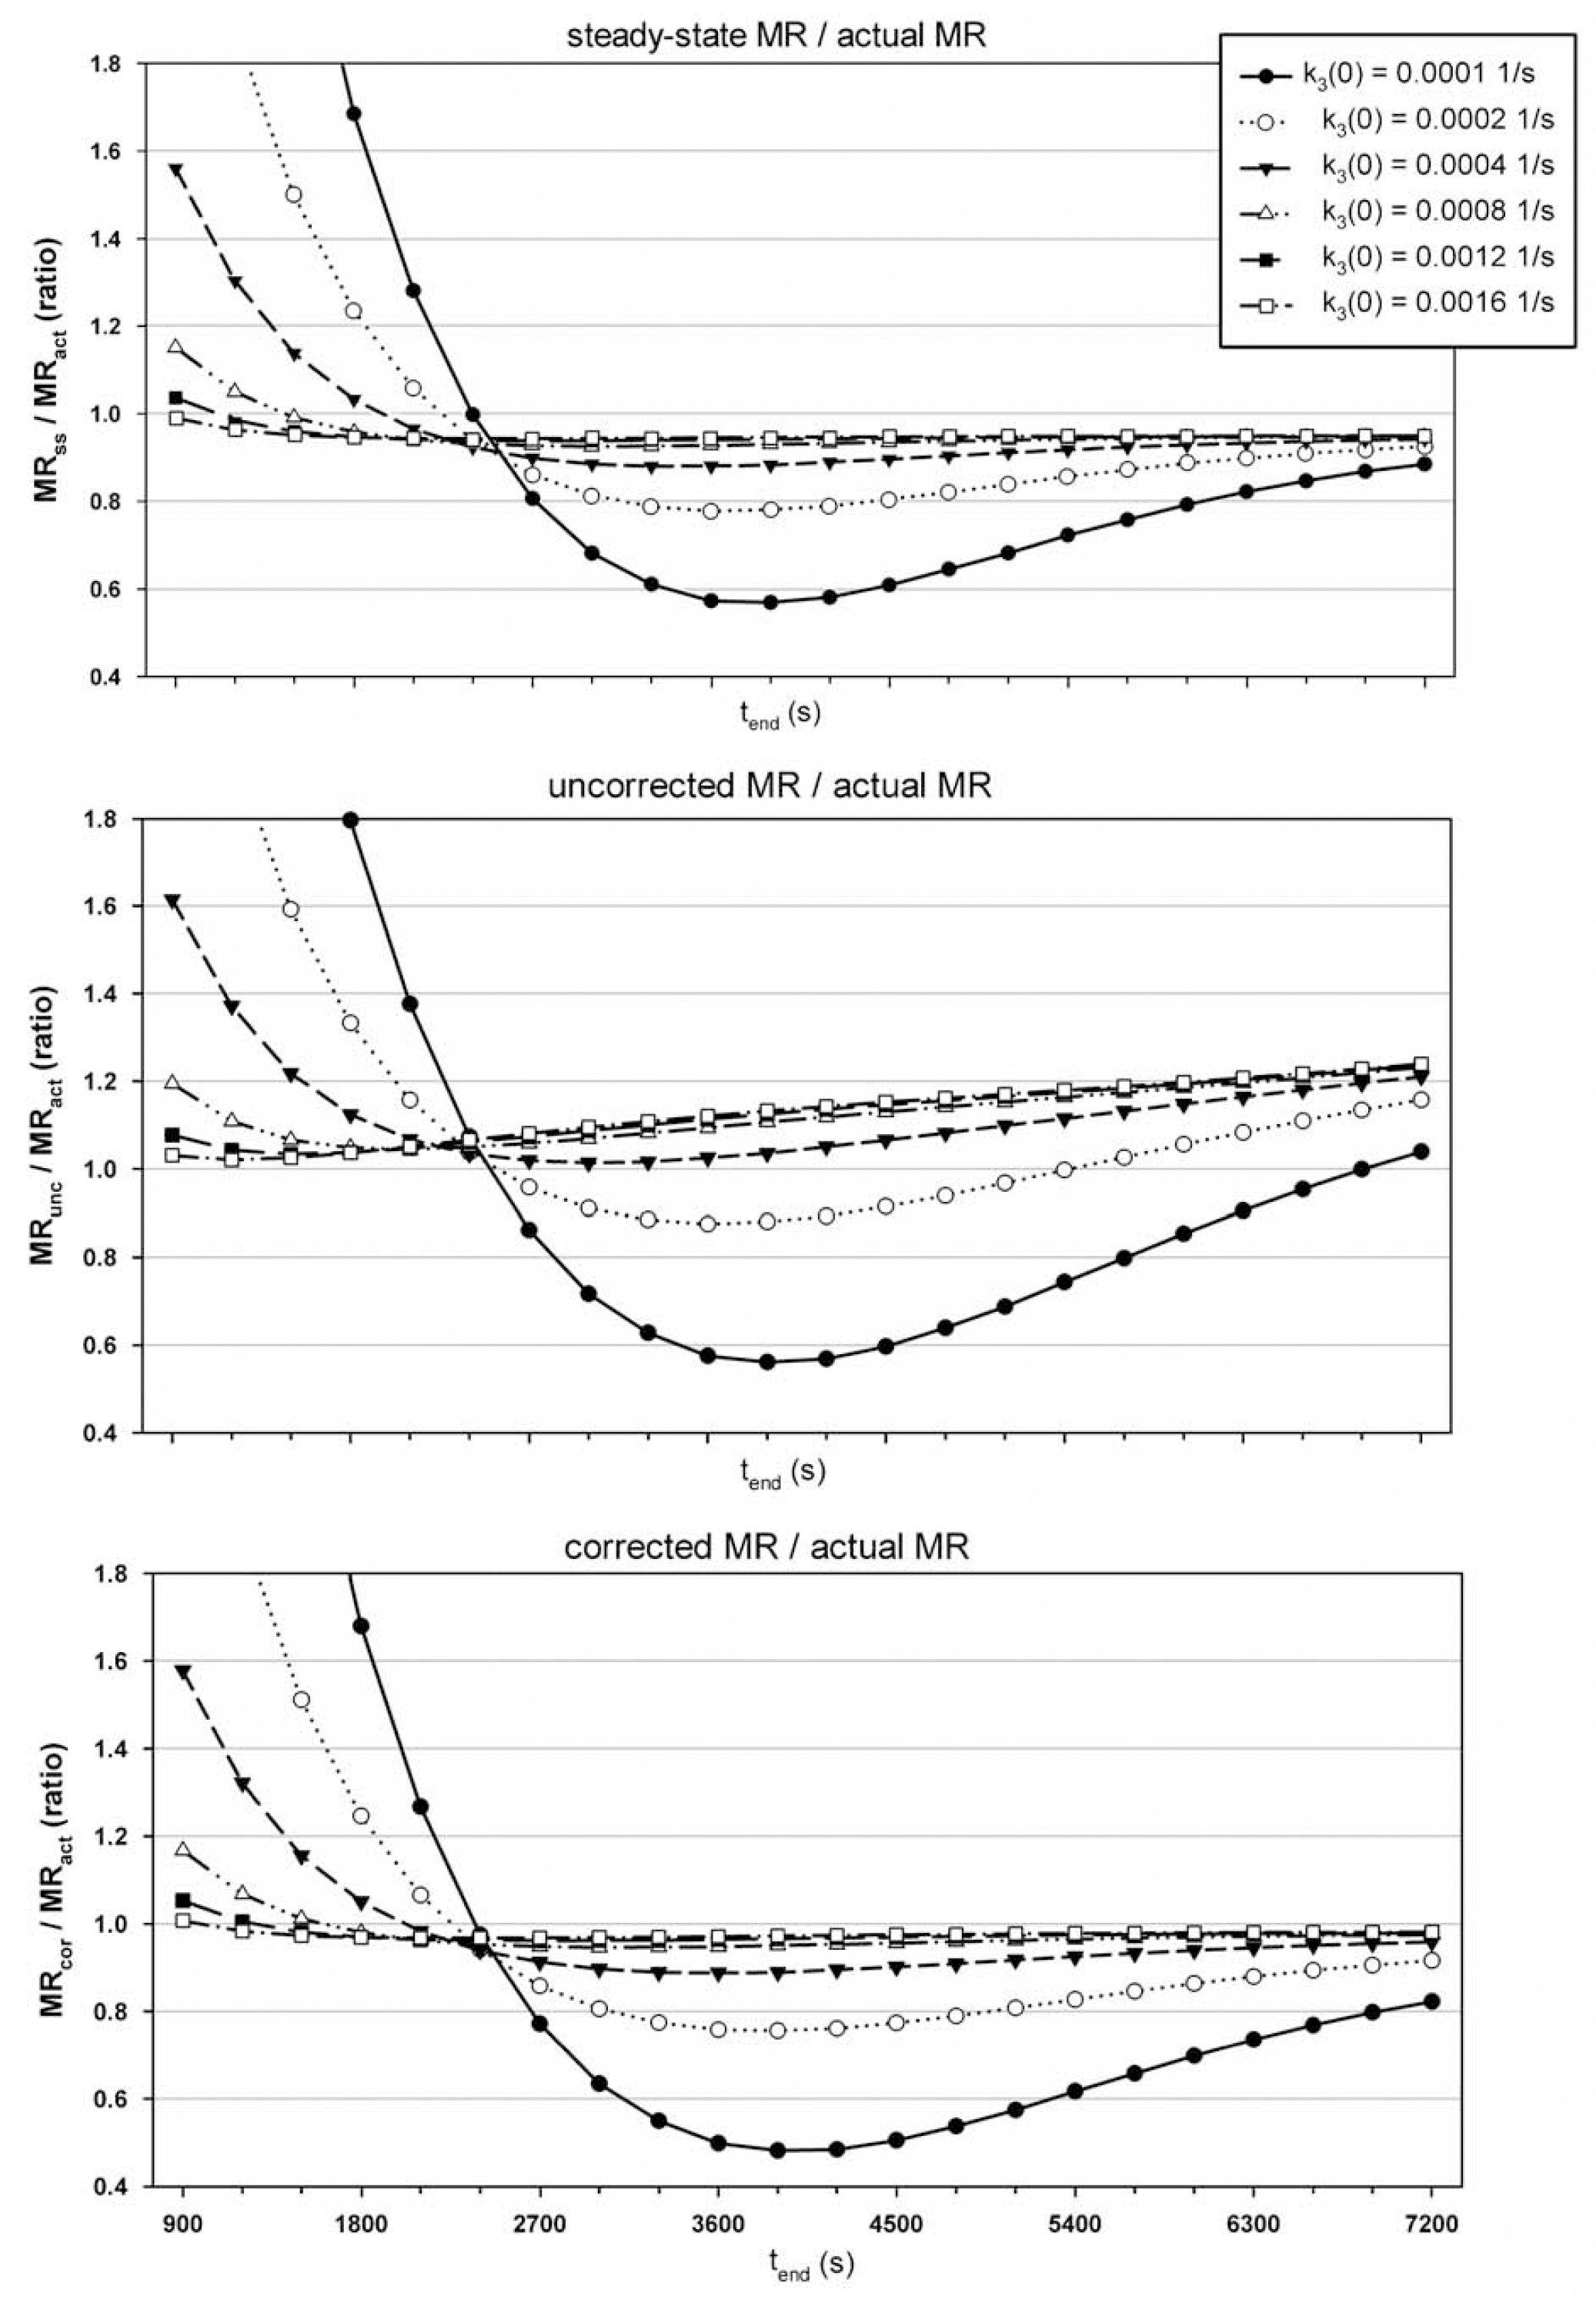
Plots showing ratio of Patlak calculated MR to simulated actual MR (y-axis) against tend (x-axis), where tend - tstart = 300s. For all graphs K1 = 0.001 ml g−1 s−1, k2 = 0.0012 s−1, b = 0.05 and the different line series represent results using six different initial values of k3 (see legend in top graph). Top graph shows results with a euglycemic glucose profile (GPl), where the y-axis is MRss/MRact; middle graph shows results with rising glucose profile, GP3, where the y-axis is MRunc/MRact; bottom graph shows results with rising glucose profile, GP3, where the y-axis is MRcor/MRact.
Simulations with linearly increasing Gp revealed the effect of the correction. Figure 4, middle panel, shows MRunc/MRact highly dependent on tend, whereas MRcor/MRact (Figure 4, bottom panel) is much more stable for all except very low initial values (t = 0) of k3 or tend and then not much different to the dependence to either of these parameters under steady state conditions (i.e., compared with Figure 4, top panel).
Figure 5 shows the effect of the correction on rising glucose profiles for parameters in the range of a typical FDG scan protocol (K1(t = 0) = 0.001 ml g−1 s−1 k2 (t=0) = 0.0012 s−1, b = 0.05, tstart = 30 mins and tend = 60 mins). Across the range of k3 (t = 0), MRunc/MRact values show a wide spread of values between GP1 and GP6. The correction brings these values closer to those from GP1. For example, with an initial value of k3 = 0.0008 s−1 with GP3, MRunc/MRss = 1.149 and MRcor/MRss = 1.023.
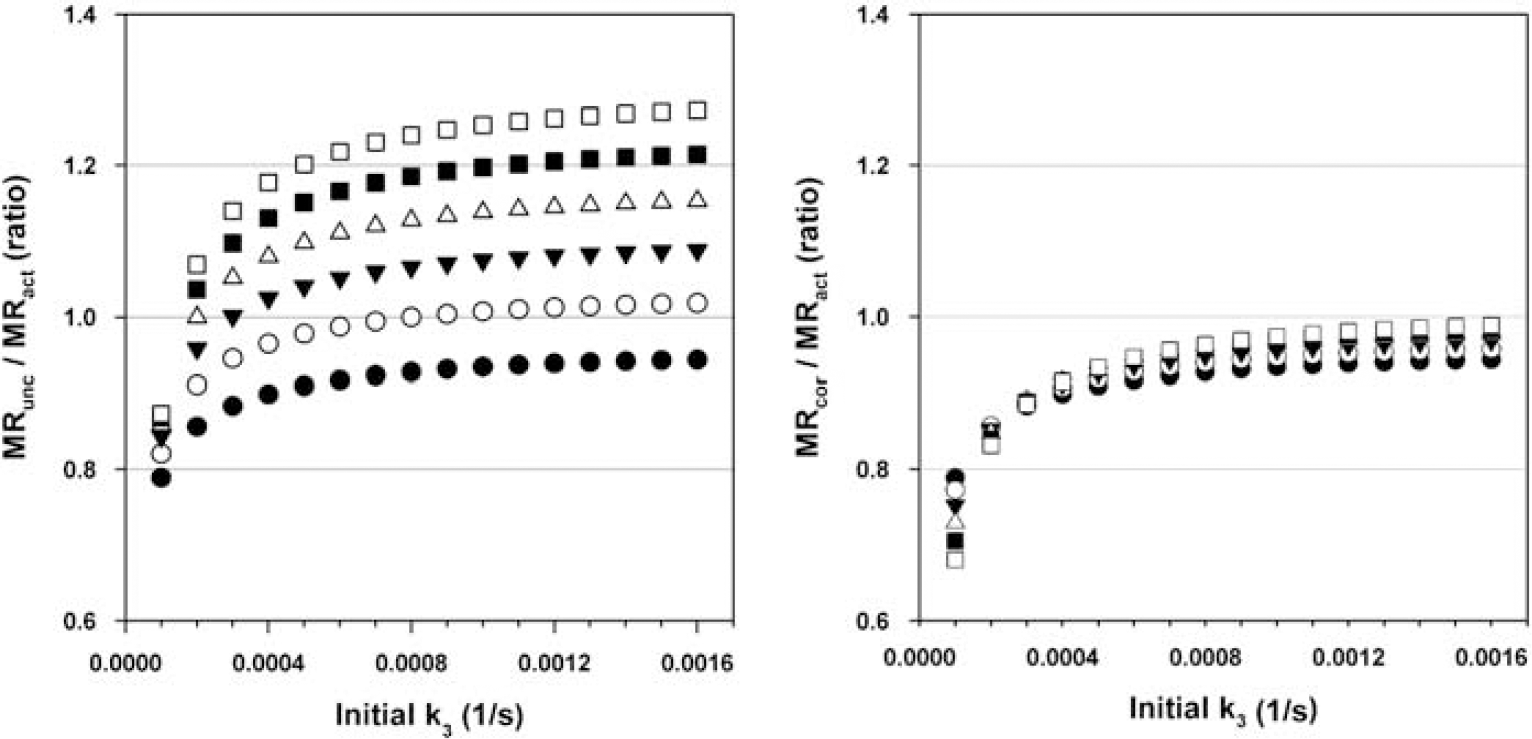
Plots showing ratio of Patlak calculated MR to simulated actual MR (y-axis) against initial values of k3 (x-axis, s−1), where K1 = 0.001 ml g−1 s−1, k2 = 0.0012 s−1, and b = 0.05. Left plot shows MRunc/MRact, and the right plot shows MRcor/MRact. The different line series show results from different glucose profiles (filled black circles represent results from GPl, and white squares represent results using GP6). Patlak slope is calculated between tstart = 1,800 and tend = 3,600s.
Kinetic Constants
For rising glucose profiles, MRcor/MRact changed with respect to K t and K m ; however, the effect of the correction was virtually constant within each glucose profile. For example, the ratio MRcor/MRunc was 0.775 (3 d.p.) for all values of K t and Km with GP6 (the most extreme case of rising plasma glucose) with a difference of 0.00022 between the maximum and minimum.
For varying TC and PC, across the range of K1-3, the MRcor/MRunc ratio for GP6 had negligible variance (minimum, 0.7769; maximum, 0.7784).
Fluctuating Gp and Fluorodeoxyglucose Noise
The MRcor/MRunc ratios for linearly rising glucose for these parameters were 1.0 (exactly), 0.941, 0.890, 0.847, 0.810, and 0.777 for GP1-6, respectively.
Fluctuating glucose profiles also had negligible effect on the accuracy of the correction factor. For profiles based on GP1, the mean ± s.d. of the ratio MRcor/MRunc was 1.000 ± 0.008; GP2, 0.940 ± 0.008; GP3, 0.890 ± 0.007; GP4, 0.848 ± 0.006; GP5, 0.809 ± 0.006; and GP6, 0.778 ± 0.005. That is, all estimated means are comparable with the values calculated without these fluctuations, with s.d. < 1%.
Adding noise to the simulated FDG uptake also had negligible effect on the MRcor/MRunc ratio. In all cases MRcor < MRunc. For a VOI of 1 voxel the mean ± s.d. of the ratio MRcor/MRunc for GP2 was 0.940 ± 0.001; GP3, 0.891 ± 0.002; GP4, 0.847 ± 0.002; GP5, 0.810 ± 0.003; and GP6, 0.777 ± 0.003. For a VOI of 100 voxels: GP2, 0.940 ± 0.0004; GP3, 0.891 ± 0.0008; GP4, 0.847 ± 0.0010; GP5, 0.810 ± 0.0014; and GP6, 0.777 ± 0.0015. That is, all estimated means are comparable with the values calculated without PET noise. Table 2 shows similar data but of the ratios of MRcor or MRunc to the steady state Patlak calculation with the same parameters but no noise (equal to 0.927 x MRact). The differences in the standard deviations indicate that for large VOIs, the correction is important but might not be so important for smaller VOIs.
Discussion
FDG uptake in brain was simulated during nonsteady state conditions to investigate the validity of a proposed correction to the calculated MRglc using the Patlak method. Rising arterial glucose concentrations were simulated from normal to hyperglycemic levels (5 mmol/1 and higher).
In all cases, the correction method improved on the standard Patlak method. It is important to establish the meaning of ‘improve’ in this context. The Patlak method is used in FDG-PET studies to provide a simplified calculation of MRglc. However, the assumptions on which this method is based mean that incomplete equilibration of FDG concentration between plasma and tissue compartments, poorly defined values for the ratios of transfer rates between FDG and glucose and the assumption of negligible blood volume in the region of interest can result in deviations of the Patlak calculations from the actual metabolic rate, even under steady state conditions. Nevertheless, it is of interest to note that, in conditions where plasma glucose levels are changing but metabolic rate changes are negligible, how well the correction to the Patlak method recreates values that would be obtained under euglycemic conditions using the standard method. Where values of MRcor are closer to MRss than MRunc, then this is considered an improvement.
MRcor and MRunc less accurately matched MRact in cases where initial values of k2 and/or k3 were small compared with K1, as FDG equilibrium between plasma and tissue would take longer to achieve. These values also affected the impact of tend on the Patlak calculations in all cases. For small initial values of k2 and/or k3, the accuracy of the Patlak calculation in reproducing actual metabolic rates was greatly affected by the tend chosen. This effect was greater at small values of tend. As can be seen in Figure 4, calculations at small tend overestimate MRact and calculation made at later times under estimated it. The early values of tend for which the Patlak calculations equalled MRact differed depending on the values of k2 and k3, so it would not be appropriate to use an early tend. It should be noted that the small initial values of k2 and k3 discussed here do not produce the characteristic FDG uptake curves observed in typical PET scans.
The values of parameters such as Kt, Km, TC, and PC have been taken from earlier studies or assumed. The quoted values are either uncertain or cover a wide range so a single simulation may not accurately reflect this. However, a wide range of values used in the simulation did not change the effect of the Patlak correction significantly.
In studies where the Patlak method for determining MRglc is used, the LC is usually assumed to be constant or 1.0. We have addressed here a correction for changing plasma glucose levels that we have shown to be true if the assumption of constant LC holds. In practice, LC will change during the course of the study if Gp diverges from euglycemia during this period. In this case, inaccuracies in Patlak calculation of MRglc will be due to both changes in Gp directly and through changes in the LC. In this work, we only deal with the first of these effects.
There is no simple relationship between plasma glucose and LC and, in general, the value of LC depends on the values of the individual rate constants (K1, k2, k3), and these are not available when data are acquired with a view to Patlak analysis. Changes in Ki and LC due to increasing plasma glucose both result in an underestimation of MRglc if constant Gp and LC are assumed in the analysis. Correcting for Gp but neglecting LC changes will, therefore, still lead to an improved estimate of MRglc. A detailed evaluation of the residual error resulting from neglecting changes in LC warrants a more detailed analysis but is beyond the scope of this paper.
The model used to simulate glucose and FDG kinetics relied on the assumption that the enzyme, dephosphorylase, is present in negligible amounts. If this assumption was invalid then another parameter (usually denoted as k4), which would allow transfer back from compartments Cm to Ci (see Figure 1) would need to be included to represent the dephosphorylation of glucose-6-phosphate. However, this would complicate the model, as the assumption allows Cm to be ignored. Any model including k4 would need a more sophisticated model of glucose kinetics including further metabolism of glucose from phosphorylation. Glucose-6-dephosphoryalse is reported to be present in small amounts in the human brain and studies of FDG kinetics have shown that including k4 significantly improves the fit of the model to the data (e.g., Hasselbalch et al, 1999, Schmidt et al, 1992). These studies have shown the value of k4 to be approximately 1/10th of k3, yielding a 30% difference in calculated metabolic rate. A more sophisticated glucose model would allow a more rigorous simulation of glucose metabolic rate and FDG kinetics under changing plasma glucose. The Patlak method assumes that k4 is negligible and so the presence of dephosphorylase would mean the Patlak method would further underestimate glucose metabolism; however, this would apply to both the uncorrected Patlak and corrected Patlak calculations. This study has shown that although physiological parameters defining the model may be poorly defined (e.g., Kt, TC, etc), the ratio of MRcor/MRunc is insensitive to these values.
The validity of this method is dependent on whether the change in the actual MRglc due to a rise in plasma glucose is negligible. This method assumes that the change in FDG uptake is due solely to the effect of competition for glucose transporters and hexokinase. Although this assumption was not implicit in the model, the low published values of Km suggest that phosphorylation of glucose is a highly saturated process. Even with a three-fold increase in plasma glucose (GP6), our model showed a very small increase in MRact over the 2-h period (~2%). It is unclear whether this assumption is valid for such high plasma glucose changes in the real world but for more moderate rises it may be more so.
In conclusion, the Patlak method has been shown to yield incorrect results with plasma glucose levels rising from normoglycemia to hyperglycemia during FDG-PET acquisition. Assuming that glucose metabolic rate does not change with moderate changes in plasma glucose levels, a corrected Patlak equation may be used to calculate more accurate rates. The method described above is straightforward to implement in practice. If there is a reason to suspect that plasma glucose levels are likely to change throughout an acquisition, then in addition to the standard protocol, plasma glucose levels are required throughout the scan (typically these would be measured at 5-min intervals). These values are then substituted into equations 7 and 8 to calculate the corrected glucose metabolic rate.
Footnotes
Acknowledgements
This work was funded in part by a project grant from Diabetes UK.
The authors declare no conflict of interest.