
Abstract
Abstract
Hyperpolarized-13C magnetic resonance imaging (HP-13C MRI) was used to image changes in 13C-lactate signal during a visual stimulus condition in comparison to an eyes-closed control condition. Whole-brain 13C-pyruvate, 13C-lactate and 13C-bicarbonate production was imaged in healthy volunteers (N = 6, ages 24–33) for the two conditions using two separate hyperpolarized 13C-pyruvate injections. BOLD-fMRI scans were used to delineate regions of functional activation. 13C-metabolite signal was normalized by 13C-metabolite signal from the brainstem and the percentage change in 13C-metabolite signal conditions was calculated. A one-way Wilcoxon signed-rank test showed a significant increase in 13C-lactate in regions of activation when compared to the remainder of the brain (
Introduction
Hyperpolarized-13C magnetic resonance imaging (HP-13C MRI) is a minimally invasive technique that enables imaging of exogenously administered 13C-labelled metabolites and their downstream conversion products in vivo. The most commonly imaged metabolites are 13C-pyruvate and its downstream products 13C-lactate and 13C-bicarbonate. The production of 13C-lactate signal indicates the reduction of 13C-pyruvate to 13C-lactate in the cytosol, wheras 13C-bicarbonate production indicates the decarboxylation of 13C-pyruvate into acetyl-CoA on the mitochondrial membrane. HP-13C MRI has previously been used to image 13C-metabolite production in the human brain in healthy and disease states.1 –6
Previous results showed concordant regional patterns of 13C-pyruvate, 13C-lactate and 13C-bicarbonate across individuals suggesting a highly regulated process leading to the pattern. 4 At the same time, increased lactate concentration in the brain has been measured using proton spectroscopy and a visual stimulus.7 –9 However, the effect of a visual stimulus, and the concomitant increase in lactate pool size, on the 13C-metabolite pattern in the brain has not been documented previously. We hypothesized that the 13C-metabolite distribution detected with HP-13C MRI would be modulated in response to task activation.
In this study whole-brain HP-13C MRI was used to assess regional changes in 13C-lactate signal during a visual task stimulus. Blood-oxygen level dependent fMRI (BOLD-fMRI) images were acquired to delineate regions of BOLD activation in each participant. We hypothesized that the regions of activation defined by BOLD-fMRI would have higher 13C-lactate signal under stimulus conditions relative to control conditions.
Materials and methods
Written informed consent was obtained from six study participants (3 male, 3 female) and procedures were performed under a protocol approved by the Research Ethics Board of Sunnybrook Health Sciences Centre and by Health Canada under a Clinical Trial Application in compliance with the ICH-GCP and Declaration of Helsinki. The participants ranged in age from 24 to 33 (mean age of 26) and only those deemed cognitively healthy via the Montreal Cognitive Assessment 10 were scanned.
Several hours prior to scanning, two doses of 13C-pyruvic acid were prepared using a 1.47 g sample of [1-13C]pyruvic acid (Sigma Aldrich, St. Louis, MO) for each dose and polarized in a SPINLab polarizer system (GE Healthcare, Waukesha, WI) for a minimum of two hours. Immediately prior to scanning, a 20 gauge intravenous catheter was placed into the forearm of each participant before positioning them in the scanner bore.
Images were acquired using a GE MR750 3.0 T MRI scanner (GE Healthcare, Waukesha, WI) with a 13C birdcage head coil built in-house for HP-13C imaging. Volumetric images of 13C-lactate, 13C-bicarbonate, and 13C-pyruvate were acquired using a 3D echo-planar imaging (EPI) sequence.
11
This sequence, applied extensively in previous brain imaging studies,4
–6,12 uses frequency-selective RF pulses to separately excite individual metabolites.13,14 This “metabolite specific” imaging approach has the advantage that each RF excitation results in signal from a single metabolite (e.g. 13C-lactate), which can be imaged using conventional fast imaging methods such as the echo-planar encoding used here. The sequence of events during the imaging process are: first, a whole-brain 3D image of 13C-lactate is acquired with 15 mm isotropic spatial resolution in 1.2 seconds. Then, the RF pulse excitation frequency is changed to the frequency of 13C-bicarbonate and a 3D image of
Each participant underwent two HP-13C scans, consisting of a task (13C-task) and control (13C-control) scan. The visual task consisted of an 8 Hz flashing checkerboard stimulus initiated 5 s before the 13C task scan. For the 13C-control scan, the participant was asked to close their eyes (and a blank screen with a plus sign was projected onto the screen). To control for any effect of scan ordering, three of the participants had the control scan first, whereas the other three had the control scan second. All stimuli and visual prompts were delivered via a projector and projector screen setup. The projector was placed inside the MRI console room facing into the MRI room, where a projector screen was located. Prior to imaging, the projector was lined up with the projector screen and we verified with the participant in the scanner that they were able to view a test image. There was a half-hour wait period between 13C-task and 13C-control scans.
During the half-hour wait period, the 13C head coil was interchanged with an 8-channel 1H head coil (Invivo Inc, Pewaukee, WI) to perform anatomical T1-weighted and BOLD-fMRI scans. Anatomical T1-weighted images were acquired with an axial RF-spoiled gradient echo sequence (FOV
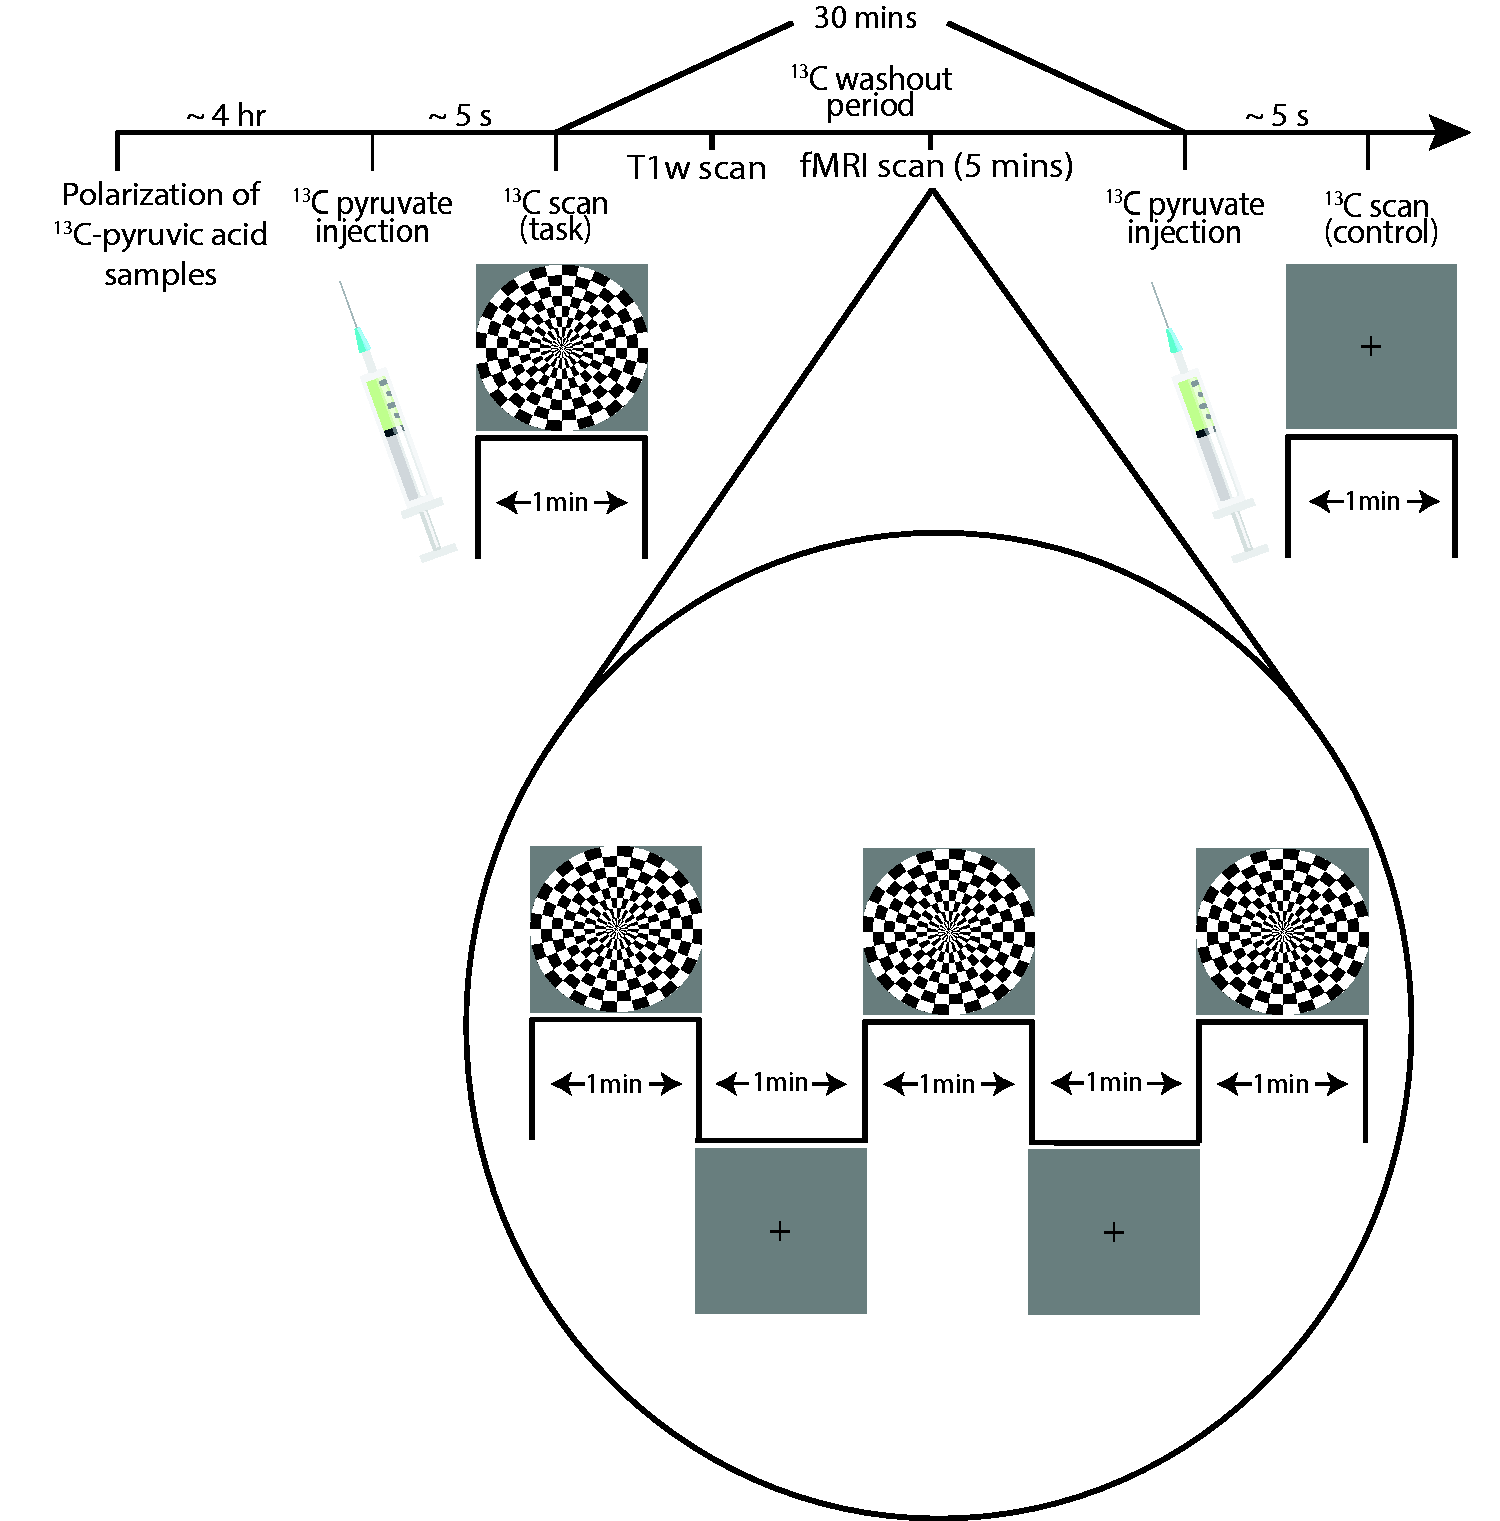
Image acquisition workflow for the visual stimulus scans. Two sets of 13C-images were acquired with a thirty minute wait period between acquisitions to allow for washout of residual 13C-metabolites. During this wait period, anatomical images and BOLD-fMRI images were acquired.
The
The T1-weighted anatomical images were parcellated into 132 brain regions according to the BrainCOLOR labelling protocol
16
using an automated workflow.
17
These parcellation maps were then used to compute regional
BOLD-fMRI pre- and post-processing was done using the Analysis of Functional Images (AFNI) toolbox,19,20 and included removal of the first two TRs of each acquisition, registration across time to mitigate motion effects, and blurring with a Gaussian function (4 mm full-width half maximum). Voxelwise linear regression coefficients were fit using the stimulus block design as an independent variable, input as a repeating boxcar function with box length one minute. T-statistics were calculated for each positive regression coefficient using an alpha of 0.001. Cluster correction was used to control for multiple comparisons, with voxels in face-to-face contact comprising each cluster. 21
The BOLD-fMRI t-statistic map was used to define an an activation volume for each participant, with the remainder of the brain (including the white matter and ventricles) defined as the non-activation volume.
Each regional 13C-metabolite signal, as well as the signal from the activation volume and non-activation volume, were normalized by the 13C-metabolite signal from the brainstem region from the particular participant (referred to as ‘brainstem normalization’ below). This was done to normalize for any global signal scaling between scans, such as those caused by differing 13C-pyruvate polarization levels, while maintaining the inter-regional signal pattern.
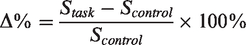
The percentage change in 13C-metabolite signal between task and control conditions was calculated as follows:
The thresholded t-statistic maps from the BOLD-fMRI scans were also used to designate parcellated brain regions as ‘activation regions’. The remaining parcellated brain regions were categorized as ‘non-activation regions’.
Finally, the strength of BOLD-fMRI activation (t-statistic) was tested for correlation with the task-induced change in
Results
BOLD-fMRI activation was consistently achieved in the visual cortex over the course of the 5 minute block design in all six participants. This confirmed that the stimulus block length was sufficient for inducing activation during the HP
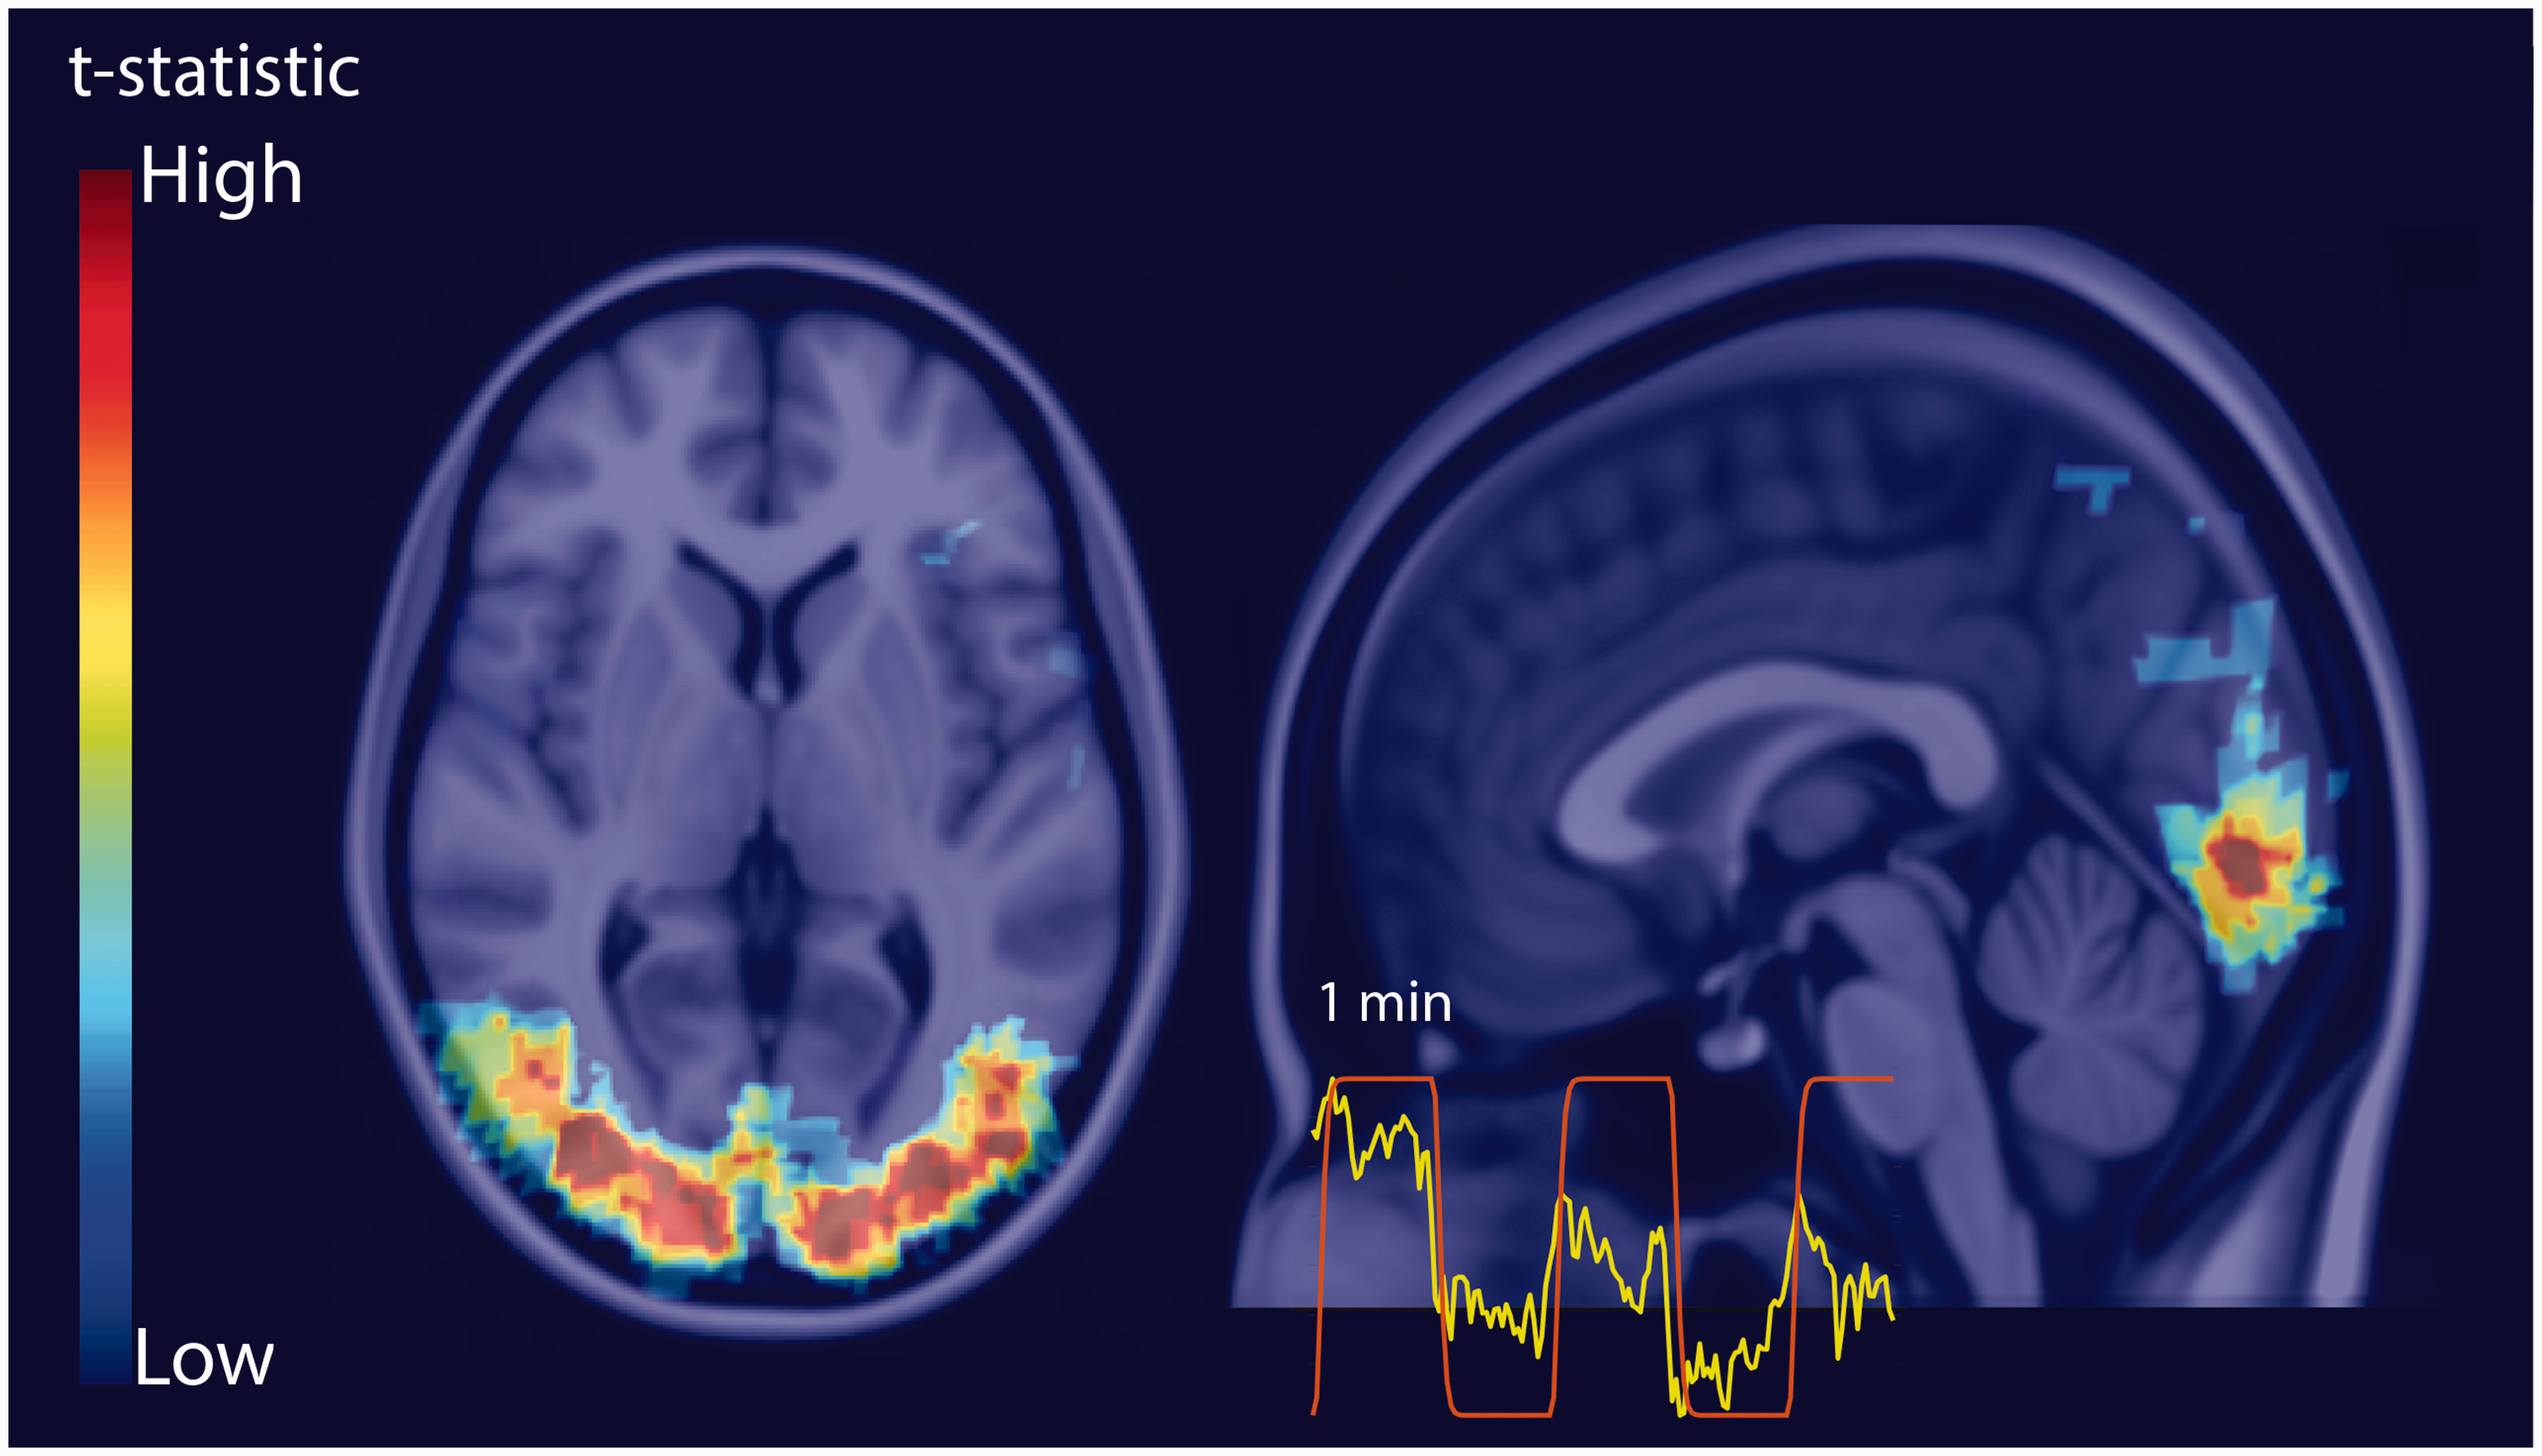
Example BOLD fMRI t-statistic map for the visual stimulus registered to the MNI152 atlas. The inset is an example time series curve from a voxel with significant activation (yellow) and the stimulus regressor used in the general linear model (red).
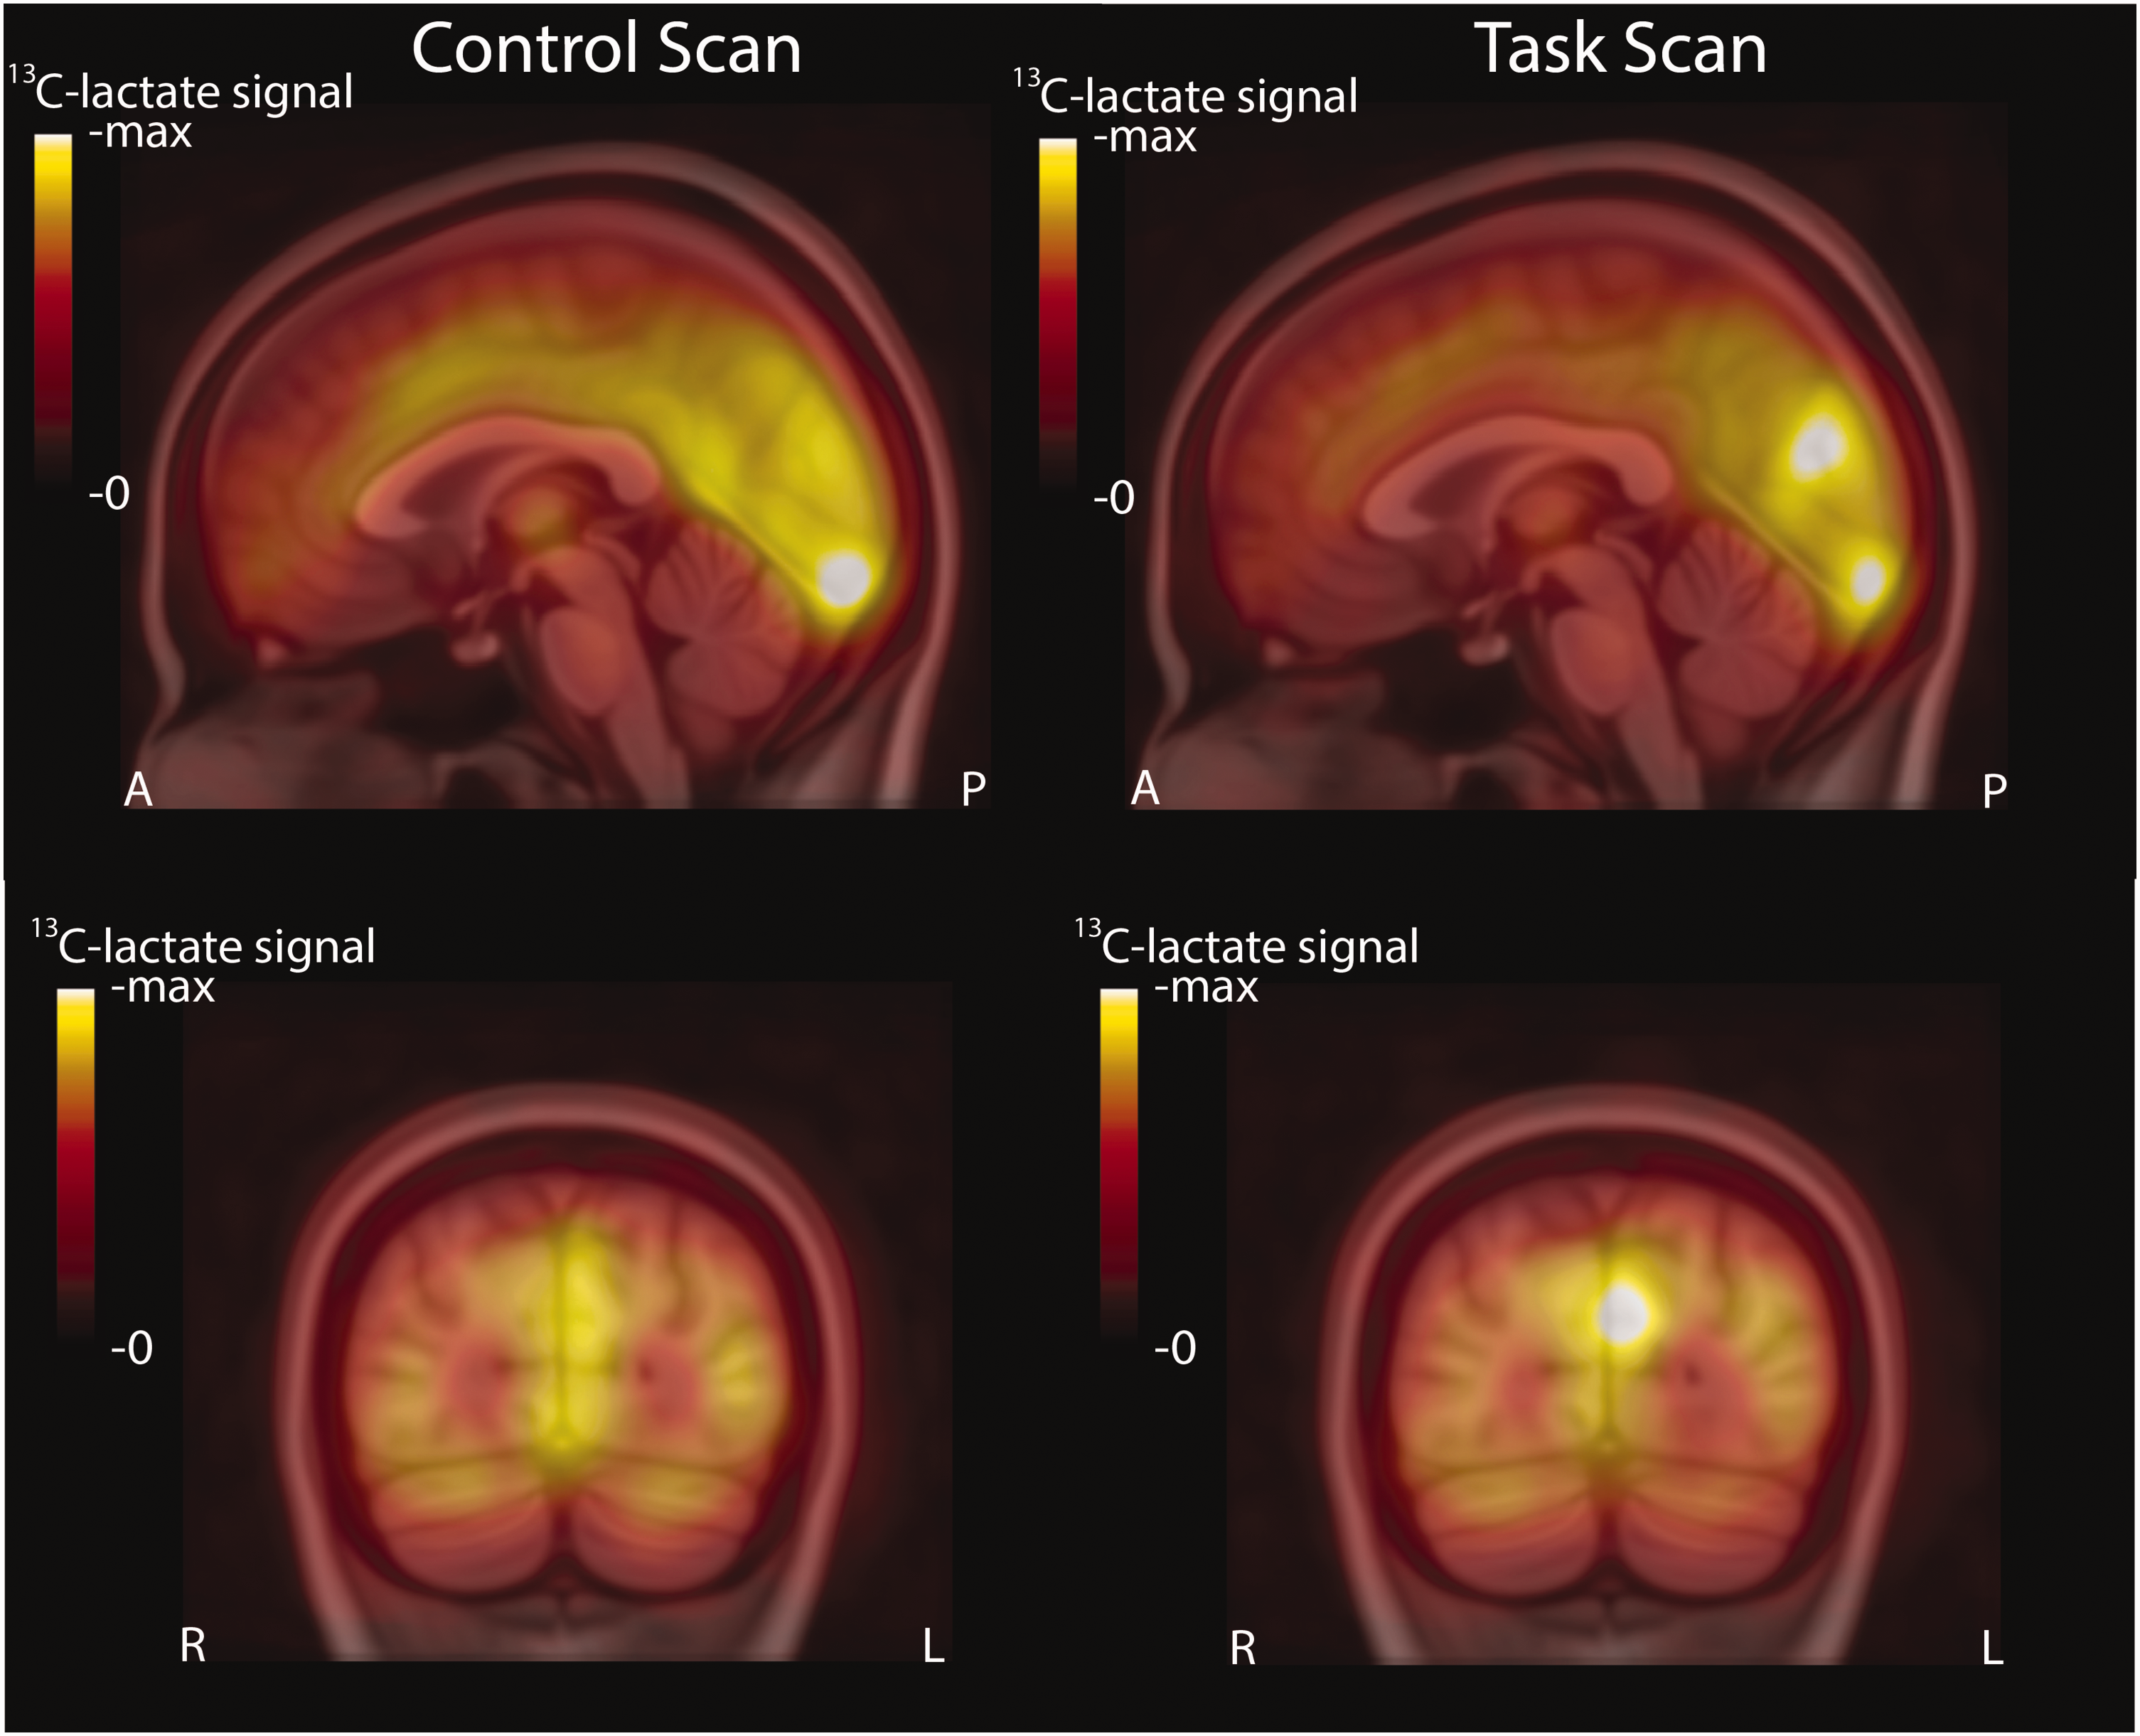
Group average 13C-lactate images overlaid on the MNI152 atlas for the control (left) and task (right) conditions. Increased 13C-lactate signal can be observed in the occipital lobe, predominantly in the left hemisphere. A sagittal slice (top) and coronal slice (bottom) are shown with the same color scale used for 13C-lactate signal. The A, P, R and L markers denote anterior, posterior, right and left.
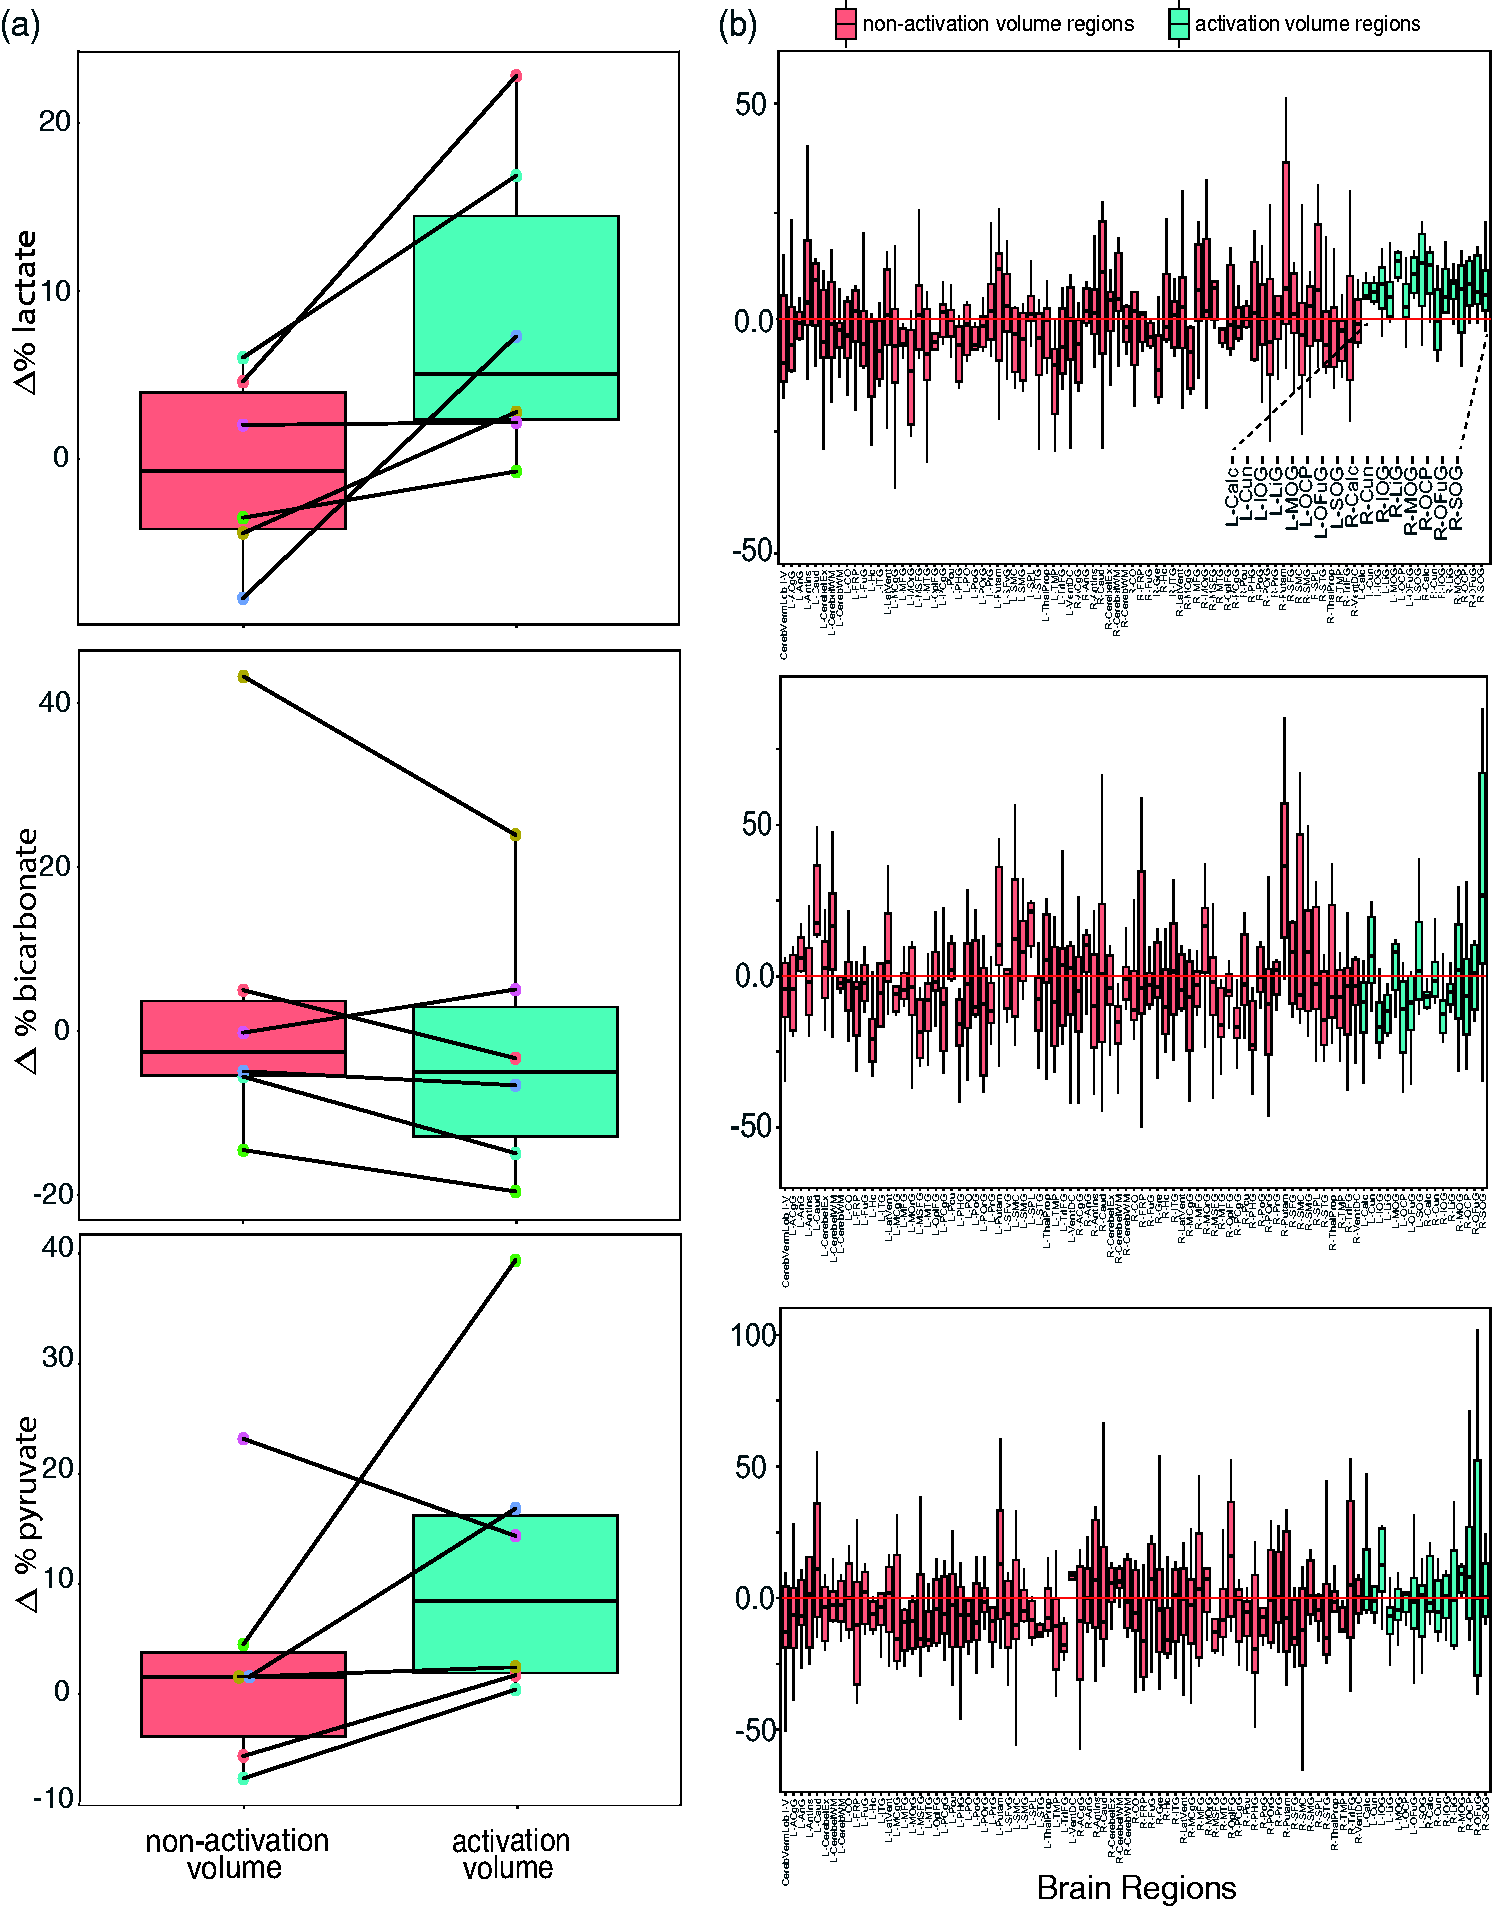
(a) The percentage change between task and control 13C-scans for the non-activated volume (left) and activated volume (right). The lines connect the data points from the same individual, the box centre line indicates the mean and whiskers at the 25th and 75th percentile and (b) the percentage change between task and control 13C-scans for each BrainCOLOR region. The BOLD-fMRI t-statistic maps were used to designate ‘activation volume regions’ and ‘non-activation volume regions’. An elevated
The one-way Wilcoxon signed-rank test showed a significant difference in
The parcellated regions within the activation volume for all six individuals were: the bilateral calcarine cortex, cuneus, inferior occipital gyrus, lingual gyrus, middle occipital gyrus, occipital pole, occipital fusiform gyrus, and superior occipital gyrus. These regions are highlighted in Figure 4(b), with the
The correlation between the degree of BOLD activation (mean t-statistic) and the percentage change in 13C-lactate within the activation volume is plotted in Figure 5. The correlation between 13C-lactate and the mean t-statistic within the activation volume was the strongest, at 0.77, though it did not reach significance (p = 0.051). All other correlations were not significant.
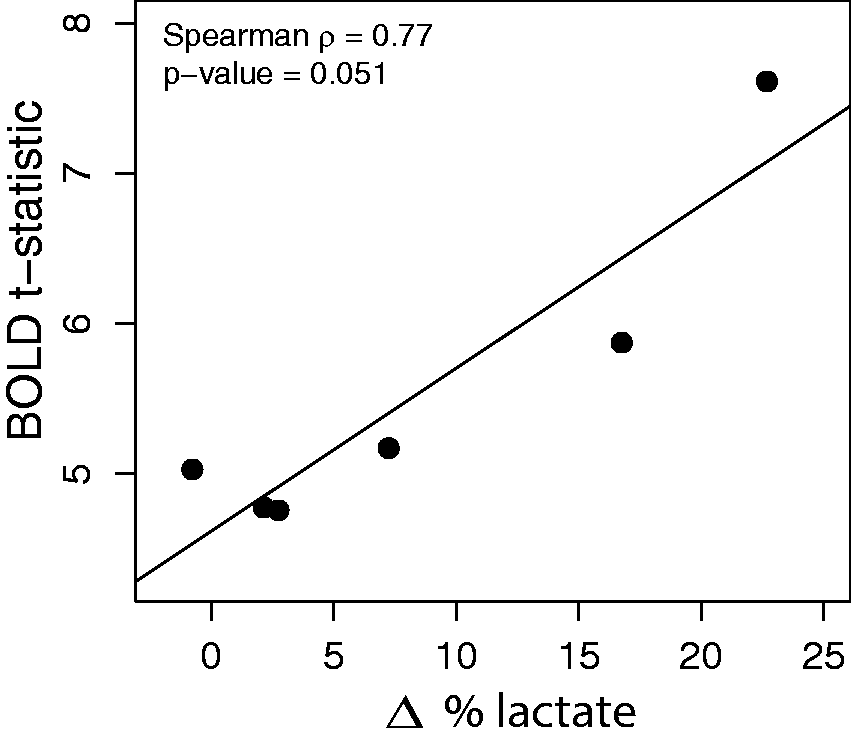
Correlation between the level of BOLD activation (t-statistic) within the activation volume and the percentage 13C-lactate signal change between the task and control conditions.
Discussion
In this study hyperpolarized
The increase in 13C-lactate signal may include 13C-lactate in the venous blood, in addition to parenchymal signal. However, there is evidence from the rodent brain that
No significant differences between task and control conditions were detected for the
Surprisingly, a task-induced increase in
Conclusions
HP
Footnotes
Funding
The author(s) disclosed receipt of the following financial support for the research, authorship, and/or publication of this article: Funding support was provided from the Canadian Cancer Society grant 707455, Canadian Institutes of Health Research grant PJT-152928 and National Institutes of Health grant R01CA237466. K.R.K. is supported by the National Institutes of Health NIH/NCI Cancer Center Support Grant P30CA008748 and the Center for Molecular Imaging andBioengineering (CMIB) at Memorial Sloan Kettering Cancer Center.
Declaration of conflicting interests
The author(s) declared the following potential conflicts of interest with respect to the research, authorship, and/or publication of this article: A.P.C. is employed by GE Healthcare, the manufacturer of the SPINLab polarizer. K.R.K. is co-founder of Atish Technologies and serves on the Scientific Advisory Boards of NVision Imaging Technologies and Imaginostics. He holds patents related to imaging and leveraging cellular metabolism.
Authors’ contributions
H.S. and C.H.C. are co-senior authors; B.U., N.I.C.C., F.T., and C.H.C designed the study protocol; N.M. and W.J.P. prepared pharmacy samples for injection; B.U., N.I.C.C, N.D.B, R.E., and H.S. acquired data; B.U. analyzed data; B.U., A.P., S.J.G., C.H., K.R.K., H.S., and C.H.C. interpreted results; B.U., N.I.C.C., and C.H.C. prepared figures and manuscript; B.U., N.I.C.C., S.J.G, K.R.K., A.P., H.S., and C.H.C. edited and revised manuscript; all co-authors approved final version of manuscript.