
Abstract
Adaptive response of human brain to stress plays a key role in maintaining health. Knowledge about how stress affects neurometabolism may help to understand adaptive stress responses, and distinguish maladaptation in neuropsychiatric disorders. In this study, neurometabolic responses to fasting stress in healthy women were investigated. Fifteen healthy females were examined for mood and cognition and using whole-brain MR spectroscopic imaging before and immediately after a 72-h fasting. Results were compared to 15 age-matched healthy females who did not taken part in fasting (non-fasting). Maps of the distributions in the brain of N-acetylaspartate (NAA), total choline (tCho), total creatine (tCr), glutamine/glutamate (Glx), and myo-Inositol (mI) were derived. Metabolite concentrations of each brain lobe and cerebellum measured before fasting were compared to those of post-fasting and non-fasting by repeated-measures ANOVA. After fasting, mood scores significantly increased. Glx decreased in all nine brain regions, tCho in eight, NAA in four and tCr in one, with Glx having the greatest change and the frontal lobes being the most affected brain region. In conclusion, fasting directly influences neurometabolism, and the adaptive brain response to maintain energy homeostasis under food deprivation in healthy women is associated with metabolite-selective and region-dependent changes of metabolite contents.
Introduction
The brain is the central organ for adaptation to different stressors and is responsible for altering systemic functions through neuroendocrine, autonomic, immune and metabolic systems. The adaptive stress response mechanisms can be defined on different methodological levels, including determination of neurometabolite contents, assessment of stress hormones, and analysis of epigenetic mechanisms. Knowledge of the neurometabolic alterations underlying the brain’s response to stress in healthy humans may help to understand the mechanisms of adaptive stress responses, and provide reference for distinguish maladaptive responses.
Different models have been used to explore how the human brain responds to acute stress. Psychological models, such as the Trier Social Stress Test, were used to induce acute stress; however, the inter-individual response is highly variable and depends on factors such as motivational factors, personality traits and underlying emotional regulation capabilities. 1 Exercise can be used to induce stress; however, factors such as physical fitness and motivational factors determine individually the amount of stress associated with exercise training. 2 The glucose clamp technique was used to examine the differential response of brain and muscle to hyper- and hypoglycemic stress. An increase of brain ATP was demonstrated, suggesting that the brain can activate specific mechanisms to modulate energy status during variations in glucose supply in contrast to peripheral organs. 3 However, this technique has several side effects and limitations such as hypoglycemia-induced arrhythmia, making the method less feasible for the use in healthy volunteers and patients. 4
Fasting induces psychological and metabolic stress by decreasing the amount of energy available to the organism. Several reports have shown that fasting is associated with fluctuations in mood and cognition, in particular depressed mood and difficulties in concentration.5,6 On a metabolic level, fasting is associated with weight loss, and an increase in hypothalamus–pituitary–adrenal system activity with subsequent hypercortisolism.7,8 Some of the above-mentioned alterations have also been observed in psychiatric disorders, such as major depressive disorder (MDD). MDD is characterized by a depressed mood that is typically accompanied by weight loss and alterations in cognition and appetite.9,10 On an endocrine level, upregulation of the hypothalamus–pituitary–adrenal axis with subsequent hypercortisolism has frequently been observed. 11 Interestingly, neurometabolic alterations have also been reported in MDD. These findings comprise a decrease in central glucose utilization, 12 being more prominent in patients with severe depression and in patients with suicide attempts,13,14 increased Cho/Cr levels in the basal ganglia, and decreased Glx levels. 15 Given these similarities, it is of interest to examine whether healthy subjects without depression may have different neurometabolic responses. Fasting may also act as a stimulation paradigm to examine the compensatory response to acute energetic stress. Fasting can be standardized and is independent from underlying motivational factors and personality traits. It can be applied to healthy volunteers or different patient populations, making the method feasible for comparisons of the stress response in healthy and pathological states. Fasting for up to three days has reliably been shown to induce stress hormone alterations including hypercortisolism, which is common to several stress models and points to brain adaptive response to energetic stress.7,8
Proton magnetic resonance spectroscopy (1H-MRS) can be used to study brain metabolism in vivo by detecting cerebral metabolites such as N-acetyl-aspartate (NAA), total creatine (tCr), total choline (tCho), the mixture (Glx) of glutamine (Gln) and glutamate (Glu), and myo-inositol (mI). 16 While conventional 1H-MRS techniques are suitable only for studies carried out on a small brain region, 17 thus limiting potential applications, a recently established whole brain MR spectroscopic imaging (wbMRSI) can map metabolites over large fractions of the brain. 18 Thus, the wbMRSI offers a new method to gain information on the biochemical processes underlying normal brain function and pathological states,19,20 and provides a powerful tool to explore metabolic response of the brain to standardized stressors, such as fasting stress.
This FAST*BRAIN study has been designed to examine the adaptive stress response to 72 h of complete food deprivation in healthy volunteers and in pathological conditions, with neurometabolic responses in human brain being studied by using the wbMRSI technique. Here we present the results obtained from 15 healthy women to demonstrate the feasibility of the study and to yield reference data for patient studies.
Materials and methods
Subjects
The study was approved by the Hannover Medical School Ethics Committee and conducted according to the principles expressed in the Declaration of Helsinki. Only female volunteers were recruited by advertisements and bulletin boards from the local population, in order to avoid possible gender effect. After complete description of the study, including the typical effects and side effects of three days fasting (i.e. loss of weight, possible headaches, sleeping difficulties, orthostatic problems), written informed consent was obtained from each of them. Exclusion criteria were current or past psychiatric disorder, current physical disorder, current pharmacological treatment for any reason, and a past history of cardiometabolic and autoimmune disorders (in particular diabetes mellitus type 1 and 2, any cardiac and pulmonary disorder, rheumatic disorders, inflammatory bowel disorders), and obesity. Five women dropped out due to interrupting the fasting period (n = 3); artifact in images (n = 1); or due to obesity (n = 1). The final data collection was for 15 females aged between 26 and 60, mean age 42 ± 10 years, with body mass index (BMI) less than 30 (fasting subjects). All volunteers completely stopped food intake except drinking unflavored water for 72 h. Additional 15 healthy females were included as non-fasting control subjects. These control subjects were selected according to the same criteria as mentioned above and matched to the fasting subjects on a one-to-one basis in respect to the age and BMI, but did not taken part in the fasting.
Clinical screening
All subjects underwent the Structured Interview for DSM-IV (SCID 1 and 2) to exclude mental disorders. Cognitive impairments were excluded using the DemTect test.21,22 Additionally, self-rated depressive symptoms were assessed using the Beck Depression Inventory-2 (BDI-2). The BDI-2 is a widely used 21-item self-rating scale with very good psychometric properties in psychiatric and physical disorders. A BDI-2 sum score between 0 and 8 is defined as no depression, 9–13 is defined as minimal depression, and a sum score above 13 is defined as major depression (graded in mild, moderate and severe depression). 22 A medical examination was performed according to the recommendations of the European Heart Association, 23 while body weight and height were assessed using standardized instruments to obtain body mass index.
Blood samples obtained from fasting subjects before and at the end of the fasting were immediately centrifuged, and the supernatants were stored at −20℃ until analysis. Besides the glucose level, serum ketone bodies (ß-hydroxybutyrate, acetoacetate and acetone) were determined by an enzymatic method (Wako Chemicals GmbH, Neuss, Germany) with a photometer (Eppendorf ECOM 6122, Eppendorf GmbH, Hamburg, Germany) operated at 405 nm. The levels of ketone bodies have been used as an objective measure of successful fasting.
MR examinations and data processing
Each fasting subject underwent a MR examination before and immediately after the fasting period, while non-fasting controls were examined only once. All MRI studies were carried out with the same protocol at the same MR scanner (Verio, Siemens, Erlangen, Germany) with a 12-channel phased-array head coil. The MRI protocol included a transverse T2 weighted turbo spin echo (TSE) sequence, a T1-weighted 3D MPRAGE, and a volumetric spin-echo planar spectroscopic imaging (EPSI) (TR/TE = 1550/17.6 ms) acquisition using a field of view of 280 × 280 × 180 mm3 and a slab of 140 mm with a final resolution of approximately 1.5 ml. The EPSI acquisition included a second dataset acquired without water suppression that provided a water reference signal with identical spatial parameters to the metabolite MRSI. 18 The TSE, MPRAGE, EPSI scans were obtained with the same angulation, so that the same anatomic structures could be identified. 20 As described in previous reports,18,24 the EPSI data were analyzed using the software package “Metabolic Imaging and Data Analysis System” (MIDAS) to obtain volumetric maps of metabolites NAA, tCr, tCho, Glx, and mI, with the signal intensities representing the metabolite contents, as well as the linewidth (LW) from the spectral analysis. The processing also included calculation of the tissue volume contributing to each MRSI voxel, by applying a tissue segmentation procedure to the T1-weighted (T1w) MPRAGE data to map gray matter (GM), white matter (WM), and cerebrospinal fluid (CSF), followed by a resampling and convolution by the MRSI spatial response function to coincide with the MRSI voxel volume and location. All resultant maps were spatially transformed and interpolated to a standard spatial reference at 2 mm isotropic resolution which was associated with a brain atlas that mapped individual brain lobes and the cerebellum.
For qualitative analysis of fasting induced metabolite changes, maps of the mean value for each metabolite, averaged over all fasting subjects in standard space, were generated for before and after the fasting. For quantitative assessment, the relative regional metabolite concentrations (in reference to brain tissue water and reported in institutional units (i.u.)), denoted as [NAA], [tCho], [tCr], [Glx], and [mI], respectively, together with the LW from MR spectral measurements, and the fractional volumes of the CSF (FVCSF), the gray matter (FVGM) and white matter (FVWM) were obtained by using multi-voxel analysis based on atlas-defined nine anatomic regions of the brain: right and left frontal lobe (RFL and LFL), right and left temporal lobe (RTL and LTL), right and left parietal lobe (RPL and LPL), right and left occipital lobe (ROL and IOL), and the cerebellum (Cbl). 20 Correction for CSF volume contribution was applied as Met′ = Met/(1 − fcsf) for 0 < fcsf < 0.3, where Met is the uncorrected metabolite value and fcsf is the fraction of CSF in the MRSI voxel. Voxels with LW greater than 12 Hz or a voxel with tissue fraction of less than 70% was excluded from the calculation. 18
Statistical analysis
To ascertain whether brain regional metabolite concentrations changed significantly after the fasting, a repeated-measures analysis of variance (ANOVA) was performed to compare pairwise the pre-fasting measured regional metabolite concentrations to those of post-fasting and to those of non-fasting controls. The assumption of sphericity was checked using Mauchly’s test, and the Bonferroni method was used to perform pairwise comparisons following significant overall test results. The conservative Bonferroni correction was used in order to ensure significance of the findings. As Sharpiro–Wilk tests showed non-normality distributions for fractional brain tissue volumes, a nonparametric Friedman Test was used for comparisons of corresponding fractional volumes FVCSF, FVGM, and FVWM. Wilcoxon signed rank test was also used to compare pre- and post-fasting scores of BDI-2 and single BDI items with uncorrected alpha = 0.05. Statistical analyses were performed with SPSS version 24 (SPSS IBM, New York, NY, USA).
Results
Results of clinical screenings on volunteers before and after a 72-h fasting.
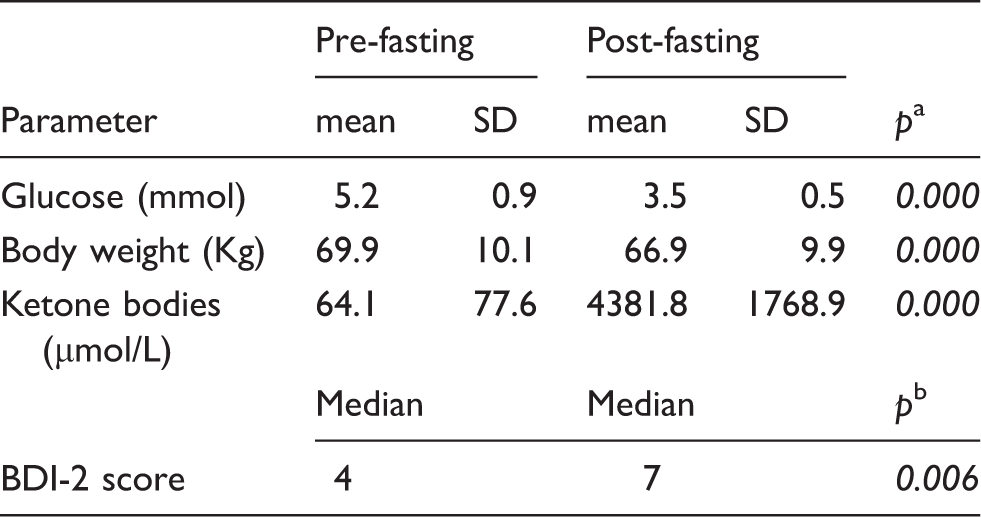
Paired t-test (significant if p < 0.05).
b Paired Wilcoxon signed rank test (significant if p < 0.05).
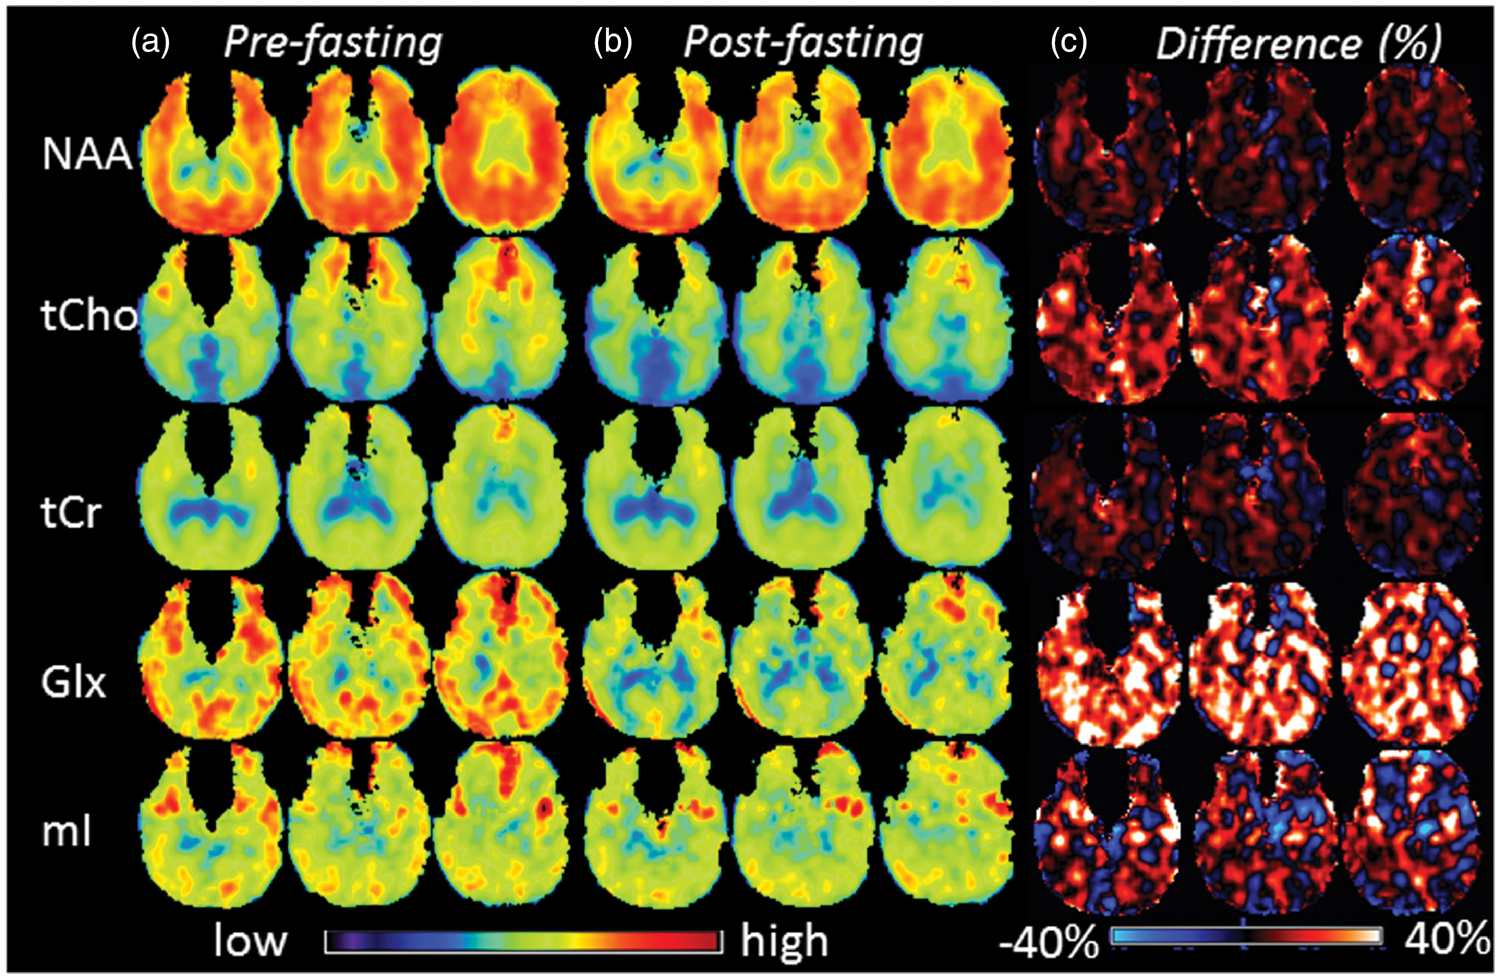
In Figure 1 are shown examples MR spectra for a 50-year-old subject obtained after fasting from single voxels located in the frontal lobe (voxel 1), parietal lobe (voxel 2), and occipital lobe (voxel 3), respectively, as indicated by white filled circles on the corresponding T1-weighted morphological image. Figure 2 shows the mean metabolite maps obtained before (Figure 2(a)) and after (Figure 2(b)) the 72-h fasting, respectively, at axial sections from levels around the centrum semiovale. The difference maps between pre- and post-fasting were shown in Figure 2(c), which were obtained by subtracting post-fasting values from corresponding pre-fasting values and presented as percentages in relation to the pre-fasting values. As shown in Figure 2(c), the Glx difference maps revealed overall relatively higher signal intensities, which was also observable in tCho difference maps to a smaller degree, suggesting overall decreases of Glx and tCho after fasting.
Example MR spectra for a 50-year-old subject obtained after fasting from single voxels located in frontal lobe (voxel 1), parietal lobe (voxel 2), and occipital lobe (voxel 3), respectively, as indicated by white filled circles on the corresponding T1-weighted morphological image. Maps of the group mean value for NAA, tCho, tCr, Glx, and mI at 3 axial sections, from the levels around the centrum semioval, obtained before (Figure 2(a)) and after (Figure 2(b)) the 72-h fasting, and the difference maps obtained by subtracting post-fasting values from corresponding pre-fasting values and presented as percentages in relation to the pre-fasting values (Figure 2(c)).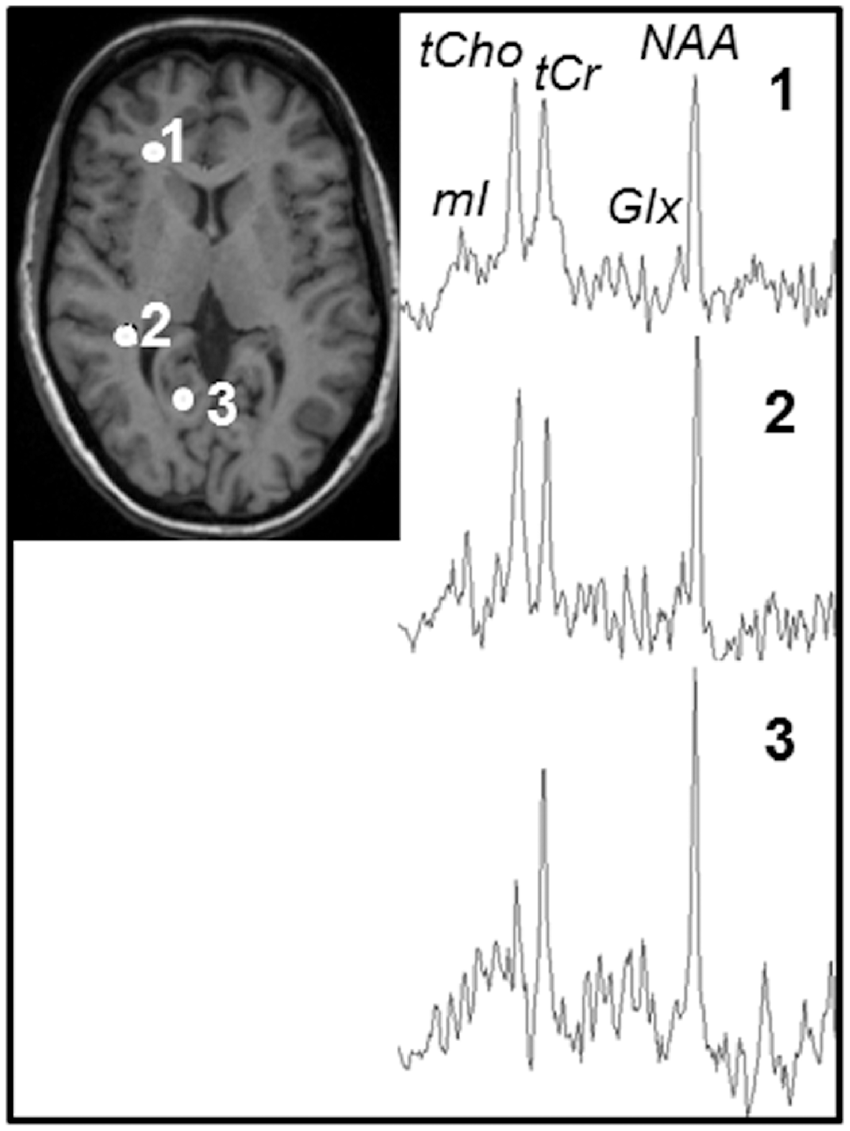
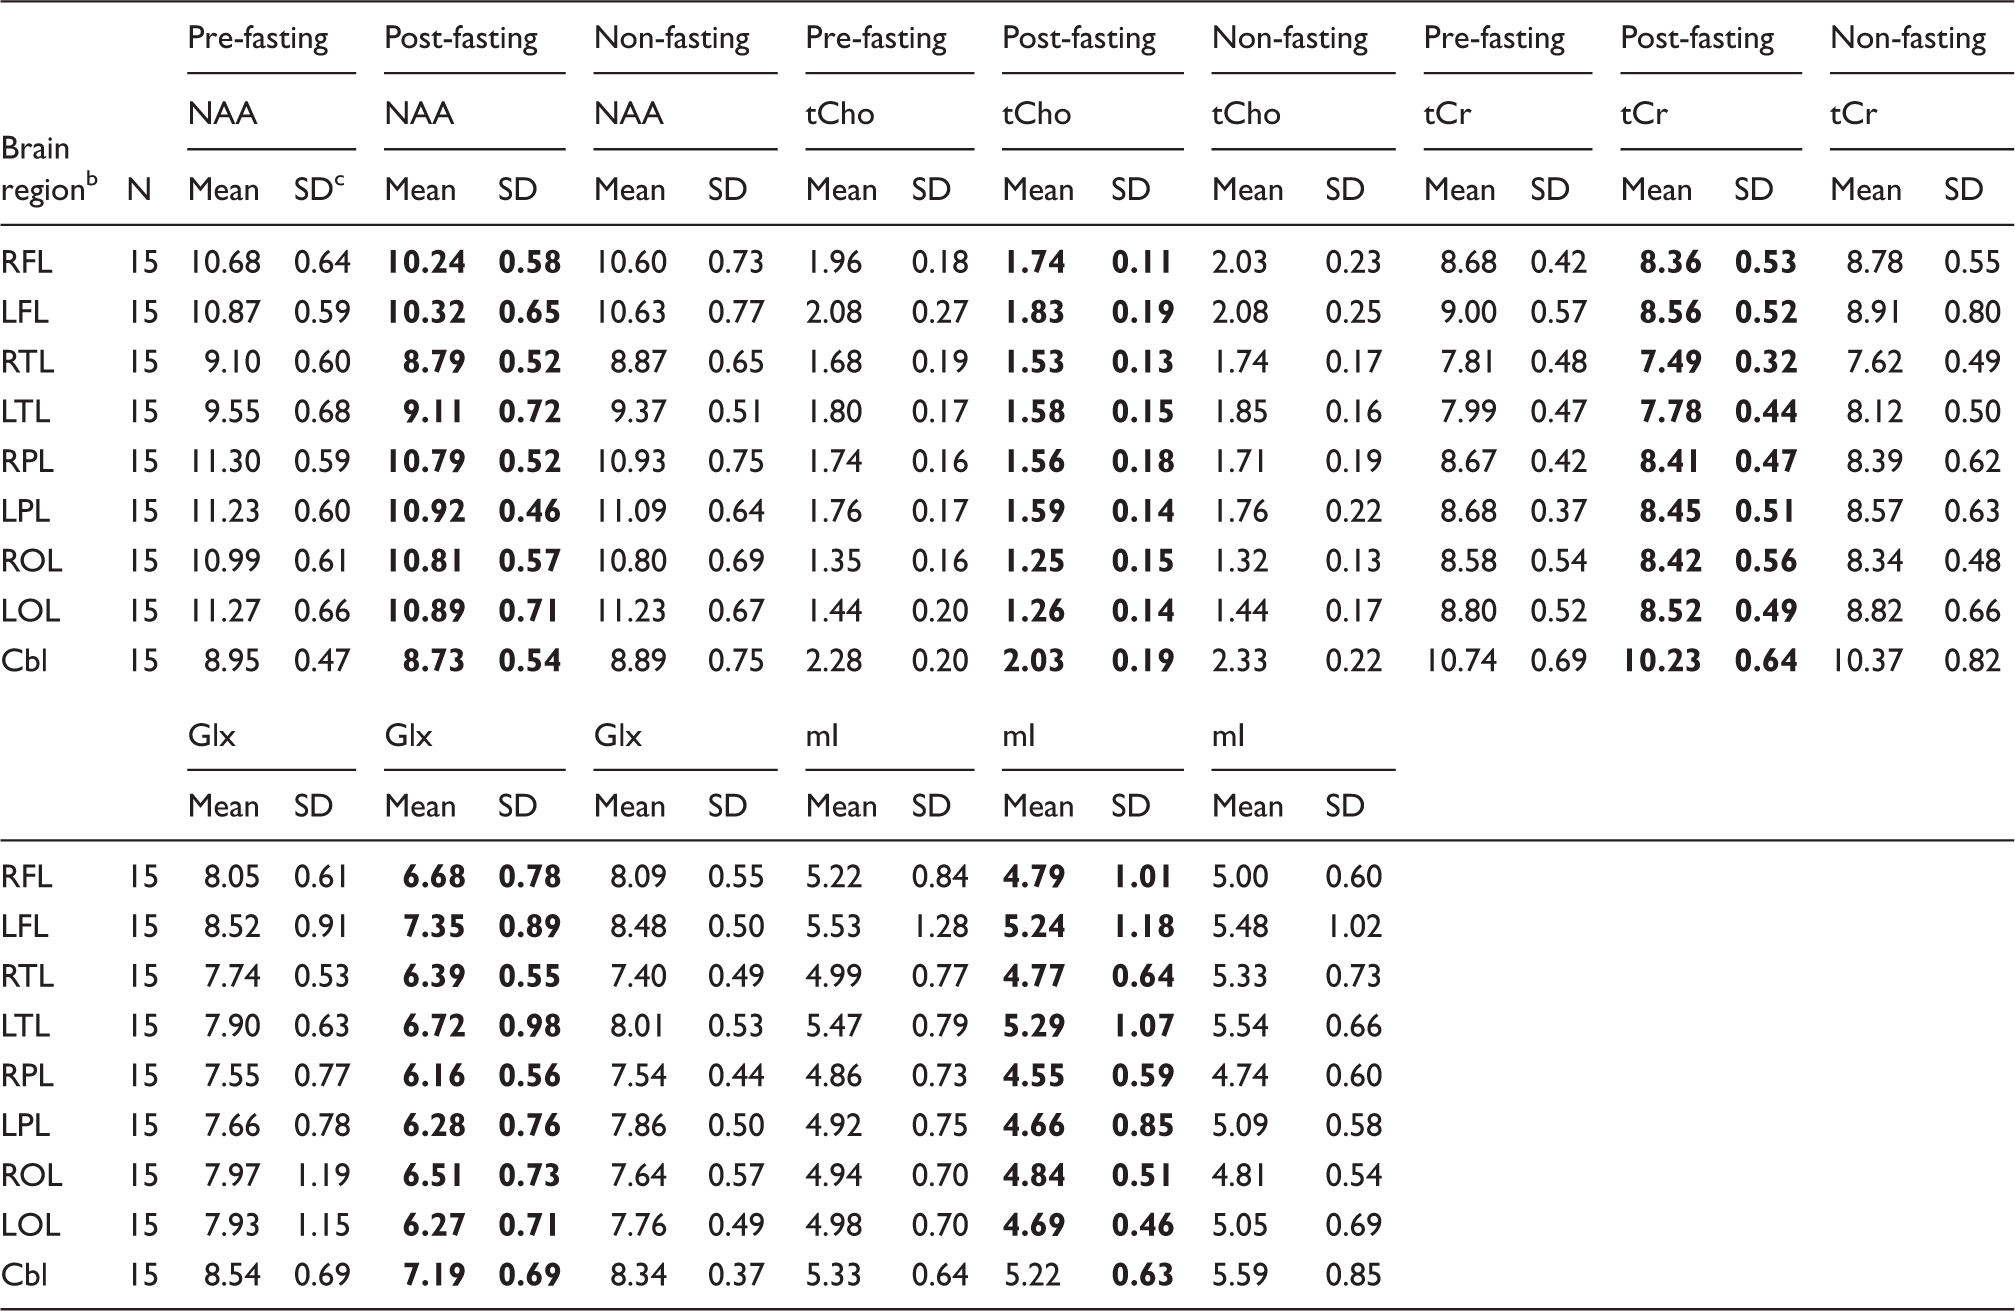
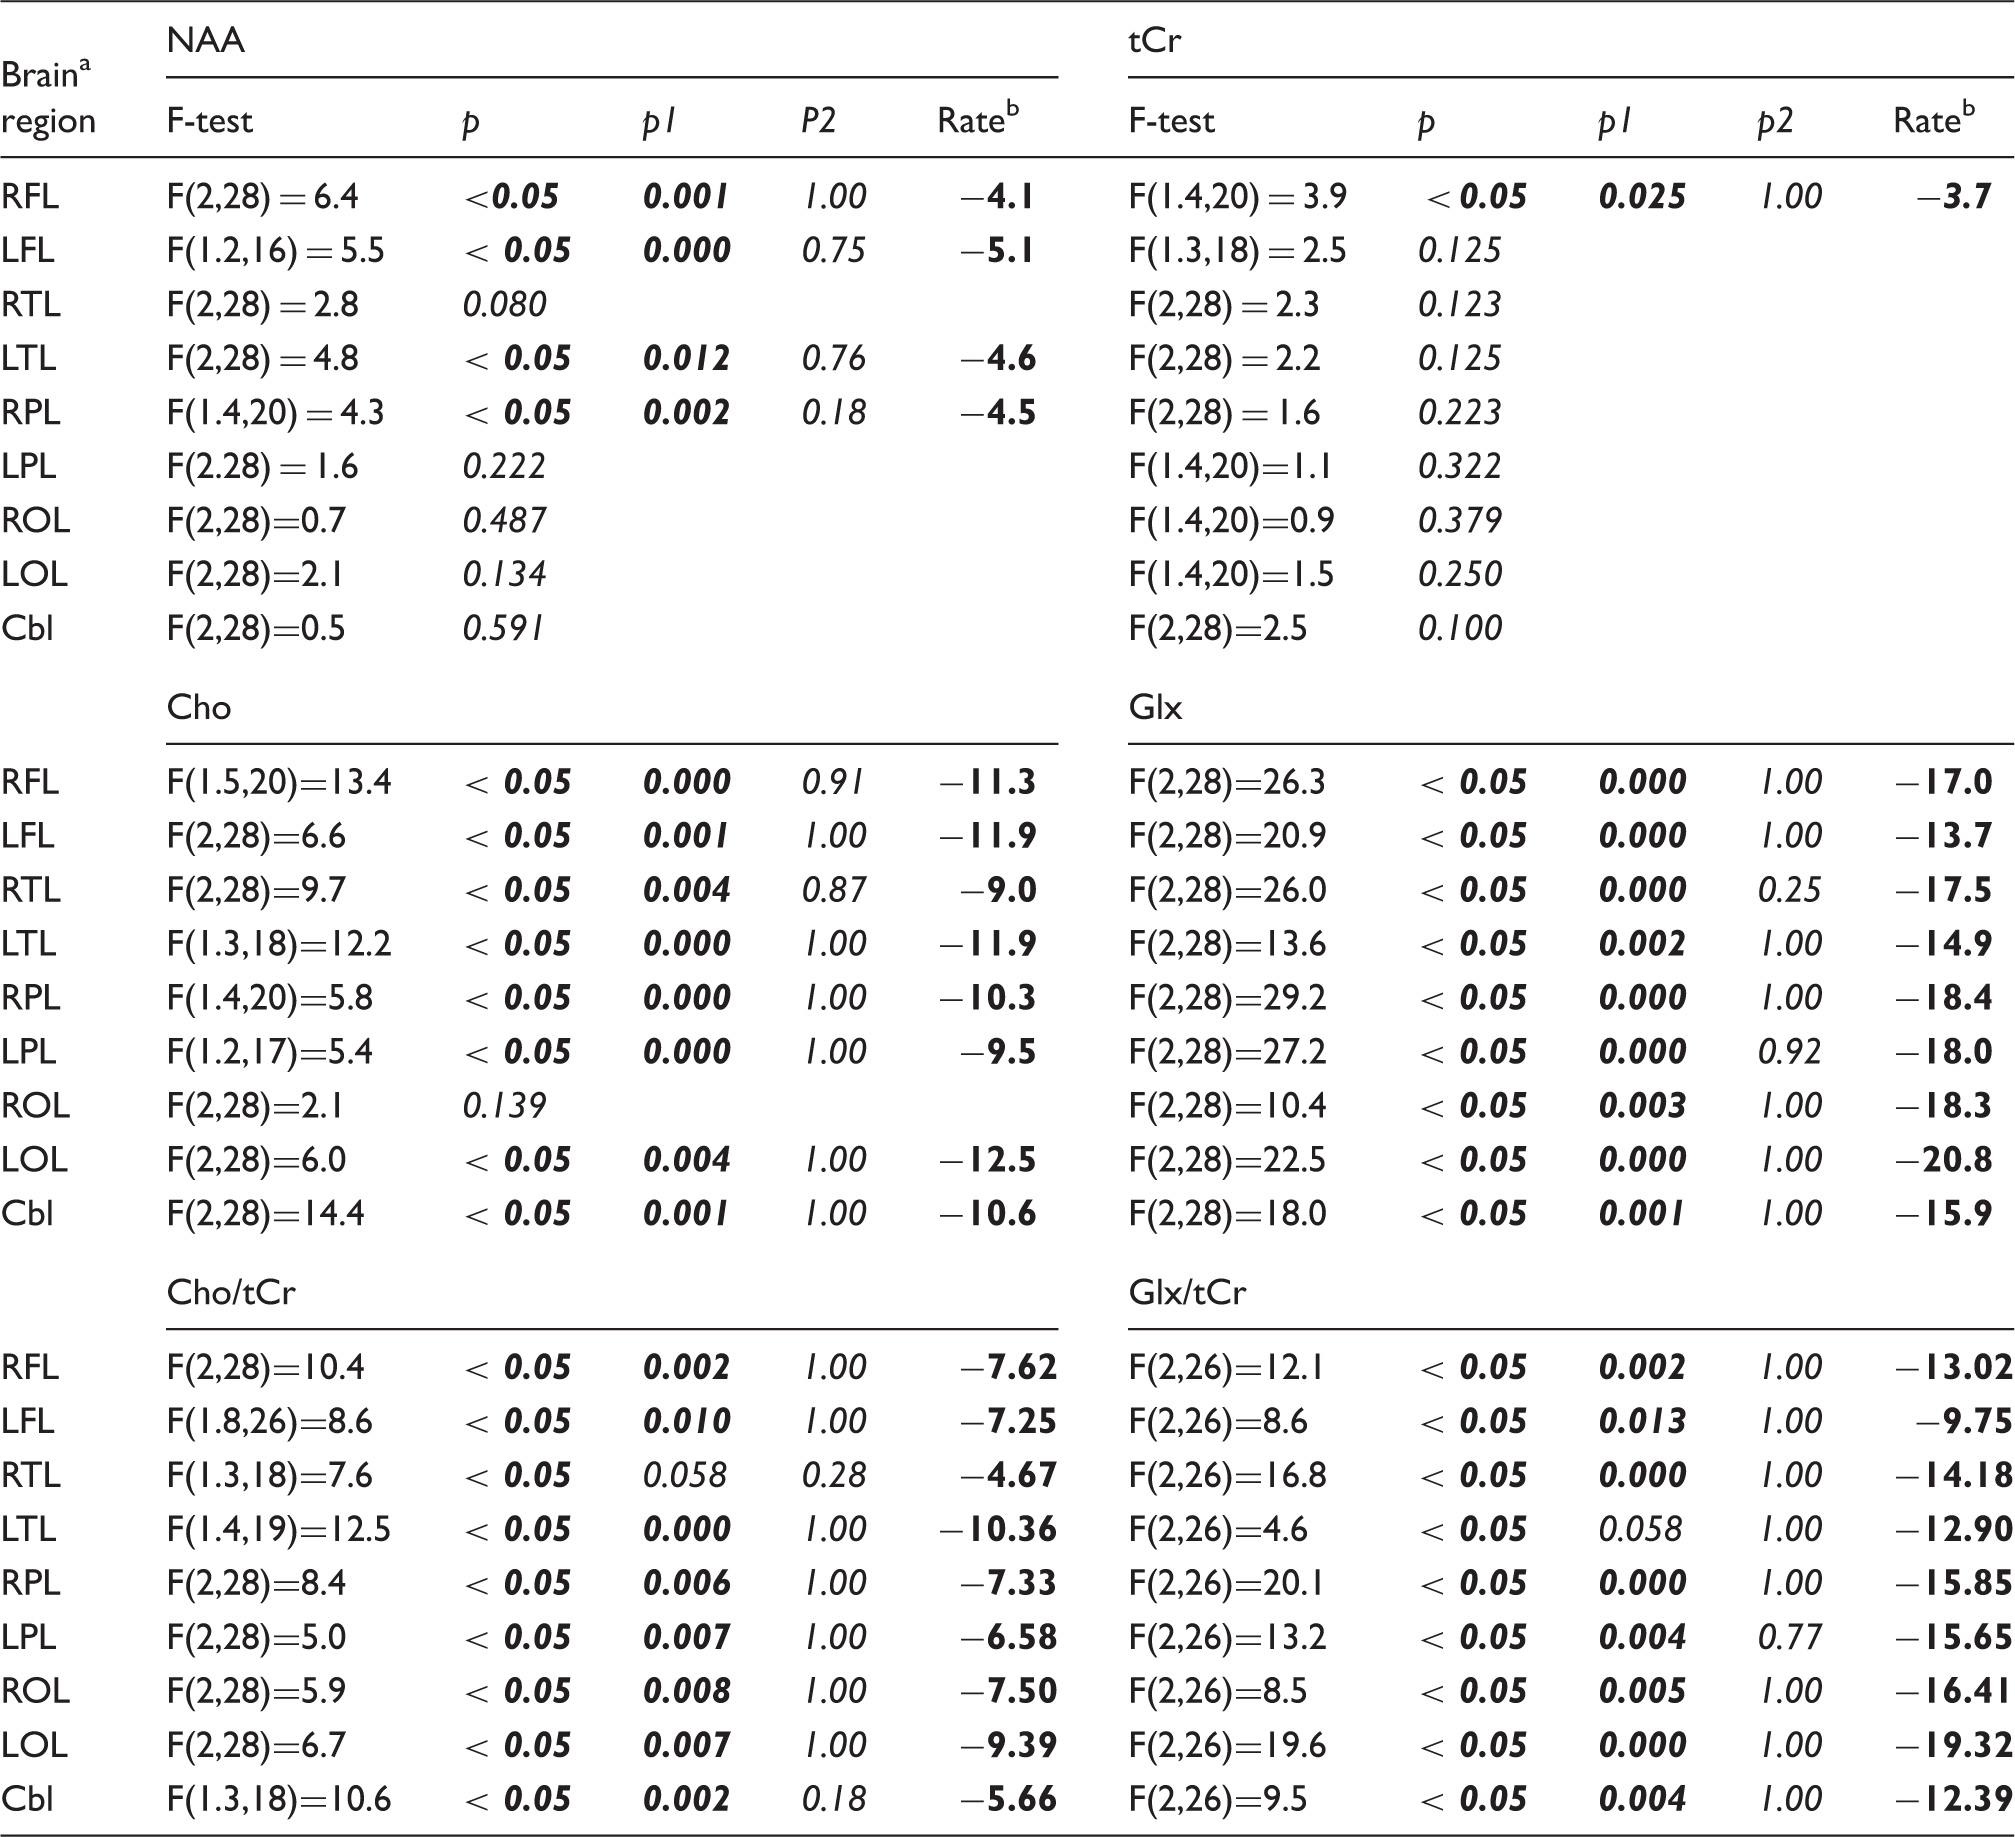
The regional [NAA], [tCho], [tCr], [Glx], and [mI] of the subjects measured pre- and post-fasting, as well as those of non-fasting controls, are shown as boxplots in Figure 3, and the mean values of the three groups are given in Table 2. Repeated-measures ANOVA showed significant differences between the regional metabolite concentrations that varied between brain regions. Bonferroni-adjusted post hoc pairwise comparisons revealed significant differences between pre-fasting and post-fasting values (p < 0.05) that were brain regions and metabolites dependent, while no significant differences between pre-fasting and non-fasting values were found (p > 0.05), as shown in Table 3, where the results for metabolite rates Glx/tCr and Cho/tCr were also shown. In comparison to pre-fasting values, most of the post-fasting metabolite concentrations were decreased, with some variation between brain regions and metabolites (Table 3). The largest changes were seen for [Glx], which decreased significantly in all nine brain regions, ranging from −14% to −21%. The [tCho] decreased significantly in eight brain regions except ROL, ranging from −9% to −13%. These quantitative results are consistent with those observed qualitatively on the mean metabolite maps (Figure 2). Moreover, after fasting the [NAA] decreased slightly and significantly in RFL, LFL, LTL and RPL (−4% to −5%), and the [tCr] decreased also slightly but significantly only in RFL (−4%). The [mI] as well as the spectral linewidth did not show significant alterations. The fractional volumes for CSF, gray matter and white matter also did not reveal significant changes after fasting.
Boxplots of relative regional concentrations of NAA, Cho, tCr, Glx, and mI of 15 healthy women obtained before and after the 72-h fasting, and from non-fasting controls. Significant differences between pre- and post-fasting values estimated with post hoc Bonferroni tests are indicated by *. No significant differences between pre-fasting and non-fasting values were found. i.u. represents institutional unit. Mean values of regional metabolite concentrationsa measured before and after 72 h of fasting and in a matched non-fasting control group. In ratio to brain tissue water.18 bLFL/RFL: left and right frontal lobe; LTL/RTL: left and right temporal lobe, LPL/RPL: left and right parietal lobe; LOL/ROL: left and right occipital lobe; Cbl: cerebellum; cSD: standard deviation. Results of repeated-measures ANOVA of relative regional metabolite concentrations and the metabolite ratios Cho/tCr and Glx/tCr measured before and after the fasting, and from non-fasting controls, including Bonferroni-adjusted post hoc tests following significant (p < 0.05) overall test results. Note: For mI no significant overall results were found. p is the overall significance estimated with ANOVA, p1 and p2 (significant if P1 or p2 < 0.05. In significant case the values of p1 or p2 were shown in bold) are significances of Bonferroni adjusted post hoc tests between pre- and post-fasting values (p1), pre- and non-fasting values (p2) that calculated for cases with p < 0.05. Definition of the brain regions are the same as shown in Table 2. Decreases of the metabolite values after fasting in ratio to pre-fasting values, calculated only when changes were significant in comparison to pre-fasting values (p1 < 0.05).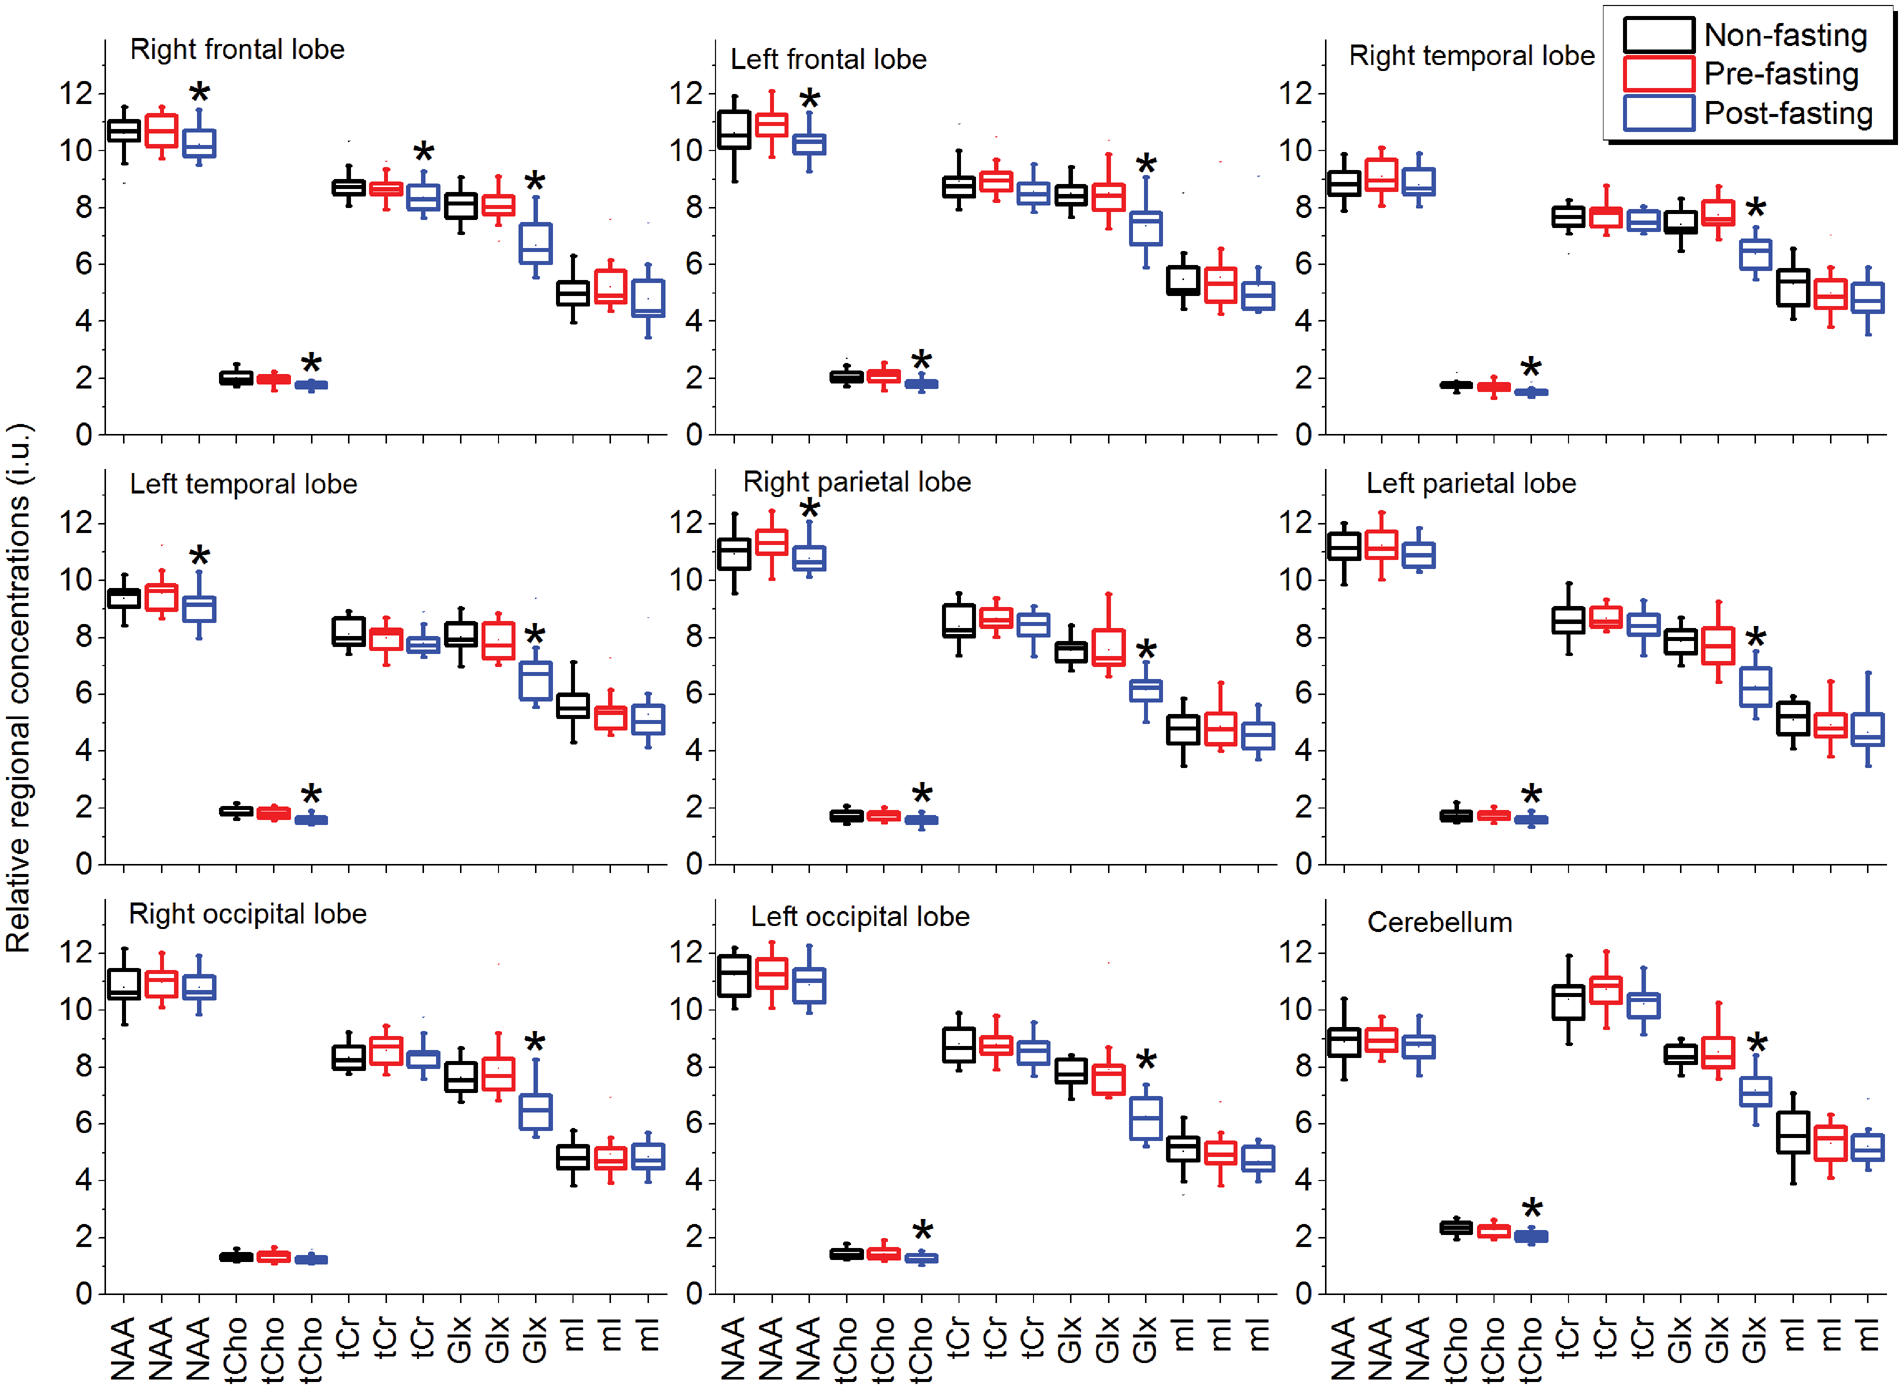
Discussion
This study assessed 1H-MRS observed brain metabolite distributions over nine brain anatomic regions in healthy women before and after 72 h of fasting. The concentrations of NAA, tCho, tCr, Glx, and mI, obtained in pre-fasting, post-fasting, and non-fasting measurements, were consistent with previously published brain metabolite values in adults, 18 demonstrating the reproducibility of the wbMRSI technique, while the use of measurements at different time points enabled significant differences to be found between pre- and post-fasting values (Table 3). A 72-h fasting intervention was used because former studies described endocrine (i.e. activation of the hypothalamus-pituitary-adrenal system, decrease in thyroid hormones), metabolic, and mood alterations in healthy humans after this time interval, indicating a brain adaptive response to food deprivation.7,8,25 However, to our knowledge, there have been no previous reports of demonstrating changes of in vivo MRS-observable brain metabolites in human subjects due to fasting, which has been the focus of this study.
In comparison to pre-fasting values, the brain regional metabolite concentrations, determined in reference to tissue water, revealed significant changes after the fasting; however, it is also noted that changes in tissue water content would impact the detected relative metabolite concentrations. Meyers et al. have reported that there was no measurable change in brain tissue water content or brain volume between hydration states in healthy volunteers, 26 and in this study the FVGM, FVWM, and FVCSF were not found to change significantly after the fasting. Furthermore, the metabolite ratios Glx/tCr and Cho/tCr also revealed significant decreases after fasting (Table 3). These observations suggest that the fasting did not significantly alter the brain tissue water content. In addition, our findings that there were no significant changes of spectral linewidth after the fasting suggested that there were no significant alterations of metabolite T2 relaxation times or local field inhomogeneity, 27 which would also impact the metabolite measurement. The fact that no significant differences between pre-fasting and non-fasting measured values were found suggests that the differences between pre- and post-fasting are not due to measurement error. Therefore, the observed post-fasting changes of regional metabolite concentrations represent fasting-related changes in brain metabolite contents, i.e. fasting directly influences neurometabolism. Moreover, this study has shown that fasting-induced alterations of brain metabolite contents are regionally dependent (Table 3), with decreases of four metabolites in frontal lobes (NAA, tCho, tCr, and Glx); three metabolites in two lobes (NAA, tCho, and Glx in LTL and RPL); two metabolites in four lobes (tCho and Glx in RTL, LPL, LOL and cerebellum); and only decrease of [Glx] in the right occipital lobe. In comparison to other brain regions, the frontal lobes revealed the most changes of metabolite contents after fasting, followed by changes in the temporal lobes, suggesting that these brain regions are more sensitive to the effects of fasting, i.e. more vulnerable to stress, which might play a role for these regions being often involved in neurodegenerative or psychiatric disorders.13,28
MRS-detected metabolites provide important information about brain metabolism. The metabolite NAA reflects neuronal integrity, tCho the cell membrane turnover, tCr the energy metabolism, mI the glial proliferation and osmolyte, and glutamate (Glu), the major component of the Glx signal, is a neurotransmitter. 16 It has been suggested that the decrease of brain NAA could be due to either a reduction in neuronal volume/density or neuronal metabolic activity. 29 In this study, no significant changes in fractional volumes of the brain tissue and CSF were found, therefore the decreases of [NAA] observed in several brain regions after fasting may reflect an adaptive reduction in neuronal metabolic activity, which is consistent with the observations of decreased [tCho] that indicated decreased cell membrane turnover. The mI levels did not change significantly after fasting, suggesting that the fasting stress did not significantly influence brain cell activity related to mI or osmolality. 30 Interestingly, the [tCr] decreased only slightly in the right frontal lobe after fasting. This may reflect the ability of healthy human brain to maintain energy homeostasis under food deprivation.
The largest changes after fasting were observed for glutamate/glutamine, with widespread decreases of up to −21%, indicating that Glx is most sensitive to fasting effects. The changes in [Glx] may be considered as a principle metabolic response of the human brain under conditions of food deprivation. Glutamate, which is the largest component of the Glx signal, is the major excitatory neurotransmitter of the vertebrate central nervous system. Dual roles of glutamate as a primary excitatory neurotransmitter in the CNS and as a key metabolite linking carbon and nitrogen metabolism related to a large portion of the total energy demand of brain function were reported by 13C MRS studies in animal models and in human: Shen et al. found the glutamate/glutamine cycle to be a major metabolic flux in the resting human brain with a rate ≈80% of glucose oxidation. 31 A stoichiometric coupling of brain glucose metabolism and glutamatergic neuronal activity was reported. 32 In a recent review, Robinson and Jackson pointed out that while a family of sodium-dependent transporters maintains low extracellular glutamate and shapes excitatory signaling, the glutamate transport not only coordinates excitatory signaling but also plays a pivotal role in regulating brain energetics. 33 In studies of brain metabolism during short-term starvation, Hasselbalch et al. reported that the glucose consumption of the human brain was reduced to 75% of control values after 3.5 days fasting, and ketone bodies account for approximately one-fourth of the cerebral energy requirement that correlated to increased ketone bodies in plasma, 34 while cerebral blood flow remained unchanged. 35 Bearing in mind these findings, the observed decreases of [Glx] and increased ketone bodies in plasma (Table 1) suggest that the brain’s response to decreased glucose supply under food deprivation is a decrease of glutamatergic neuronal activity, while up to one-fourth of the cerebral energy requirement was covered by ketone bodies. 34 As the amount of extracellular Glx represents only a minor amount of the MRS signal, the measured Glx is most likely resulted from intracellular content. Astrocytes are capable of net synthesis of glutamate and glutamine from glucose in the tricarboxylic acid (TCA) cycle, which in turn can be derived from their intracellular glycogen storages. As fasting may result in depletion of brain glycogen storages to provide energy substrates under conditions of energy restriction, this may result in a decrease in TCA activity and as a consequence reduced production of Glx. 31 Altogether, these observations provide in vivo evidence for a close relationship between brain activity, glutamate/glutamine and glucose metabolism in human brain, as well as information about how the brain maintains energy homeostasis after food deprivation.
Interestingly, this study found a complex pattern of subtle psychological alterations with fasting. Beyond the expected increase in appetite, we found an increase in sadness, self-blaming, difficulties in decision making, and loss of libido. While increase in appetite and loss of libido may more directly be connected to fasting, sadness, self-blaming and difficulties in decision making are not. However, our results confirm earlier studies on fasting and dieting that demonstrated depressed mood and cognitive alterations.5,6,36 In conjunction with the observed altered glutamatergic neurotransmission, fasting stress may have some similarities with MDD, that is characterized by similar symptoms and decreased glutamatergic neuronal activity. 37 However, further studies are needed to support this interpretation.
An additional observation of this study was an overall decrease of tCho after fasting. Changes of tCho have previously been shown to be associated with mood, although the reported results are controversial: Yang et al. reported significantly increased [tCho] in frontal lobe of major depression patients compared to those of healthy controls, 38 no difference of [tCho] in frontal lobe between major depression patients and healthy controls was found by Mery et al., 39 while in young patients with depression disorder, lower levels of tCho in frontal lobe compared to healthy controls was reported. 40 Therefore, the observations of decreased Cho and Glx may suggest that acute deprivation of energy supply to the brain may be possible factor promoting the development of depressive symptoms.
Limitations of this study include that only female volunteers with a BMI less than 30 were studied and the small sample size meant that metabolic differences between left and right hemispheres and possible effects of women’ menstrual period could not be studied. While paired tests were used to minimize the age effects, further study with a larger sample size will be necessary to examine the influence of age on metabolic response to fasting. Further studies with a larger sample size, range of BMI values, and males are necessary to validate the results.
In conclusion, this study has demonstrated that a 72-h fasting stress affects neurometabolism in otherwise healthy women. The adaptive brain response to maintain energy homeostasis under food deprivation in healthy human is associated with metabolite-selective and region-dependent changes of metabolite contents, with Glx showing the greatest change and frontal lobes being the most sensitive brain regions to the stressor. Fasting stress in the context of whole brain spectroscopy may offer a highly standardized model to explore the brain’s metabolic adaptation to stress.
Footnotes
Funding
This work was partially supported by Deutsche Forschungsgemeinschaft. Additional support was provided under NIH grant R01EB016064 (AAM).
Acknowledgement
We would like to thank our research volunteers.
Declaration of conflicting interests
The author(s) declared no potential conflicts of interest with respect to the research, authorship, and/or publication of this article.
Authors’ contributions
XQD and KGK took part in conception and design; XQD, AAM, US, BS, RL, SB, HL, and KGK took part in acquisition, analysis or interpretation of data; XQD and KGK contributed to drafting the article; AAM, US, BS, LR, SB, and HL contributed to reviewing critically for intellectual content and final approval of article.