
Abstract
In the present study, we aimed at determining the metabolic responses of the human visual cortex during the presentation of chromatic and achromatic stimuli, known to preferentially activate two separate clusters of neuronal populations (called “blobs” and “interblobs”) with distinct sensitivity to color or luminance features. Since blobs and interblobs have different cytochrome-oxidase (COX) content and micro-vascularization level (i.e., different capacities for glucose oxidation), different functional metabolic responses during chromatic vs. achromatic stimuli may be expected. The stimuli were optimized to evoke a similar load of neuronal activation as measured by the bold oxygenation level dependent (BOLD) contrast. Metabolic responses were assessed using functional 1H MRS at 7 T in 12 subjects. During both chromatic and achromatic stimuli, we observed the typical increases in glutamate and lactate concentration, and decreases in aspartate and glucose concentration, that are indicative of increased glucose oxidation. However, within the detection sensitivity limits, we did not observe any difference between metabolic responses elicited by chromatic and achromatic stimuli. We conclude that the higher energy demands of activated blobs and interblobs are supported by similar increases in oxidative metabolism despite the different capacities of these neuronal populations.
Introduction
The human primary visual cortex (V1) contains two distinct neuronal populations with different cytochrome-oxidase (COX) content. 1 On tangential sections, the COX-rich pattern of ovoid 250–400 µm large “blob” patches is interleaved with “interblob” neurons relatively poor in COX content in most cortical layers. Since COX enzyme ultimately limits glucose (Glc) oxidation, 2 differences in spatial COX distribution imply that the energy demands of active interblob neurons are potentially fulfilled by oxidative metabolism to a lesser extent as compared to blob neurons. Besides the higher COX content, the capillary density has been reported to be higher in blob relative to interblob regions.3,4 The greater concentration of microvessels is associated not only with higher capacity of cerebral blood flow (CBF) but also with higher glucose consumption. 5 These pieces of evidence altogether suggest a higher capacity of oxidative metabolism of the blob patches, and that glycolysis might be involved to a larger extent during activation in the less vascularized and COX-poor interblob neurons.
Due to the prevailing sensitivity of blob neurons to color, blob and interblob neurons can be preferentially stimulated by either chromatic (blob) or achromatic (interblob) visual stimuli.6–9 Therefore, the potential differences in the energetic metabolism between blob and interblob neuronal populations can be probed by functional magnetic resonance spectroscopy (fMRS). This method allows the direct, noninvasive detection of small changes in metabolite concentrations occurring in the activated primary visual cortex (V1).10–13 The stimulus-evoked concentration changes of glutamate (Glu), lactate (Lac), aspartate (Asp), and Glc have been ascribed to activation of the oxidative metabolic pathways.14–16 Of these four metabolites, Glu appears to be the most-reliable in vivo marker of these processes because of its highest MRS detection sensitivity.
Interestingly, a lack of difference in oxidative metabolic responses of blob and interblob neuronal populations to chromatic (CHROM) and achromatic (ACHROM) visual stimuli was suggested in a recent human imaging study. 17 After modeling the changes in cerebral metabolic rate of oxygen (CMRO2) from the measured CBF and blood oxygen level dependent (BOLD) effect, 18 the authors showed that the ratio between stimulus-induced changes in CMRO2 and CBF was the same, regardless of whether blob or interblob neuronal populations were stimulated.
The main goal of the current study was to identify potential differences in metabolic responses of blob and interblob neuronal populations to visual stimulation by using recently established 7 T fMRS based on a semi-LASER sequence. 13 Since blobs and interblobs have different capacities for glucose oxidation, we hypothesized to observe different metabolic responses during chromatic vs. achromatic stimuli. We designed CHROM and ACHROM stimuli and optimized them in order to evoke a similar global amount of neuronal activation while preferentially activating the blob (CHROM) or interblob (ACHROM) neuronal populations. Each of 12 healthy young participants was scanned twice in separate sessions with CHROM and ACHROM stimuli presented in opposite order. fMRS and BOLD-fMRI experiments were carried out during each session for characterizing the metabolic responses and the overall amount of neuronal activation, respectively. The metabolic and BOLD-fMRI responses to either CHROM or ACHROM stimuli were then averaged between the two sessions per subject and compared between the two stimulation conditions in pairwise analyses. Finally, the two-session design, which was utilized for the first time in such an fMRS experiment, allowed assessing the between-session reproducibility in determining metabolite concentrations and their changes within an fMRS study design.
Methods
Participants
Fifteen healthy volunteers were enrolled in the current study. Exclusion criteria included history of stroke, seizures, neurosurgical procedures, arrhythmias, and severe vision problems. All subjects complied with MRI safety guidelines and exclusion criteria that included weight ≤130 kg and the absence of metallic implants in their body. All subjects signed informed consent prior to each scanning session. The experimental procedure described below followed the Code of Federal Regulations and was approved by the Institutional Review Board: Human Subjects Committee of the University of Minnesota. In three subjects, data were discarded due to subject motion or due to spectral contamination (around 1.5 ppm) by subcutaneous lipid signals. Only data from the remaining 12 subjects (2 males/10 females, age 30 ± 3 years, mean ± SD) were used for further analysis. Each subject participated in two separate fMRI/fMRS sessions, 18 ± 16 days apart.
Visual stimulation
The visual stimuli were designed according to a recent study. 17 Two identically shaped radial checkerboards used during stimulation periods (STIM) were either red and green (CHROM) or near-black and near-white (ACHROM). Radial frequency changed linearly from 2.5 cycles/degree in the center of the checkerboard to 1.0 cycle/degree at 10° eccentricity. The wedges central angle was 7.5°. Checkerboards simultaneously rotated and expanded/contracted at the same frequency of 2 Hz. Direction of rotation and dimensional scaling changed with a pseudorandom period in the interval 1.0–2.5 s with the same pattern in both stimuli. Since selective activation of color-selective neurons by CHROM stimulus can be achieved only if the stimulus is perceptively equiluminant, 19 the luminance of red and green was matched in each scanning session prior to MRI/MRS data acquisition by a perceptive flicker photometry experiment. 17 The stimulation covering the central part of the field-of-view (22° × 29°) was projected onto a translucent screen that was viewed by a subject through the mirror mounted on the RF head coil. Gray background was used as a blank condition (REST). The contrast of the ACHROM stimulus was set in order to match the amount of BOLD-fMRI activation evoked by CHROM stimulation. The similarity of BOLD-fMRI responses between stimuli was verified on the data acquired during the sessions of the first three participants included in the analysis.
During the whole stimulation paradigm (STIM and REST), a small cross that randomly changed its orientation was displayed in the center of the field of view. Subjects were asked to push a button when the symbol “+” changed to “x” in order to keep their attention at the central location and to monitor their compliance with the stimulation task. The stimulus was presented in a blocked design during both fMRI and fMRS acquisitions. In the fMRI time series, CHROM and ACHROM stimuli alternated during STIM periods (15 s), which were interleaved by REST periods (20 s) over six STIM – REST blocks of a total duration of 210 s. Metabolite spectra were collected during a 24-min long fMRS paradigm (Figure 1), consisting of five blocks REST–STIM–REST–STIM–REST. The duration of each block was 5.3 min and included 64 scans, except for the first 2.7-min long baseline REST block which included 32 scans.
Schematic diagram of the fMRS visual stimulation paradigm. Each subject participated in two sessions with an opposite order of chromatic (CHROM) and achromatic (ACHROM) stimuli. To assess differences between the steady-state metabolite concentrations, only fMRS data acquired during the second halves of the stimulation and rest periods were used (TR = 5 s, number of scans = 32). Concentration differences were assessed between the stimulation (CHROM or ACHROM) and the subsequent REST period.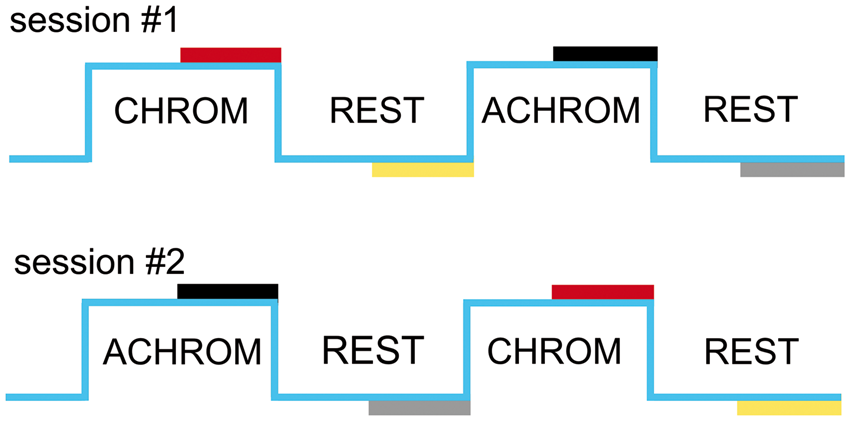
The fMRI/fMRS data from each subject were collected in two separate sessions with an opposite order of the CHROM and ACHROM stimuli. Constrained randomization was used to determine the order of these CHROM and ACHROM stimuli. In the first session, stimuli were displayed in the CHROM-ACHROM order to six subjects and in reversed order (ACHROM-CHROM) to the remaining six subjects. Opposite orders of stimuli were presented to each subject in their second session. The CHROM-ACHROM order was always the same for fMRI and fMRS paradigms within a session and data collection always started with fMRI followed by fMRS.
Data acquisition
MR experiments were performed using a 7 T/90 cm magnet (Agilent/Magnex Scientific, Yarnton, UK) equipped with an SC72 gradient/shim coil (maximum gradient strength of a 70 mT/m; maximum 2nd order shim strength of 7 mT/m2; Siemens Medical Systems, Erlangen, Germany) that was interfaced to a Siemens Syngo console (Siemens Medical Systems). A half-volume quadrature transmit/receive RF coil combined with an 8 kW RF amplifier was capable of providing the transmit
First, high-resolution MPRAGE images (repetition time TR = 2.5 s, echo time TE = 2.4 ms, inversion time TI = 1.5 s, and spatial resolution 1 × 1 × 1 mm3) were acquired to visualize the anatomical structure of the occipital cortex. Then the BOLD-fMRI data were acquired using a standard GE-EPI sequence (2.5 mm isotropic resolution, TR = 2.5 s, TE = 23 ms, 18 slices, 84 time points in total). The BOLD-fMRI time-series were processed online using General Linear Model (GLM)–based statistics, which enabled real-time calculation of activation maps for guiding voxel localization. Finally, the functional 1H MRS data were acquired using the full signal-intensity semi-LASER localization sequence 20 optimized for 7 T (TE = 26 ms, TR = 5 s), combined with outer volume saturation (OVS) and VAPOR water suppression. 21 The volume of interest (VOI = 20 × 20 × 20 mm3) was carefully positioned in V1 based on acquired BOLD-fMRI maps and the anatomical landmarks clearly discernible on MPRAGE images. The B0 shimming was performed automatically using the echo-planar version of FASTMAP. 22 In addition, unsuppressed water signals, acquired with and without the OVS, served for the correction of residual eddy currents effects and as a reference for metabolite quantification, respectively. The total duration of the fMRI/fMRS session was approximately 60 min.
fMRI data analysis
fMRI data were processed off-line with SPM8 software (http://www.fil.ion.ucl.ac.uk/spm) for quantitative analysis aimed at comparing the BOLD-fMRI responses during CHROM and ACHROM stimuli. Motion parameters of the EPI time-series were estimated by linear non-distorting registration with 6 degrees of freedom. The EPI time-series without any spatial smoothing were analyzed voxel-wise with GLM. The VOI selected for MRS was used to construct a mask for fMRI data analysis. This mask was utilized for obtaining the suprathreshold fraction of activated voxels (uncorrected p < 0.001, BOLDfraction) and the mean BOLD-fMRI amplitude (BOLDampl) within the spectroscopic VOI. The BOLDampl value was calculated as a percent by dividing, voxel by voxel, the regression coefficient of the STIM (CHROM or ACHROM) condition by the constant term of the regression and then averaged across voxels within the fMRS VOI.
fMRS data analysis
Metabolite responses to chromatic and achromatic stimulations quantified from the fMRS data.
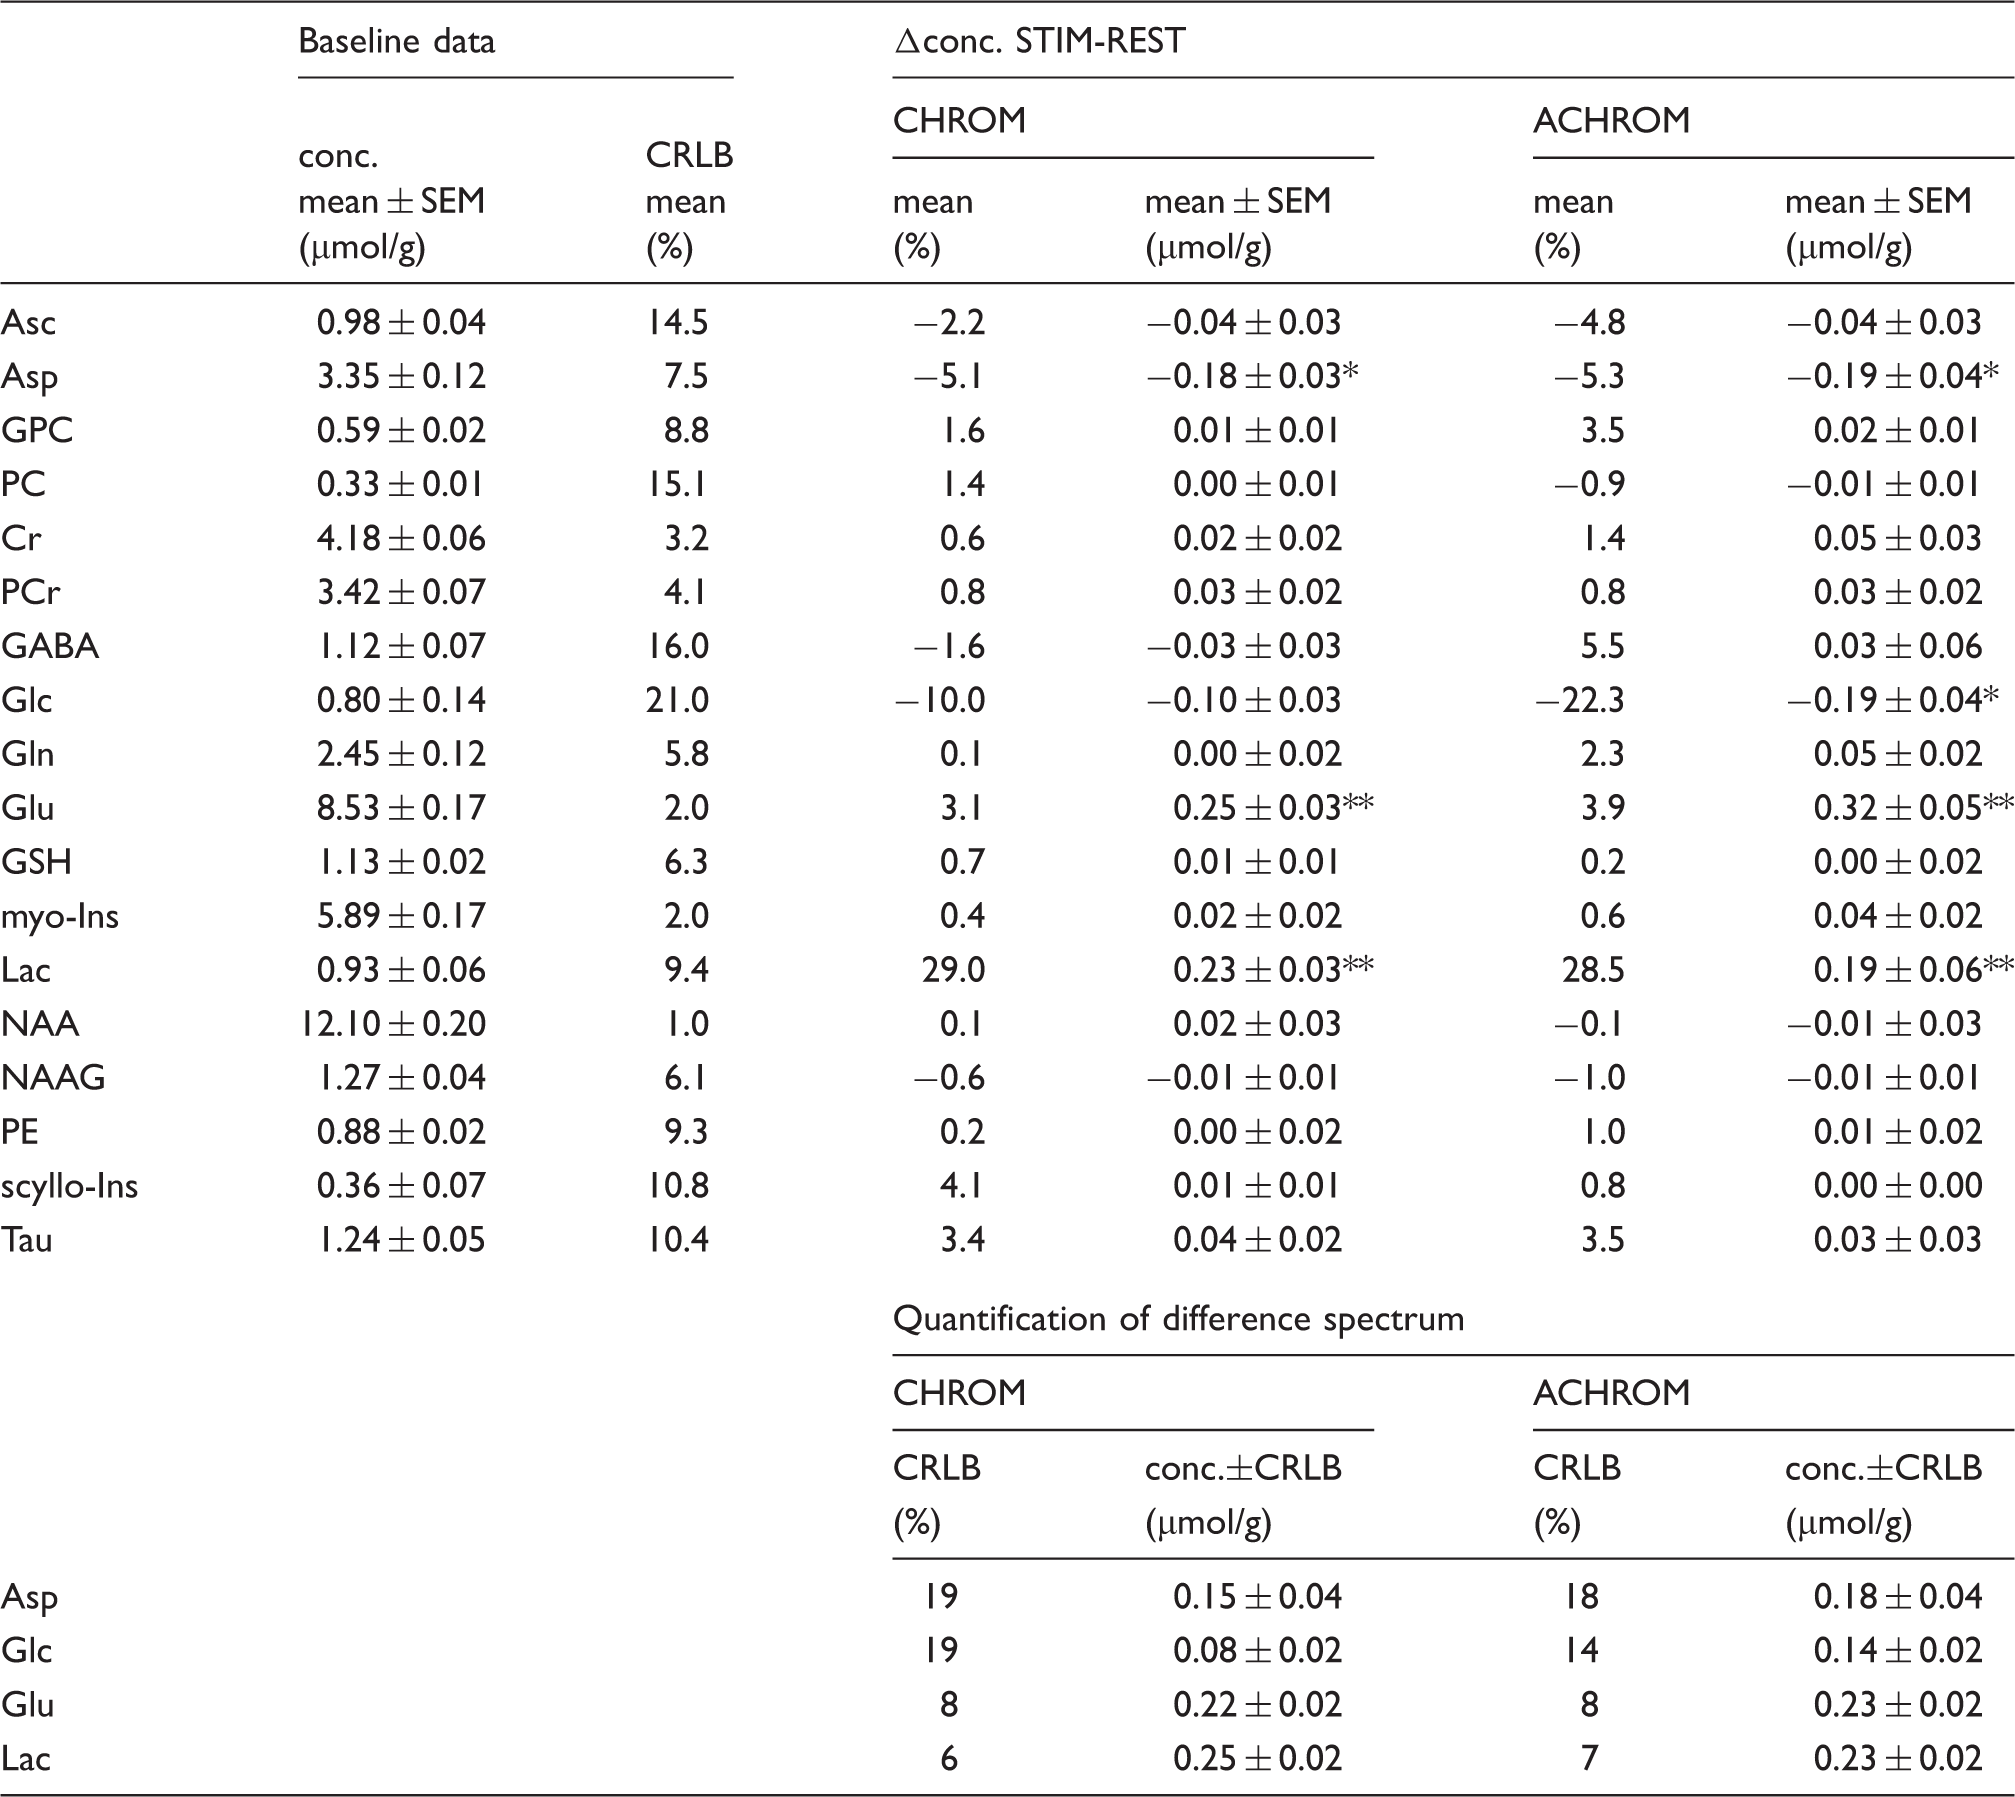
Note: The upper panel of the table reports average steady-state metabolite concentrations under the baseline REST condition and their changes (STIM-REST) and percent changes ((STIM-REST)/REST) induced by chromatic (CHROM) and achromatic (ACHROM) stimulations averaged across 12 subjects and 2 sessions. Statistics: t-test followed by the FDR analysis for multiple testing (18 metabolites, probability of false discovery = 5%), levels of significance: **p < 0.0006, *p < 0.006. The lower panel of the table reports metabolite responses quantified from the difference spectra (Figure 5). The Cramér-Rao Lower Bounds (CRLB) provided by LCModel were used as estimates for quantification errors.
The difference 1H MR spectra characteristic for chromatic and achromatic stimulation were generated as follows. First, fMRS data of all 12 subjects and 2 session were summed for the STIM (either CHROM or ACHROM) and corresponding REST periods. In the second step, the summed 1H MR spectrum of the STIM period (CHROM or ACHROM) was linewidth matched to the corresponding REST period spectrum and finally the STIM and REST spectra were subtracted. The BOLD-effect free difference spectra (CHROM and ACHROM) were quantified using LCModel with a modified basis set that included only four metabolites (Glu, Lac, Asp and Glc). Spectra of Asp and Glc were inverted since decrease in their concentrations was expected.
Statistical analysis
Stimulus-induced metabolic changes
For each metabolite, we had two a priori hypotheses to test: (1) whether the stimulations induced significant metabolic responses, i.e. whether each of the between-session averaged changes in metabolite concentration (stimulus versus rest) were significantly different from zero, and (2) whether the metabolic responses to the 2 stimuli were different, i.e. whether the between-stimuli differences were significantly different from zero. These tests were carried out using contrasts from a linear mixed model (per metabolite) on the concentration difference from REST, with fixed effects for session (first or second), condition (CHROM or ACHROM), and their interaction, and random effects for subject. For each hypothesis, the likelihood of false positive results arising from multiple testing across the 18 reliably quantified metabolites was limited to a 5% false discovery rate (FDR).
Stimulus-induced BOLD-fMRI responses
In order to evaluate the BOLD-fMRI responses in the two stimulation conditions, we followed the logic of the fMRS data analysis: each of BOLDfraction and BOLDampl obtained per session and stimulus were averaged among sessions and compared between the two stimulation conditions by the standard two-tailed-paired t-test.
Correlations between metabolic changes and BOLD-fMRI responses
To assess the relationship between functional metabolic concentration changes and BOLD-fMRI, Pearson’s correlation analysis was applied to correlate between-session averaged BOLDampl with the between-session averaged metabolite responses (to CHROM and ACHROM conditions separately) per metabolite. The between-stimulus and between-session consistency of the BOLD-fMRI measurements was assessed similarly.
Estimation of sensitivity of the study design (with and without scaling for BOLD variability)
To estimate the sensitivity of our design to reveal differences in metabolic responses to CHROM and ACHROM conditions, the minimal detectable concentration differences were calculated by a post hoc power analysis (power = 0.8, type I error = 0.05), which used the observed inter-subject standard deviations of the stimulus-evoked metabolite responses. In our previous report, 13 we observed a reliable correlation between Δ[Glu] and the amount of BOLD-fMRI activation, indicating that the inter-subject variance of the BOLD-fMRI can substantially contribute to the inter-subject variance in metabolic responses. Hence, taking the variance in the amount of neuronal activation into account, we used the between-session averaged BOLDampl to scale the respective between-session averaged metabolite responses to CHROM and ACHROM stimuli and thus adjusted them to the partial volume effect as we suggested previously. 13 Finally, the scaled metabolite responses were used to calculate scaled detectable concentration differences using the same post hoc power analysis approach.
Assessment of spectral quality and reproducibility
The signal-to-noise ratio (SNR) was calculated in the frequency domain as the ratio of the NAA singlet height to the root mean square of the noise using the fMRS data acquired during the first REST period of the visual paradigm (Figure 1). Linewidth (LW) of the unsuppressed water signal was used to characterize the spectral quality. Between-subject variation of the SNR and LW were expressed as coefficients of variation (CV). In addition, between-session (test-retest) CV of the SNR and LW was calculated per subject and then averaged among subjects. The between-subject CVs and average between-session CVs were obtained using the spectra acquired during the REST conditions following the STIM period for each of two sessions and two conditions. The SDs of metabolite concentrations calculated across subjects and across sessions within subjects were used to compare between-subject and average between-session variation of metabolite concentrations in absolute concentration units.
Results
BOLD-fMRI responses to chromatic and achromatic visual stimulation
The amplitude of the BOLD response, averaged across the VOI selected for fMRS, was similar for CHROM (2.70% ± 1.03%) and ACHROM (2.96% ± 1.12%) stimulation. Also, the average fraction of activated voxels (BOLDfraction) was similar between CHROM (35% ± 13%) and ACHROM (38% ± 15%) stimulations. More importantly, each of these parameters (BOLDampl and BOLDfraction) showed a strong correlation between CHROM and ACHROM stimulation (Figure 2) and the paired comparison between these conditions was not significantly different for either parameter. These results confirmed that the setting of the ACHROM checkerboard contrast was appropriate to meet the paradigm requirements. The relatively high between-subject CV of the BOLDampl (∼38% for both stimulation conditions) was consistent with our previous results,
13
where we demonstrated that this finding is mostly unrelated to the VOI position. Hence, the between-subject variance of the BOLD-fMRI response is presumably linked to multiple other factors such as variation of the baseline brain activity
28
and other effects of non-neural origin.
29
A reasonably strong correlation between session 1 and session 2 of each average BOLD-fMRI response (BOLDampl, r = 0.56, r2 = 0.31, p = 0.06; BOLDfraction, r = 0.85, r2 = 0.72, p = 0.0005) demonstrate the inter-subject reproducibility of brain activation for this visual paradigm.
30
The within-session movement measured on the EPI time-series was below 1 mm and 1 degree in all directions in all 24 sessions. Since the motion was smaller than the voxel size of (2.5 mm)3 and much smaller than the fMRS VOI size of (2 cm)3, no movement correction was applied on EPI images.
Comparison of BOLD-fMRI signals evoked by chromatic (CHROM) and achromatic (ACHROM) stimulations. The between-session (within subject) averages of BOLD-fMRI amplitude (a) and BOLD-fMRI fraction of activated voxels (b) were averaged across the volume selected for fMRS. Pearson’s correlation coefficient R and corresponding p-values are reported, the dashed lines indicate lines of identity.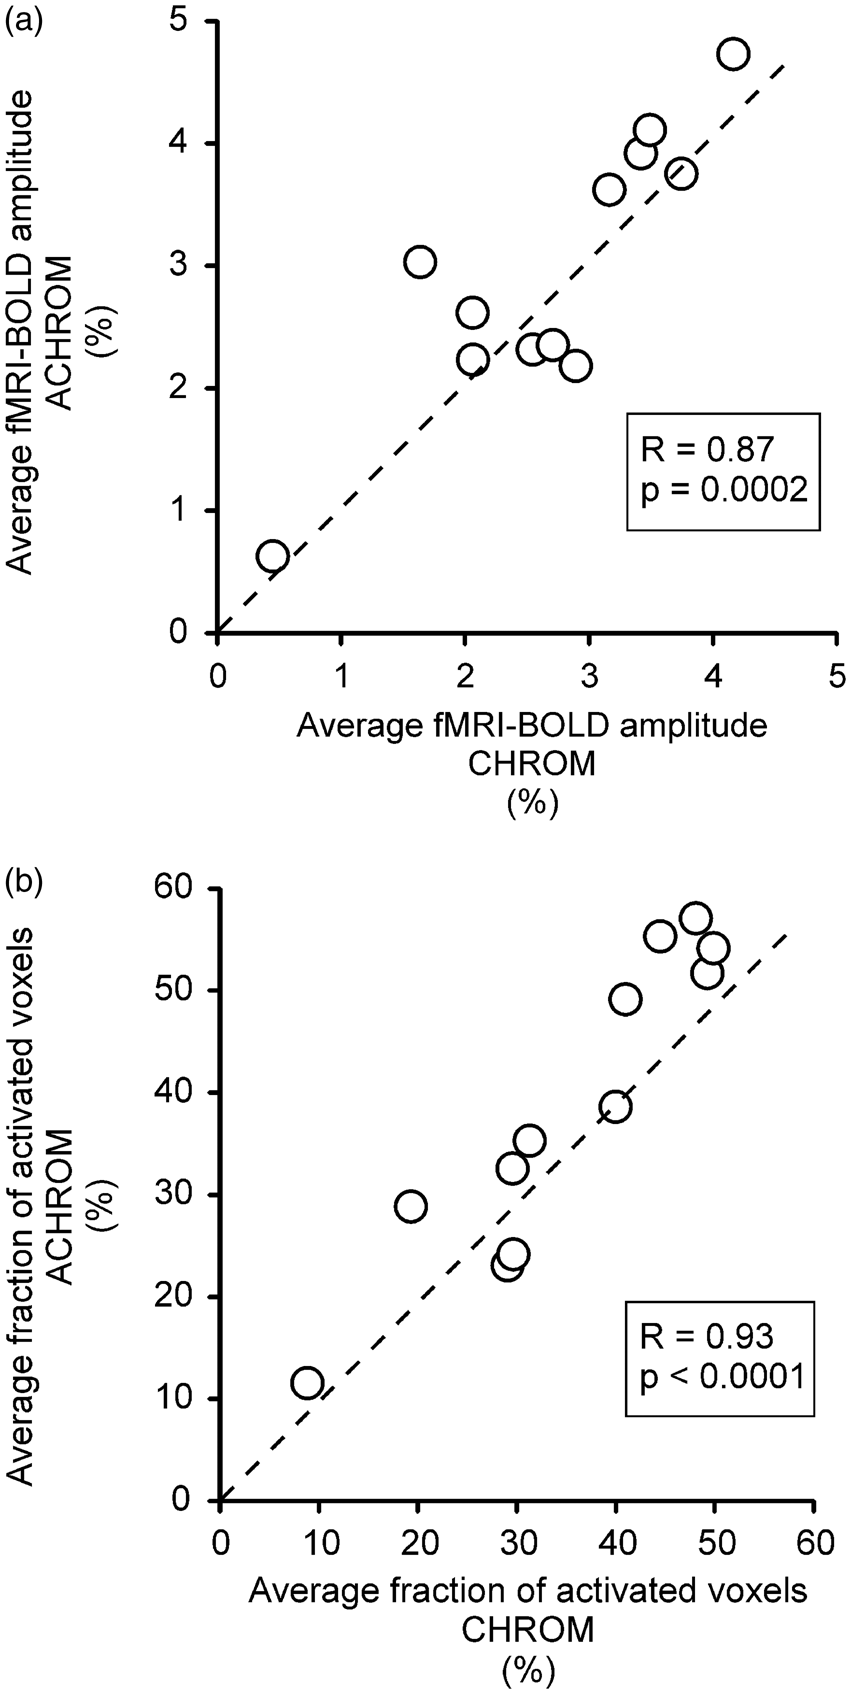
Quantification of metabolite concentrations and their changes in response to chromatic and achromatic visual stimulation
The combination of high magnetic field (7 T), sensitive RF coil, highly efficient B0 shimming, and full signal intensity semi-LASER localization sequence
20
allowed us to acquire clean, artifact free 1H MR spectra with high spectral resolution and SNR (Figure 3). In response to CHROM and ACHROM stimulation, highly significant concentration changes on the order of 0.2 µmol/g were observed for Glu, Lac, and Asp (summarized in Figure 4 and Table 1), which was in excellent agreement with our previous findings.10,13 A glucose concentration decrease was also observed during both types of stimulations. The model-predicted Glc decrease reached statistical significance during ACHROM stimulation (p = 0.0004), but showed only a trend during CHROM stimulation (p = 0.07). No significant functional concentration changes were observed for the remaining 14 metabolites.
Representative 1H MR spectra acquired in one fMRS session during four periods, CHROM and subsequent REST (a), ACHROM and subsequent REST (b) (see Figure 1). These 1H MR spectra illustrate the spectral quality routinely achieved in this study (semi-LASER, TE = 26 ms, TR = 5 s, number of scans = 32, VOI = 2 × 2 × 2 cm3). Top traces show the difference spectra (STIM – REST). The residual peaks at 2 and 3 ppm originate from the linewidth difference between STIM and REST spectra. Small concentration changes of lactate (1.3 ppm) and glutamate (∼2.4 ppm) are also discernible in the difference spectra. Gaussian apodization was used for display purposes (σ = 0.17 s) Insets: MPRAGE images with overlaid fMRI maps show the position of the VOI selected for fMRS. Model-predicted effect of stimulations at steady state, quantified from the visual cortex for four different conditions of the visual stimulation paradigm. Error bars indicate SEM. Significance levels for changes from rest (FDR-corrected p-values from the linear mixed models, n = 12 for all metabolites except for Glc where n = 10) were *p < 0.006, **p < 0.0006. No significant difference was observed between changes induced by CHROM and ACHROM stimulations.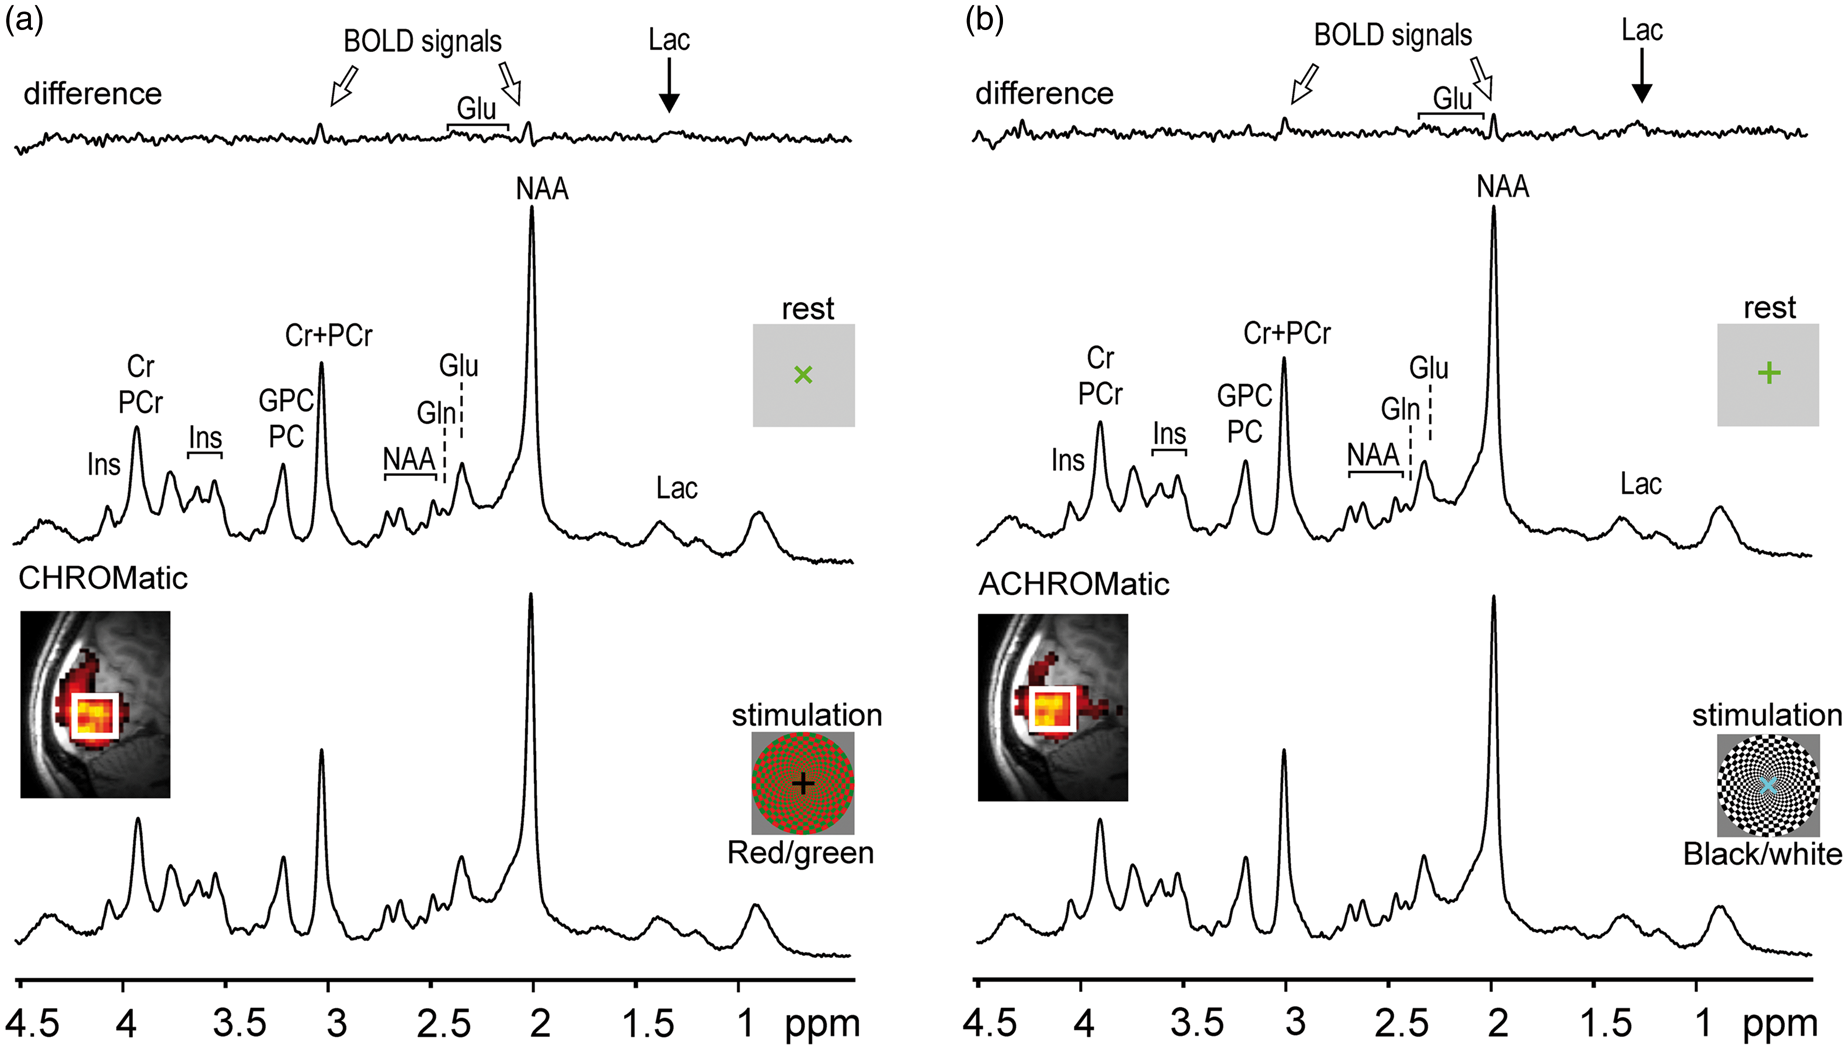
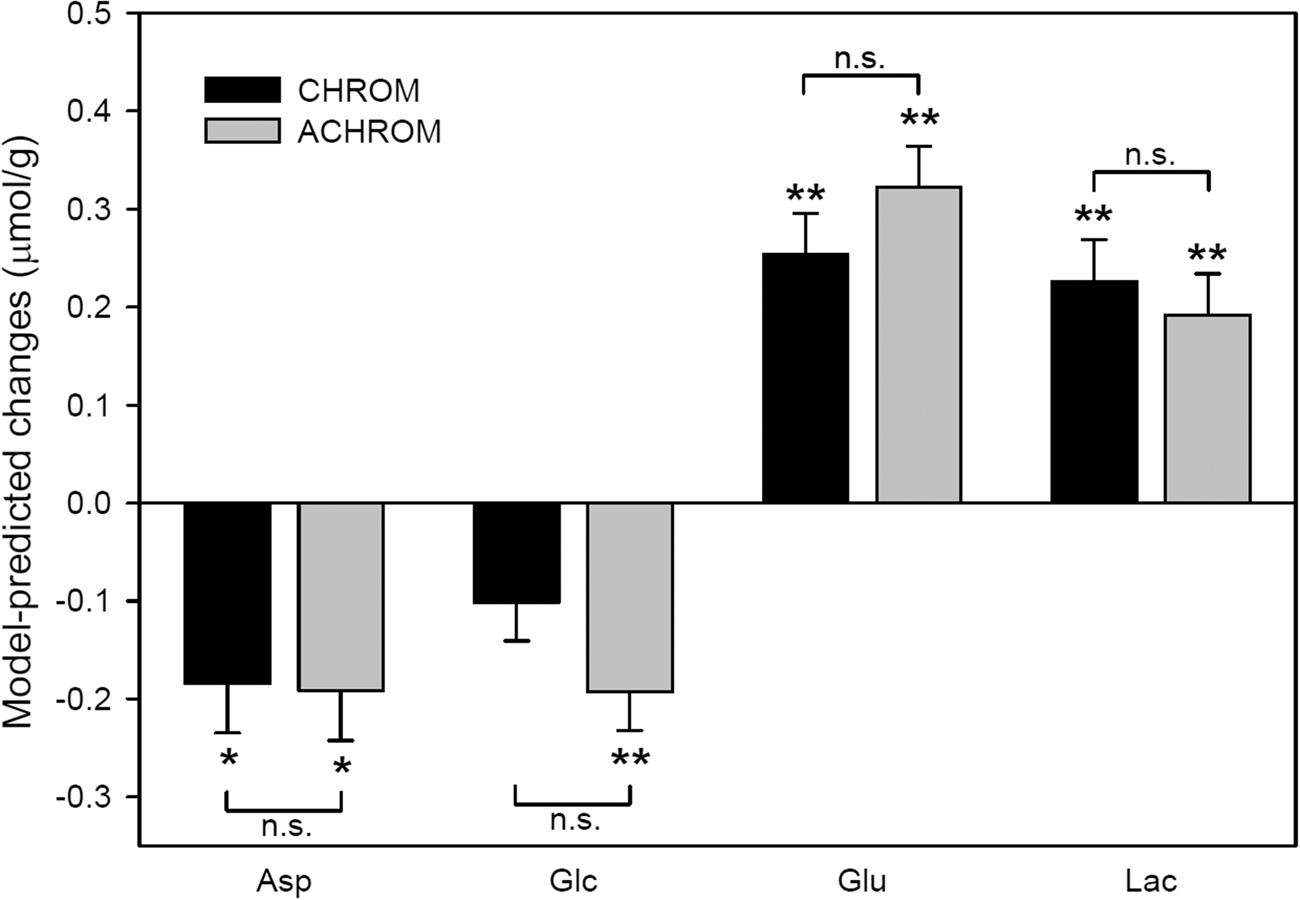
Finally, the metabolite responses to CHROM and ACHROM stimulation were compared to each other (Table 1, upper panel). We did not find any evidence for different responses to CHROM vs. ACHROM stimuli for any of the 18 metabolites (all FDR corrected p > 0.93). The minimal detectable concentration differences (power = 80%, alpha = 5%) were estimated to be 0.12 µmol/g, 0.20 µmol/g, 0.18 µmol/g, and 0.22 µmol/g for Asp, Glc, Glu, and Lac, respectively. However, these values were comparable to the observed concentration responses to CHROM and ACHROM stimulation (see Table 1 for group-averaged values and Figure 4 for model-predicted values). With the goal of reducing variance in the fMRS data, the metabolite responses to CHROM and ACHROM stimuli were scaled by the BOLDampl obtained during the corresponding stimulation condition. The scaled responses of Glu to CHROM and ACHROM stimuli were 0.10 ± 0.02 µmol/g and 0.11 ± 0.01 µmol/g (mean ± SEM), respectively. Similar scaled responses were observed for Asp (−0.07 ± 0.01 µmol/g vs. −0.06 ± 0.02 µmol/g), Glc (−0.09 ± 0.07 µmol/g vs. −0.07 ± 0.02 µmol/g) and Lac (0.14 ± 0.06 µmol/g vs. 0.08 ± 0.02 µmol/g). The scaling decreased the between-subject variance in Glu responses from 52% to 42% (variance expressed as the average of the between-subject CVs in Glu responses to CHROM and ACHROM). The corresponding estimate of the minimal detectable scaled concentration difference between stimuli for Glu was 0.065 µmol/g (power = 80%, alpha = 5%), which was 62% and 61% of the averaged Glu responses to CHROM and ACHROM stimulation, respectively. Finally, our observed difference in scaled response to each of the stimuli was only 0.002 µmol/g.
Assessment of spectral quality and reproducibility
The average SNR of acquired 1H MR spectra with 32 scans was 313 ± 21 (mean ± SD, 12 within-subject averages of SNR), which corresponded to a between-subject CV of 7%. The between-session CV in spectral SNR averaged across subjects was only about 3%. The FASTMAP B0 shimming consistently provided high resolution spectra, demonstrated by an LW of 13.8 ± 0.8 Hz (mean ± SD, 12 within-subject averages, between-subject CV = 6%). The between-session CV of the LW averaged across subjects was below 3%. Except for Glc, all other 17 metabolites were quantified with averaged between-session SDs (12 subjects, 4 REST periods, 2 sessions) below 0.2 µmol/g. For Glu, the most sensitive fMRS marker of the brain activity, the averaged between-session SD was only 0.1 µmol/g. Observed between-session SDs of all quantified metabolites except Glc and Lac corresponded closely to average CRLBs (see Figure 1(a) in the Supplements). Notably, the between-subject SDs and CVs of most metabolites were substantially higher than the between-session SDs and CVs (see Figure 1(b) in the Supplements). This observation was consistent with the high reproducibility of the voxel placement between sessions achieved in this study (overlap = 75.7% ± 12.5%, mean ± SD), which implied similar voxel distributions of gray matter and white matter volumes between sessions.
Relationship between fMRI-BOLD and neurochemical responses to visual stimulation
The BOLDampl correlated significantly with metabolic response to stimuli, specifically for Δ[Glu] (Pearson’s r = 0.64, p = 0.0008) and Δ[Asp] (r = 0.42, p = 0.04), when responses to CHROM and ACHROM were pooled (n = 24). When neurochemical and BOLD-fMRI responses to CHROM and ACHROM stimulations were analyzed separately (n = 12), for Δ[Glu], significant correlation was observed for ACHROM (r = 0.75, p = 0.007), whereas the correlation was smaller for CHROM (r = 0.43, p = 0.16). These correlations were not significantly different between CHROM and ACHROM (p = 0.26, two tailed test), 31 thus these data do not support substantial inter-stimulus differences in the coupling of metabolism and hemodynamics. For all other metabolites, the Pearson’s correlations did not reach the significance threshold (p > 0.05).
Analysis of pooled difference spectra
In order to increase the detection sensitivity of the used fMRS method for detecting possible differences between metabolic responses to CHROM and ACHOM stimulation, changes in steady-state metabolite concentrations were also assessed from two difference spectra using fMRS data pooled across all subjects (Figure 5). Before the pooled spectra were quantified using LCModel, the line-narrowing effect of BOLD was removed by appropriate line-broadening (exponential multiplication) of the fMRS data acquired during CHROM and ACHROM stimulation periods by 0.34 and 0.32 Hz, respectively. The appropriate line-broadening was selected by minimizing the subtraction artifact of the Cr (at 3 ppm) and NAA (at 2 ppm) singlets. Concentration changes in Asp, Glu and quantified from the difference spectra were approximately 0.2 µmol/g (Table 1, lower panel) and were in a very good agreement with results from the LCModel analysis of individual subjects’ data. Estimated changes in Glc concentration were below 0.15 µmol/g during both conditions. Lac and Glu were quantified from the difference spectra with CRLB ≤ 8%, whereas Asp and Glc were quantified with a reduced precision (CRLBs < 20%). According to the main goal of the study to compare metabolic responses to CHROM and ACHROM stimulations, the inter-stimulus differences were assessed from the pooled difference spectra. Quantified differences between metabolic responses to CHROM and ACHROM stimulations were below 0.03 µmol/g for Glu and Lac (Table 1, lower panel). These values were lower than the estimated errors of differences between responses to CHROM and ACHROM stimuli (0.04 µmol/g), which were determined using the error propagation approach (the sum of estimated quantification errors, CRLB).
LCModel analysis of the difference spectra for chromatic (a) and achromatic (b) stimulations. The difference spectra were generated by summing all corresponding fMRS data from 12 subjects and both sessions. The differences between spectra acquired during STIM (CHROM or ACHROM) and subsequent REST condition (see Figure 1) are shown in upper traces. The narrow peaks at 2 and 3 ppm originate from linewidth difference between STIM and REST spectra. BOLD free difference spectra (middle traces) were generated by subtracting REST from STIM spectra after linewidth matching. Bottom traces represent the LCModel fits of the BOLD free difference spectra. Gaussian multiplication (σ = 0.1) was applied on “in vivo” and “BOLD free” spectra only for a display purpose.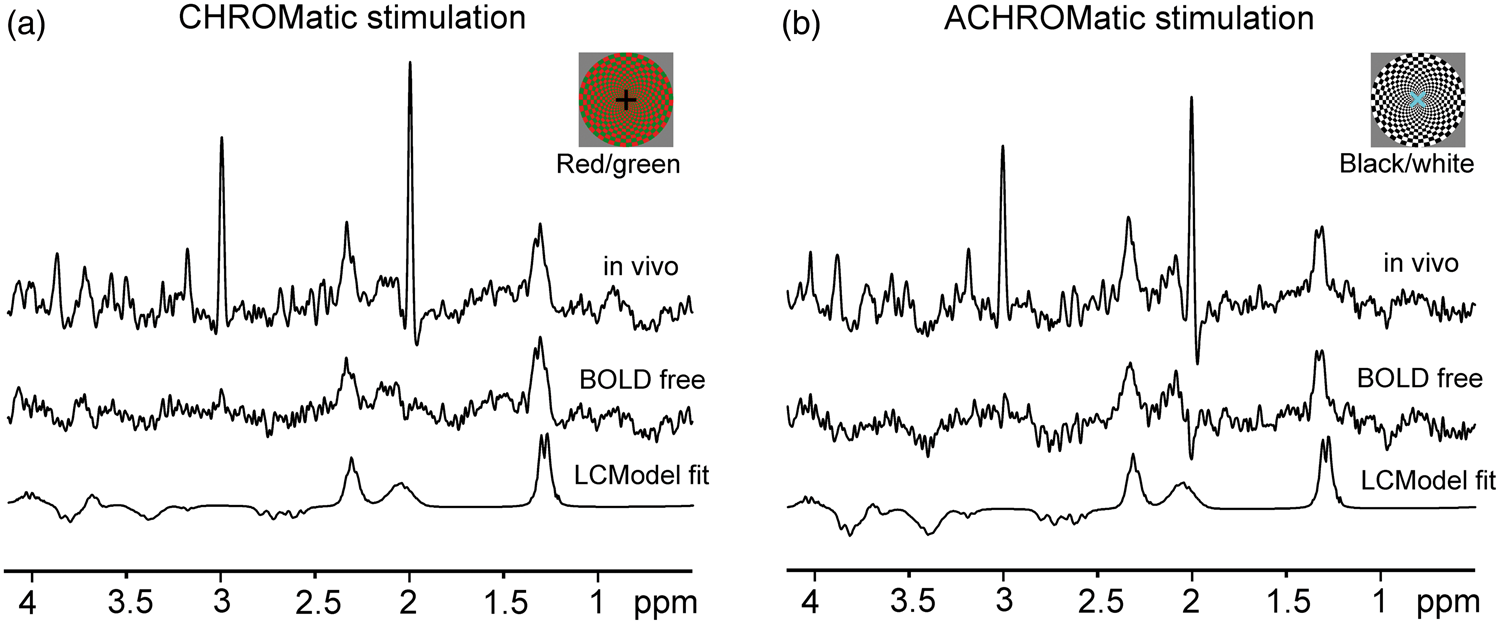
Discussion
The present study characterized the neurochemical responses to selective activation of blob and interblob neuronal populations that was achieved by chromatic or achromatic stimulation. The contrast of these stimuli was calibrated to produce comparable net amounts of neuronal activation as revealed by BOLD-fMRI responses. The increases in steady-state concentrations of Lac and Glu during physiological neuronal activation have been shown to be tightly coupled (approximately in a 1:1 ratio). It was proposed that changes in Lac and Glu concentration indirectly probe different events of the same glucose oxidation cascade.13,32 This coupling could be altered if a differential upregulation of glycolysis and tricarboxylic acid (TCA) cycle is induced. Since different COX content1,2 and level of micro-vascularization 3 of blobs and interblobs indicate different capacities of oxidative metabolism, selective activation of blob and interblob populations could result in distinct metabolic responses if brain energetic metabolism is constrained, 33 or at least influenced by its overall aerobic capacity. 2 Thus, we hypothesized that the potential changes in the balance between glycolysis and Glc-oxidation can be probed by fMRS through evaluation of the whole fingerprint of metabolic changes induced by the stimuli.10,13 In this context, for simplicity, one can regard Glu concentration changes as a marker of Glc-oxidation and lactate changes as a marker of Glc-oxidation and glycolysis together, with deviations from the 1:1 ratio of the Glu/Lac changes being reflective of different underlying metabolisms.
The choice of red and green vs. yellow and blue isoluminant checkerboard to selectively activate blobs was based on electrophysiological findings 8 demonstrating that blob neurons preferentially sensitive to red and green stimulus outnumbered neurons sensitive to blue and yellow. Functional studies conducted with optical imaging also demonstrated that red and green opponent colors generate color selective maps with greater consistency as compared to blue and yellow stimuli. 9
The fMRS paradigm of the current study (Figure 1) was designed to maximize the sensitivity to detect possible differences in metabolite responses to chromatic and achromatic stimulations. Based on the results of our previous fMRS studies,10,13 we knew that for a reliable detection of metabolite concentration changes as small as 0.2 µmol/g, we would need to acquire fMRS data for at least 5 min for each of stimulation and rest conditions. In addition, we needed extra time to allow brain metabolism to change from one steady state to the other (STIM to REST and vice versa). In order to keep the duration of the fMRS experiment below 30 min, we decided to use a two-session design (Figure 1) with randomized order of the chromatic and achromatic stimulation. This study design allowed us not only to pool corresponding data from two sessions of each subject, but also to investigate between-session reproducibility of metabolite quantification. This type of test-retest experiment provided an opportunity to estimate the limits of metabolite detection sensitivity. Low coefficients of variation for parameters characterizing the spectral quality (SNR, LW) demonstrate the consistency of achieving high spectra quality throughout the study (Figure 3). As expected, between-session CVs (3% for SNR and 3% for LW) were lower than between-subject CVs (7% for SNR and 6% for LW). In addition, the average between-session CVs of quantified metabolites were similar to the estimated quantification errors (CRLB) for most metabolites, e.g. 1.6% vs. 2% for Glu and 6% vs. 7.5% for Asp. For most metabolites, the within-subject CVs of metabolite concentrations quantified for the visual cortex were lower than corresponding values recently reported from other brain regions. 34 These improvements are likely due to higher sensitivity of the half-volume quadrature RF coil used in this study and due to better B0 field uniformity achievable in V1 compared to other brain areas.
Confirming the robustness of our study design, the detected concentration changes of Glu, Lac, and Asp were highly significant in response to both CHROM and ACHROM stimulations (Figure 4), in excellent agreement with previous findings.10,13 The assessment of glucose response was less precise, which was expected due to well documented difficulties to quantify this metabolite at 7 T.34–36 Despite using higher CRLB limits for Glc, it was quantified only in 10 subjects. In addition, the concentration of Glc was systematically underestimated. 13 Significant changes in concentration of other metabolites were not observed during either chromatic or achromatic stimuli, including metabolites like GABA, GSH, and Gln which instead were reported to change during achromatic stimulations by another group. 11 This small discrepancy with previous reports might be caused by methodological differences in fMRS data processing, such as spectral linewidth matching used in our previous study 13 as well as in this paper.
Statistically significant differences between metabolic responses to chromatic and achromatic stimulations were not detected, while a similar extent of neuronal activation was achieved (Figure 2). These findings are consistent with recent human studies carried-out in vivo, which reported no differences in oxidative metabolism between CHROM (blob) and ACHROM (interblob)17,37 as assessed by estimated changes in CMRO2 calculated with mathematical modeling from BOLD-fMRI and CBF-fMRI 17 measurements. Similarly, no differences in the oxidative metabolic response were demonstrated with COX redox changes measured by near infrared spectroscopy, 37 albeit the capability of the method to measure such changes remains controversial.
Since we did not observe significant differences between metabolite responses to chromatic and achromatic stimulation, which would indicate differences between blob and interblob metabolic pathways supporting the energy demands, it is critical to assess the sensitivity of our method and to estimate a lowest threshold for detecting differences in metabolic responses. Two different approaches were utilized to assess the sensitivity limits of fMRS to detect possible differences in metabolic responses. First, concentration differences between stimulation and rest were scaled by BOLD amplitude, and minimal detectable scaled concentration differences were calculated. The purpose of the scaling was not to estimate the real concentration changes in the neuronal tissue, but to take into account the different amount of activation across subjects in order to provide more realistic inter-subject variance of metabolite concentration changes. Glu changes have been considered a reliable marker of activated oxidative metabolism 13 and were thus used to provide this sensitivity estimate. Similar to a previous report, 13 we also found a correlation between ΔGlu and BOLDampl, which demonstrates reliable detection of Glu changes at the subject level. Indeed, scaling the Glu response by the BOLD amplitude decreased the inter-subject variance of Δ[Glu] and in turn, increased the precision in estimating the detection sensitivity of between-stimuli differences. With the scaled data, the detection sensitivity was estimated at ∼60% of the measured Glu response. Second, the estimated error of LCModel quantification of the difference spectra (Figure 5, Table 1) was utilized for estimating the sensitivity to detect differences between chromatic and achromatic stimuli from the pooled spectra analysis. For Glu and Lac, the estimated lower limit to discriminate differences between stimuli was around 16% of the measured Glu response (∼0.04 µmol/g). Therefore, we suggest that metabolic difference between stimuli higher than such threshold should have been detectable by the LCModel analysis of the difference spectra. The detection sensitivity threshold, estimated from the between-subject SD of metabolite quantification, was substantially higher. This can be explained by the challenge of quantifying very small signal differences from highly overlapping spectra of other metabolites and underlying broad signals of fast relaxing macromolecules. On the other hand the analysis of the difference spectra is relatively more straightforward, because superimposed spectra of metabolites that do not change as well as those of macromolecules are subtracted out, which consequently increases the detection sensitivity for Lac and Glu. Therefore, we assume that the difference spectra approach provides a more realistic estimate for the detection sensitivity limit of the used fMRS method to discriminate between metabolic responses to different stimuli. Notably, the inter-stimulus differences in Lac (0.02 µmol/g) and Glu (0.01 µmol/g) concentration (Table 1) were well below the estimated sensitivity threshold of 0.04 µmol/g.
One limitation of our study is its inability to assess the metabolism of blob and interblob neuronal populations at baseline. The COX levels in the human brain are related to the average level of the neuronal activity, 38 and it is thus conceivable that the baseline levels of metabolism are different between the two neuronal populations. Such differences, however, cannot be appreciated by fMRS or fMRI, 17 since the measured outcomes of fMRS and fMRI are relative to STIM minus REST conditions and cannot quantify metabolism in absolute terms. Another potential limitation relates to the chosen visual stimuli. In fact, some authors suggested that color is an image feature which is not processed in parallel to other image characteristics. 39 Therefore, the widely used model originally introduced by Livingstone and Hubel 40 and Sincich and Horton 41 where the color and form were considered as modules processed by separate cell populations, might be inaccurate 42 to induce selective stimulation of blob and interblob populations. Finally, a potential limitation of our study was the lack of assessment of before-scanning conditions of our subjects (such as drug/smoking exposure, menstrual cycle, etc.), which may contribute to the variability of metabolite concentrations at baseline, BOLD amplitudes and ultimately functional metabolic changes. However, our study was designed to assess differences in metabolic responses to chromatic and achromatic stimuli both acquired within each session, and therefore it was expected to minimize the contribution of before-scanning conditions. The fact that the study could reach a remarkable sensitivity to exclude between-stimuli differences (for instance above 0.04 µmol/g for Glu as estimated by the analysis of the difference spectra) confirms that before-scanning conditions did not play a significant role in this study.
Conclusions
Despite the different oxidative metabolic capacity of the blob and interblob neuronal populations, the changes in metabolite levels that indirectly probe the energy production flux were indistinguishable between chromatic and achromatic stimulation within the detection sensitivity limits of the fMRS technique.
Footnotes
Funding
The author(s) disclosed receipt of the following financial support for the research, authorship, and/or publication of this article: This research has been financially supported by the Ministry of Education, Youth and Sports of the Czech Republic under the project CEITEC 2020 (LQ1601), and by the grants NIH 1R03NS082541 (to SM), NIH, P41 EB015894 and P30 NS076408 (to Center for Magnetic Resonance Research). The content is solely the responsibility of the authors and does not necessarily represent the official views of the National Institutes of Health. FG was partially supported by Regione Lazio [grant PAMINA].
Acknowledgements
The authors are grateful to their research volunteers for their participation, and to Michelle Hartwig for helping with subject recruitment. The authors also thank Andrea Grant for helping with the visual stimulation setup.
Declaration of conflicting interests
The author(s) declared no potential conflicts of interest with respect to the research, authorship, and/or publication of this article.
Authors’ contributions
Petr Bednarik was involved in the execution of the experiments, analysis, and interpretation of the data, and drafting and revising of the manuscript. Ivan Tkac was involved in analysis and interpretation of the data, and drafting and revising of the manuscript. Federico Giove was involved in analysis and interpretation of the data, and revising of the manuscript. Lynn Eberly was involved in analysis of the data, and revising of the manuscript. Dinesh K Deelchand and Felipe R Barreto were involved in in the execution of the experiments, analysis of the data and revising of the manuscript. Silvia Mangia was involved in study supervision and obtaining funding, in the concept and design of the study, in the interpretation of the data, in drafting and revising of the manuscript.
References
Supplementary Material
Please find the following supplemental material available below.
For Open Access articles published under a Creative Commons License, all supplemental material carries the same license as the article it is associated with.
For non-Open Access articles published, all supplemental material carries a non-exclusive license, and permission requests for re-use of supplemental material or any part of supplemental material shall be sent directly to the copyright owner as specified in the copyright notice associated with the article.