
Abstract
One promising approach for mapping CMRO2 is dual-calibrated functional MRI (dc-fMRI). This method exploits the Fick Principle to combine estimates of CBF from ASL, and OEF derived from BOLD-ASL measurements during arterial O2 and CO2 modulations. Multiple gas modulations are required to decouple OEF and deoxyhemoglobin-sensitive blood volume. We propose an alternative single gas calibrated fMRI framework, integrating a model of oxygen transport, that links blood volume and CBF to OEF and creates a mapping between the maximum BOLD signal, CBF and OEF (and CMRO2). Simulations demonstrated the method’s viability within physiological ranges of mitochondrial oxygen pressure, PmO2, and mean capillary transit time. A dc-fMRI experiment, performed on 20 healthy subjects using O2 and CO2 challenges, was used to validate the approach. The validation conveyed expected estimates of model parameters (e.g., low PmO2), with spatially uniform OEF maps (grey matter, GM, OEF spatial standard deviation ≈ 0.13). GM OEF estimates obtained with hypercapnia calibrated fMRI correlated with dc-fMRI (r = 0.65, p = 2·10−3). For 12 subjects, OEF measured with dc-fMRI and the single gas calibration method were correlated with whole-brain OEF derived from phase measures in the superior sagittal sinus (r = 0.58, p = 0.048; r = 0.64, p = 0.025 respectively). Simplified calibrated fMRI using hypercapnia holds promise for clinical application.
Keywords
Introduction
Oxidative metabolism provides most of the brain’s energy and is altered in a variety of pathologies such as neurodegenerative and neuroinflammatory diseases, stroke, epilepsy, and migraine. 1 Magnetic resonance imaging (MRI) approaches for mapping baseline (0) cerebral metabolic rate of oxygen (CMRO2,0)2–8 exploit the Fick Principle, that expresses CMRO 2 as the product of oxygen delivery (the product of oxygen concentration in arterial blood, CaO2, and cerebral blood flow, CBF) and oxygen extraction fraction (OEF) measured in either the macrovascular or the microvascular compartment. Macrovascular CBF0 can be estimated from volume flow rate in large feeding arteries or draining veins using flow encoding sequences, 2 whereas OEF0 can be assessed in draining veins using sequences that measure magnetic susceptibility or blood T2 predominantly affected by the presence of deoxyhemoglobin (dHb).8,9 Since large vessels feed or drain significant portions of brain, such measures deliver global or regional information at best. Microvascular CBF0 can be mapped using perfusion-weighted sequences such as Arterial Spin Labelling (ASL). One drawback of ASL is its low contrast in white matter (WM). Moreover, mapping microvascular OEF0 is challenging because baseline magnetic susceptibility and MR relaxation parameters within a voxel with a small vascular compartment are not uniquely affected by dHb.
Among others,10,11 dual-calibrated functional MRI (dc-fMRI)4,12–15 is a promising approach for OEF0 and CMRO2,0 mapping. While measuring CBF0 with ASL, dc-fMRI estimates OEF0 from the blood oxygen level dependent (BOLD) signal sensitivity to dHb0. dc-fMRI uses BOLD-ASL recordings, biophysical modelling of BOLD signal 16 and assumed isometabolic hypercapnic and hyperoxic modulations of CBF and CaO2 through respiratory stimuli. BOLD sensitivity to dHb0 is encoded in the maximum BOLD increase, M, corresponding to complete dHb removal. The two respiratory stimuli decouple the contribution to M of OEF0 and the dHb0-sensitive cerebral blood volume, CBVv,0, when Hb concentration in blood [Hb]4,14 is known. Although dc-fMRI has been applied in exemplar clinical studies,17–21 its adoption is limited by the low signal to noise ratio (SNR) 22 and by the complex gas challenge paradigm required.
Here, we introduce a new calibrated fMRI framework that estimates OEF0 with only one measurement of M based on one manipulation of brain physiology and a flow-diffusion model of oxygen transport.13,23,24 The model describes the steady-state oxygen diffusion from the capillaries into the tissue (equal to CMRO2) as proportional to the product of the mean capillary transit time (mean CTT, MCTT) and the pressure gradient between the capillary bed and the mitochondria (where the proportionality constant is the effective tissue permeability to oxygen, k). Since MCTT can be expressed as the ratio between capillary blood volume (CBVcap) and CBF, the flow-diffusion model can be incorporated in the formulation of M by substituting CBVv,0 for an appropriately scaled CBVcap,0 (with ρ being the scaling factor). This substitution replaces one unknown variable, CBVv,0, with two unknowns, one proportionality constant, being a function of ρ and k, and the oxygen pressure at the mitochondria (PmO2,0). The advantage of the model lies in the tight distributions of the new parameters and on the reduced effect of their variabilities in the estimate of OEF0, creating a probabilistic mapping of M, CaO2,0 and CBF0 with OEF0 and CMRO2,0 as the parameters to be inferred.
This manuscript reports the validation of the novel single gas approach. We term the new approach using a hypercapnic stimulus, hc-fMRI+, and that using a hyperoxic stimulus, ho-fMRI+. The report is divided into four sections. The first section, by exploiting simulations, describes the advantages, the validity, and the robustness to noise of the framework. The second section investigates the new model in-vivo using a dc-fMRI experiment, employing alternating hypercapnic and hyperoxic gas challenges in healthy subjects. We use a global estimate of OEF0 in the grey matter (GM), obtained with dc-fMRI analysis, 22 and we invert the single gas model using only the hypercapnic or the hyperoxic component of the experiment to investigate the distribution of the proportionality constant and PmO2,0 across subjects. The third section validates hc-fMRI+ and ho-fMRI+ against dc-fMRI. 22 To do so, the two parameters of the model are fixed to the average values obtained from the previous analysis, and the model is inverted to infer OEF0. Finally, in the fourth section, GM OEF0 estimates from the different fMRI approaches are compared to whole-brain OEF0 inferred from a validated MRI sequence performing phase measures in the superior sagittal sinus (SSS) and conventionally termed ‘OxFlow'.2,25
Methods
Analytical modeling
Here we summarize the analytical model derivation. Please refer to Supplementary Information for a more detailed description.
BOLD model and the Dual-Calibrated fMRI experiment
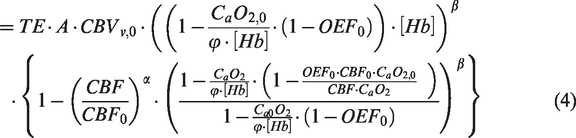
The rate of signal decay due to dHb, R2*|dHb, within a voxel is represented by:26,27

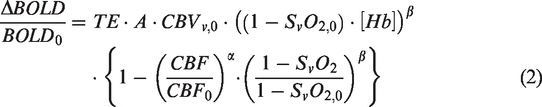

The subscript 0 depicts baseline values, ΔBOLD/BOLD0 is the relative BOLD signal change, TE is the sequence echo-time and α is the Grubb exponent (α = 0.38). During an isometabolic manipulation of brain physiology, equation (2) can be expressed as a function of OEF0 as:

Flow-Diffusion model of oxygen transport
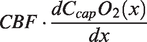
A simple model can be used to describe the steady-state radial oxygen diffusion into the tissue along a straight cylindrical capillary of unit length:
24

Integration of the Flow-Diffusion model of oxygen transport into the BOLD model for calibrated-fMRI quantification of CMRO2
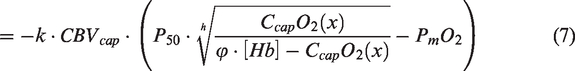
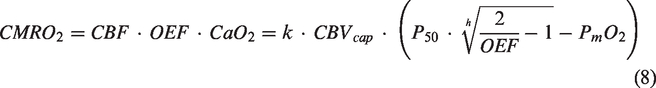
CBVcap is here assumed to be a fraction of CBVv, i.e., CBVv = ρ · CBVcap. Substituting CBVcap, from equation (8) into equation (4), we obtain:

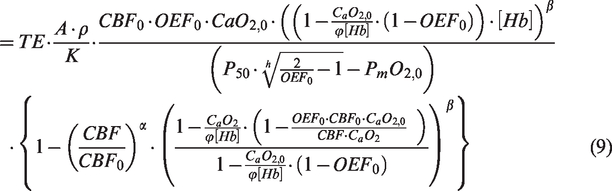
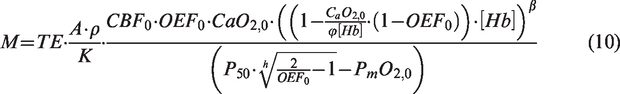
Equations (9) and (10) encode a non-linear mapping of measurable quantities M, CaO2,0 and CBF0 with OEF0, enabling OEF0 (and hence CMRO2,0) to be inferred using a single manipulation of brain physiology. Apart from the constants that can be indirectly inferred (e.g., P50, [Hb]), assumed (e.g., φ, β) or controlled (e.g., TE), the mapping depends on the non-measurable quantities: A, ρ, k and PmO2,0. A, having the same origins as β,
31
can be estimated assuming primarily an extravascular BOLD signal and assuming R2*|dHb
In summary, the non-linear mapping in equation (9) permits estimation of OEF0 from one manipulation of brain physiology. Uncertainty in the mapping is driven by variability in two non-measurable quantities, a proportionality constant A · ρ/k, that depends on tissue and micro-vessel structure at a fixed field strength, and PmO2,0. Importantly, these non-measurable quantities affect the non-linear mapping differently. The advantage of the new framework lies in the low variability of these parameters and their diminished influence on the OEF0 estimation compared to CBVv,0.
Simulations
We performed simulations to investigate the ability of hc-fMRI+ and ho-fMRI+ to infer OEF0. A forward model using equation (9) was implemented to simulate the BOLD signal and was inverted to retrieve OEF0. In the forward model some variables were fixed (TE, α, β, h ε, φ) (ε is the oxygen plasma solubility, ε = 0.0031 mL/mmHg/dL) while others were simulated based on random sampling from physiologically and physically plausible distributions. When inverting the model, some random variables were unknown and were either fixed a-priori (A · ρ/k, PmO2,0), or inferred (OEF0, CBVcap,0 and MCTT,0). Firstly, we ran the full forward and inverse analysis without measurement noise as a function of either the value chosen a-priori for the random variables that were fixed during the inversion or other parameters of interest (PmO2,0 and MCTT,0). Secondly, we evaluated the effect of measurement noise, which was introduced on measures with lower signal to noise ratio (SNR), namely ASL CBF/CBF0 and ΔBOLD/BOLD0. 10 7 simulations per condition were conducted; the non-linear inversions were performed through explicit search of OEF0 that explained the measures. The explicit search was performed in the full OEF0 space (between 0 and 1) with a resolution of 0.01. Constant parameters were set to α = 0.38, β = 1.3, h = 2.8, ε = 0.0031 mL/mmHg/dL, φ = 1.34 mL/g, TE = 30 ms, whereas random variables were simulated using either normal (N) or gamma (Γ) distributions; additional physiological constraints were applied (please refer to the Table in Supplementary Information for additional information).
Figure 1 reports the distributions of the main random variables used in the forward model simulations. With respect to the parameters that were not measured for the inversion, A · ρ/k was simulated using a normal distribution with an average value of 10 s−1g−βdLβ/(μmol/mmHg/ml/min) and a coefficient of variation (CoV) of 0.3, whereas PmO2,0 was simulated using a gamma distribution, allowing variation between zero and <Pcap,0> to simulate a large variability in PmO2,0 that might be present in disease.
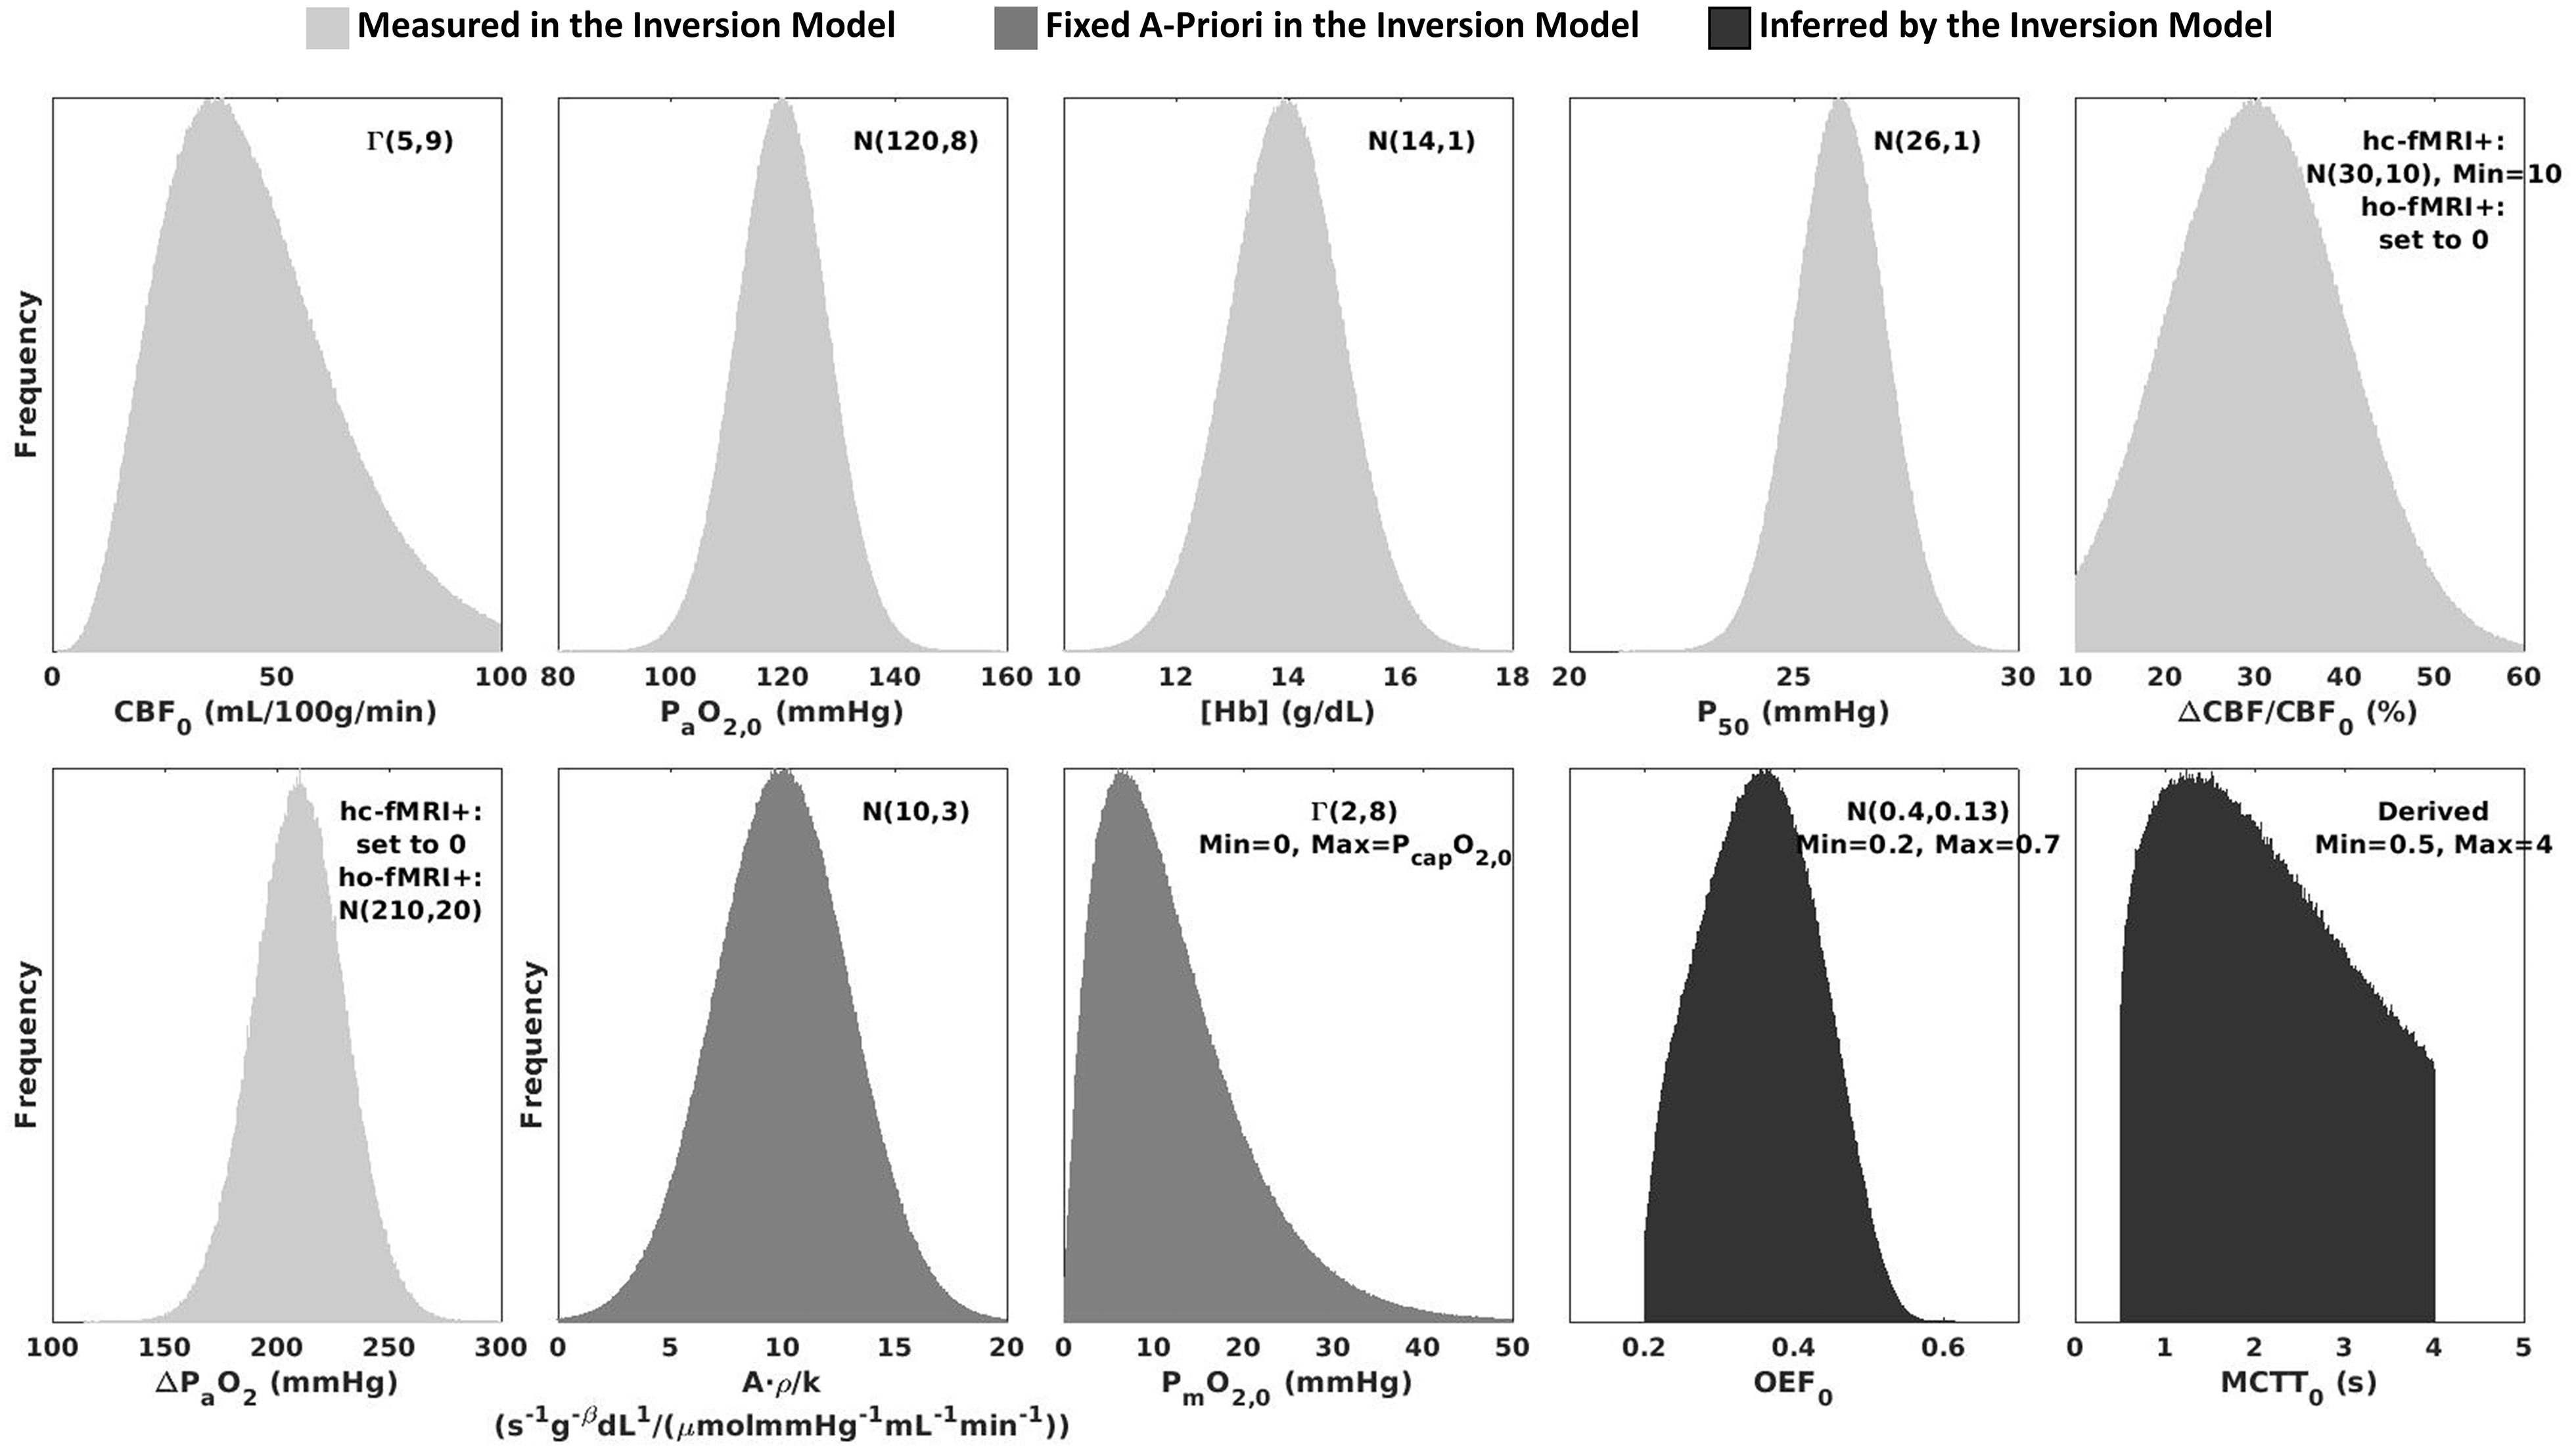
Random variables used to simulate BOLD and ASL signals using a hc-fMRI+ or ho-fMRI+ forward modelling framework. The variables reported in light grey were assumed to be measured for the hc-fMRI+ or ho-fMRI+ inversion model, those reported in medium grey were fixed a-priori in the inversion model and those in dark grey were inferred by the inversion model.
MRI experiment
Twenty healthy volunteers (13 males, mean age 31.9 ± 6.5 years) were recruited at CUBRIC, Cardiff University, Cardiff, UK. The study was in accordance with the Declaration of Helsinki and was approved by the Cardiff University, School of Psychology Ethics Committee and NHS Research Ethics Committee, Wales, UK. Written consent was obtained from each participant. Data were acquired using a Siemens MAGNETOM Prisma (Siemens Healthcare GmbH, Erlangen) 3 T clinical scanner with a 32-channel receiver head coil (Siemens Healthcare GmbH, Erlangen). A 18 minutes dc-fMRI scan was acquired with interleaved periods of hypercapnia, hyperoxia and medical air being delivered according to the protocol previously proposed.13,29 3 periods of hypercapnic gas challenges and 2 periods of hyperoxic gas challenges were performed. CO2 and O2 in the lungs were evaluated from the volunteer's facemask using a gas analyzer (AEI Technologies, Pittsburgh, PA, USA).
Calibrated fMRI data were acquired during the gas challenge scheme using a pCASL acquisition with pre-saturation and background suppression 38 and a dual-excitation (DEXI) readout. 39 The labelling duration (τ) and the Post Label Delay (PLD) were both set to 1.5 s, GRAPPA acceleration (factor = 3) was used with TE1 = 10 ms and TE2 = 30 ms. An effective TR of 4.4 s was used to acquire 15 slices, in-plane resolution 3.4 mm × 3.4 mm and slice thickness 7 mm with a 20% slice gap. A calibration (S0) image was acquired for ASL quantification with pCASL labelling and background suppression pulses switched off, with TR = 6 s, and TE =10 ms. 13 A high-resolution whole brain structural image, used for GM identification in the fMRI space, was acquired using a 3D Fast Spoiled Gradient-Recalled-Echo T1-weighted acquisition (resolution = 1 × 1 × 1 mm3, TE = 3.0 ms, TR = 7.8 ms, TI = 450 ms, flip angle = 20°).
For susceptometry-based oximetry, a transverse slice was acquired at approximately 15 mm above the confluence of sinuses (location at which the inferior sagittal, straight, and transverse sinuses join the SSS) using a T2*-weighted spoiled multi-echo gradient-recalled echo (GRE) sequence with: in-plane resolution = 1.6 × 1.6 mm2, slice thickness = 5 mm, field of view (FOV) = 208 × 208 mm2, bandwidth= 260 Hz/pixel, three echo times (TEs = 3.92, 7.44, and 10.96 ms), bipolar gradient readout, TR = 35 ms, flip angle = 25°, and acquisition time = 1 min and 7 s. This acquisition was performed in the framework of the OxFlow method, which previous studies have described in detail.40–42 For vessel identification purposes, two-dimensional T2*-weighted time-of-flight (TOF) images were acquired using a spoiled GRE sequence with: in-plane resolution = 0.86 × 0.86 mm2, slice thickness = 2 mm, slice gap = 1.34 mm, FOV = 219 × 219 ×234 mm3, in-plane acceleration factor = 2, bandwidth = 220 Hz/pixel, TE = 4.99 ms, TR = 20 ms, flip angle = 60°. Blood samples were drawn via a finger prick before scanning and were analyzed with the HemoCue Hb 301 System (HemoCue, Ängelholm, Sweden) to calculate [Hb].
fMRI data processing
Gas recordings processing
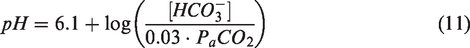
PETCO2 and PETO2 were extracted from CO2 and O2 recordings using in-house software in Matlab (Mathworks, Natick, MA). PETCO2 and PETO2 points were interpolated (cubic spline function), resampled to match fMRI, and shifted in time to maximally correlate with fMRI signals. PETCO2,0 and PETO2,0, were evaluated at baseline in the first 110 seconds. PETO2 was assumed equal to PaO2 for CaO2 computation whereas PETCO2 was assumed equal to PaCO2. P50 was inferred from estimates of resting blood pH based on the Henderson-Hasselbalch Equation, assuming [HCO3−]= 24 mmol/L:
43
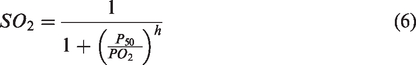
SaO2 was calculated from PaO2 using equation (6) and CaO2 was inferred using the relation:

Finally, to highlight hypercapnic and hyperoxic modulations, PETCO2 and PETO2 traces were high-pass filtered with a 4th order Butterworth digital filter and a high-pass frequency of 1/600 Hz.
fMRI processing
Both functional and structural MRIs were processed using FSL 44 and in-house algorithms implemented in Matlab. fMRI timecourses were motion corrected based on 6 degrees of freedom co-registration using MCFLIRT. 45
High-resolution structural T1-weighted MRIs were skull-stripped using BET
46
and probability maps of Cerebrospinal Fluid (CSF), WM and GM, were computed using FAST.
47
Motion-corrected fMRI timecourses and the skull-stripped T1-weighted MRI, together with tissue probability maps, were coregistered, relying on 12 degrees of freedom affine transformation, to the S0 image.
45
ASL control-tag difference perfusion data (ΔS) in S0 space were obtained through surround subtraction of the fMRI timecourses at TE1, normalized with respect to S0 and converted to CBF in quantitative units of ml/100g/min through the pCASL single compartment kinetic model of labelled spins and voxelwise signal normalization:
48
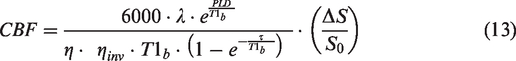

CBF0 was evaluated in the first 110 seconds. Finally, fractional CBF was high pass filtered with a 4th order Butterworth digital filter with a high-pass frequency of 1/600 Hz. BOLD T2*-weighted time-courses were obtained through surround averaging of the fMRI at TE2 and they were expressed as relative BOLD changes with respect to the temporal average of the BOLD signal in the first 110 seconds (BOLD0). BOLD relative changes were high pass filtered with a 4th order Butterworth digital filter with a high-pass frequency of 1/600 Hz.
Both processed CBF and BOLD volumes were masked with a GM mask at 50% probability threshold.
Dual-calibrated fMRI analysis
Firstly, OEF0 maps were obtained with a dc-fMRI analysis. Because of the method’s known low SNR, explicit inversion methodologies were avoided and a state-of-the-art method to analyze the data relying on a machine learning approach was used. The machine learning algorithm was fed with fMRI timecourses and, through a time-frequency transformation of fMRI signals to extract features of interest, directly mapped OEF0 and CMRO2,0 relying on a pre-trained model based on simulated data. Please refer to 22 for detailed information.
Single gas calibrated fMRI analysis
Single gas calibrated fMRI analysis was performed on either the hypercapnic (using hc-fMRI+) or the hyperoxic (using ho-fMRI+) modulations within the dc-fMRI experiment. The evaluation of BOLD and ASL changes with physiological manipulations was performed using the general linear model (GLM). 51 PETCO2 and PETO2 were concurrently regressed on BOLD and ASL filtered modulations. The GLM β-weight delivered an estimate of BOLD or CBF modulation per unit of mmHg of PETCO2 and PETO2. The total modulation was then obtained by multiplying the β-weight with the maximum PETCO2 or PETO2 modulation. The SNR of the modulation was estimated by dividing the GLM β-weight by its confidence interval. In-vivo data were used to evaluate the between subjects distribution of the unknown parameters of the extended model, namely A · ρ/k and PmO2,0. This analysis was performed by extracting average BOLD and ASL modulations in the GM. These average estimates were used, together with a global estimate of GM OEF0 obtained with the dc-fMRI analysis, to invert the model and estimate the unknown parameters. The inversion relied on equation (9), which clearly could not be solved for the two unknowns; however, since A · ρ/k and PmO2,0 differently affect the non-linear mapping between BOLD and ASL modulations and OEF0, we were able to get insight into the average value of both parameters. In particular, we inverted the model assessing the proportionality constant A · ρ/k as a function of the a-priori fixed PmO2,0. We expected the A · ρ/k distribution to have a smaller CoV when PmO2,0 was closer to the correct average value. The non-linear inversion was performed through an explicit search in the range, for A · ρ/k, between 0 and 40 s−1g−βdLβ/(μmol/mmHg/ml/min) with a resolution of 0.2 s−1g−βdLβ/(μmol/mmHg/ml/min) and, for PmO2,0, between 0 and 50 mmHg with a resolution of 1 mmHg. When making predictions with the single gas calibrated models, the unknown parameters were fixed both spatially and between subjects to the optimal values derived in the first step. Using these fixed parameters hc-fMRI+ and ho-fMRI+ inversion models were used for voxelwise estimation of OEF0 and CMRO2,0 and comparison with the estimates derived from the dc-fMRI analysis were made.
OxFlow data processing
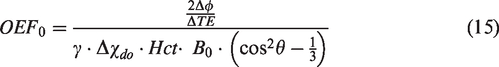
For a subset of twelve subjects, GM estimates of OEF0 using single or dual calibrated fMRI approaches were compared to whole-brain estimates of OEF0 from SSS derived using the OxFlow procedure. OxFlow images were processed using Matlab and code developed in-house. OEF0 measurements were obtained based on the normalized difference in signal phase between the first and third TEs (Δϕ/ΔTE), with acquisitions having equal gradient polarity. 41 The static background field inhomogeneity was removed using a second-order polynomial fitting. 42 The intravascular phase was measured as the average signal phase in a region of interest centered in the cross-section of SSS relative to the average signal phase in the tissue region surrounding the SSS. The angle (θ) between the SSS and B0 was evaluated by comparing the slice acquired for OxFlow and the SSS orientation in the slices immediately above and immediately below in the TOF image. Individual measurements of hematocrit (Hct, %) were obtained based on [Hb] assuming a ratio Hct/[Hb]=3 (%dL/g). 52
OEF0 was calculated using the infinite cylinder analytical model:
41
Statistical analysis
Pearson’s correlations and t-tests were performed to assess pairwise associations and biases between the different estimates. Null-hypothesis probabilities (p-values) were calculated using the Student's t distribution (using transformation of correlation for association testing). Normality evaluation was performed prior to statistical inference using the Kolmogorov-Smirnov test.
Results
Simulations
Figure 2 reports the outcome in estimating OEF0 when using hc-fMRI+ and ho-fMRI+ inversion models with fixed a-priori parameters. Figure 2(a) displays the OEF0 root mean square error (RMSE) obtained for hc-fMRI+ and ho-fMRI+ with A · ρ/k = 10 s−1g−βdLβ/(μmol/mmHg/ml/min) as a function of PmO2,0. A minimum RMSE of OEF0 = 0.039 was obtained for hc-fMRI+ and a minimum RMSE of OEF0 = 0.051 was obtained for ho-fMRI+, both at PmO2,0 = 11 mmHg. Figure 2(b) displays the scatterplots of the simulated OEF0 vs. the estimated OEF0 for hc-fMRI+ and ho-fMRI+ when marginalizing the other variables. The scatterplots reported were obtained using a close to optimal PmO2,0, PmO2,0 = 10 mmHg, and PmO2,0 = 0 mmHg. Figure 2(c) reports the OEF0 RMSE for the two methods evaluated as a function of two physiological parameters of interest in the forward model, namely MCTT0 and PmO2,0, when fixing a-priori the non-measurable parameters analogous to Figure 2(b). Importantly, when adding noise to BOLD and fractional changes in CBF, the analysis highlighted the stability of the approach with respect to measurement SNR, with the OEF0 RMSE reaching the OEF0 RMSE related to model parameters uncertainty at BOLD and ASL SNRs around 4 (refer to Supplementary information for additional information).
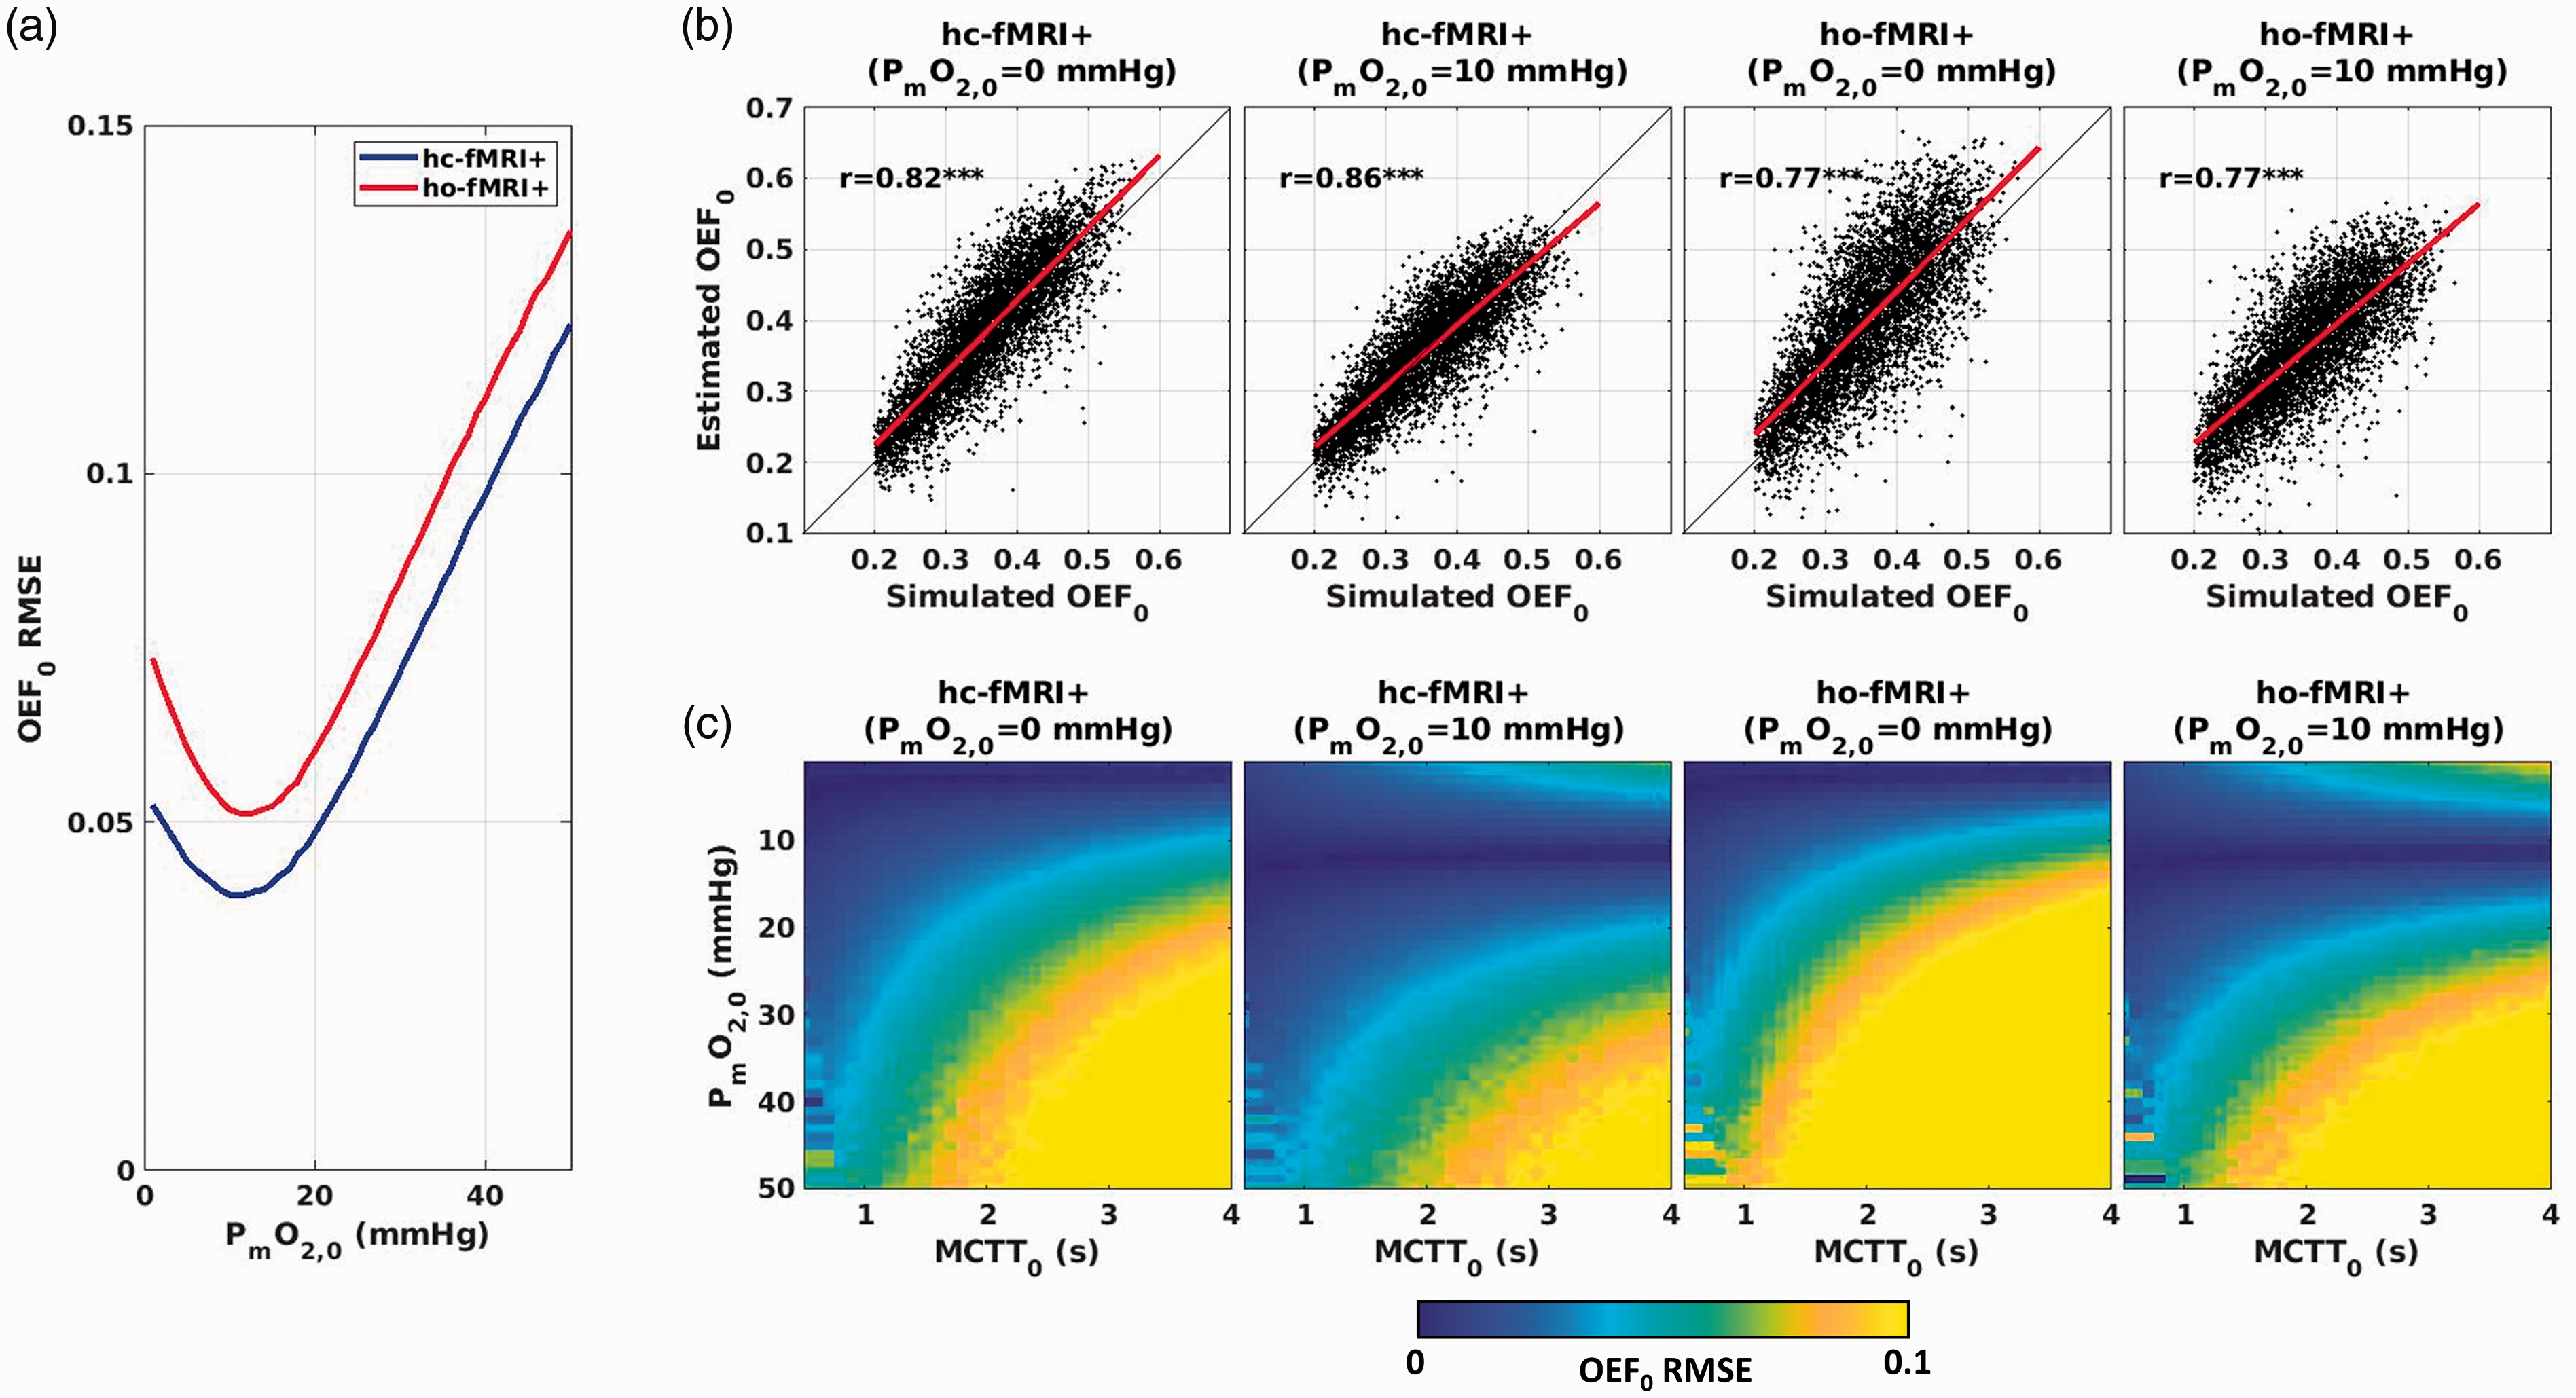
(a) RMSE in OEF0 for hc-fMRI+ and ho-fMRI+ inversion models with A·ρ/k = 10 s−1g−βdLβ/(μmol/mmHg/ml/min) as a function of PmO2,0. (b) Scatterplots of the simulated and estimated OEF0 for hc-fMRI+ and ho-fMRI+ inversion models assuming either PmO2,0 = 0 mmHg or PmO2,0 = 10 mmHg; (c) RMSE in OEF0 as a function of the forward model MCTT0 and PmO2,0 for hc-fMRI+ and ho-fMRI+ inversion models assuming either PmO2,0 = 0 mmHg or PmO2,0 = 10 mmHg. ***p < 10−3.
In-Vivo evaluation of gas, CBF and BOLD modulations
Figure 3 reports the processing steps, in an exemplar subject, that were used to derive the hypercapnic and the hyperoxic CBF and BOLD modulations. Figure 3(a) shows O2 signals acquired through the gas analyzer with the estimated PETO2 traces whereas Figure 3(b) depicts CO2 signals and PETCO2 traces. Figure 3(c) shows example of the ASL CBF/CBF0 and the filtered and fitted PETCO2. Figure 3(d) shows the relative BOLD change and the filtered PETCO2 and PETO2 traces fitted onto ΔBOLD/BOLD0. The GLM β-weight (in units of cerebrovascular reactivity, CVR, or in units of signal per mmHg of PETO2) were multiplied by the maximum gas modulation to obtain the hypercapnic CBF/CBF0 and the hypercapnic as well as hyperoxic ΔBOLD/BOLD0 modulations. Additional information on gas and signal modulations are reported in the Supplementary Information. The GLM analysis delivered an SNR (evaluated as the statistical relevance of the β-weight) of SNRASL = 6.1 (SD = 5.4), hypercapnic SNRBOLD = 16 (SD = 12.7) and hyperoxic SNRBOLD = 8.6 (SD = 7.52).
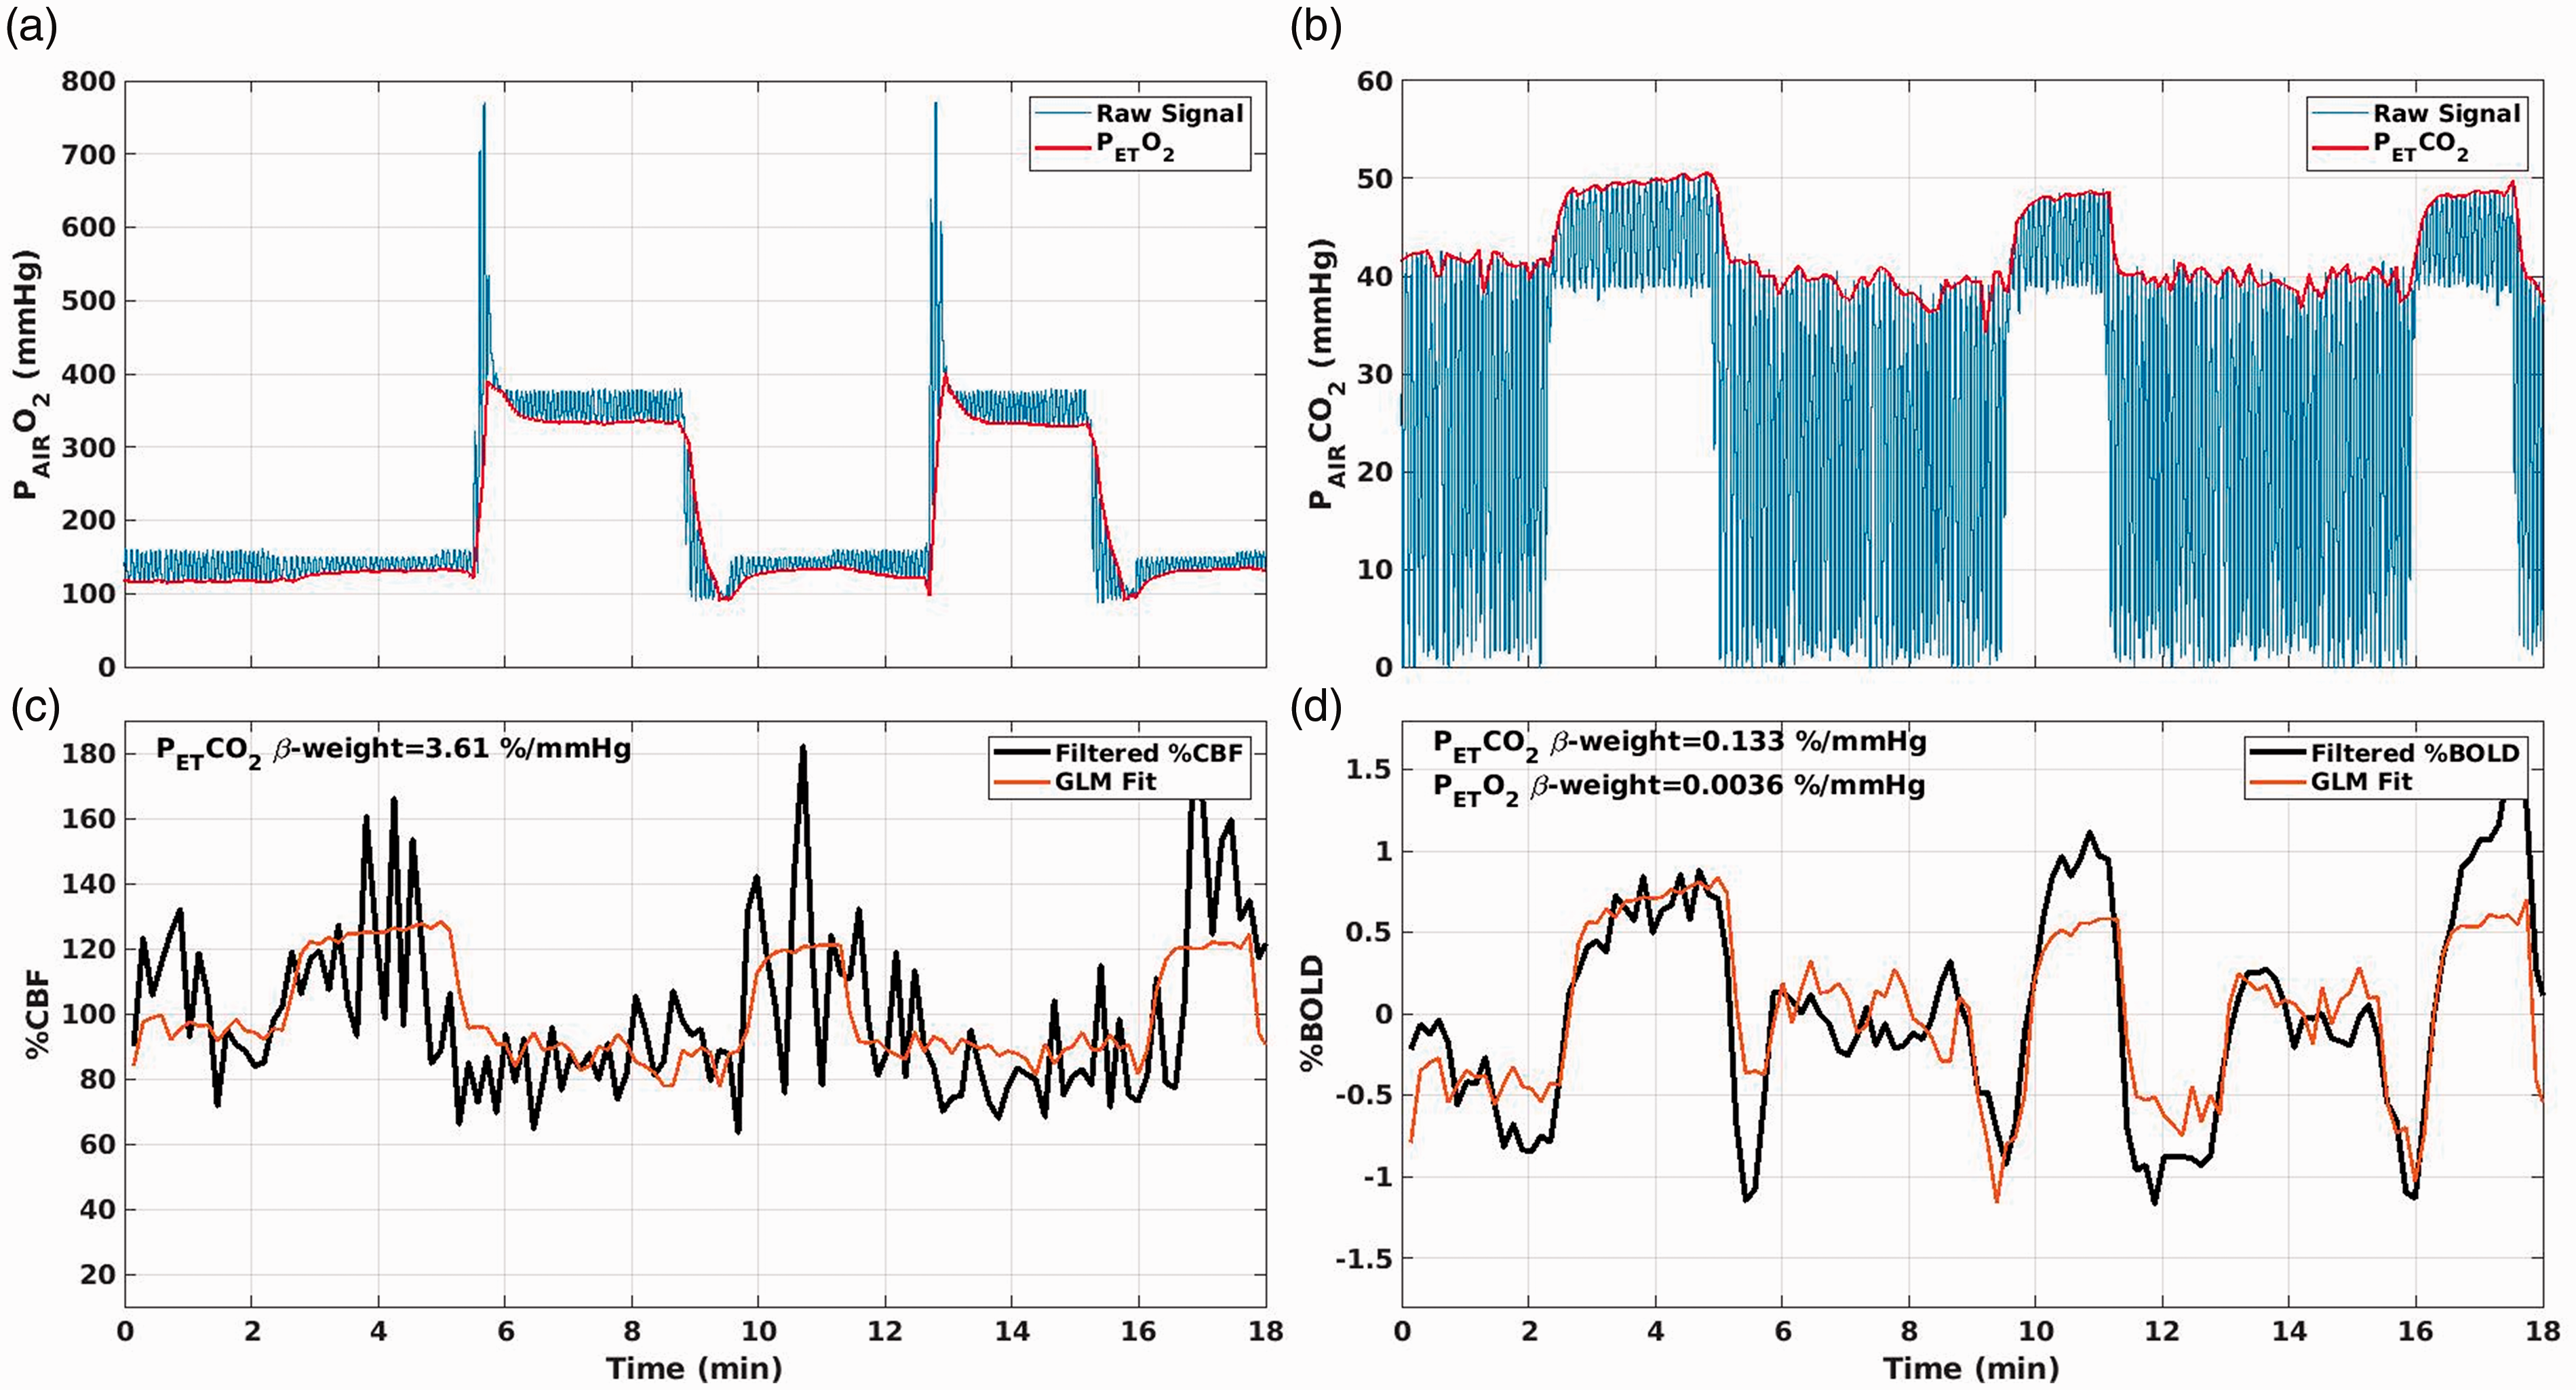
Example of: (a) O2 and estimated PETO2 traces; (b) CO2 and estimated PETCO2 traces; (c) GM CBF/CBF0 and fitted PETCO2 trace. The β-weight of the GLM fit, with units of a CVR, CBF/CBF0/mmHg, was multiplied by the maximum modulation ΔPETCO2 to obtain the hypercapnic CBF/CBF0. (d) GM average ΔBOLD/BOLD0 and fitted PETCO2 and PETO2 traces. The β-weights, with units of %BOLD/mmHg of PETCO2 and PETO2, were multiplied by the maximum modulation ΔPETO2 and ΔPETO2 to obtain the hypercapnic and the hyperoxic ΔBOLD/BOLD0.
In-Vivo estimation of modeling parameters
Figure 4 reports the analysis performed in-vivo to evaluate the modelling parameters. Figure 4(a) reports the subjects’ average value (and standard error, SE) of A · ρ/k as a function of PmO2,0. The value is reported for both hc-fMRI+ and ho-fMRI+. In agreement with equation (9), for higher PmO2,0 the estimate of A · ρ/k decreased. We obtained, for a PmO2,0 = 0, an average value of A · ρ/k = 8.85 s−1g−βdLβ/(μmol/mmHg/ml/min) (SE = 0.58 s−1g−βdLβ/(μmol/mmHg/ml/min)) for hc-fMRI+ and A · ρ/k = 6.03 s−1g−βdLβ/(μmol/mmHg/ml/min) (SE = 0.41 s−1g−βdLβ/(μmol/mmHg/ml/min)) for ho-fMRI+. Figure 4(b) reports the CoV of A · ρ/k for hc-fMRI+ and ho-fMRI+ as a function of PmO2,0. The smallest CoV was obtained with a PmO2,0 ≈ 0 for both hc-fMRI+ (CoV = 0.29) and ho-fMRI+ (CoV = 0.31) with a monotonic CoV increase at increasing PmO2,0.
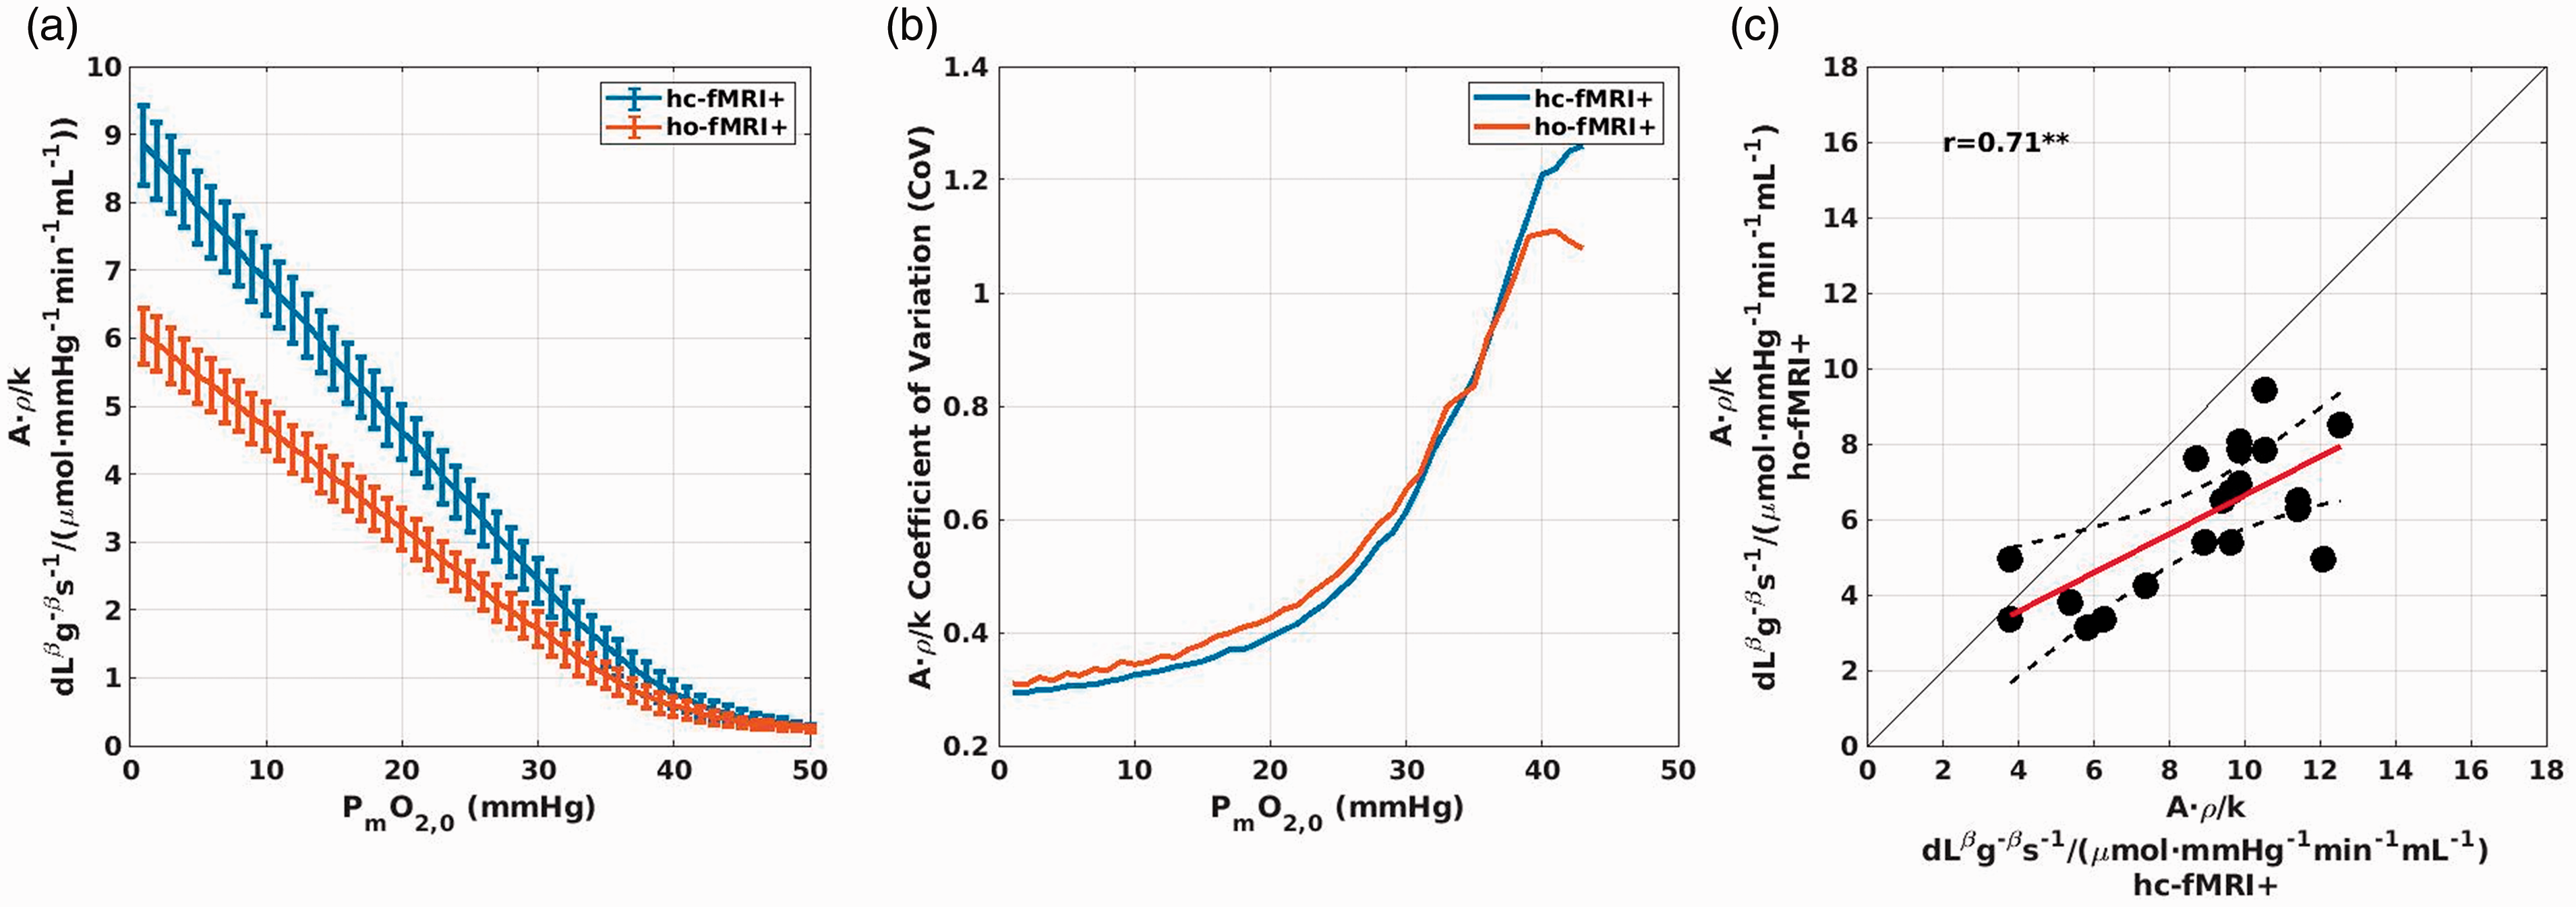
Results of the analysis evaluating the modelling unknown parameters that used hc-fMRI+ or ho-fMRI+ and the OEF0 derived from the dc-fMRI analysis. (a) Subjects’ average (and SE) estimate of the scaling parameter A·ρ/k of the model as a function of the PmO2,0 assumed. (b) Subjects’ CoV of the scaling parameter A·ρ/k as a function of PmO2,0 assumed. (c) Comparison between hc-fMRI+ and ho-fMRI+ estimates of A·ρ/k for each subject, assuming a PmO2,0 = 0 mmHg. **p < 0.01.
Figure 4(c) reports the comparison between hc-fMRI+ and ho-fMRI+ estimates of A · ρ/k for each subject, when fixing the PmO2,0 at the value of PmO2,0 = 0 mmHg . A good correlation was obtained with a r = 0.71, df = 18, p = 4.2 · 10−4, with a smaller hyperoxic estimate.
In-vivo estimation of oxygen extraction fraction: Calibrated fMRI vs. dual-calibrated fMRI (section 3)
Figure 5(a) reports exemplar OEF0 and CMRO2,0 maps obtained with dc-fMRI, hc-fMRI+ and ho-fMRI+.
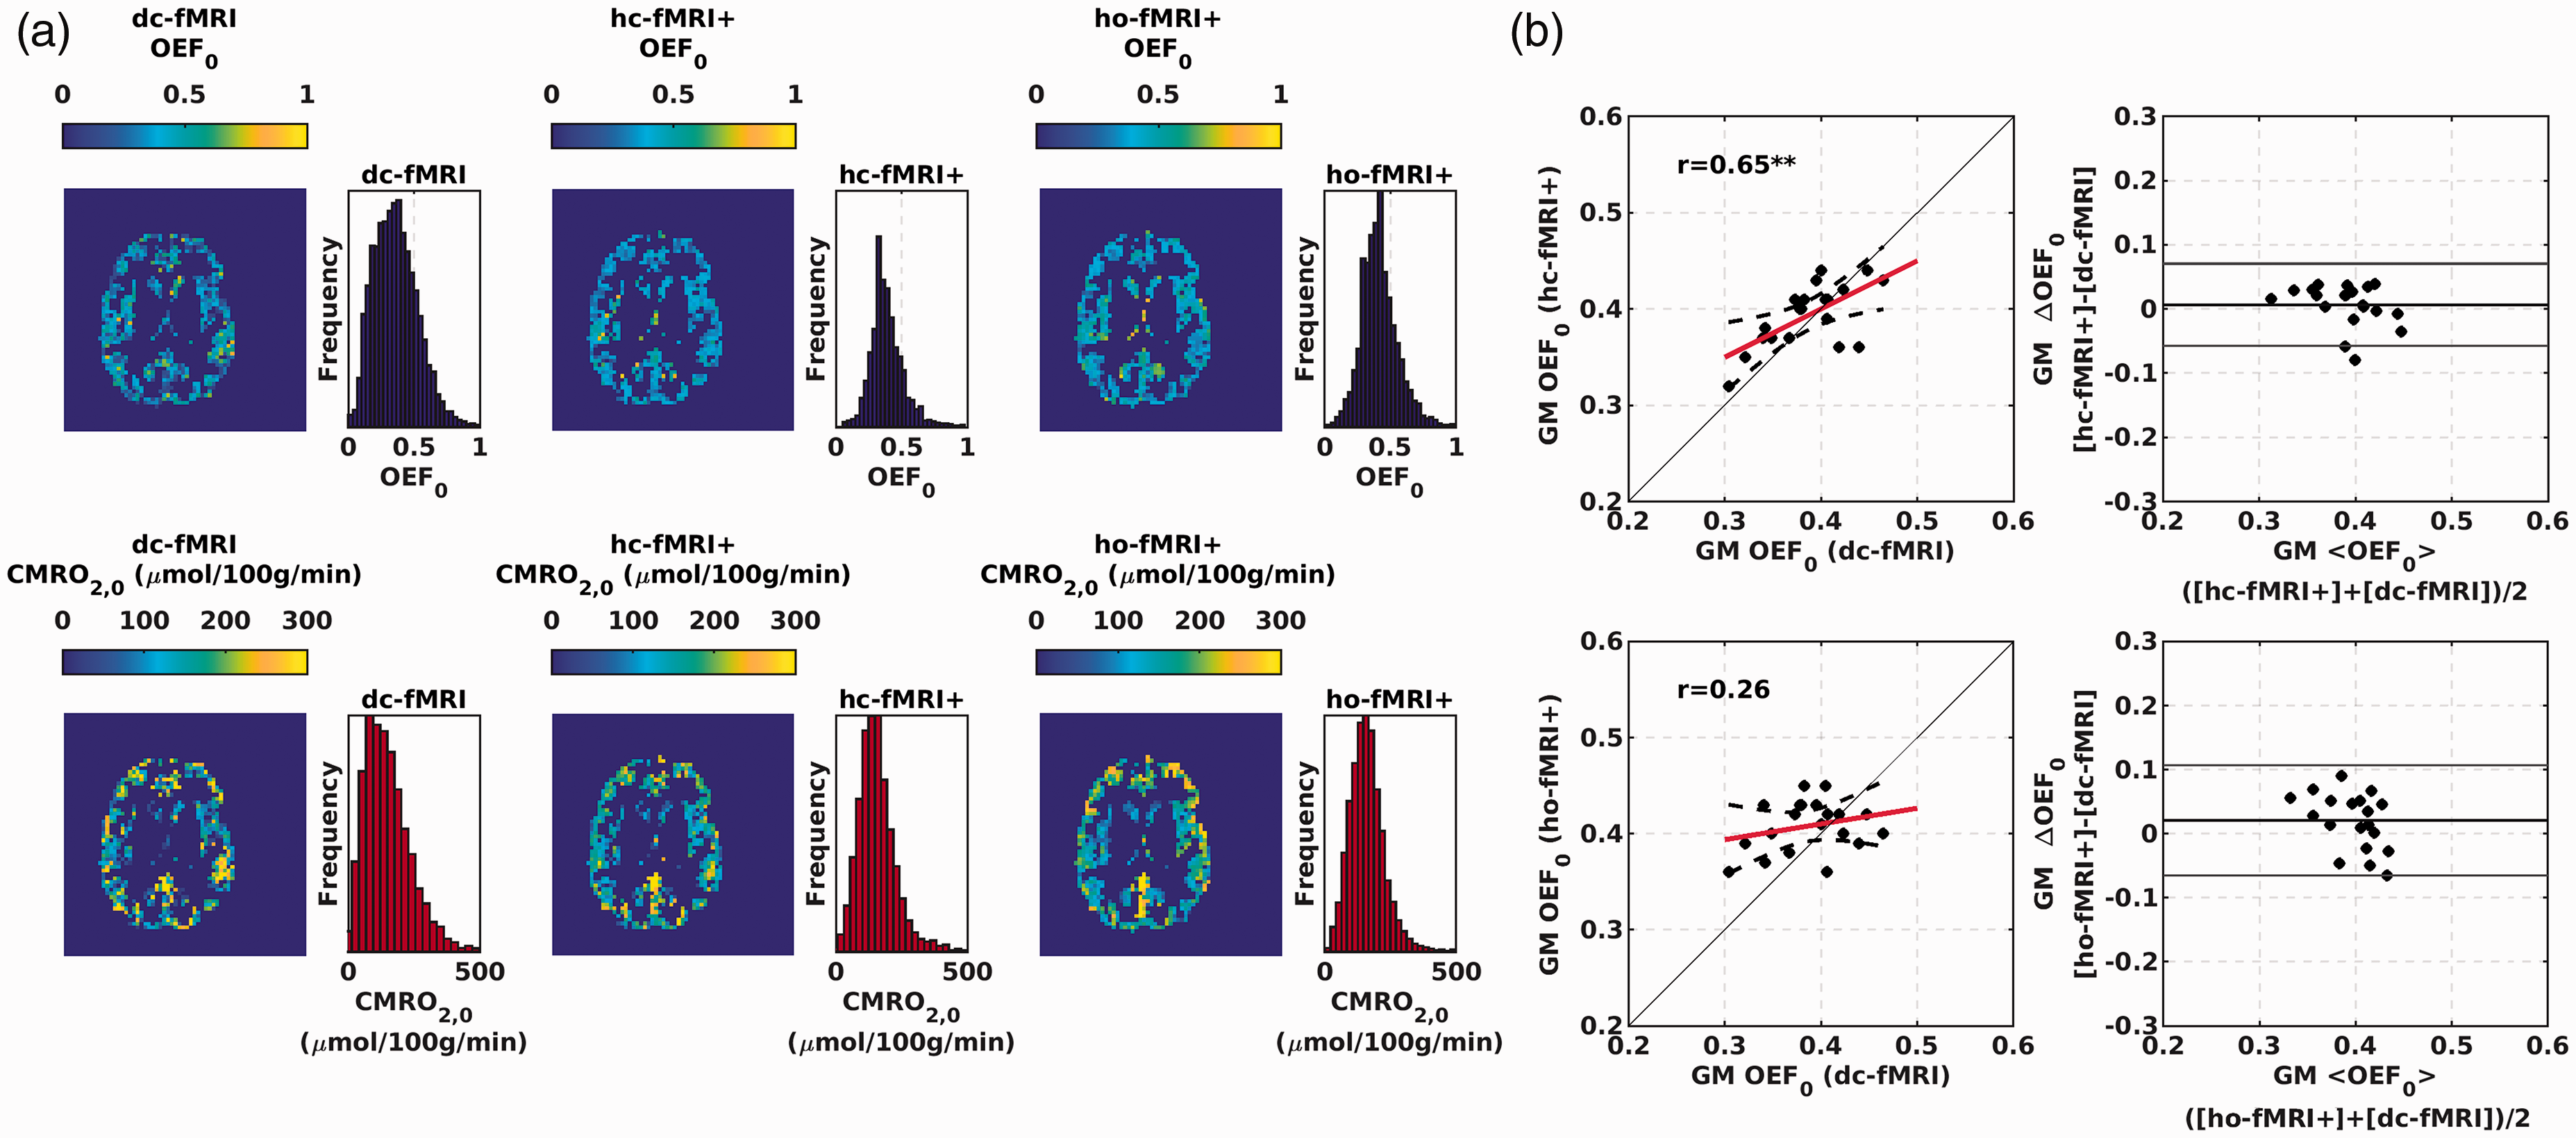
(a) Exemplar GM OEF0 and CMRO2,0 maps for a participant of the study obtained with dc-fMRI (left colum), hc-fMRI+ (central column) and ho-fMRI+ (right column). (b) Scatterplots and Bland-Altmann plots comparing the average OEF0 in the GM between the hc-fMRI+ (upper row) and ho-fmri+ (lower row) and dc-fMRI. **p < 0.01; ***p < 10−3.
Notably, subjects’ average spatial variabilities (estimated as standard deviation, SD) in the GM OEF0 of SD = 0.17 (SE = 0.003), SD = 0.13 (SE = 0.002) and SD = 0.15 (SE = 0.002) were obtained for dc-fMRI, hc-fMRI+ and ho-fMRI+, respectively.
Figure 5(b) reports the scatterplots and the Bland-Altmann plots comparing the average OEF0 in the GM between dc-fMRI and the single calibration approaches. Average global GM OEF0 (mean±SD) were 0.39 ± 0.04, 0.39 ± 0.03, and 0.40 ± 0.03 for dc-fMRI, hc-fMRI+ and ho-fMRI+, respectively. hc-fMRI+ OEF0 was significantly correlated with that of dc-fMRI (r = 0.65, df = 18, p = 2 · 10−3, OEF0 RMSE = 0.033) whereas that of ho-fMRI+ was not (r = 0.26, df = 18, p = 0.27, OEF0 RMSE = 0.044). No significant bias between the different approaches was found, but this was dependent on the proportionality constant calibration using dc-fMRI. A significant correlation, with no bias, was obtained between hc-fMRI+ and ho-fMRI+ (r = 0.50, df = 18, p = 0.02).
In-vivo estimation of oxygen extraction fraction: Calibrated fMRI vs. OxFlow (section 4)
Figure 6 reports the scatterplots and the Bland-Altmann plots comparing the global OEF0 of the fMRI approaches to the OEF0 estimated in the SSS using OxFlow in a subset of 12 subjects. Figure 6(a) shows, for one representative subject, the magnitude image and the processed phase image used to estimate OEF0 in the SSS within OxFlow. Average SSS OEF0 estimated using OxFlow was 0.31 ± 0.07. Significant associations of the average OEF0 in the GM using a fMRI approach with whole-brain OEF0 retrieved using OxFlow were obtained for dc-fMRI (r = 0.58, df = 10, p = 0.048, RMSE = 0.034, Figure 6(b)) and hc-fMRI+ (r = 0.64, df = 10, p = 0.025, Figure 6(c), RMSE = 0.041). No significant association was obtained using ho-fMRI+ (r = 0.36, df = 10, p = 0.24, Figure 6(d), RMSE = 0.066). A systematic bias was obtained with the OxFlow underestimating the OEF0 with respect to fMRI. For the two fMRI approaches that delivered a significant association with OxFlow, an absolute difference between the dc-fMRI and OxFlow of ΔOEF0 = 0.077 with a t = 4.57, df = 11, p = 8 · 10−4, and an absolute difference between hc-fMRI+ and OxFlow OEF0 of ΔOEF0 = 0.083 with a t = 5.13, df = 11, p = 3.2 · 10−4 were obtained.
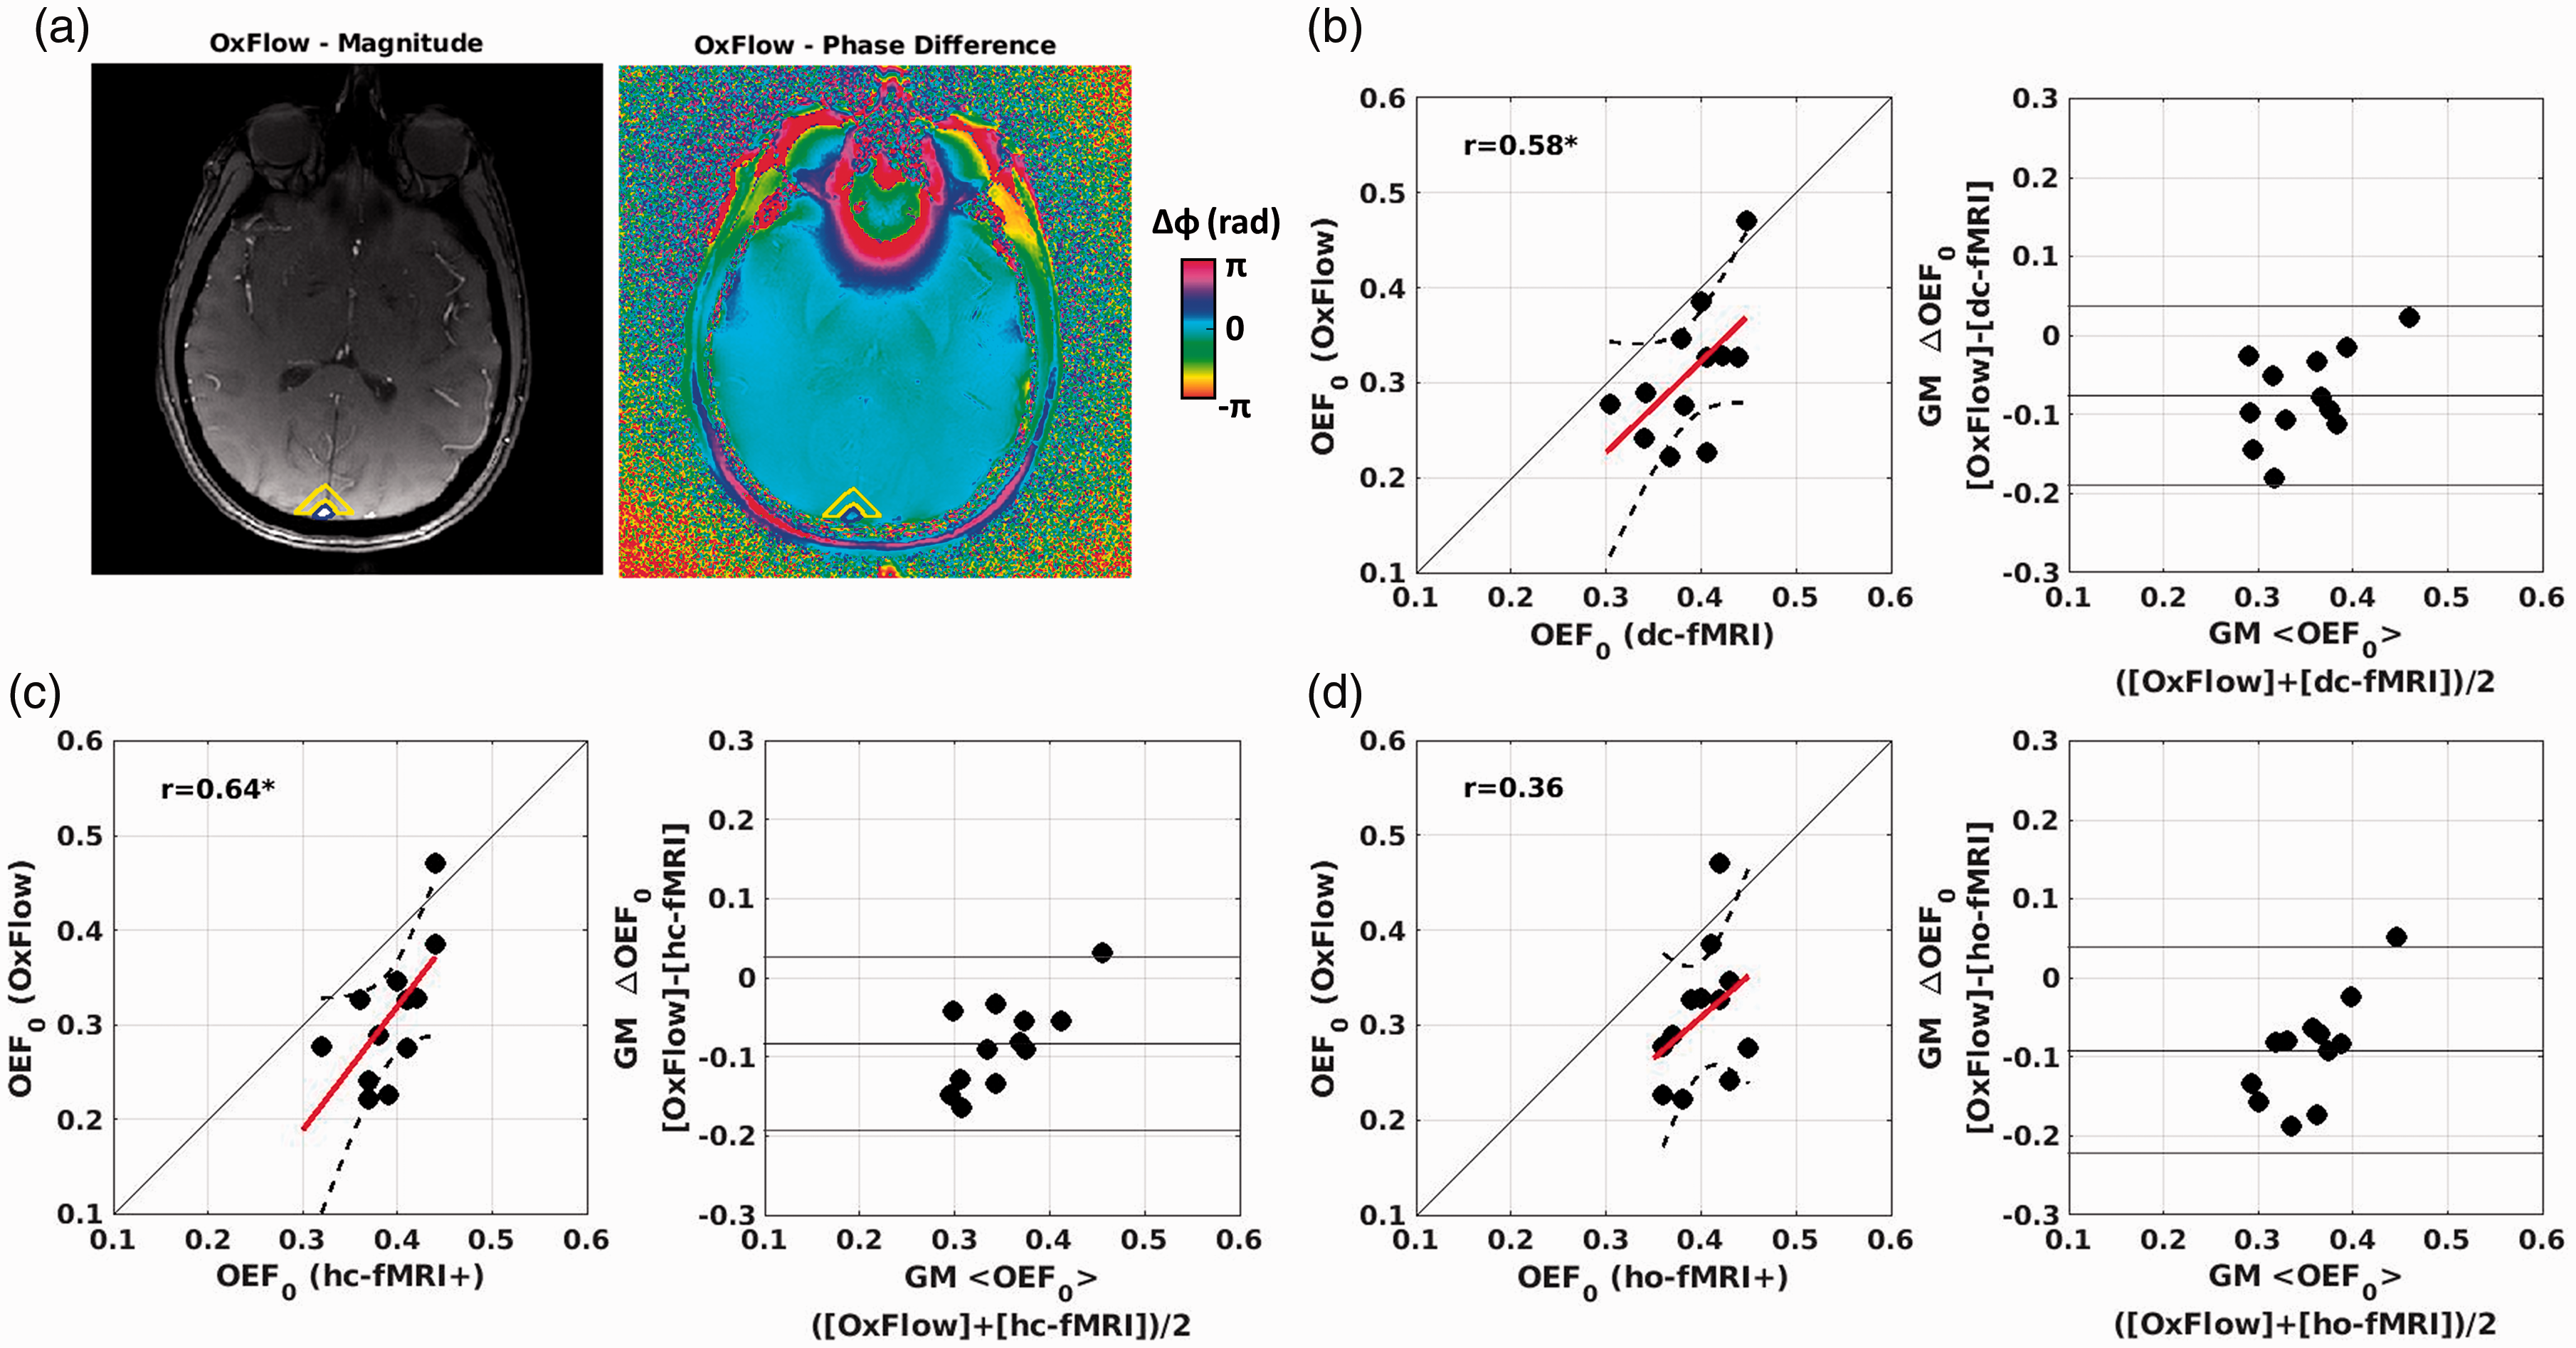
Scatterplots and Bland-Altmann plots comparing the OEF0 of the calibrated fMRI approaches and OxFlow in a subset of subjects. (a) Example of magnitude (arbitrary units) and processed phase images used to estimate OEF0 in the SSS within the OxFlow method. SSS and the reference region are outlined in blue and yellow, respectively. OxFlow vs. (b) dc-fMRI; (c) hc-fMRI+; (d) ho-fMRI+. *p < 0.05.
Discussion
We introduced a framework for mapping OEF0 and CMRO2,0 using single gas calibrated fMRI. The method integrates a flow-diffusion model of oxygen transport 24 with the steady-state BOLD signal model. 16 Simulations suggest the approach to be valid over a wide range of brain physiology. The new approach, when applied to hypercapnia, compared well with dc-fMRI and whole-brain OEF0 assessed in the SSS using OxFlow. Compared to dc-fMRI, the novel method permits a simpler stimulation paradigm based on a single exogenous gas challenge 27 or, presumably, on an endogenous challenge such as breath hold, 54 and makes the approach robust to measurement noise.
Simulations
The simulations relied on a forward model assuming the new framework to be correct. When inverting the model, the unknown random variables were: (i) A · ρ/k, a lumped parameter dependent on field strength, tissue structure and vessel geometry and (ii) the mitochondrial oxygen pressure at rest, PmO2,0. Variability in A · ρ/k (CoV = 0.3) was based on in-vivo data (Figure 4), whereas the PmO2,0 was simulated in the range 0-<PcapO2> (Figure 1). When inverting the forward model with these parameters fixed, we obtained low OEF0 RMSE (around 0.05) for both hc-fMRI+ and ho-fMRI+ when marginalizing all other variables, with slightly better performance for hc-fMRI+ (Figure 2(a) and (b)). This highlighted the unknown parameters’ reduced effect on the mapping between the measurable variables and OEF0. In fact, when considering OEF0 RMSE as a function of a wide range of two interesting physiological variables, PmO2,0 and MCTT0, the OEF0 RMSE was small. Only with very high PmO2,0 (>25 mmHg) and long MCTT0 (>2.5 s) the RMSE increased significantly. Very high PmO2,0 and long MCTT0, associated with low CBF0, are expected only in diseases that heavily alter oxygen supply, vasculature and mitochondrial function.
The simulations revealed the effect of BOLD and ASL measurement noise. For both BOLD and ASL modulations, the OEF0 RMSE quickly reached the value caused by uncertainty in physiology at an SNR ≈ 4. This is the SNR of the modulation estimate, not the temporal SNR of the raw signals. For example, when the modulation is estimated within a GLM framework regressing PETO2 and PETCO2 onto BOLD and ASL modulations (Figure 3), the SNR is the GLM β-weight divided by its confidence interval. Average voxel SNRs were between 6 and 16 in vivo for both signals and gas challenges. The robustness to noise of the approach is advantageous compared to dc-fMRI, that often relies on constrained inversion algorithms, trading off accuracy for higher stability. 22
Modeling parameters
Investigation of model parameters suggested an average value of A · ρ/k of the order of 10 s−1g−βdLβ/(μmol/mmHg/ml/min) when using hc-fMRI+, and an average value of PmO2,0 in the healthy population close to 0 for both hc-fMRI+ and ho-fMRI+ (Figure 4) both results agreed with expectations.36,55 In fact, the estimate of A · ρ/k decreased beyond expectations at increasing PmO2,0 and increased its CoV as a function of the assumed PmO2,0, with a rapid increase above 20 mmHg. This work indeed suggests a particularly low average PmO2,0 in the healthy brain. However, it should be stressed that a strong increase in CoV of A · ρ/k was only observed at PmO2,0 above 20 mmHg. The confidence interval of the estimate still cannot provide a definitive answer on the average PmO2,0 within the range 0-20 mmHg. There is work suggesting the mitochondrial PmO2,0 is about ∼12 mmHg56,57 which goes against the common assumption of PmO2,0 being near zero in the healthy brain 36 and, indeed, this is still an open debate. Nonetheless, the simulations of the study clearly demonstrate that the approach estimating OEF0 has limited sensitivity to the value of PmO2,0 if PmO2,0 and MCTT0 are not both very high. The good correlation between the hypercapnic and the hyperoxic estimates indicated consistency. However, we obtained a value of A · ρ/k for ho-fMRI+ around 30% smaller than expected. This result might be a cross-talk effect of the hypercapnic on the hyperoxic BOLD modulations in the dc-fMRI experiment, or an overestimation of ΔPaO2.
Comparison with dc-fMRI and OxFlow
Spatial homogeneity of OEF0 in healthy subjects is often taken as an indicator of successful OEF0 mapping. hc-fMRI+ and ho-fMRI+ decreased OEF0 spatial variability in GM compared to dc-fmri. The lower variability of hc-fMRI+ and ho-fMRI+ suggests a greater robustness, with respect to measurement SNR, compared to the dc-fMRI. Comparison of GM OEF0 estimates suggests that hc-fMRI+ is a valid alternative to dc-fMRI (Figure 5(b)). In addition, when comparing GM OEF0 of the different fMRI approaches with global OEF0 in the SSS through OxFlow, clear associations with the OxFlow OEF0 were obtained for both dc-fMRI and hc-fMRI+ (Figure 6). We identified a bias between the OxFlow and the fMRI estimates. OxFlow yielded a lower global OEF0 with values around 0.31 and 0.39 for Oxflow and fMRI, respectively. This difference might be explained by previous work, where Oxflow using analytical modelling gave high estimates of venous saturation. 58 Systematic differences in the global OEF0 estimated using heterogeneous MRI or non MRI techniques are established in the literature. Work performed using measures of T2 relaxation in venous blood, delivered global OEF0 between 0.36 and 0.38.59,60 These values were close to global OEF0 estimated using the gold standard 15 O positron emission tomography ( 15 O PET)60,61 and are more compatible with the OEF0 obtained with calibrated fMRI approaches. Nonetheless, once a good correlation between modalities is established, biases can be corrected using data-driven approaches or through better models of the underlying physics and physiology. The low performance of ho-fMRI+ is indeed a negative result of the study. Hyperoxia is generally better tolerated than hypercapnia 19 and it would be more easily applicable in clinical settings. The lower performance of hyperoxia is plausibly related to the noisier estimate of M. Moreover, hyperoxic BOLD modulation is primarily sensitive to CBVv,0 and largely insensitive to OEF0; in fact, hyperoxia can be used to estimate CBVv,0. 62 The oxygen saturation change due to hyperoxia stimulus is independent of the baseline oxygen saturation over most of the physiological range. In contrast, the oxygen saturation change to a hypercapnic challenge is linearly related to the resting saturation. The sensitivity pattern of the hyperoxic modulation makes the estimation of OEF0 with the new framework completely reliant on the flow-diffusion model approximations that link CBVv,0 to OEF0. The model approximations are indeed less influential with hypercapnia, which has a larger sensitivity to OEF0 with respect to CBVv,0, making the hypercapnia approach less noisy and biased.
Limitations of the method
The main limitations of the new method are mostly shared with dc-fMRI. 14 The approach using hypercapnia relies on a local CBF increase, a vascular reserve, which may be absent in diseases such ischemic stroke, where vessels may be maximally dilated in an attempt to maintain perfusion. In addition, the method might be vulnerable to larger than expected changes in ρ or k, which are probably not independent. Although large changes in these parameters appear unlikely in many brain diseases, we might expect relevant tissue and vascular remodeling in some disease, such as brain tumors. 63 The limitations of the approach in diseases with concurrent very high PmO2,0 and long MCTT0 are noted earlier and should be assessed in future studies.
Study limitations
The main limitation of the simulation study lies in the assumption of an exact analytical model with the error in the estimate of OEF0 being introduced only by the limited number of measurable variables. The main simplifying assumption of the model was the replacement of the CTT in one straight capillary with the MCTT in the voxel capillary bed. This is an approximation, since, due to the non-linear mapping between CTT, OEF and oxygen diffusion between capillary and tissue, the complete CTT distribution within a capillary bed affects the macroscopic OEF. 64 Without changing MCTT, OEF can be increased through homogenization of the CTT among capillaries. Future extension of the model might include the CTT heterogeneity (CTTH), a measure of the second moment of the CTT distribution within the capillary bed. 65
With respect to the in-vivo validation using dc-fMRI, a limiting factor was related to the investigation of the proposed model proportionality constant A · ρ/k and PmO2,0. These estimates were evaluated assuming the OEF0 derived from the dc-fMRI machine learning analysis 22 to be exact. In fact, noise in the dc-fMRI OEF0 limited our investigation of the model parameters to global evaluation within the GM. Moreover, another limitation was the problem of having two unknowns and one equation. By exploiting the different effects of these parameters on the non-linear mapping between variables, we were able to get insight into both parameters, however only at a between subjects’ average level. Alternative approaches should be used to investigate the different physiological parameters (e.g., ρ and k) contributing to the proportionality constant, which cannot be separately investigated using standard fMRI approaches. Comparison against non-MRI technology would be essential for definitive validation of the approach. Future validation is also necessary beyond the healthy controls involved in the study, to populations affected by diseases that might alter brain metabolism and for which the proposed model’s validity might reduce.
Conclusion
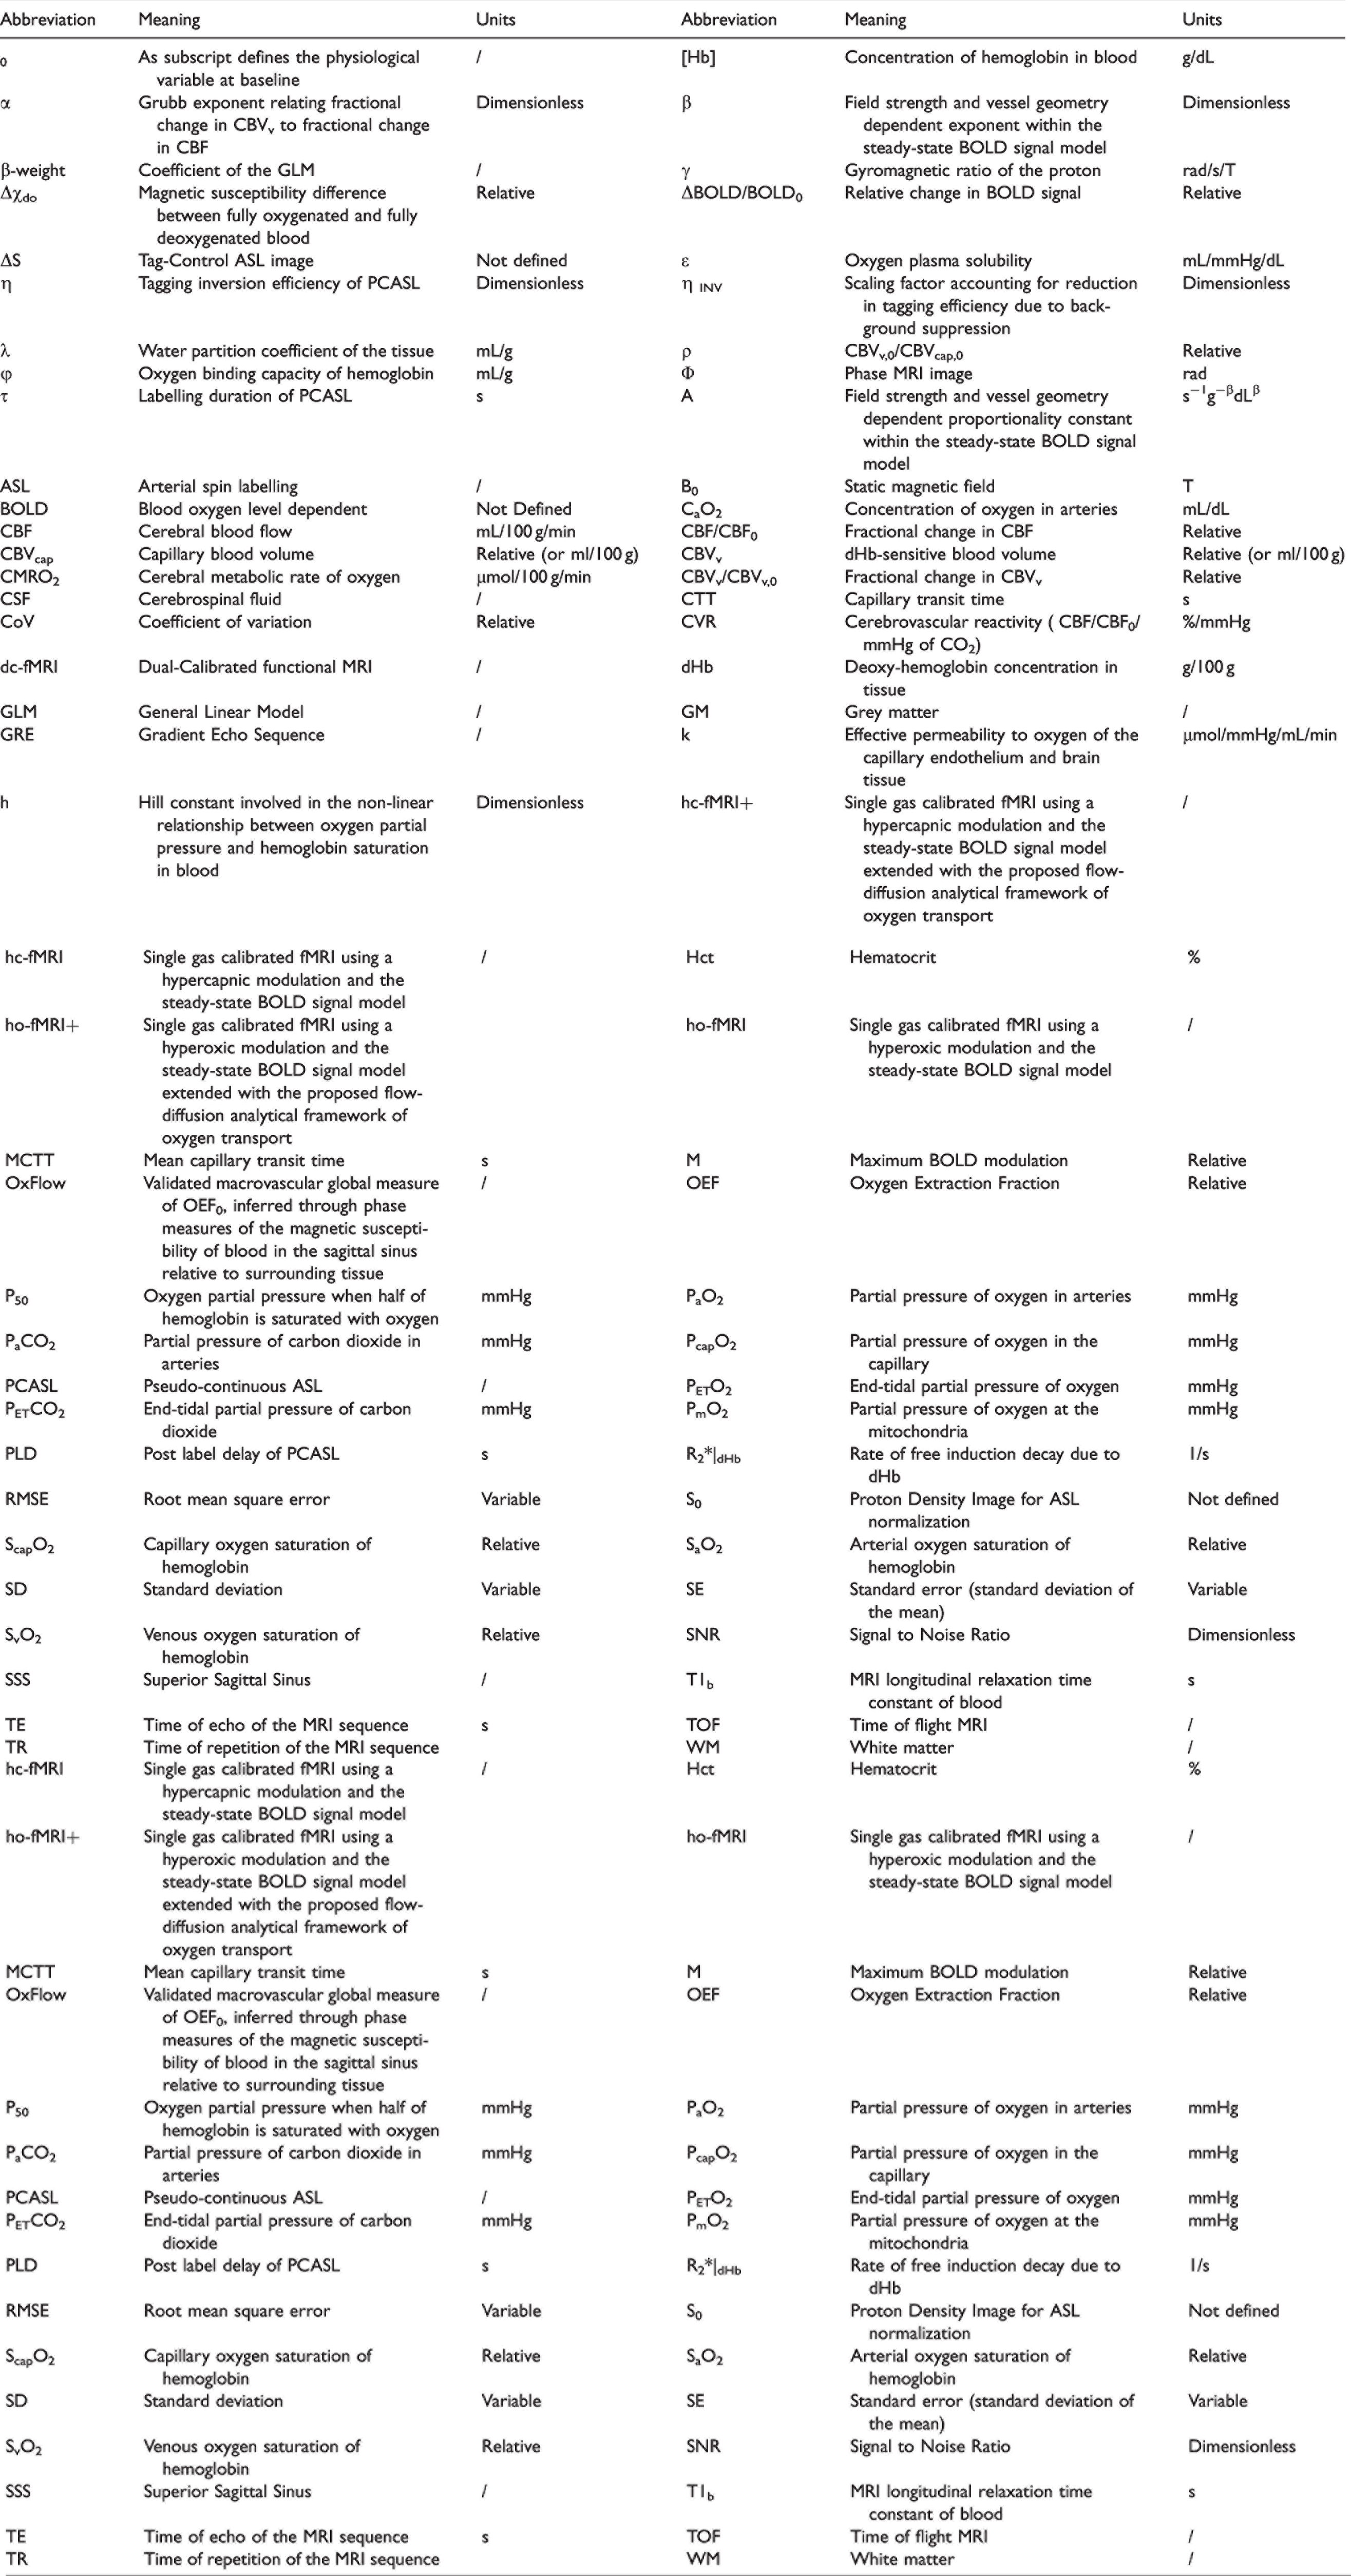
Main variables and abbreviations used in the study, reported in alphabetical order.
Supplemental Material
sj-pdf-1-jcb-10.1177_0271678X221077332 - Supplemental material for A flow-diffusion model of oxygen transport for quantitative mapping of cerebral metabolic rate of oxygen (CMRO2) with single gas calibrated fMRI
Supplemental material, sj-pdf-1-jcb-10.1177_0271678X221077332 for A flow-diffusion model of oxygen transport for quantitative mapping of cerebral metabolic rate of oxygen (CMRO2) with single gas calibrated fMRI by Antonio M Chiarelli, Michael Germuska, Hannah Chandler, Rachael Stickland, Eleonora Patitucci, Emma Biondetti, Daniele Mascali, Neeraj Saxena, Sharmila Khot, Jessica Steventon, Catherine Foster, Ana E Rodríguez-Soto, Erin Englund, Kevin Murphy, Valentina Tomassini, Felix W Wehrli and Richard G Wise in Journal of Cerebral Blood Flow & Metabolism
Footnotes
Funding
The author(s) disclosed receipt of the following financial support for the research, authorship, and/or publication of this article: MG thanks the Wellcome Trust for its support via a Sir Henry Dale Fellowship (220575/Z/20/Z). This project was partially supported by the UK Engineering and Physical Sciences Research Council (EP/S025901/1). This work was supported by the National Institute of Health (P41-EB029460). HLC and MG were funded by a Wellcome Strategic Award to CUBRIC, ‘Multi-scale and multi-modal assessment of coupling in the healthy and diseased brain’ (104943/Z/14/Z). RCS, EP and CF were supported by Wellcome PhD studentships. KM was supported by a Wellcome Senior Research Fellowship, “Assessing the health of ageing blood vessels in the brain using fMRI” (200804/Z/16/Z). The study was partially supported by the MS Society UK.
Acknowledgments
This work was partially conducted under the framework of the Departments of Excellence 2018–2022 initiative of the Italian Ministry of Education, University and Research for the Department of Neuroscience, Imaging and Clinical Sciences (DNISC) of the University of Chieti-Pescara, Italy. For the purpose of Open Access, the author has applied a CC BY public copyright license to any Author Accepted Manuscript version arising from this submission. The data that support the findings of this study are available upon reasonable request.
Declaration of conflicting interests
The author(s) declared no potential conflicts of interest with respect to the research, authorship, and/or publication of this article.
Authors’ contributions
AMC and MG developed imaging and analysis methods, and analyzed and interpreted the data. AMC, MG and RGW drafted the manuscript. FWW, RGW, KM and VT conceived the project. MG, HLC, RCS, EP, NS, SK, SJ, CF and KM set up and executed the experiment. DM, EB, AERS and EE contributed to data analysis. All authors revised and approved the final submission.
Supplemental material
Supplemental material for this article is available online.
References
Supplementary Material
Please find the following supplemental material available below.
For Open Access articles published under a Creative Commons License, all supplemental material carries the same license as the article it is associated with.
For non-Open Access articles published, all supplemental material carries a non-exclusive license, and permission requests for re-use of supplemental material or any part of supplemental material shall be sent directly to the copyright owner as specified in the copyright notice associated with the article.