
Abstract
Cerebrovascular reactivity (CVR)-weighted blood-oxygenation-level-dependent magnetic resonance imaging (BOLD-MRI) experiments are frequently used in conjunction with hyperoxia. Owing to complex interactions between hyperoxia and hypercapnia, quantitative effects of these gas mixtures on BOLD responses, blood and tissue R2∗, and blood oxygenation are incompletely understood. Here we performed BOLD imaging (3T; TE/TR = 35/2,000 ms; spatial resolution = 3×3×3.5 mm3) in healthy volunteers (
INTRODUCTION
Assessment of hemodynamic impairment is critical when informing management decisions in patients with cerebrovascular disease. Clinically, evolution of cerebrovascular compromise is most commonly assessed with either computed tomographic angiography or catheter angiography, both of which are sensitive to intra-luminal changes but are not directly sensitive to tissue-level hemodynamics. As these methods require radiation exposure and exogenous contrast agents, they are also sub-optimal for longitudinal monitoring of reperfusion or hemodynamic decline.
A possible alternative, or complement, to conventional imaging is hypercapnia-induced cerebrovascular reactivity (CVR)-based mapping using magnetic resonance imaging (MRI) modalities such as blood-oxygenation-level-dependent (BOLD) and/or arterial spin labeing (ASL) MRI.1–4 In such methods, a vasoactive stimulus is administered pharmacologically5,6 or through a hypercapnic respiratory challenge7–9 of mildly elevated CO2 (e.g., 4% to 6% CO2 in balance air), which relaxes arteriolar smooth muscle leading to an increase in cerebral blood flow and volume (
CVR mapping using non-invasive hypercapnic stimuli is an appealing alternative to other approaches that require pharmacological or exogenous contrast agents; however, obvious concerns related to eliciting hypercapnia in patients with low blood oxygenation and/or ischemic tissue preclude widespread application. To reduce these concerns, it is also possible to administer a hypercapnic-hyperoxic (
Administration of a
The aim of the current study was to address these limitations by assessing CVR measurements obtained using straightforward
MATERIALS AND METHODS
Volunteer Demographics
Healthy volunteers (
MRI Experiment
MRI measurements were performed at 3.0 T (Philips Healthcare, Best, The Netherlands). Participants were fitted with a nasal cannula (Salter Labs, Arvin, CA, USA, no. 4000) for end-tidal CO2 (
The stimulus paradigm consisted of a 29-minute run during which subjects were presented with periods of hypercapnic stimuli interleaved with a baseline gas (
Hypercapnic-normoxia (
Hypercapnic-hyperoxia (
Hypercapnic-hyperoxia (
Each baseline period lasted 150 seconds while each stimulus period lasted 90 seconds. Each respiratory challenge (e.g., stimulus and baseline block) was repeated twice in each volunteer, and the pairing order was randomized across all subjects. Single-shot gradient-echo Cartesian EPI BOLD acquisitions were acquired using body coil transmit and an eight-channel SENSE head coil (Nova Medical, Waltham, MA, USA) for reception with
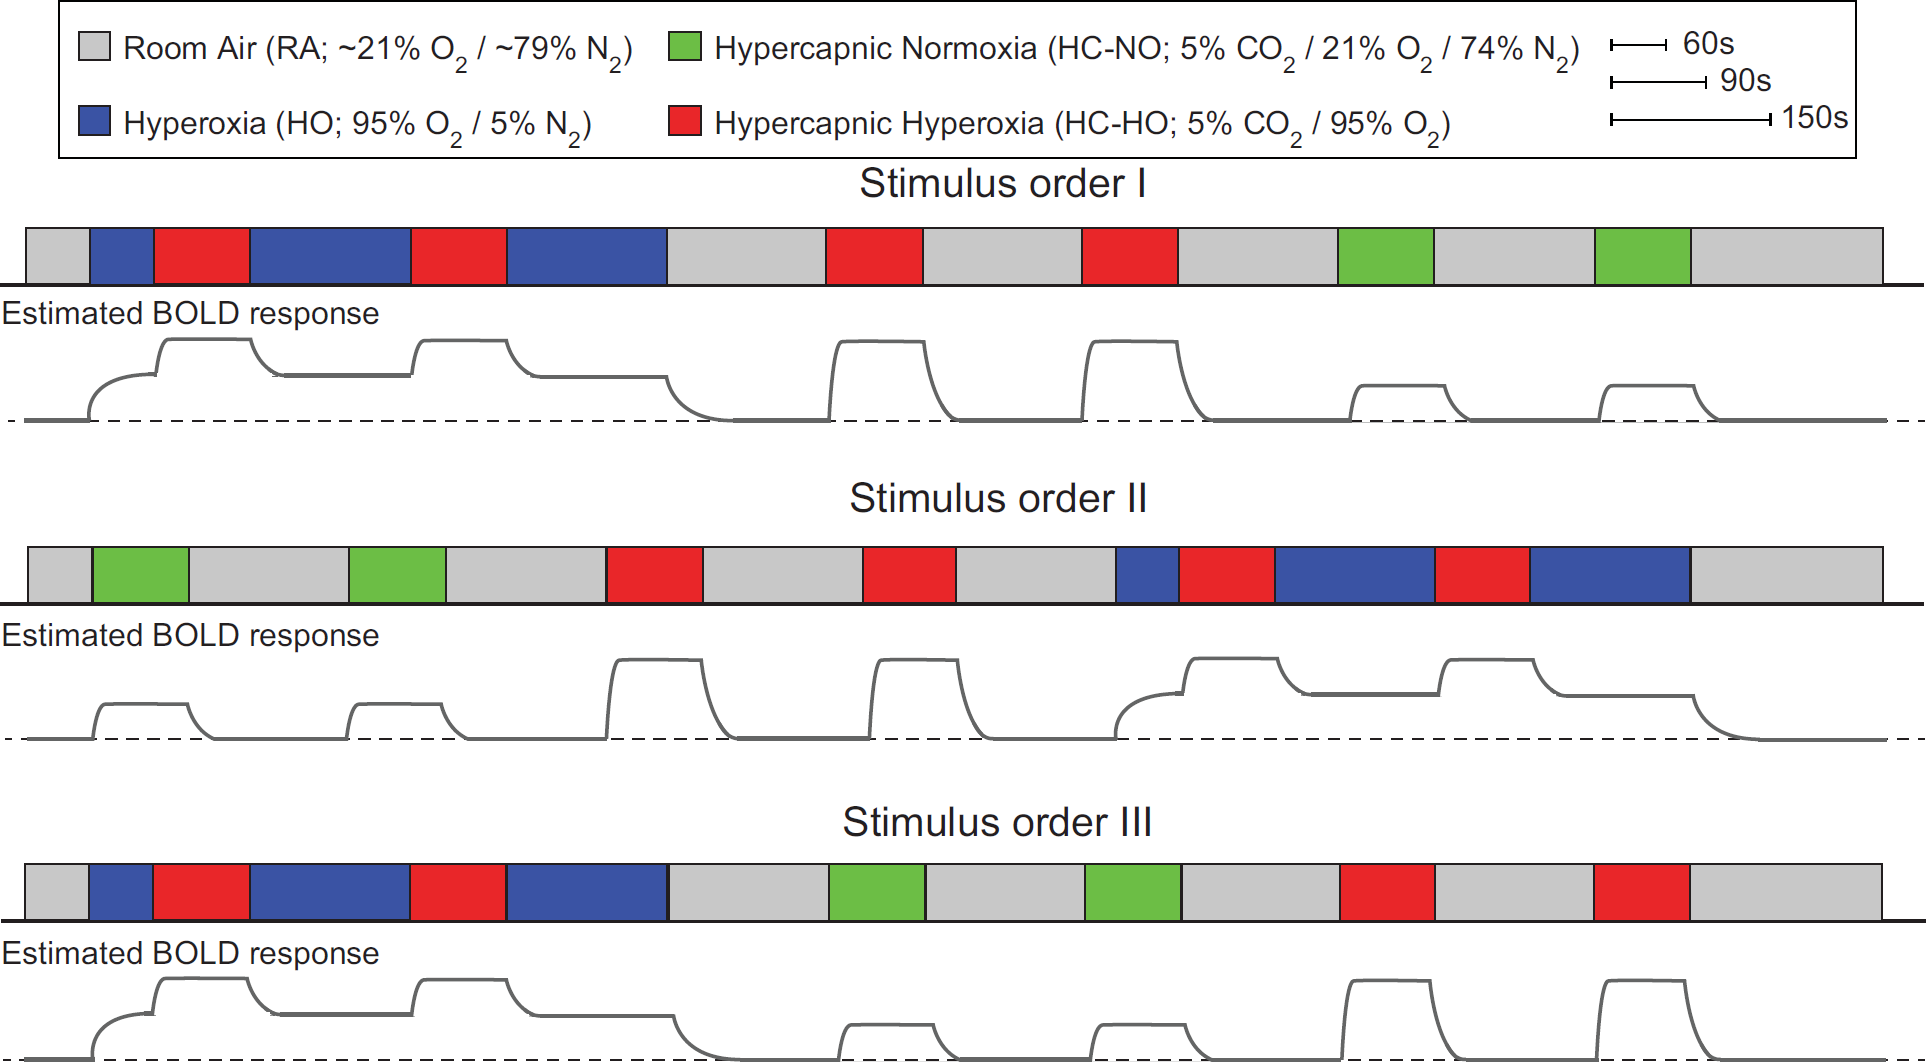
The respiratory stimulus consisted of alternating 90-second (stimulus) and 150-second (baseline) gas pairings, each repeated twice. The total paradigm lasted approximately 29 minutes and was randomized in three different orderings (I to III) across the 12 healthy volunteers. BOLD, blood-oxygenation-level-dependent.
Finally, to quantify the baseline venous oxygenation level, which is required for quantitative determination of blood oxygenation changes with different gas stimuli, we applied the T2-relaxation-under-spin-tagging (TRUST)
25
method in all subjects during
Analysis
All TRUST processing used in-house MATLAB (Mathworks, Natick, MA USA) scripts. Data were motion-corrected and pair-wise subtracted to obtain a difference magnetization image for each of the four eTEs, and four voxels within the sagittal sinus were analyzed per subject. Owing to distal venous labeling and identical magnetization transfer effects in control and label conditions, the tissue signals in control and label conditions are identical and can be neglected when analyzing the difference signal. A previously published quantification procedure was applied
26
in which male
BOLD-weighted data were slice-time corrected and affine motion corrected using routines available in the FMRIB Software Library (FSL). 28 For each participant, T1-weighted images were segmented into gray matter (GM), white matter, and cerebrospinal fluid using the FMRIB Automated Segmentation Tool (FAST). 28
In-house Matlab (Mathworks) routines were used for baseline drift correction and signal extraction. Specifically, baseline drift correction for the entire time course was performed on a voxel-wise basis by quadratic polynomial regression, as outlined in the literature.29,30 This procedure was pursued to maintain signal change differences between different stimulus types that may be altered when using temporal filtering for drift correction.
Fractional signal change maps (ΔS/5; signal difference between baseline and stimulus over baseline signal) were calculated for each pair of stimulus blocks (two maps per condition), as well as an averaged signal change map, by comparing values from the last 15
Regions of interest for analysis of each baseline/stimulus pairing were calculated in two ways. First, for each participant, Z-statistic maps for each baseline/stimulus pairing were calculated from the preprocessed (slicetime, motion, and baseline drift corrected) data using FSL's FEAT;
28
FILM prewhitening was used for statistical processing. Resulting Z-statistics maps were thresholded at Z-value ⩾ 2 (⩾ 2 standard deviations above mean baseline signal) and binarized. The three resulting masks were then multiplied into a single mask which represented voxels that were activated in all three stimulus conditions. This
Finally, signal change maps were co-registered to a standard atlas (Montreal Neurological Institute; spatial resolution =4 mm isotropic) 31 using FLIRT to generate group-averaged signal change maps for visualization; 4 mm3 space was chosen to approximately match the original acquisition's spatial resolution.
Statistical Considerations
The primary experimental objective of this study was to assess the relationship between the study co-variates (e.g., gas stimulus type) and the BOLD signal change. Secondary objectives were to ensure repeatability of the CVR responses across volunteers and the different stimulus orderings, to directly compare the BOLD responses between the different gas stimulus pairings of interest, and to model the changes in blood oxygenation and
Although changes in
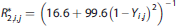
Blood Oxygenation and R* 2 Quantification
The purpose of this component of the study was to combine the data from different gas stimuli with previously published models of BOLD contrast and perform multivariate fitting to quantify the changes in venous blood oxygenation (
More specifically, the brain parenchyma can be divided into extravascular (e.g., tissue water) and microvascular (e.g., capillary+arteriole +venule water) compartments. Under conditions of breathing

for

for

Here baseline and activation (subscript
Multivariate fitting results
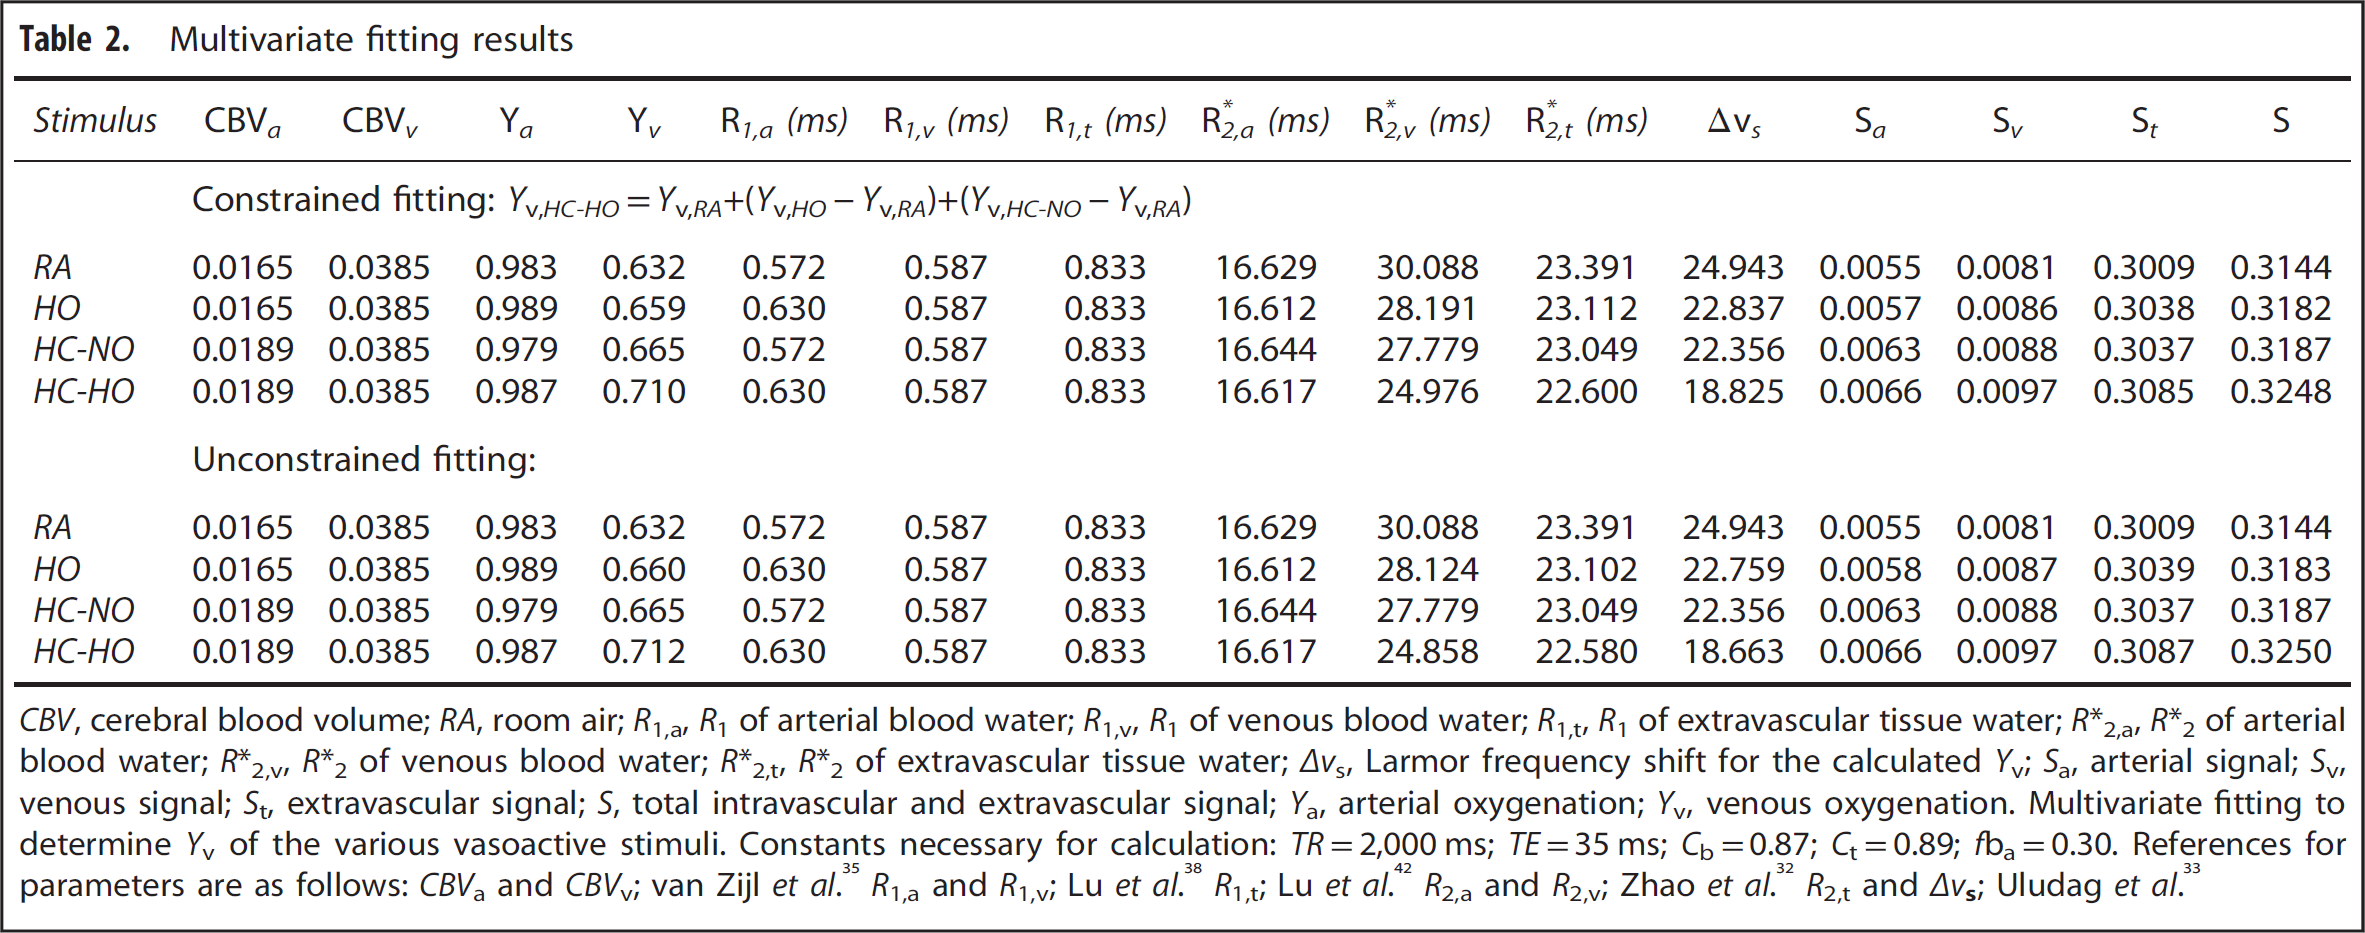
The remaining unknowns are the
First,
where

or
where
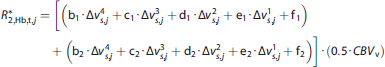
Note that the fitted coefficients were calculated for percentage of
Blood transverse relaxation rates were calculated from models developed
for
Therefore, the above equations allow for the intravascular and extravascular
We used a multivariate fitting routine to minimize the signal change error, calculated as the RSS, by solving for

and (ii) unconstrained fitting:
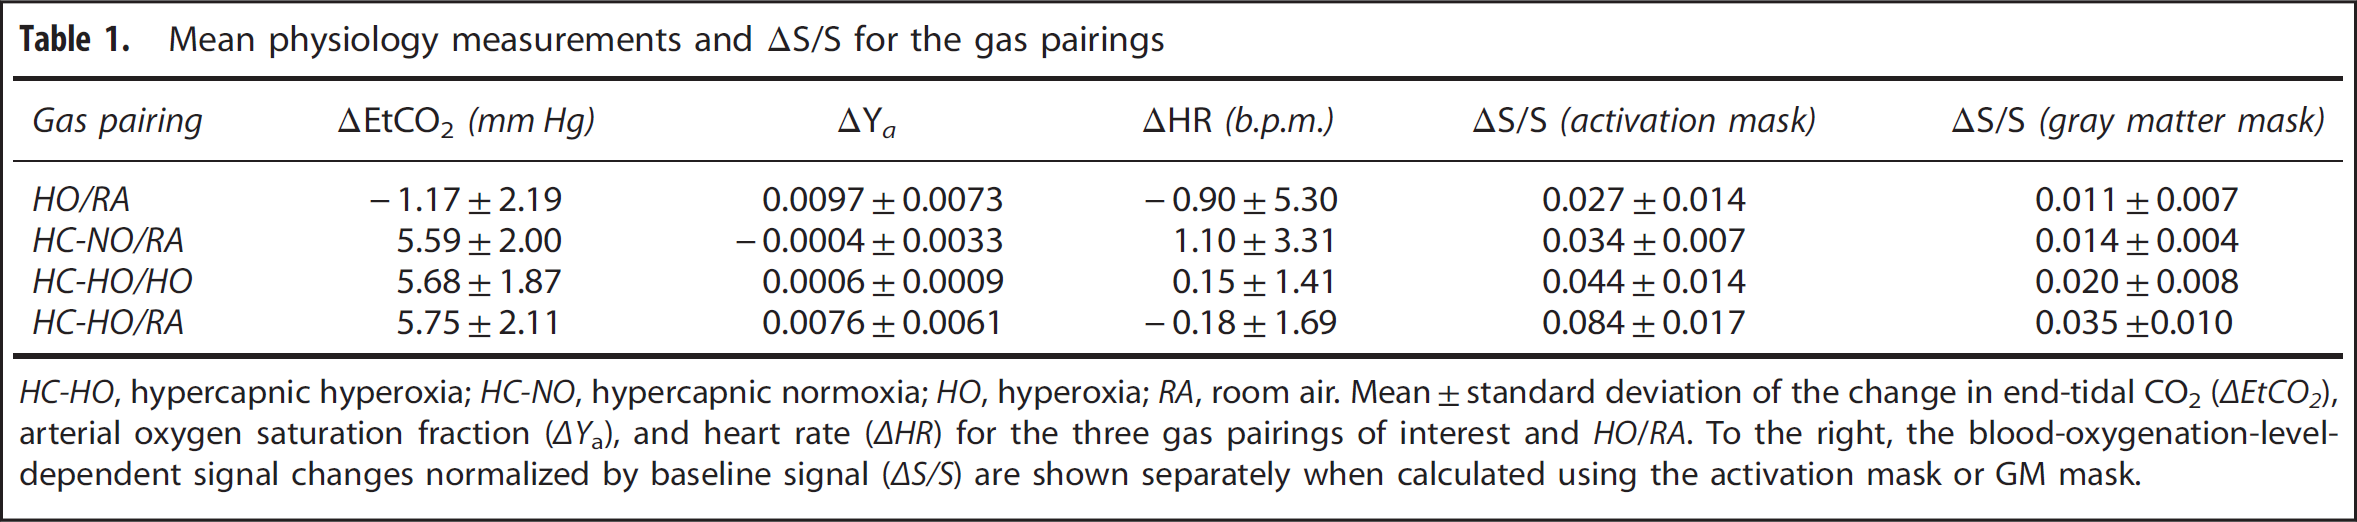
Mean physiology measurements and ΔS/S for the gas pairings
RESULTS
Physiologic Monitoring and Signal Change Reproducibility Table 1 summarizes the results from the physiologic monitoring during each breathing condition. Mean ±s.d.
Figures 2A and 2B, displays the activation (Z ⩾ 2.0) masks along with the GM mask for a representative subject. To enable all measurements to be performed within a typical MRI scan session (i.e., approximately 1 hour), stimulus durations were 90 seconds and baseline durations 150 seconds (similar to typical hypercapnic BOLD experiments in the literature). To evaluate whether these stimulus timings and the experimental gas delivery setup provided repeatable BOLD signal changes under the three different stimulus orderings, we evaluated the consistency of the signal changes between the two blocks of each stimulus (i.e., Figure 1). A similar comparison has been reported in the literature using
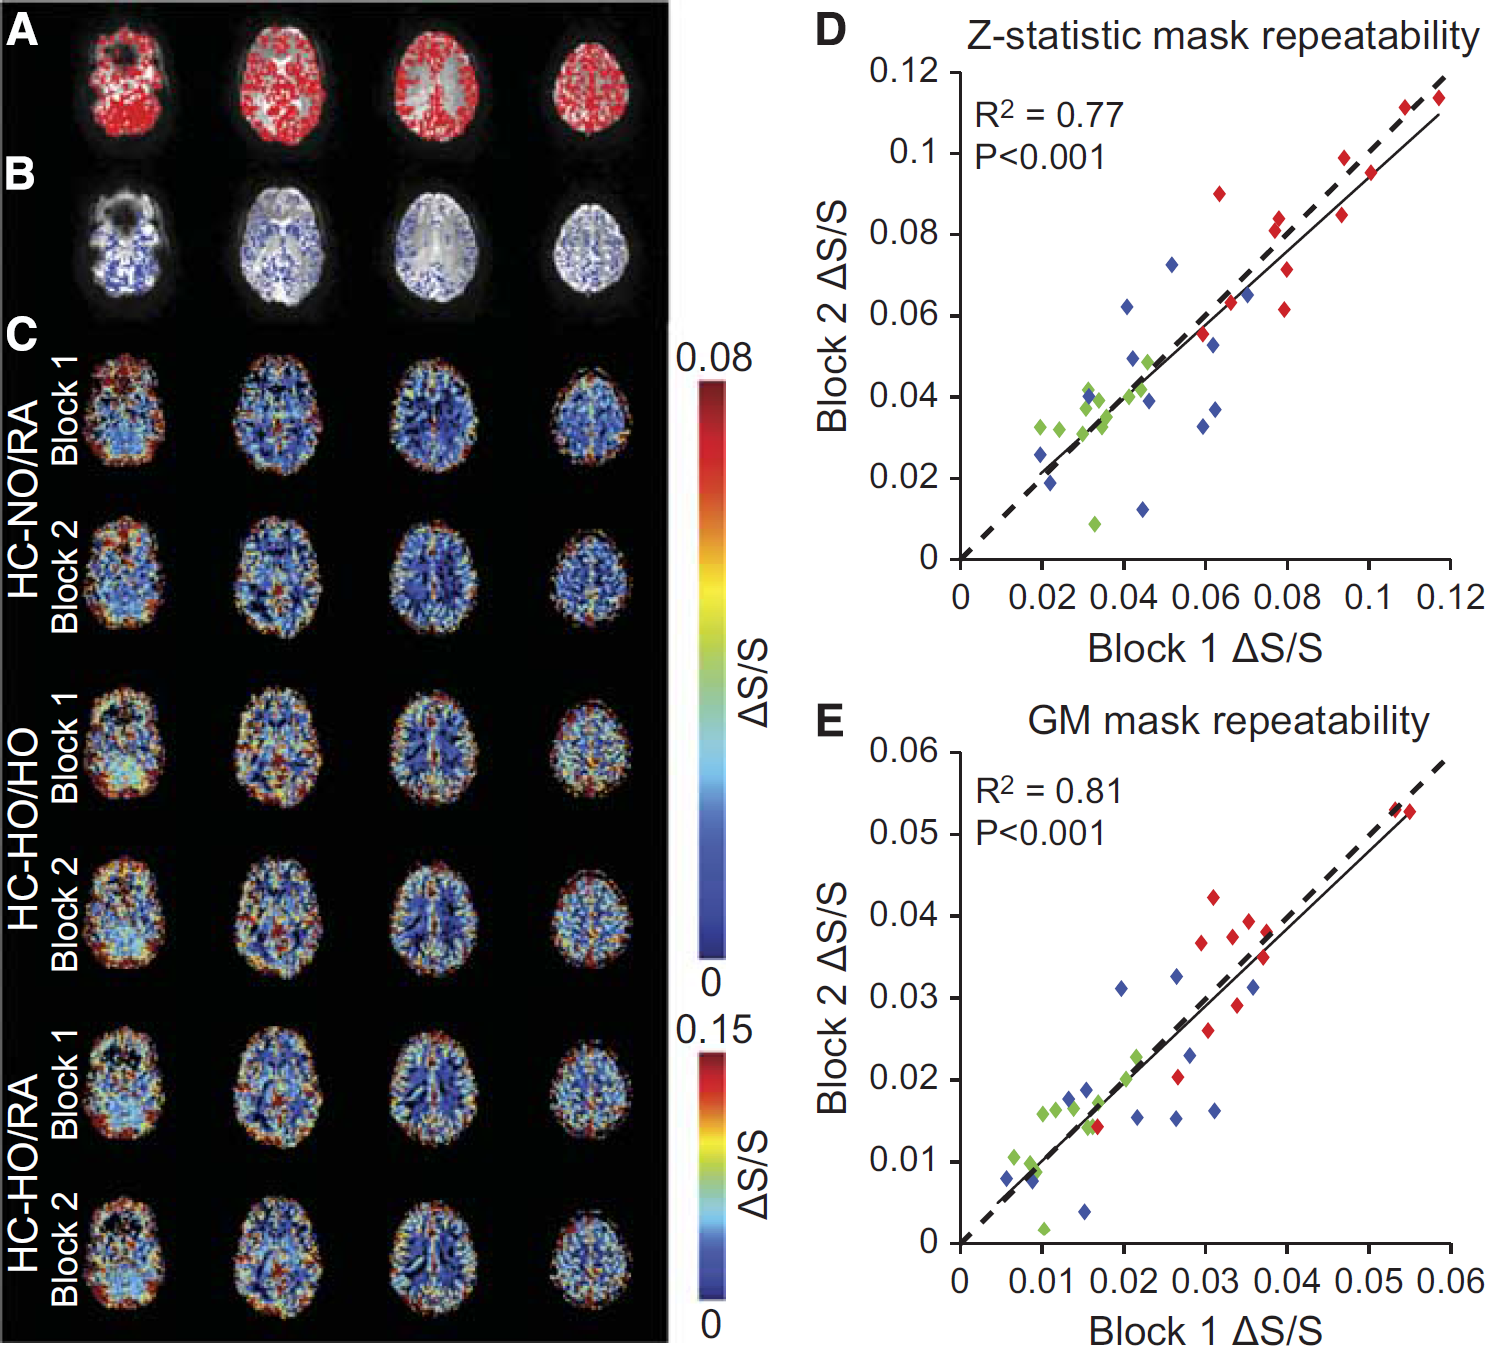
Regions of interest and repeatability. (
BOLD Signal Changes in Activated and Structural Regions-of-Interest
Figures 3A–3C show representative time courses from voxels that exhibited a stimulus-evoked response (Z ⩾ 2.0; activation mask) for all vasodilatory gas stimuli for three representative subjects. Figures 3D and 3E show the group-averaged signal time courses for each vasodilatory stimulus for all voxels within the activation and GM masks, respectively. Although the GM mask time course exhibits lower signal changes, as expected, the time course pattern is very similar to that of the activation mask; quantitative values are summarized in Table 1.
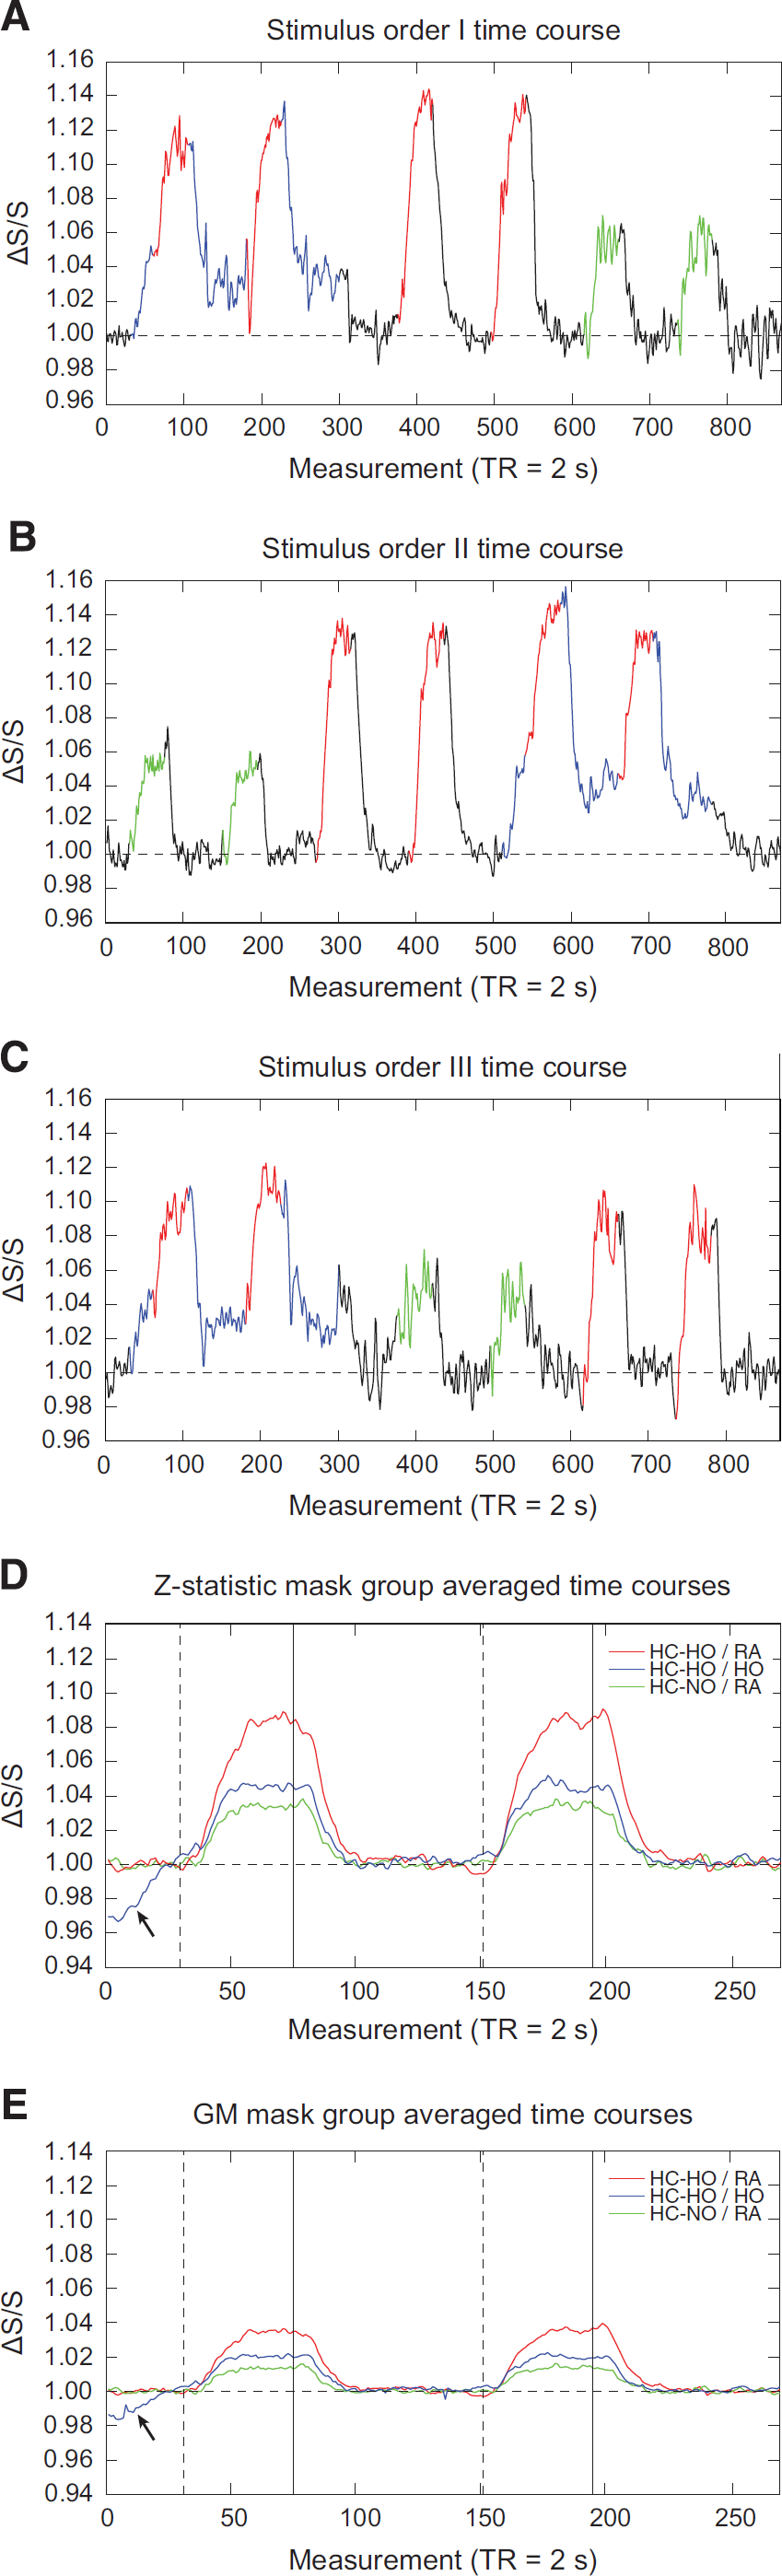
Stimulus ordering and group averaged time courses. (
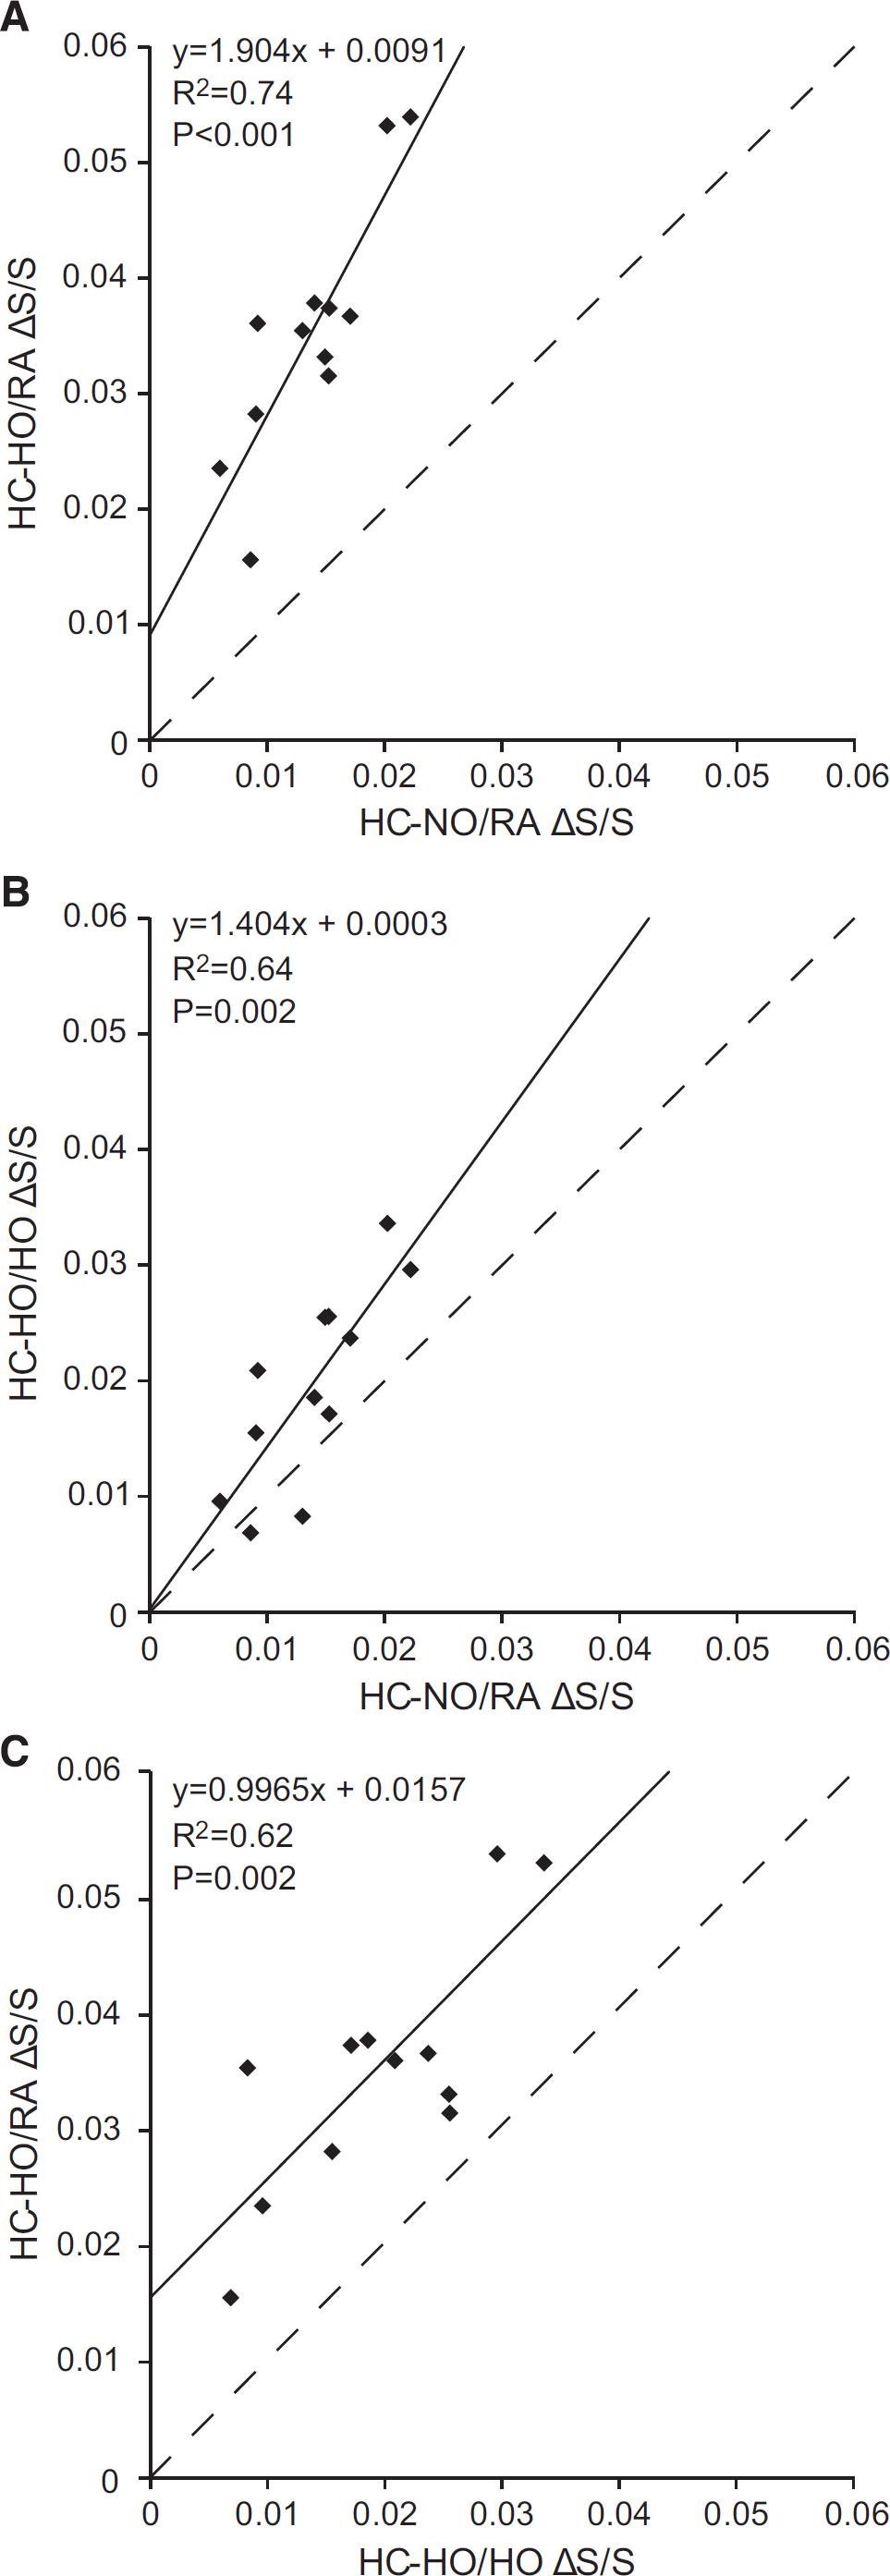
Figures 4A–4C show the GM signal change relationships between the different gas pairings for each participant. Figure 4A demonstrates that as expected
Comparison of blood-oxygenation-level-dependent signal changes (
Figure 5A shows the group-averaged fractional signal change maps for the three different stimulus pairings, along with the
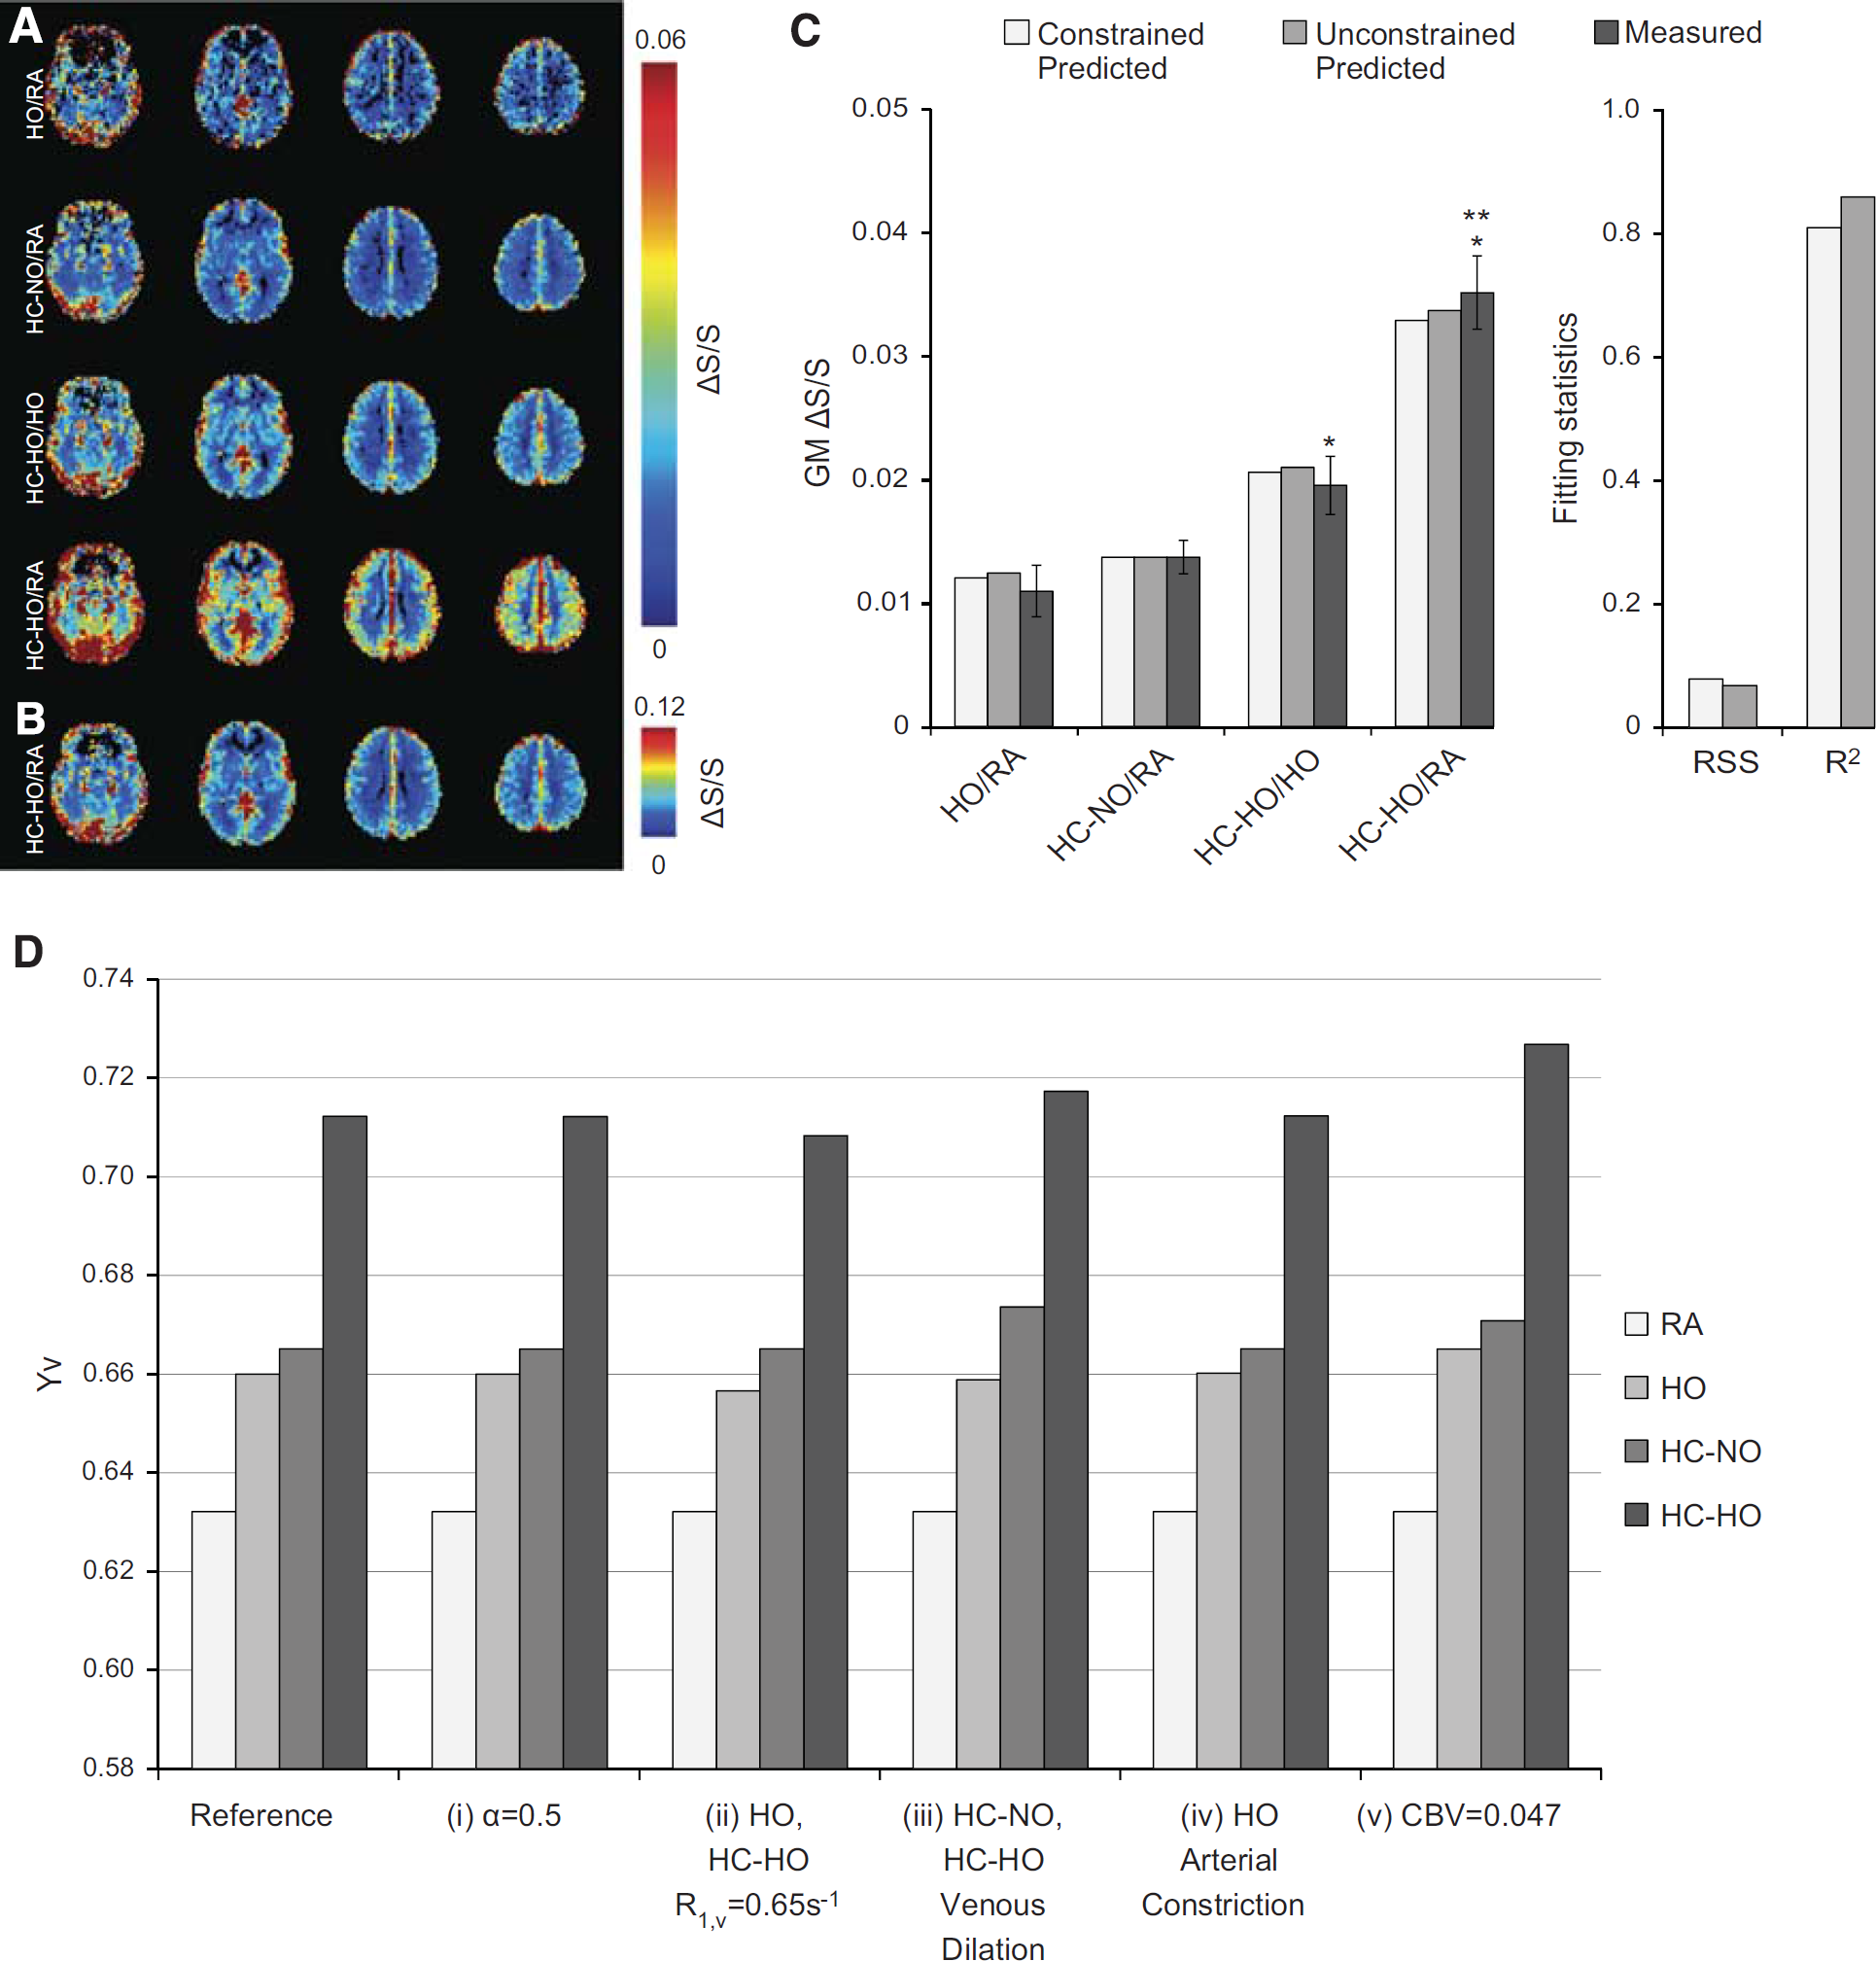
Group averaged fractional signal change maps, multivariate signal change fitting, and simulated effects of changes to physiologic assumptions on
Quantitative Changes in Blood Oxygenation and R*2
We modeled
All multivariate fitting was performed using the signal changes in the GM mask to avoid activation criteria from biasing the voxel composition. Under the first estimation scenario where
Figure 5D demonstrates
DISCUSSION
We examined the effects of interleaving a
BOLD Physiology in the Context of Hypercapnic Hyperoxia
The BOLD effect arises owing to fractional decreases in paramagnetic deoxy-hemoglobin (dHb) relative to diamagnetic oxy-hemoglobin (HbO2), primarily in capillary and venous blood water, which manifests as a shortening of both the intravascular blood and tissue water R2 and
conditions jugular
Our fitting results suggest that blood oxygenation levels during
Finally, to further understand how alterations of physiologic or MRI parameters affect fractional signal change and therefore the
Our results suggest that
It should be noted that it is critical to incorporate extravascular
Limitations
First,
Second, we did not use a multi-echo acquisition to calculate
Third, our multivariate fitting results for
Fourth, our physiologic results indicate that
Finally, we did not monitor EtO2 levels, as it was assumed that EtO2 was similar for all healthy volunteers for the same stimuli.
CONCLUSION
We have demonstrated that more comparable BOLD signal changes to standard
Footnotes
Carlos C Faraco: Involved in experimental design, model derivation, data acquisition, analysis, interpretation, and manuscript drafting and revision. Megan K Strother and Lori C Jordan: Involved in experimental design, data interpretation, and manuscript revision. Jeroen CW Siero: Involved in data acquisition, model derivation, interpretation, and manuscript revision. Daniel F Arteaga: Involved in data acquisition and manuscript revision. Allison O Scott: Involved in data interpretation and manuscript revision. Manus J Donahue: Involved in experimental design, model derivation, data acquisition, analysis, interpretation, and manuscript revision.
The authors declare no conflict of interest.
ACKNOWLEDGMENTS
The authors thank David Pennell, Leslie McIntosh, Kristen George-Durrett, Clair Kurtenbach, Charles Nockowski, and Christopher Thompson for experimental support.
References
Supplementary Material
Please find the following supplemental material available below.
For Open Access articles published under a Creative Commons License, all supplemental material carries the same license as the article it is associated with.
For non-Open Access articles published, all supplemental material carries a non-exclusive license, and permission requests for re-use of supplemental material or any part of supplemental material shall be sent directly to the copyright owner as specified in the copyright notice associated with the article.