
Abstract
Evaluation of cerebrovascular reactivity (CVR) to hypo- and hypercapnia is a valuable test for the assessment of vasodilatory reserve. While hypercapnia-induced CVR testing is usually performed at normoxia, mild hyperoxia may increase tolerability of hypercapnia by reducing the ventilatory distress. However, the effects of mild hyperoxia on CVR was unknown. We therefore recruited 21 patients with a range of steno-occlusive diseases and 12 healthy participants who underwent a standardized 13-minute step plus ramp CVR test with a carbon dioxide gas challenge at the subject’s resting end-tidal partial pressure of oxygen or at mild hyperoxia (P
Introduction
The changes in cerebrovascular reactivity (CVR) to both hypocapnia and hypercapnia are a reliable indicator of the extent of hemodynamic disruption engendered by underlying cerebrovascular disease such as cerebral steno-occlusive disease (SOD). 1 In patients who develop effective compensatory changes such as neovascular collateral blood flow, cerebral flow patterns may normalize, particularly at rest. 2 Abnormalities in flow distribution may nevertheless be elicited by stimulating an increased flow demand beyond what existing compensatory vasculature can supply.
The vascular response to hypercapnia causing vasodilation and hypocapnia causing vasoconstriction have been long known.3,4 Cerebral vascular response with visually evoked neural activation have been measured with H215O and positron emission tomography (PET) where regional differences
5
and age-related changes
6
were examined. Furthermore, changes in cerebral blood flow (CBF) (and cerebral blood volume (CBV)) during hypocapnia and hypercapnia were measured with H215O, 11CO and PET.7,8 Hemodynamic behaviors have also been previously examined with magnetic resonance imaging (MRI).
9
CVR reflects the ability of the cerebral vasculature to respond to a vasodilatory stimulus. CVR had been defined as %ΔCBF per ΔmmHg CO2.
10
However, CVR is usually measured as the change in blood oxygen-level dependent (BOLD) MRI signal (Δ S) as a surrogate for the change in regional CBF to a vasodilatory stimulus in response to an increase in the end-tidal partial pressure of CO2 (P
At our institution, a standardized hypercapnic protocol establishes a baseline BOLD signal distribution at the individual’s resting P
We previously examined the test-retest differences between subjects and across different scanner platforms in healthy controls and found no difference in CVR.
23
However, the repeatability of the CVR protocol in patients with SOD has not been examined. In addition, the effect of increased inspired P
Methods
Ethical approval
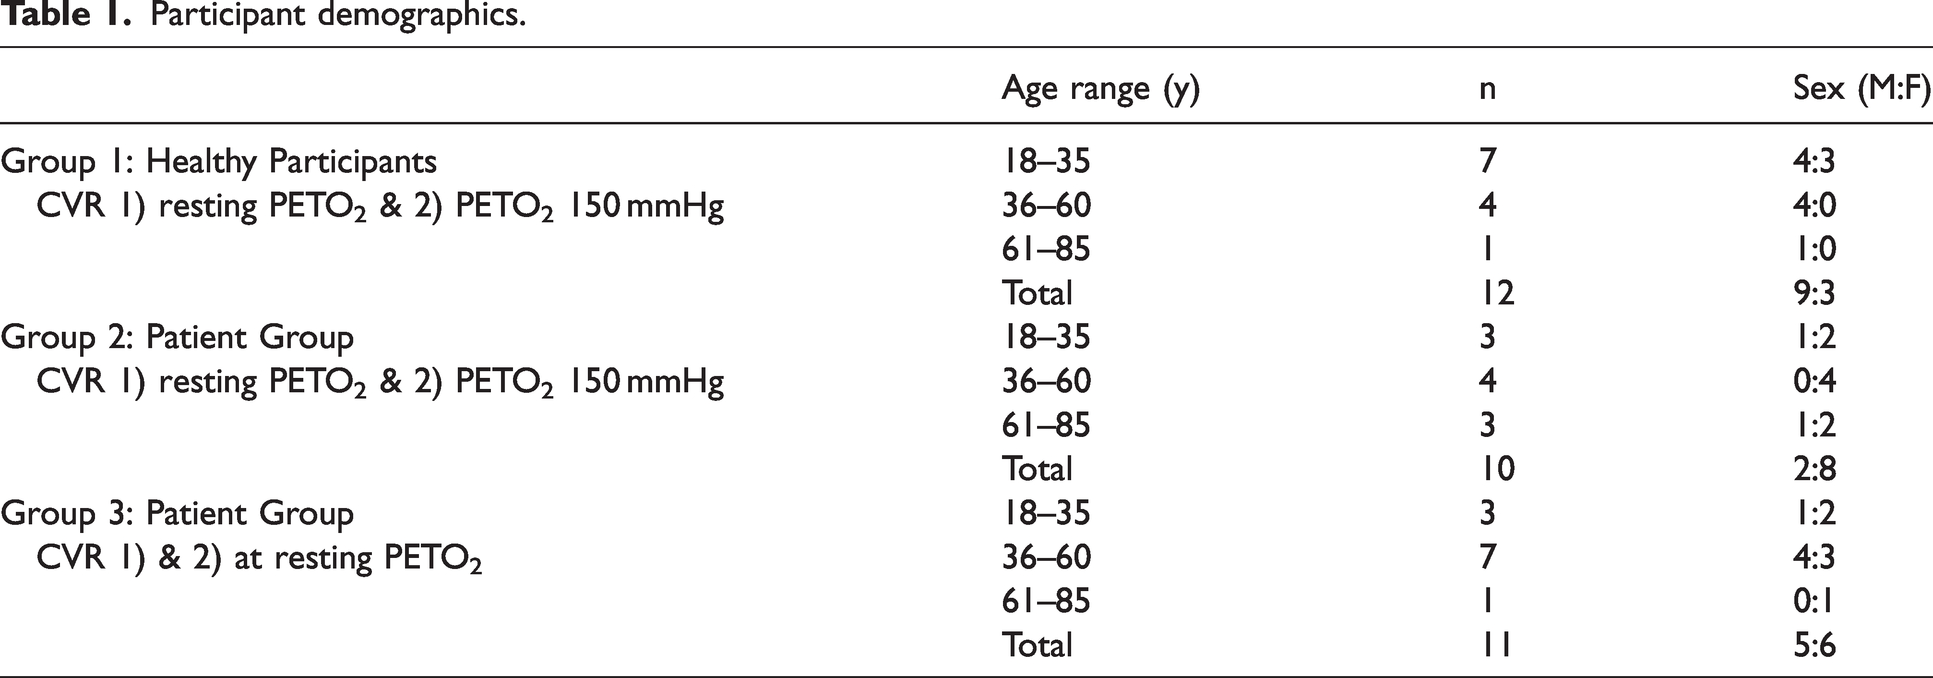
This study conformed to the standards set by the latest revision of the Declaration of Helsinki, except for registration in a database, and was approved by the Research Ethics Board of the University Health Network (UHN) and Health Canada. The reference number for this study is CAPCR 13-6536. All participants provided written and informed consent to participate in the study and their data was anonymized according to UHN protocols. The 12 healthy participants (3 Female), (Group 1), were referred by word of mouth. The participants were between the ages of 22 and 82 (mean (SD) = 39 ± 18 years, median = 32). The healthy participants were non-smokers, not on any medication and had no known history of neurological or cardiovascular diseases. The 21 patients with known cerebral vascular disease were recruited to the study from the outpatient Neurosurgery clinic, who are being followed with CVR testing for the natural history and progress of their steno-occlusive vascular disease for research purposes. The patients were further grouped by random assignment into two groups. Group 2 consisted of 11 patients (6 female) who underwent CVR at normoxia and again at hyperoxia. Group 3, consisted of 10 patients (6 Female) who underwent both CVR studies at normoxia. The participant demographics are displayed in Table 1 and patient characteristics are available in Supplementary Table 1.
Participant demographics.
Experimental protocol
For the CVR test, a facemask was fitted to the participant’s face using skin adhesive (Tegaderm, 3 M, Saint Paul, MN, U.S.A.) and inspired gas provided via an automated programable gas blender (RespirAct™, Thornhill Medical, Toronto, Canada) which controlled P
The P
The standardized BOLD and P
All participants underwent 2 CVR tests at the same MRI session with 20 minutes between CVR tests. For Groups 1 and 2, their respective resting P
Data acquisition
The scans were acquired on a 3-Tesla scanner (HDx Signa platform, GE healthcare, Milwaukee, WI, USA) with an 8-channel head coil. The same fast spoiled gradient echo (FSPGR) T1-weigthed scan and two BOLD sequences with identical scanning parameters that were each 13 minutes and 20 seconds long, were acquired for all participants. The FSPGR scan was a high-resolution T1-weighted scan with a 3D spoiled gradient echo sequence. The following parameters were used: TI = 450 ms, TR 7.88 ms, TE = 3 ms, flip angle = 12°, voxel size = 0.859 × 0.859 × 1 mm, matrix size = 256 × 256, 146 slices, field of view =24 × 24 cm, no interslice gap. Next, the two BOLD sequences consisted of a T2*-weighted echoplanar imaging gradient during the P
Data analysis
The acquired MR images were imported into Analysis of Functional NeuroImages (AFNI) software (National Institutes of Health, Bethesda, Maryland).
33
The BOLD signals from the two CVR tests were volume registered, slice-time corrected and co-registered to the anatomical images. The high-resolution T1-weighted (FSPGR) images were segmented into gray matter (GM) and white matter (WM) using SPM8 (Wellcome Department of Imaging Neuroscience, Institute of Neurology, University College, London, UK). The CVR was analyzed in an identical manner for all 3 groups. First, to account for the delay in gas sample arrival at the sensor, the P
Statistical analysis
Using SigmaStat (Systat Software, San Jose, California, USA), a Friedman One-Way Repeated Measure Analysis of Variance (rmANOVA) by ranks was performed when the normality test (Shapiro-Wilk) failed to determine significant difference between resting P
Data availability statement
Anonymized data will be shared by request from any qualified investigator for purposes such as replicating procedures and results presented in the article provided that data transfer is in agreement with the University Health Network and Health Canada legislation on the general data protection regulation. All data supporting the results in this paper are provided as Supporting Information for Online Publication.
Results
Resting PETCO2 and PETO2 between two CVR scans
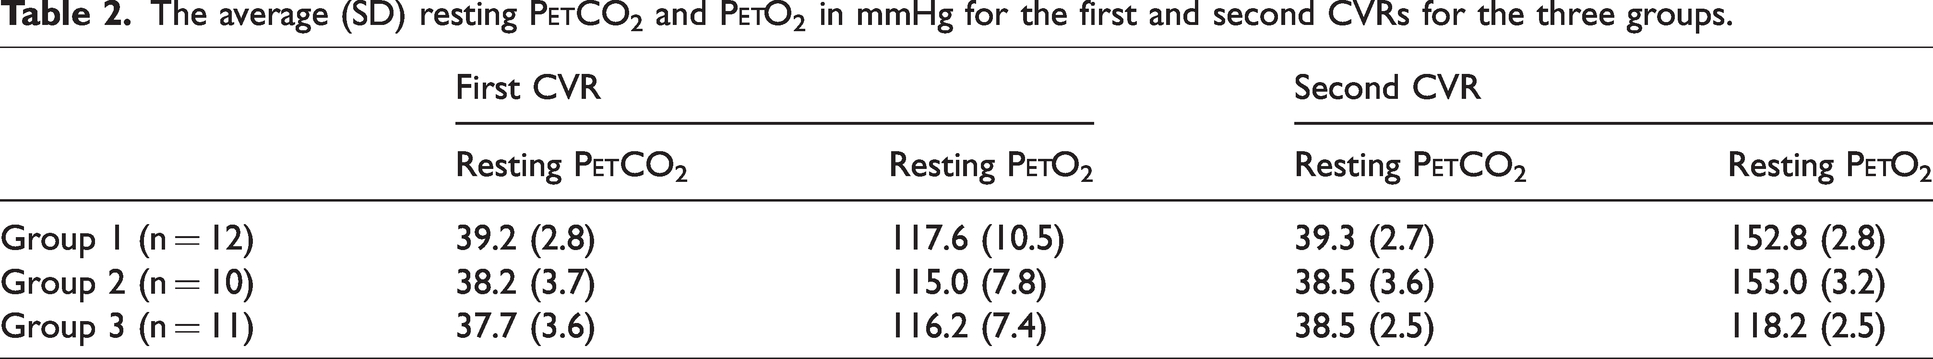
To determine consistency and accuracy between the two CVR tests for each participant in all groups, the resting P
The average (SD) resting P
CVR comparison in groups 1 & 2
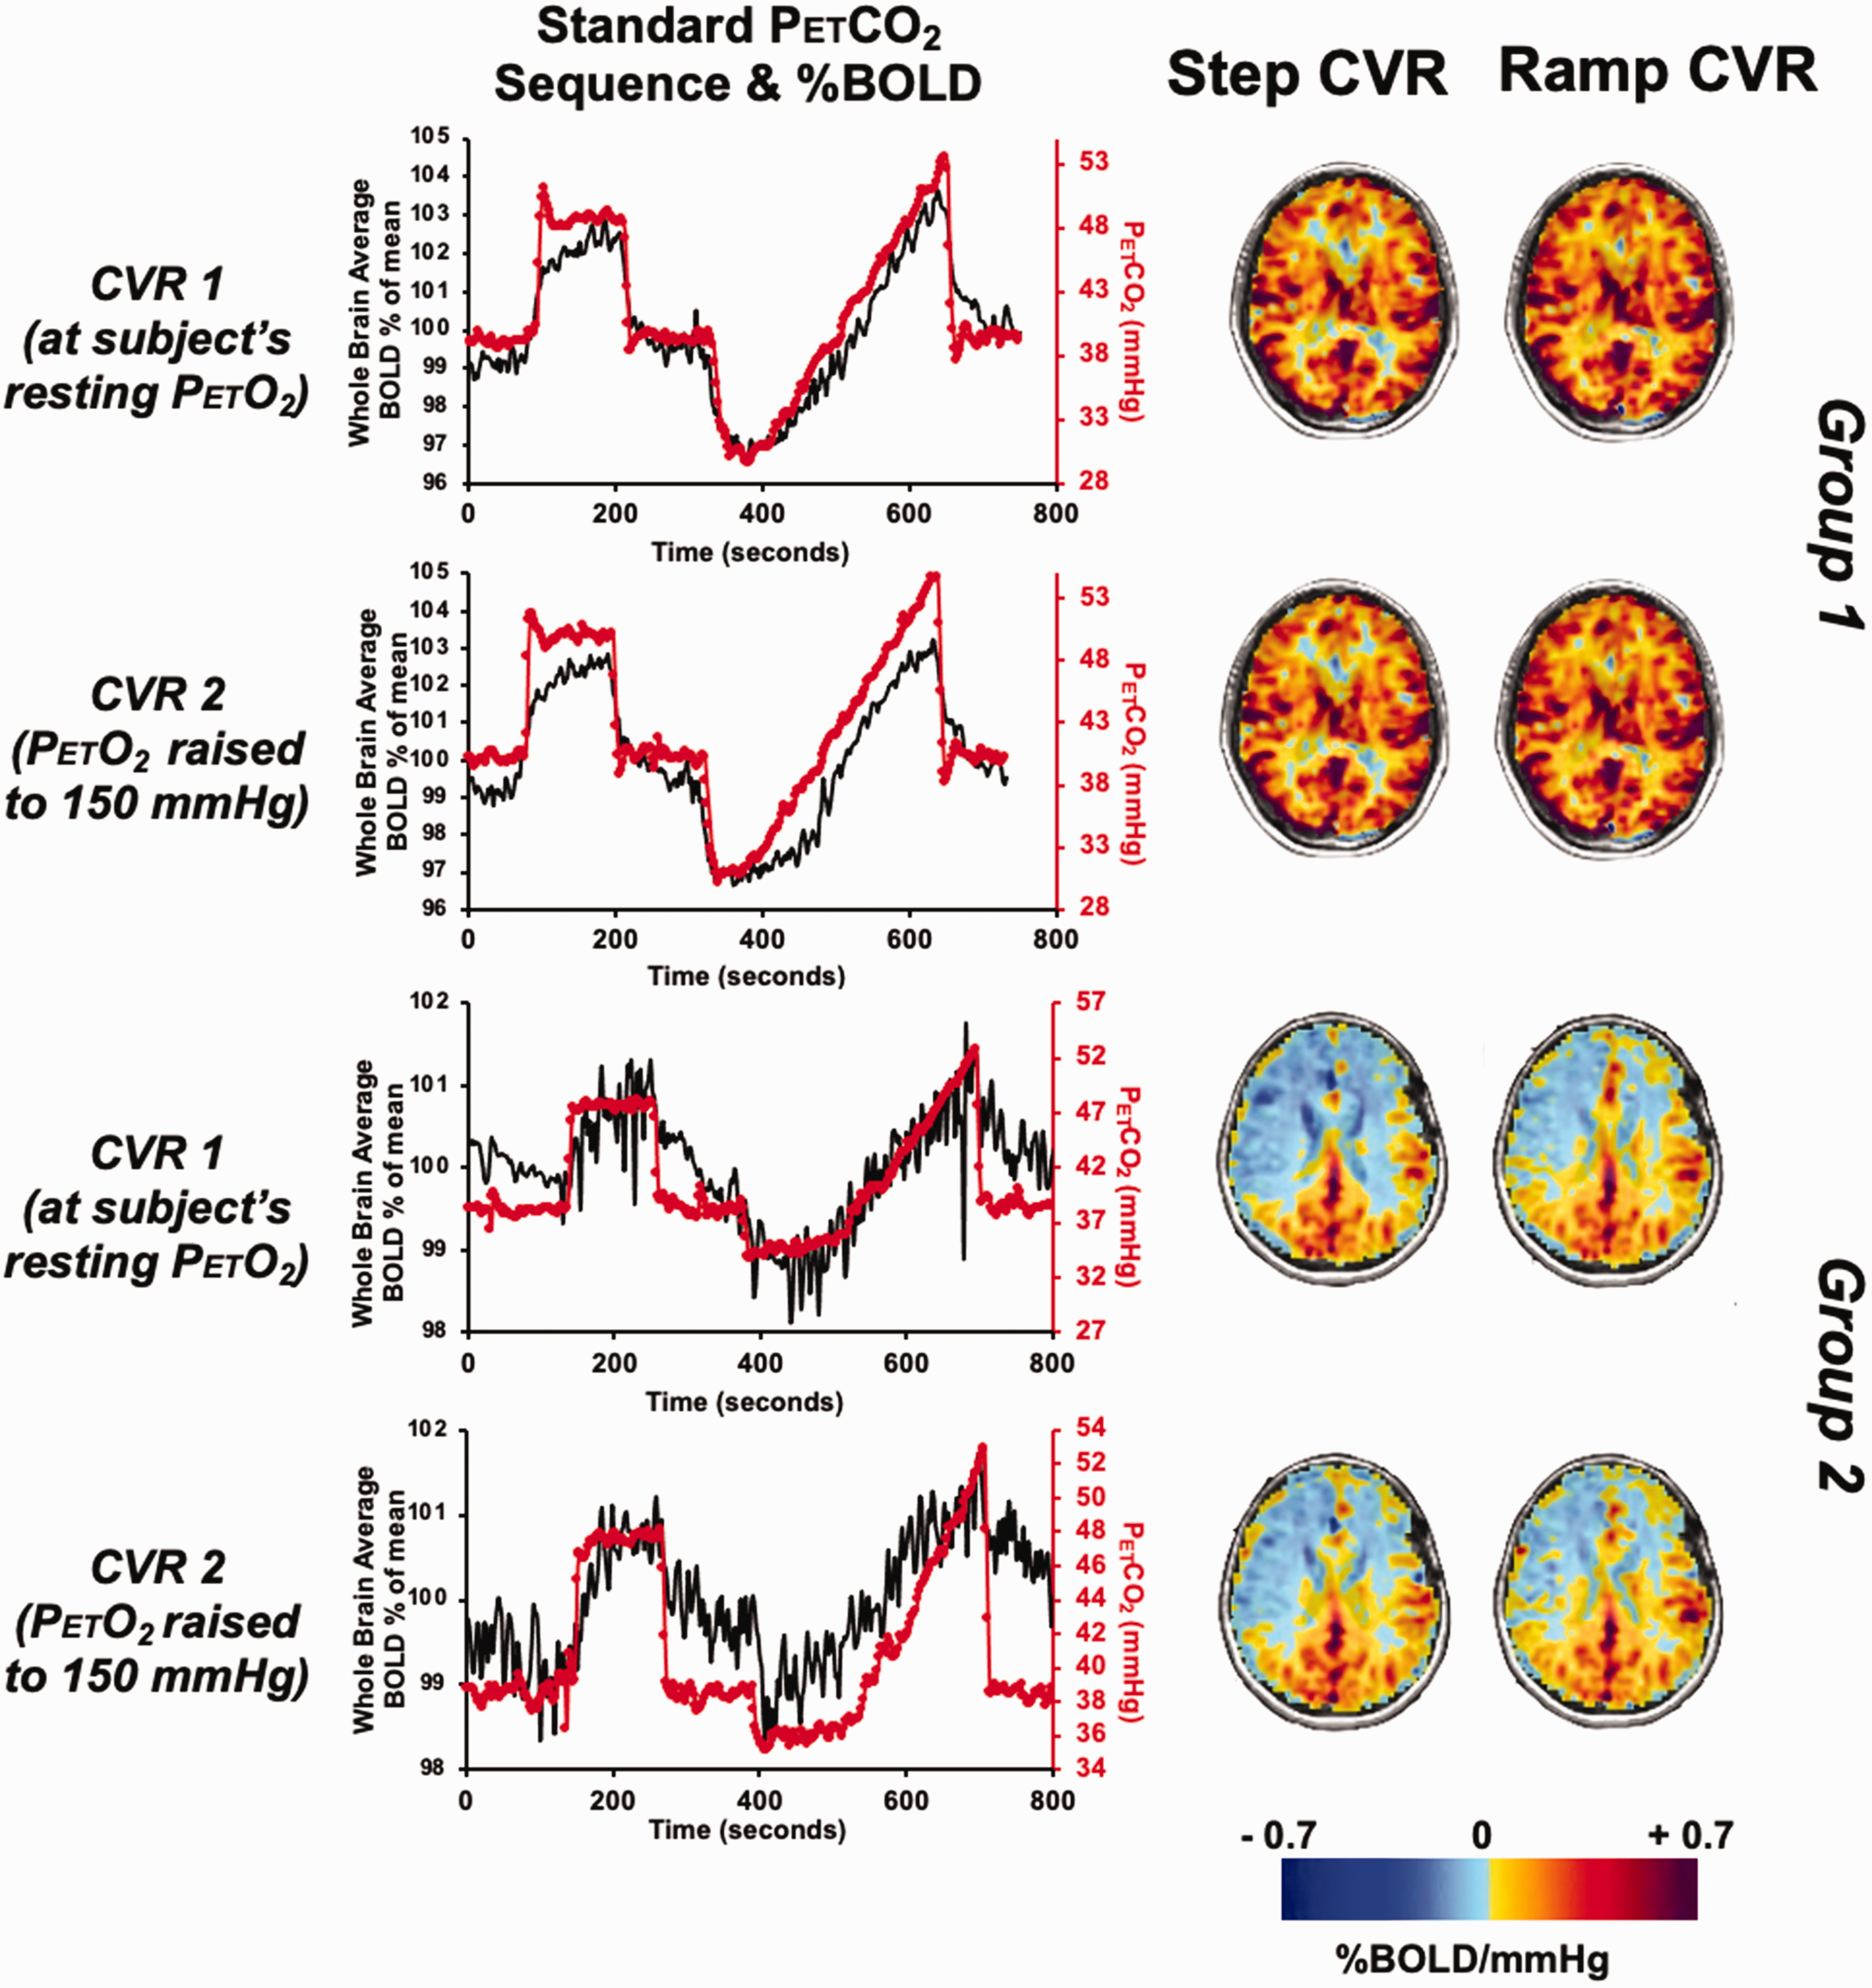
Figure 1 displays the standardized P
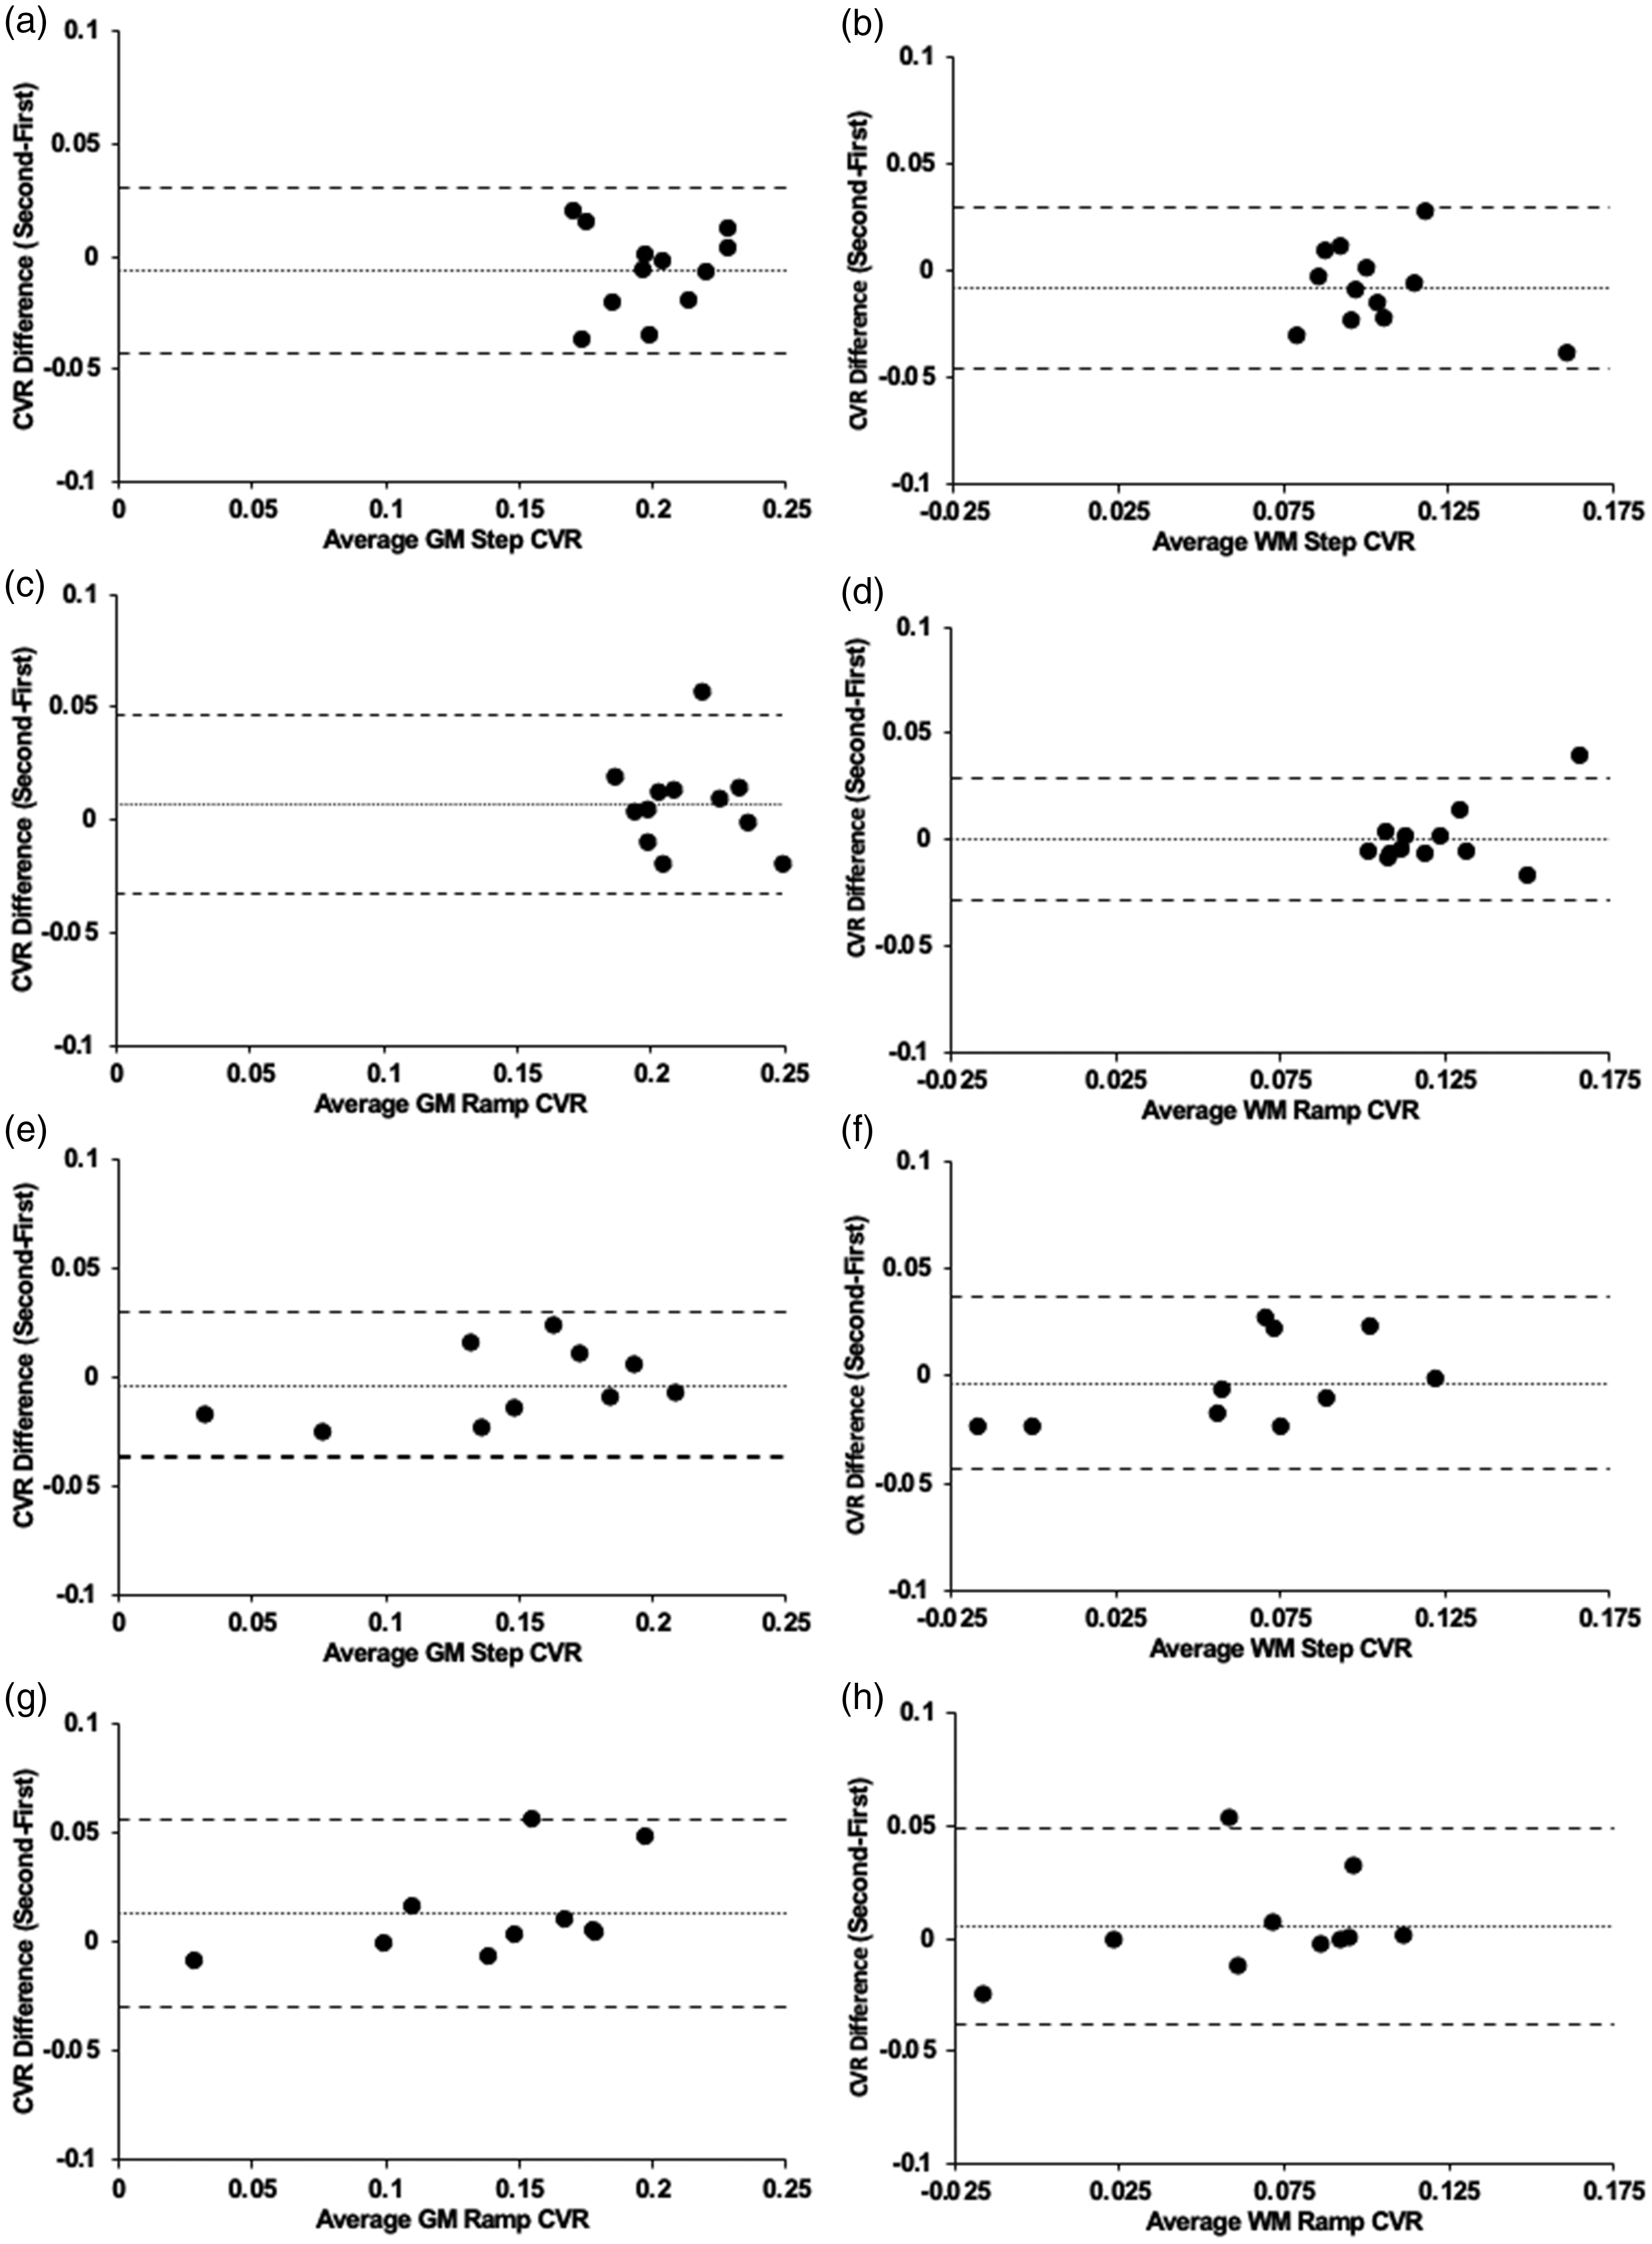
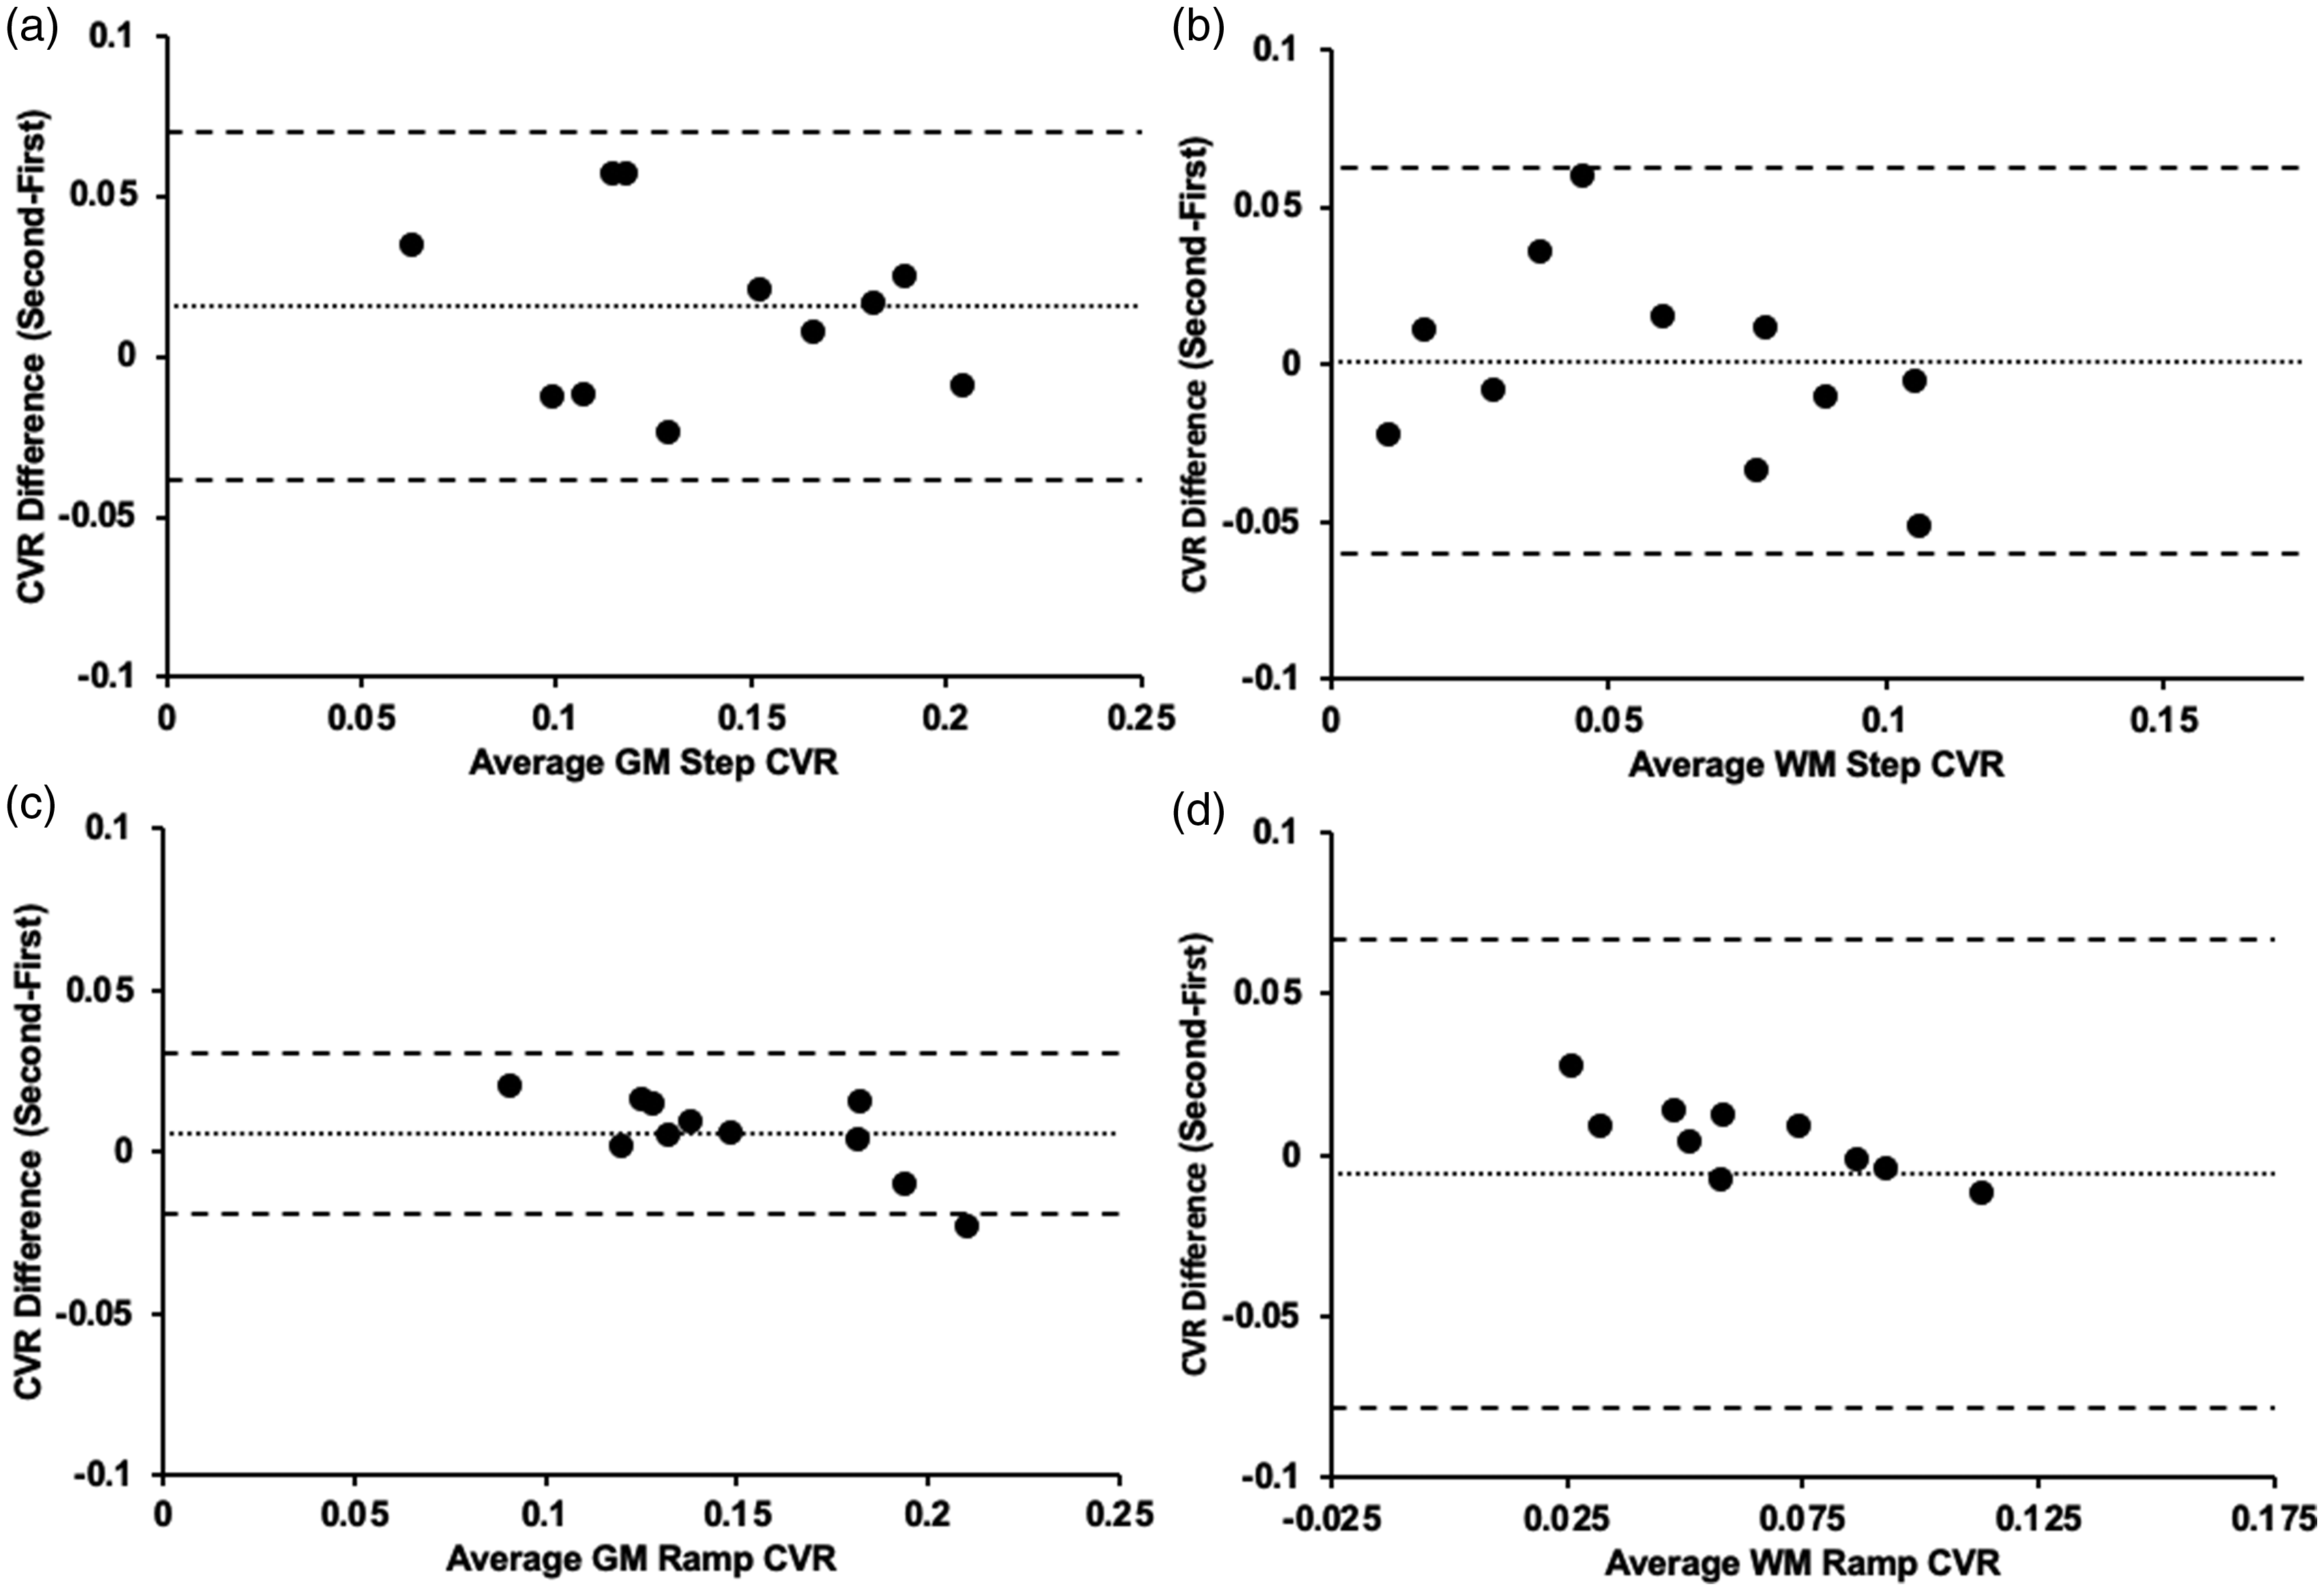
Bland-Altman plots comparing the first and second CVR differences. (a) average GM step CVR for Group 1 (n = 12) (p = 0.295) (b) average WM step CVR for Group 1 (p = 0.175) (c) average GM ramp CVR for Group 1 (p = 0.279) (d) average WM ramp CVR for Group 1 (p = 0.889) (e) average GM step CVR for Group 2 (n = 10) (p = 0.508) (f) average WM step CVR for Group 2 (p = 0.662) (g) average GM ramp CVR for Group 2 (p = 0.889) and (h) average WM ramp CVR for Group 2 (p = 0.474). Note: Solid line depicts bias, and the dashed lines show the 95% upper and lower limits of agreement as the mean difference. CVR in %BOLD/mmHg.
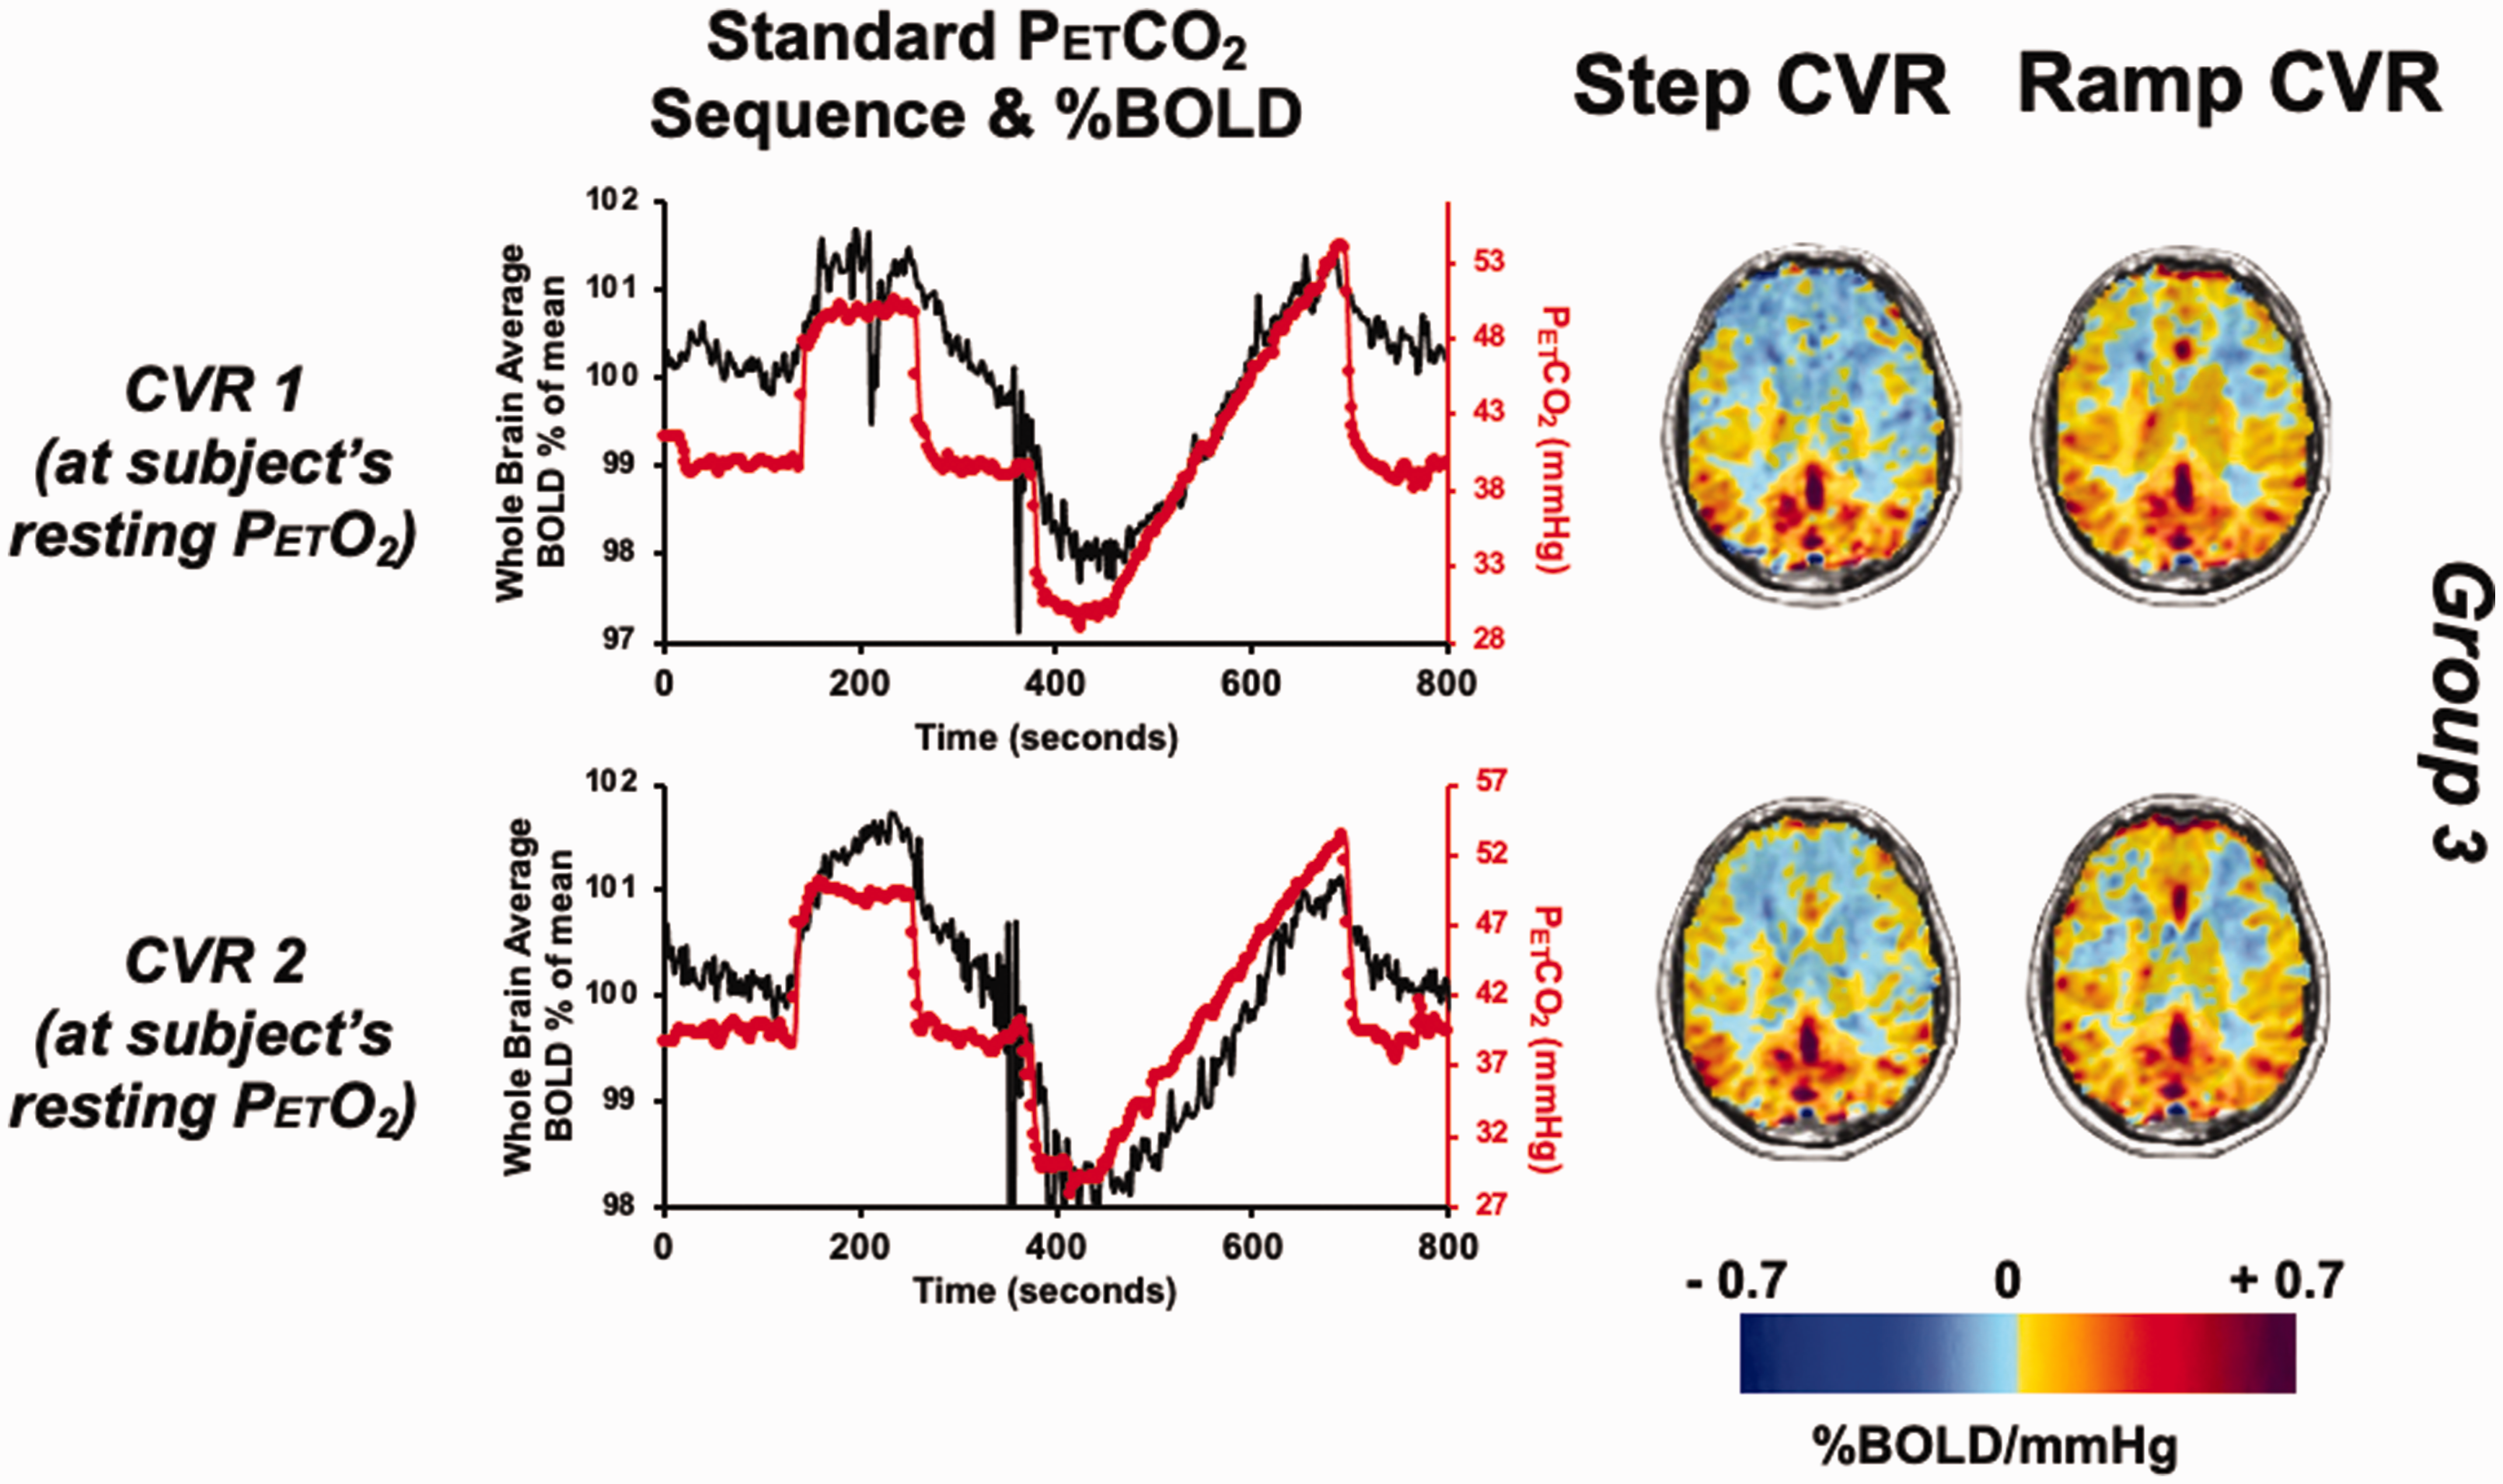
CVR comparison in groups 3 (test re-test differences) at normoxia
The standard P
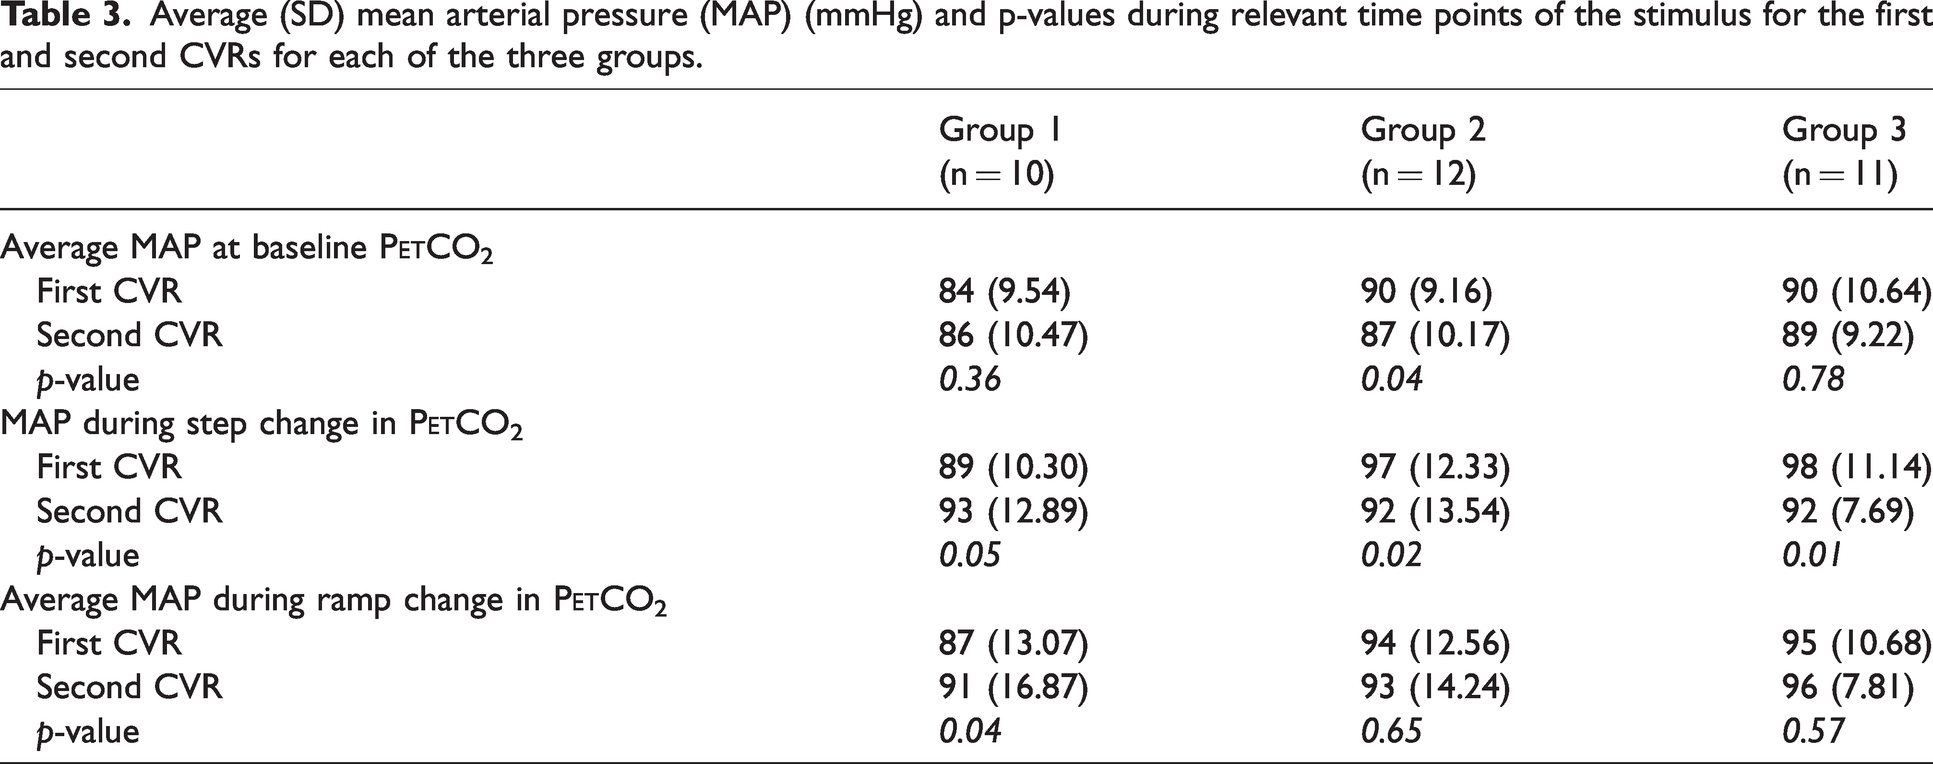
Changes in blood pressure
The MAP values and their p-values are reported in Table 3.
Average (SD) mean arterial pressure (MAP) (mmHg) and p-values during relevant time points of the stimulus for the first and second CVRs for each of the three groups.
Discussion
The main findings of this study is that both in healthy controls and patients with SOD, there was no significant differences between a CVR test done at the subjects resting P
As a result of this study, we have the confidence that a CVR test performed under mild hyperoxia would still be comparable to previous tests performed under normoxia. This data provides new information as to the degree of confidence available in the stability and reproducibility of CVR testing in patients with SOD tested with the same extent and pattern of vasoactive stimulus.
CVR testing with BOLD as a surrogate for CBF requires that P
CVR differences between GM and WM are presented visually (Figures 1 and 3) and numerically from the Bland Altman plots (Figures 2 and 4) and are congruent with those previously documented.37 –39 The ability to distinguish between the GM and WM allows for further exploration of diseases effecting vascular impairment and potential biomarkers. In particular, the ability to assess WM allows for the identification of individuals at risk of vascular dementia. 40
The standardized BOLD and P
Bland-Altman plots comparing the first and second CVR differences. a) average GM step CVR for Group 3 (n = 11) (p = 0.094) b) average WM step CVR for Group 3 (p = 0.991) c) average GM ramp CVR for Group 3 (p = 0.184) d) average WM ramp CVR for Group 3 (p = 0.763). Note: Solid line depicts bias, and the dashed lines show the 95% upper and lower limits of agreement as the mean difference.
Although we found that resting MAP values were not different between any of the CVR tests for all groups (Table 3). MAP at rest, during the step and ramp decreased between the first and second CVR test in the patient groups (Group 2 and 3). Average MAP during the ramp change in P
Hyperoxia had previously been shown not to have a significant effect on CBF,41 –44 consistent with our current finding. The small differences that hyperoxia may cause in CVR would result from the expected sparing effect of the oxygen dissolved in plasma on the development of venous deoxyhemoglobin (dOHb), but the overall effect is likely too small to be measured. Another implication of the sparing effect of hyperoxia is that the PETO2 must remain constant during CO2-induced CVR.
The increase in arterial oxygen partial pressure to 150 mmHg will increase the dissolved oxygen in the plasma resulting in a trivial increase in the arterial oxygen content and no effect on the venous oxygen saturation which is the origin of the BOLD signal.45,46
CVR protocol
Our standardized hypercapnic breathing protocol consists of a step and ramp increase in P
With a step increase in P
By contrast, the ramp increase in P
This explains why the slow ramp increase in P
Study design
This study was designed so that every subject was their own control. Group comparisons or conclusions were avoided as it is nearly impossible to match pathology in clinical patients to create two groups that are “identical”. Even though each subject is different from the other in terms of degree and pattern of stenosis and resting arterial gas concentrations, no significant differences between the CVR tests were found. It should be noted that the study was not designed to evaluate differences in absolute CVR between the tests.
Limitations
The effects of mild hyperoxia on comfort level of the participants was not evaluated in this study. We are less certain of any changes in ventilatory discomfort under mild hyperoxia due to the difficulty the subjects had in making such assessments as previously shown by Kahneman and Fredrickson.
49
The order of the CVR’s performed at normoxia and mild hyperoxia for Group 2 was not randomized as our current database consists of CVRs deployed at the subjects respective resting P
With its non-invasiveness, high spatial and temporal resolution, and general availability, BOLD MRI methods have been shown to be favorable compared with other measures of CBF such as PET and arterial spin labeling (ASL).50,51 BOLD MRI contrast arises from the magnetic susceptibility of dOHb in the voxel. Changes over a short time course of a minute, or seconds, are due primarily to corresponding changes of the rate of inflow of arterial blood, which dilutes or displaces dOHb in desaturated blood in capillaries and veins. 52 The relationship between CBF-based CVR and BOLD-based CVR is well-known to be nonlinear. 53 Fractional BOLD signal change, plotted as a function of fractional CBF change, calculated by Hoge et al. 53 predicts a function with a linear domain for increases in perfusion up to approximately 50%, after which it becomes nonlinear. In our study PCO2 increases of about 10 mmHg has been predicted to increase CBF by about 50%. 54 Cerebral blood volume changes concurrently with flow, but the changes in volume of dOHb are very small compared to the effects of dilution by up to a 50% increase in CBF. 55 In our study the inflowing blood was fully saturated under both normoxia and hyperoxia precluding to no differences in BOLD signal. Finally, the PCO2 in the normoxic and hyperoxic conditions are the same, so the small (if any) effect of PCO2 on CMRO2 and thereby on the BOLD signal would also be the same. Neuronal activation does occur during the duration of the BOLD MRI acquisitions, however we are unable to separate global CO2 stimulus effects from neuronal activation and have it subsumed in our measurements, including any changes in CBV or CMRO2.
Conclusion
We examined the difference between deploying a CVR test at mild hyperoxia (P
Supplemental Material
sj-pdf-1-jcb-10.1177_0271678X231197000 - Supplemental material for Determining the effects of elevated partial pressure of oxygen on hypercapnia-induced cerebrovascular reactivity
Supplemental material, sj-pdf-1-jcb-10.1177_0271678X231197000 for Determining the effects of elevated partial pressure of oxygen on hypercapnia-induced cerebrovascular reactivity by Ece Su Sayin, James Duffin, Julien Poublanc, Lashmikumar Venkatraghavan, David John Mikulis, Joseph Arnold Fisher and Olivia Sobczyk in Journal of Cerebral Blood Flow & Metabolism
Footnotes
Funding
The author(s) received no financial support for the research, authorship, and/or publication of this article.
Acknowledgements
The authors thank the MR technologist at Toronto Western Hospital for their help in acquiring the images.
Declaration of conflicting interests
The author(s) declared the following potential conflicts of interest with respect to the research, authorship, and/or publication of this article: JAF and DJM contributed to the development of the automated end-tidal targeting device, RespirAct™ (Thornhill Medical, TRI) used in this study and have equity in the company. OS and JD receive salary support from TRI. TRI provided no other support for the study. All other authors have no disclosures to report.
Authors’ contributions
Study design and conceptualization was performed by ESS, JD, JP, LV, DJM, JAF & OS. Images were acquired by ESS & JP. Data analysis was completed by ESS, JD, JP & OS. The initial draft was written by ESS, JD, DJM JAF & OS. All authors (ESS, JD, JP, LV, DJM, JAF & OS) participated in the feedback and multiple rounds of reviewing and editing following the initial drafting of the manuscript.
Supplementary material
Supplemental material for this article is available online.
References
Supplementary Material
Please find the following supplemental material available below.
For Open Access articles published under a Creative Commons License, all supplemental material carries the same license as the article it is associated with.
For non-Open Access articles published, all supplemental material carries a non-exclusive license, and permission requests for re-use of supplemental material or any part of supplemental material shall be sent directly to the copyright owner as specified in the copyright notice associated with the article.