
Abstract
Aneurysmal subarachnoid hemorrhage (SAH) leads to significant long-term cognitive deficits, which can be associated with alterations in resting state functional connectivity (RSFC). However, modalities such as fMRI—which is commonly used to assess RSFC in humans—have practical limitations in small animals. Therefore, we used non-invasive optical intrinsic signal imaging to determine the effect of SAH on RSFC in mice up to three months after prechiasmatic blood injection. We assessed Morris water maze (MWM), open field test (OFT), Y-maze, and rotarod performance from approximately two weeks to three months after SAH. Compared to sham, we found that SAH reduced motor, retrosplenial, and visual seed-based connectivity indices. These deficits persisted in retrosplenial and visual cortex seeds at three months. Seed-to-seed analysis confirmed early attenuation of correlation coefficients in SAH mice, which persisted in predominantly posterior network connections at later time points. Seed-independent global and interhemispheric indices of connectivity revealed decreased correlations following SAH for at least one month. SAH led to MWM hidden platform and OFT deficits at two weeks, and Y-maze deficits for at least three months, without altering rotarod performance. In conclusion, experimental SAH leads to early and persistent alterations both in hemodynamically derived measures of RSFC and in cognitive performance.
Keywords
Introduction
Subarachnoid hemorrhage (SAH) from a ruptured brain aneurysm is a severe form of stroke which leads to significant mortality and long-term functional deficits.1,2 Many survivors of SAH suffer from persistent cognitive problems 3 with the majority not being able to return to work or resume their previous activities. 4 Recent studies using functional neuroimaging have found an association between these persistent cognitive deficits and alterations in neuronal networks after SAH using fMRI or magnetoencephalography.5–7 In one study, altered measures of resting state functional connectivity (RSFC) were associated with worse performance on the Montreal Cognitive Assessment, a test of mild cognitive impairment. 7 Another study found that altered RSFC was associated with decreased executive dysfunction and worse quality of life as measured by a battery of standard cognitive tests. 6 However, a causal relationship between altered functional connectivity and cognitive deficits is not yet established, in part because of a lack of experimental models.
Therefore, we sought to determine if SAH causes changes in functional connectivity and associated cognitive deficits longitudinally in a mouse model of SAH. Because there are significant practical challenges in performing fMRI in mice—such as low resolution, magnet availability, and maintenance of anesthesia while in the scanner—we examined RSFC using non-invasive optical intrinsic signal imaging which detects changes in blood volume analogous to the fMRI BOLD signal.
Materials and methods
Animals
The study was carried out adhering to ARRIVE guidelines, including blinding. 8 All experiments were performed according to the Guide for Care and Use of Laboratory Animals (NIH Publication No. 85-23,1996) and protocols approved by the Institutional Animal Care and Use Committee (MGH Subcommittee on Research Animal Care). Male C57BL/6J mice (Charles River Laboratories, Wilmington, MA, USA) between 10–20 weeks of age were used for all experiments. Two animals died during imaging sessions as a result of anesthetic overdose, one each at intermediate and late time points). One animal was excluded from the study due to barbering behavior.
SAH model choice
For induction of SAH, we used the anterior prechiasmatic injection approach.9,10 There are several mouse models of subarachnoid hemorrhage11,12; however, a perfect SAH model does not exist and there is not yet a consensus about which model to use for each experimental condition. 13 We based our study on the anterior prechiasmatic injection model because it recapitulates early brain injury, leads to early elevations in ICP, and results in a significant clot burden at the base of the skull. 9 Another approach we considered was the endovascular perforation model wherein a filament is advanced into the middle cerebral artery until the vessel is perforated. 14 While the endovascular puncture model remains an essential approach in the field, we aimed to avoid the acute focal cerebral infarcts that can occur with this method. Injection of arterial blood through the cisternal magna is another accepted model; however, it does not fully reproduce the persistent elevated ICP that is seen with aneurysm rupture. Similarly, transection of a subarachnoid vein overlying the cisterna magna is another approach which further isolates effects of blood itself in the pathogenesis of SAH, but again does not lead to the acute ICP elevations desirable for an early brain injury model. 15 Finally, the spontaneous aneurysm rupture approach could be seen as a clinically analogous mouse model, but variability and the unpredictability of when a rupture occurs precluded its use in the current study.
SAH induction and imaging window placement
Mice were anesthetized with isoflurane (5% induction, 1–1.5% maintenance) in a mixture of 70:30 N2O:O2 and allowed to breathe spontaneously. After fixing the head in a stereotaxic frame, the scalp was incised to expose the dorsal skull surface. At this stage, an RFID glass capsule (sparkfun.com, SEN-09416) was inserted into the dorsal cervical area through the scalp incision. A 0.7 mm burr hole was drilled 5 mm anterior to bregma and slightly off of the midline to avoid the sagittal sinus. Non-heparinized blood was freshly collected from the femoral artery of a littermate donor. A 27 G Whiteacre spinal needle (BD ref # 405079) connected to a 1 cc syringe was positioned with the side port facing up and angled 35° from the vertical axis. The needle was advanced carefully until the base of the skull was contacted (approximately 7 mm in most animals), and then the needle was retracted 0.5–1.0 mm. Blood was injected (80 µl) over 10 s using a digital infusion pump. The needle was kept in place for an additional 2 min and then removed. For sham animals, the procedure was identical—including insertion of the needle and the duration of each step—except that there was no blood injection; saline injection was not done to avoid intracranial pressure increase, an important mechanism of injury in SAH.
Following SAH or sham procedure, a chronic glass coverslip was placed as previously described. 16 In brief, the surface of the skull was cleared of any residual blood products or debris. A glass coverslip (12 mm diameter, Electron Microscopy Sciences, www.emsdiasum.com, Cat #72196-12) was cut with a diamond pen to approximate the shape of the dorsal skull surface. C&B Metabond cement was mixed using one scoop of Clear L-Powder, six drops of Quick Base, and one drop of catalyst (Product numbers S399, S398, and S371, Parkell, Edgewood, NY, USA) in a ceramic mixing dish pre-chilled on ice. The cement was used to adhere the glass coverslip to the exposed skull. Additional cement was applied to fill any remaining gaps between the skull and coverslip. The cement was cured for an additional 15 min and the animal allowed to recover.
Imaging
Following SAH induction or sham surgery, RSFC was performed at early (post-operative day 4 with the exception of 1 mouse imaged on day 5), intermediate (39.5 ± 0.5 days), or late (99 ± 4 days) time points (mean ± SD). Mice were selected for imaging at random with no external markings on the cage or animal to identify whether the animal was a sham or SAH animal. Any subarachnoid blood that reached the dorsal surface of the brain during injection cleared by post-procedure day 4 (Figure 1(a)). For each imaging session, mice were anesthetized with 2,2,2-tribromoethanol (TBE), also known as Avertin, which provides excellent RSFC signals. 17 Injectable TBE was prepared by mixing 0.5 mL stock solution (10 g 2,2,2-tribromoethanol in 6.25 mL tert-amyl alcohol; Sigma-Aldrich, T48402-25G, and Fisher Scientific, A730-1, respectively) with 39.5 mL 0.9% normal saline, stored at 4°C for no longer than one month, protecting from light at all stages. To ensure a smooth induction, TBE was injected in two to three divided doses intraperitoneally (0.3–0.4 mL initial dose, 0.1 mL at approximately 8 min, and 0.1 mL at approximately 12 min). More TBE was injected if the mouse did not achieve an adequate level of anesthesia to suppress withdrawal to toe pinch. The animal was placed on a homeothermic heating pad (37.0 ± 0.1°C) and head-fixed in a stereotaxic frame. The glass coverslip was cleaned with cotton-tipped applicators and diluted ethanol solution. Image acquisition typically began at 18–20 min after the initial dose of TBE. With the exception of four animals, all imaging windows remained intact for the full three-month study.
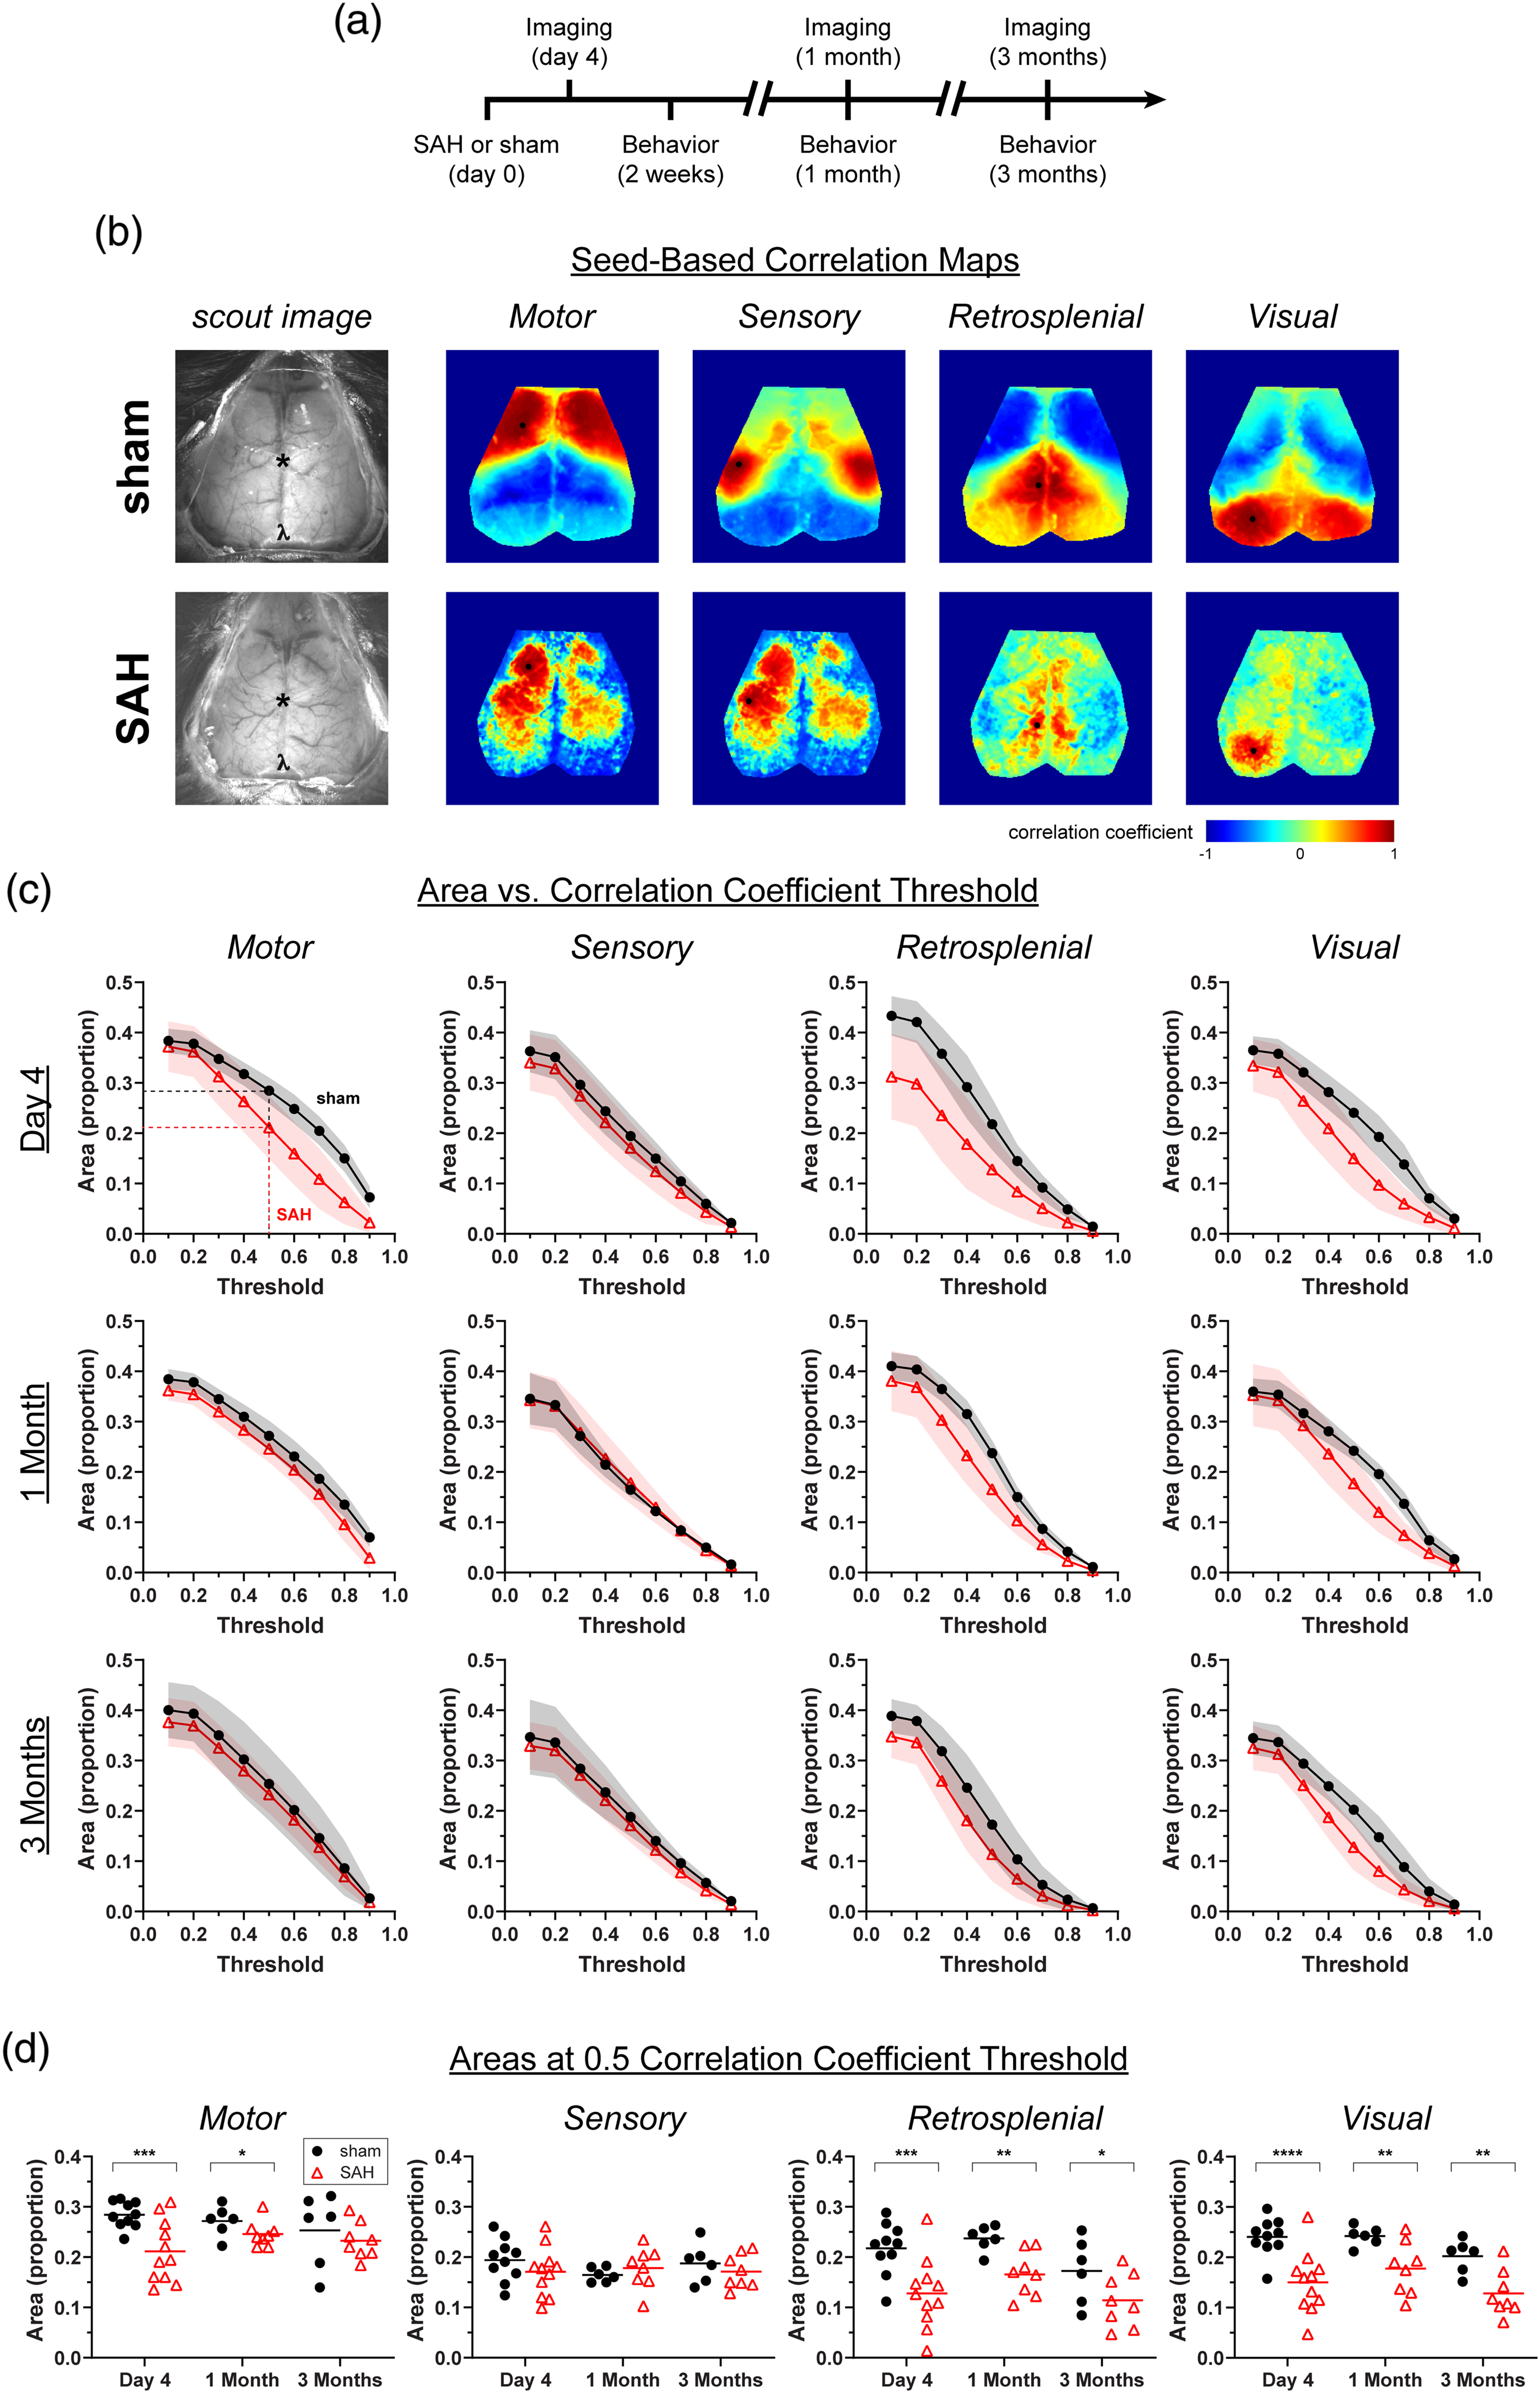
Subarachnoid hemorrhage (SAH) leads to early and late alterations in seed-based functional connectivity. (a) Experimental timeline for SAH injection, imaging, and behavioral assessments. (b) Representative seed-based connectivity maps at day 4 showing correlation coefficients from seeds placed in motor, sensory, retrosplenial, and visual cortex. Only left-sided seeds (black circles) are shown. (c) The areas above a positive seed-based correlation coefficient versus threshold are plotted at day 4, one month, and three months. Areas in proportions, normalized to total imaged brain area. Errors in SD. (d) The proportion of total area over a correlation coefficient of 0.5. Lines indicate the mean. Each data point represents a value from a single animal. *p <0.05, **p < 0.01, ***p < 0.001, ****p < 0.0001 for effects between sham and SAH.
The acquisition and processing of single wavelength functional optical intrinsic signal imaging have been described previously.17–19 The imaging surface was illuminated with a quartz tungsten halogen lamp (Techniquip R150, Capra Optical, Natick, MA) filtered at 570 ± 10 nm and directed with a fiber optic cable. μManager software was used for image acquisition. 20 Images were acquired with a Cascade 512 F camera (Photometrics) at 512 × 512 pixel resolution, 11.1 FPS, and an exposure time of 50 ms for 12 min. A custom script was written in MATLAB (Math Works, Natick, MA, USA) for image processing. The image was down-sampled to 256 × 256 pixels. Based on measurements from the Paxinos and Franklin mouse atlas, 21 the final scale is 47 μm/pixel. The optical density of each pixel over time was calculated and the density maps filtered between 0.008 Hz and 0.09 Hz. The signal was downsampled to 1 FPS. A brain mask was selected. The global signal was determined by taking the mean optical density for each frame. This global signal was then regressed from the optical density maps frame-by-frame over time.
Imaging data were analyzed in a blinded manner. Seed-based connectivity maps were created by mapping the correlation coefficients between seeds placed in motor, somatosensory, retrosplenial, and visual cortex and the rest of the brain. The seed locations were primarily chosen for their anatomical distribution rather than a presumed functional role. Seed coordinates were guided by the Paxinos and Franklin mouse atlas 21 and an atlas overlay adapted by White et al. 18 Seed-to-seed connection matrices, global connectivity maps, and interhemispheric homotopic connectivity maps and indices were calculated as described previously. 17 The connection matrix data were also organized as topological circle plots.
Behavior
Behavioral assessments were performed at early (one to two weeks), intermediate (approximately one month), and late (approximately three months) time points (Figure 1(a)). The one-month time point was added after the study was started and, therefore, was not assessed in six mice. Early Y-maze and rotarod were performed at 10 ± 1 days, intermediate at 32 ± 4 days, and late at 92 ± 6 days. The first (early) MWM assessment was at 12 ± 3 days, the first reversal assessment (intermediate) was at 32 ± 4 days, and the final (late) assessment was at 93 ± 6 days. The early open field test (OFT) was performed at 13 ± 3 days, intermediate at 35 ± 3 days, and late at 95 ± 5 days (mean ± SD).
AnyMaze software (ver. 8.42, Stoelting, Wood Dale, IL, USA) was used for tracking and analysis. For the OFT, mice were placed in a 28 × 18 cm open field. Distance traveled and speed were recorded for 30 min. For the Y-maze, we used a Y-shaped apparatus consisting of three 33-cm arms with 15-cm-high walls, and a 7.6 × 7.6 × 7.6-cm triangular intersection. Each arm was identified with a symbol (square, circle, star). Mice were allowed access to the three arms for a total of 5 min, and their movements were recorded by AnyMaze. The number of times the mouse entered all three arms without re-entering the previous arm (i.e. triplets of ABC, ACB, BCA, etc. vs. ABA, CBC, etc.) and the total number of arm entries were recorded. From this, a percent alternation was calculated. The apparatus was cleaned with 70% ethanol between trials. For the MWM, hidden platform testing was performed in seven trials over three days (trials 1–2 on day 1, trials 3–5 on day 2, and trials 6–7 on day 3). A 30-s probe test was performed 24 h after the final hidden platform trial. Finally, a visible platform test was performed in two trials on the final day of testing. For the rotarod, five trials were performed each day for three days. Mice were placed on a rod at a starting rotation of 4 r/min which was constantly accelerated to 40 r/min over the course of 120 s. The latency of falling off of the rod and the rod RPMs were recorded.
Statistics
Two-way repeated measures ANOVA and paired t-tests were performed with Prism 8 (GraphPad Software, Inc., CA, USA). SAS (Version 9.4, SAS Institute, Cary, NC) was used to create multivariable general linear mixed effects models. One set of models were used to determine the area (as a proportion of the imaged brain) above certain correlation coefficient thresholds (from 0.1 to 0.9) as a dependent variable of (a) condition (sham vs. SAH), (b) correlation coefficient threshold, (c) time point, and (d) region (motor, sensory, retrosplenial, or visual cortex). Hemisphere (right versus left) was assessed but did not have an effect so was removed from the final model. We also built a model to assess predictors for Y-maze percent alternation as a dependent variable of (a) condition and (b) time point. We used a p-value of 0.05 as the threshold for statistical significance. Anderson–Darling, D'Agostino-Pearson omnibus normality, Shapiro–Wilk normality, and Kolmogorov–Smirnov normality tests were carried out to conform with journal guidelines, when applicable. All errors in figures are in SD.
Results
In sham-operated mice, seed-based connectivity (i.e. correlation coefficient) maps were consistently normal when imaged longitudinally in the same animal over three months (Figure 1). In contrast, the SAH group showed early and persistent alterations in seed-based functional connectivity, both qualitatively and quantitatively. We found an early decrease (day 4) in motor, retrosplenial and visual cortex seed-based connectivity after SAH compared with sham, whereas sensory cortex was largely unaffected (Figure 1(c) and (d)). This decrease persisted for at least three months in the retrosplenial and visual seed-based maps but resolved in the motor map between one and three months. Of note, 7 of 11 mice in the SAH group showed an altered spatial pattern of connectivity and diminished correlation coefficients in the acute phase. The remaining four mice showed seed-based maps that were indistinguishable from sham controls (Supplemental Figure 1), suggesting a dichotomy possibly reflecting SAH severity.
As a seed-independent approach to measure functional connectivity, we determined global and interhemispheric measures of RSFC (Figure 2). There was an overall decrease in the connectivity of each pixel to every other pixel in the global connectivity map following SAH. There was also a decrease in the correlation coefficient between each pixel and its mirror pixel in contralateral hemisphere, apparent on the interhemispheric homotopic connectivity map (Figure 2(a)). We quantified differences between sham and SAH at different timepoints by calculating the proportional area of the imaged brain surface above correlation coefficient thresholds from 0.1 to 0.9 (Figure 2(b)). A decrement in global connectivity and interhemispheric connectivity following SAH is apparent at day 4 and one month but has largely resolved by three months. We also quantified global and interhemispheric connectivity observations with a global connectivity index (GCI) and an interhemispheric connectivity index (ICI) and found decreased GCI and ICI after SAH at early (day 4) and intermediate (one month) time points (Figure 2(c)). We also noticed an interesting feature within the sham groups for GCI and IHI, whereby there were differences between early and late time points (p = 0.014 and p = 0.015 for GCI and IHI with Tukey's correction for multiple comparisons). This time course relationship was not present within the SAH group. The findings are consistent with baseline decrement of GCI and IHI under control conditions. Therefore, steady GCI and IHI over time in the SAH group might be interpreted as a relative, gradual recovery to higher connectivity values.
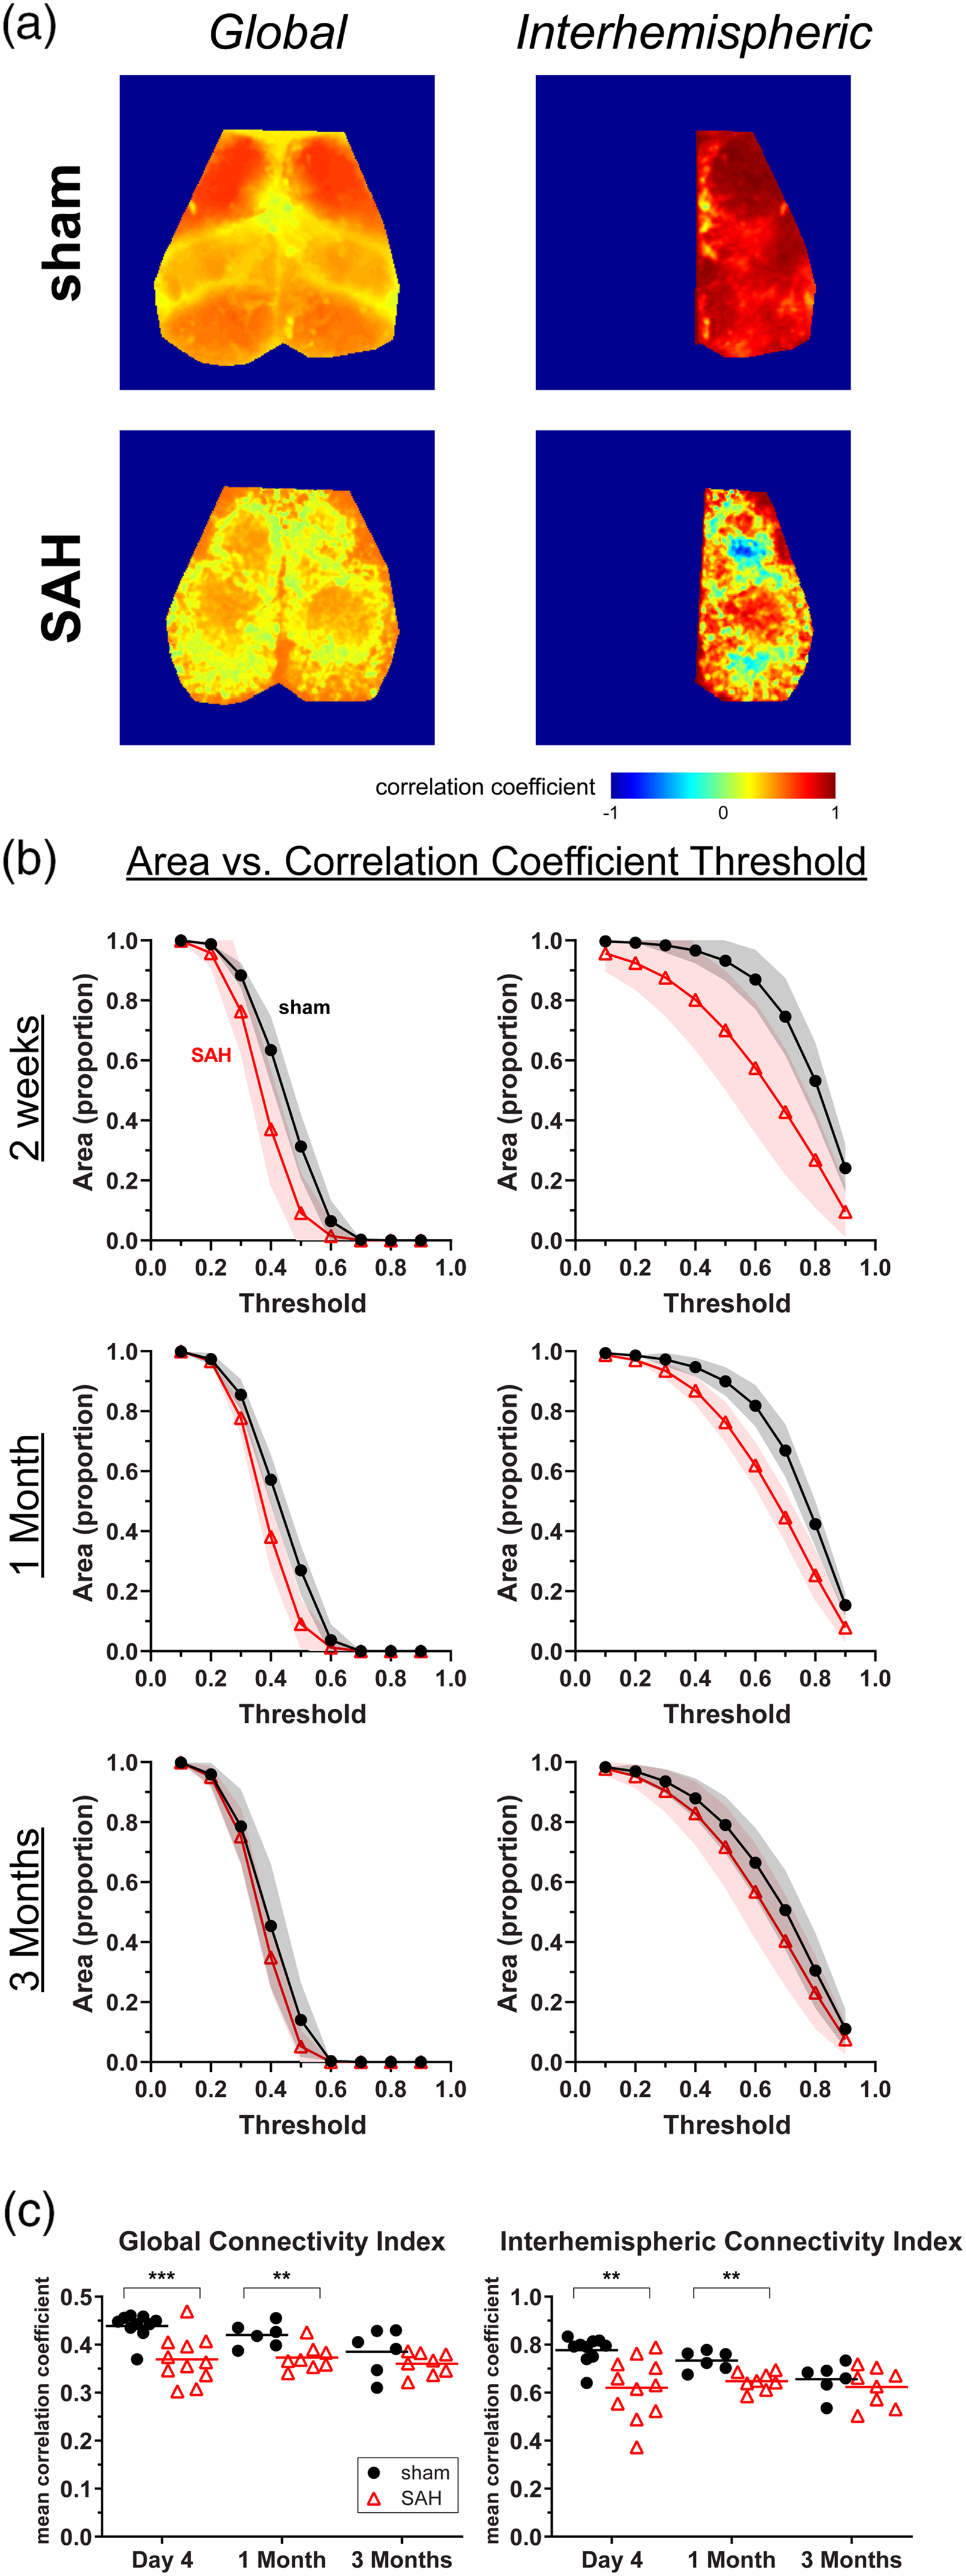
Subarachnoid hemorrhage (SAH) leads to early and intermediate changes in global and interhemispheric measures of functional connectivity. (a) Representative maps for global and interhemispheric functional connectivity in sham and SAH mice at day 4. (b) Areas are plotted as the proportion of pixels on the dorsal brain surface above a particular threshold value for global and interhemispheric maps. (c) The Global Connectivity Index and the Interhemispheric Connectivity Index at multiple time points. Errors in SD. Lines indicate the mean. Each data point represents a value from a single animal. **p < 0.01 and ***p < 0.001 for effects between sham and SAH.
We next examined the network relationship among all the seeds by creating seed-to-seed connection matrices and topological circle plots (Figure 3). As expected, we found strong interhemispheric (i.e. right vs. left) positive correlations between homotopic seeds in all four regions in sham-operated mice (Figure 3(a)). Weaker interhemispheric and intrahemispheric positive correlations were present between the anterior seed pairs (i.e. motor and sensory) and between the posterior seed pairs (i.e. retrosplenial and visual). Anterior seeds always appeared negatively correlated with the posterior seeds. SAH led to an early reduction in the strength of correlations, most conspicuously between the posterior seed pairs, which persisted for at least three months (Figure 3(b) and (c)).
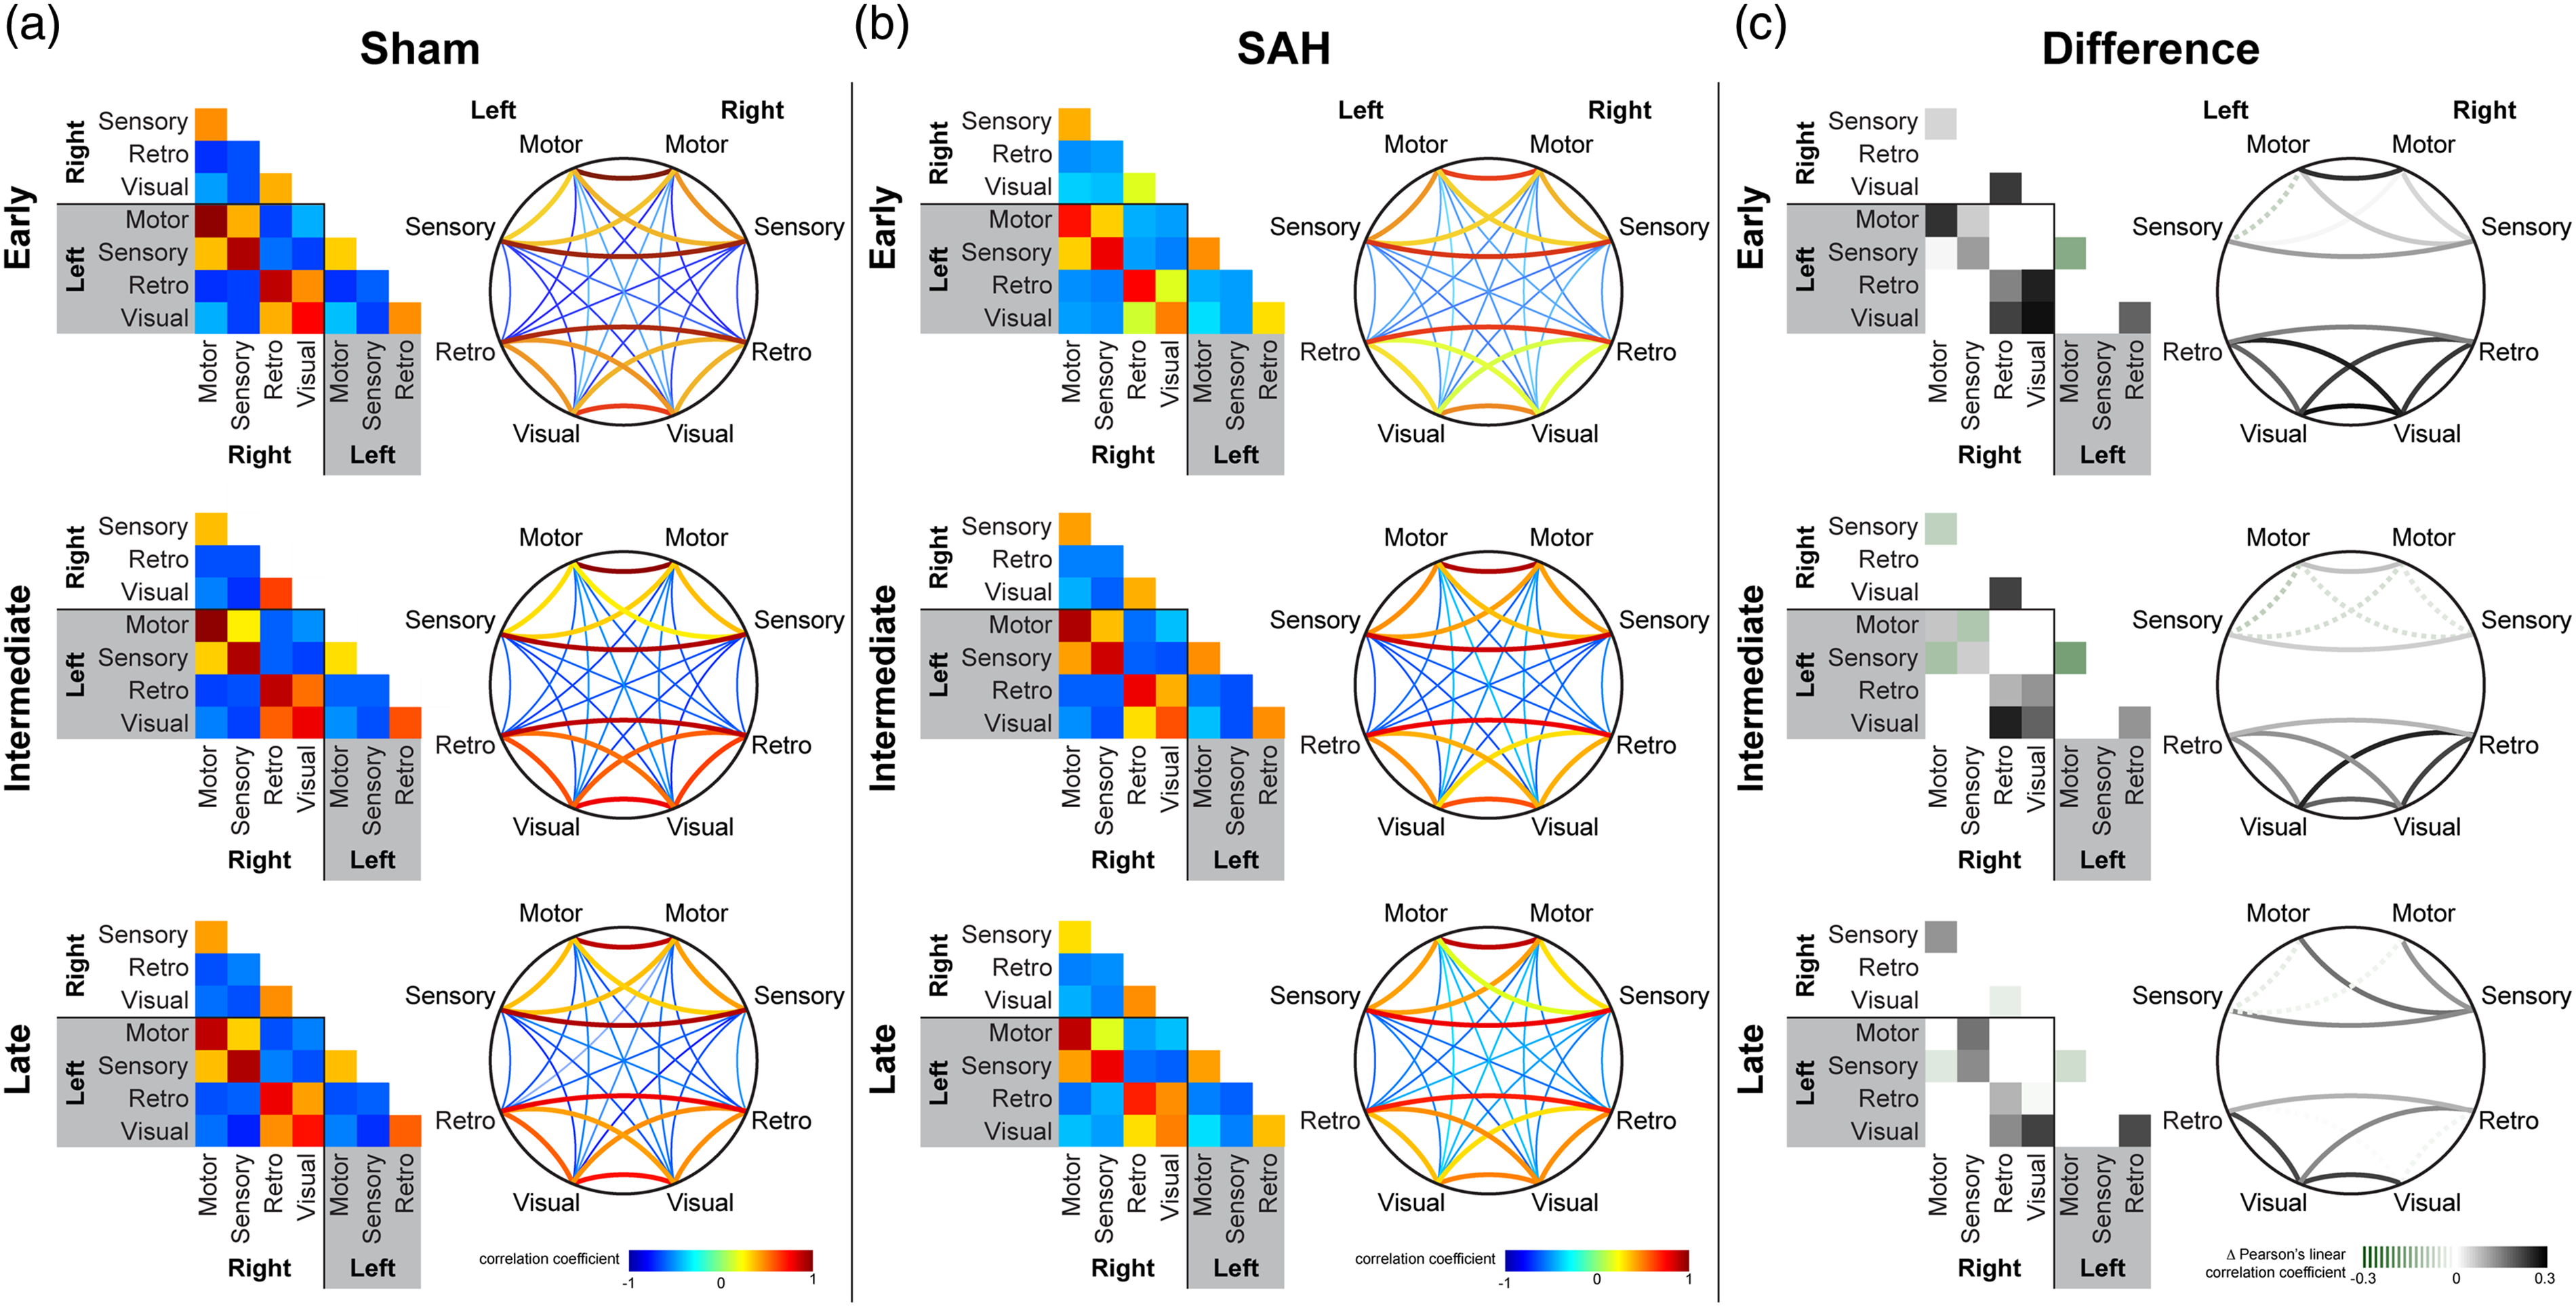
Subarachnoid hemorrhage (SAH) leads to persistent reduction in predominantly posterior functional connections. Averaged connection matrices demonstrate individual seed-to-seed correlation coefficients between motor, sensory, retrosplenial, and visual cortex in sham and SAH mice. The same data are organized as a square matrix and as a topological circle diagram for (a) sham, (b) SAH, and (c) the difference between the two at early, intermediate, and late timepoints. The difference in the connection matrix is calculated by subtracting the averaged correlation coefficient of SAH for a particular positively correlated seed pair from that of sham. Dotted lines in (c) represent cases where SAH has a greater correlation coefficient than sham, whereas solid lines in (c) represent differences where SAH has a smaller correlation coefficient than sham. Number of animals for each condition is the same as for Figure 1.
Finally, we examined the effect of SAH on the global regressed components of the optical signal fluctuations from which correlation coefficients are derived, akin to the fMRI BOLD signal (Figure 4 and Supplemental Movie). SAH attenuated the power of the post-globally regressed signal fluctuations at day 4 and to a lesser extent one month. In contrast, the global signal itself was unchanged at all-time points.
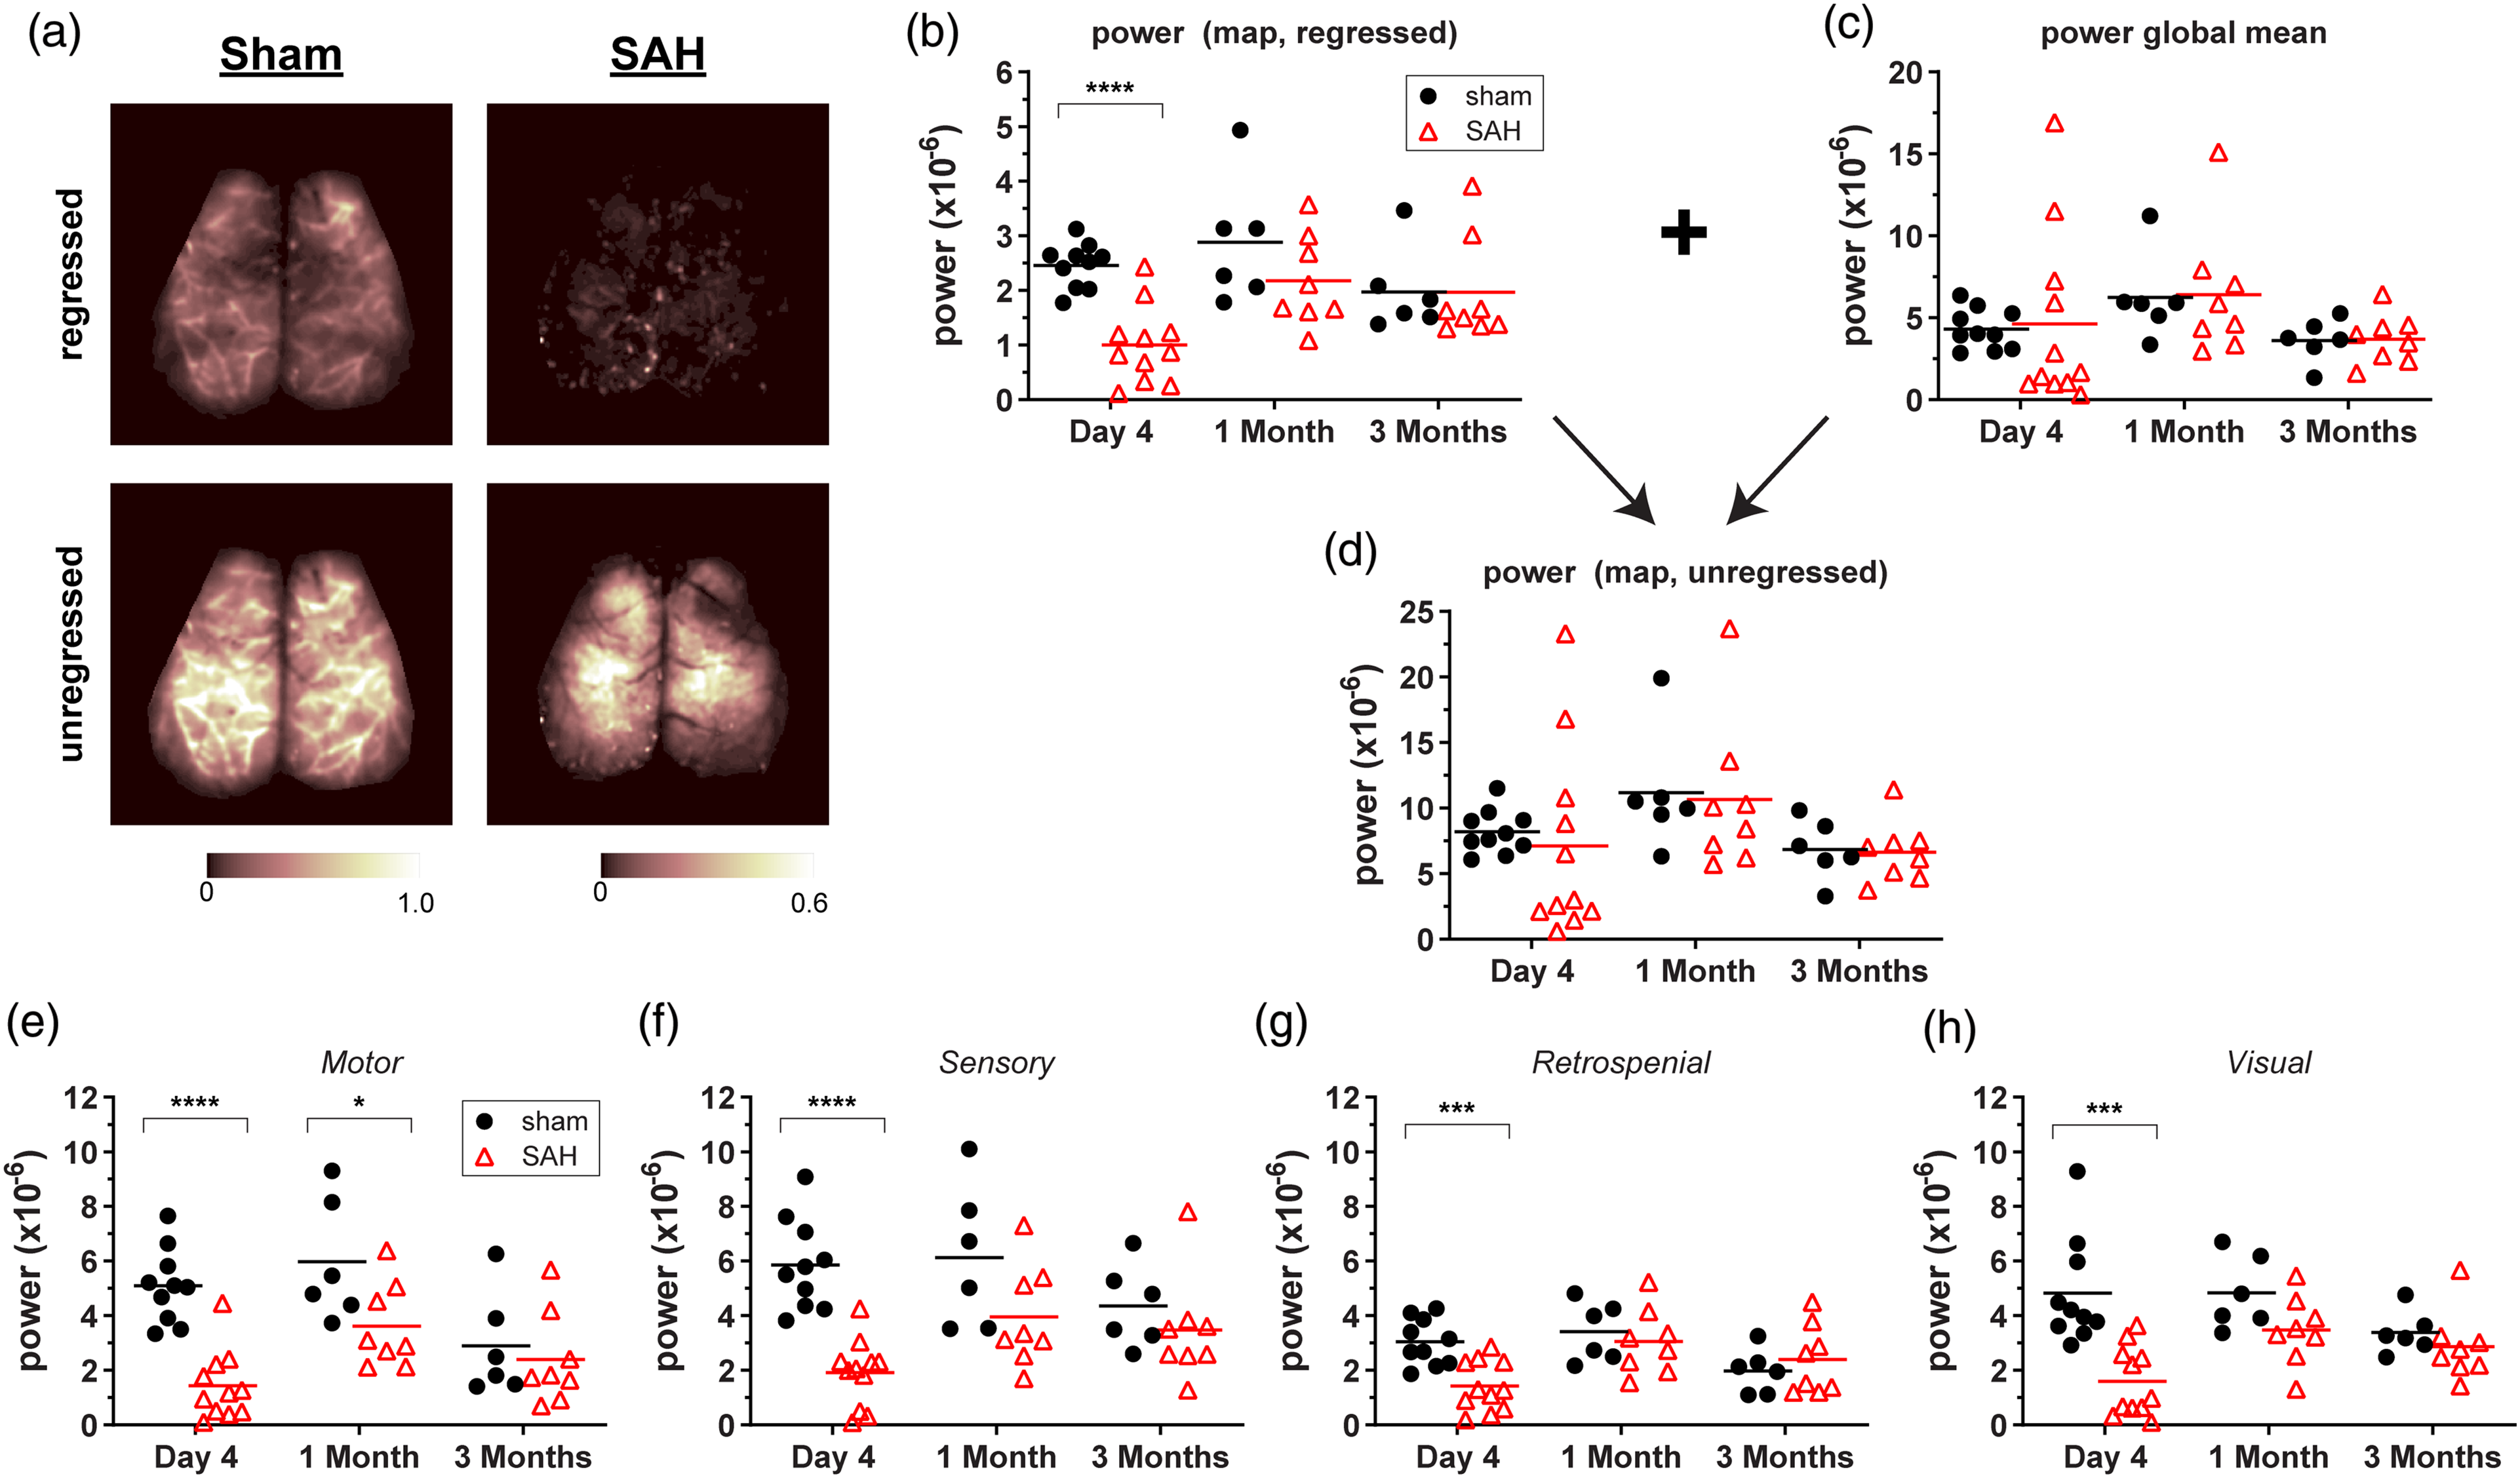
Subarachnoid hemorrhage (SAH) attenuates the amplitude of global signal regressed hemodynamic fluctuations at predominantly early time points. (a) Representative images from global signal regressed and unregressed power maps in sham and SAH mice at day 4. The power within 0.008–0.09 Hz of each pixel in the map was calculated from optical density fluctuations over the length of an imaging session. (b) Global signal regressed mean map powers for all mice assessed at day 4, one month, and three month time points. (c) The power of the global signal from each frame averaged over all frames with each imaging time point. (d) Unregressed mean map powers for all mice assessed at day 4, one month, and three month time points. (e–h) Regressed mean powers from seeds taken in (e) motor, (f) sensory, (g) retrosplenial, and (h) visual cortex. Lines indicate the mean. Each data point represents a value from a single animal. *p < 0.05, ***p < 0.001, ****p < 0.0001 for effects between sham and SAH.
To facilitate translation of RSFC measures to potentially clinically relevant outcomes, we performed neurocognitive assessments at early (approximately two weeks), intermediate (one month), and late (three months) time points in the imaged cohorts. SAH led to deficits on the MWM hidden platform test at the early time point (Figure 5(a)). We could not fully assess MWM reversal at one month due to a disproportionate number of mice with SAH that could not swim at that time point (Supplemental Figure 2). There was one mouse that could swim at the early time point that could no longer swim by one month. We also found that at three months, SAH mice appeared to fatigue on the hidden platform test as trials progressed (Supplemental Figure 2). The open field test (OFT) revealed decreased distance traveled and decreased speed for SAH animals at early but not later time points (Figure 5(c)). However, this was not due to reduced general motor function since the Rotarod test did not reveal differences between sham and SAH mice at early (Figure 5(b)) and late time points (Supplemental Figure 2). The Y-maze demonstrated decreased percent alternation for SAH mice at later time points. At the early time point, many of the tested mice did not meet the minimum number of entries needed (greater than 9) to adequately calculate percent alternation, rendering it uninterpretable (Figure 5(d)); the latter was consistent with reduced distance travelled in the open field test. We, therefore, used a mixed effects model for repeated measures at one and three months when the majority of animals could complete the test and found worse outcomes on the Y-maze after SAH compared with sham (p = 0.028, Figure 5(d)).
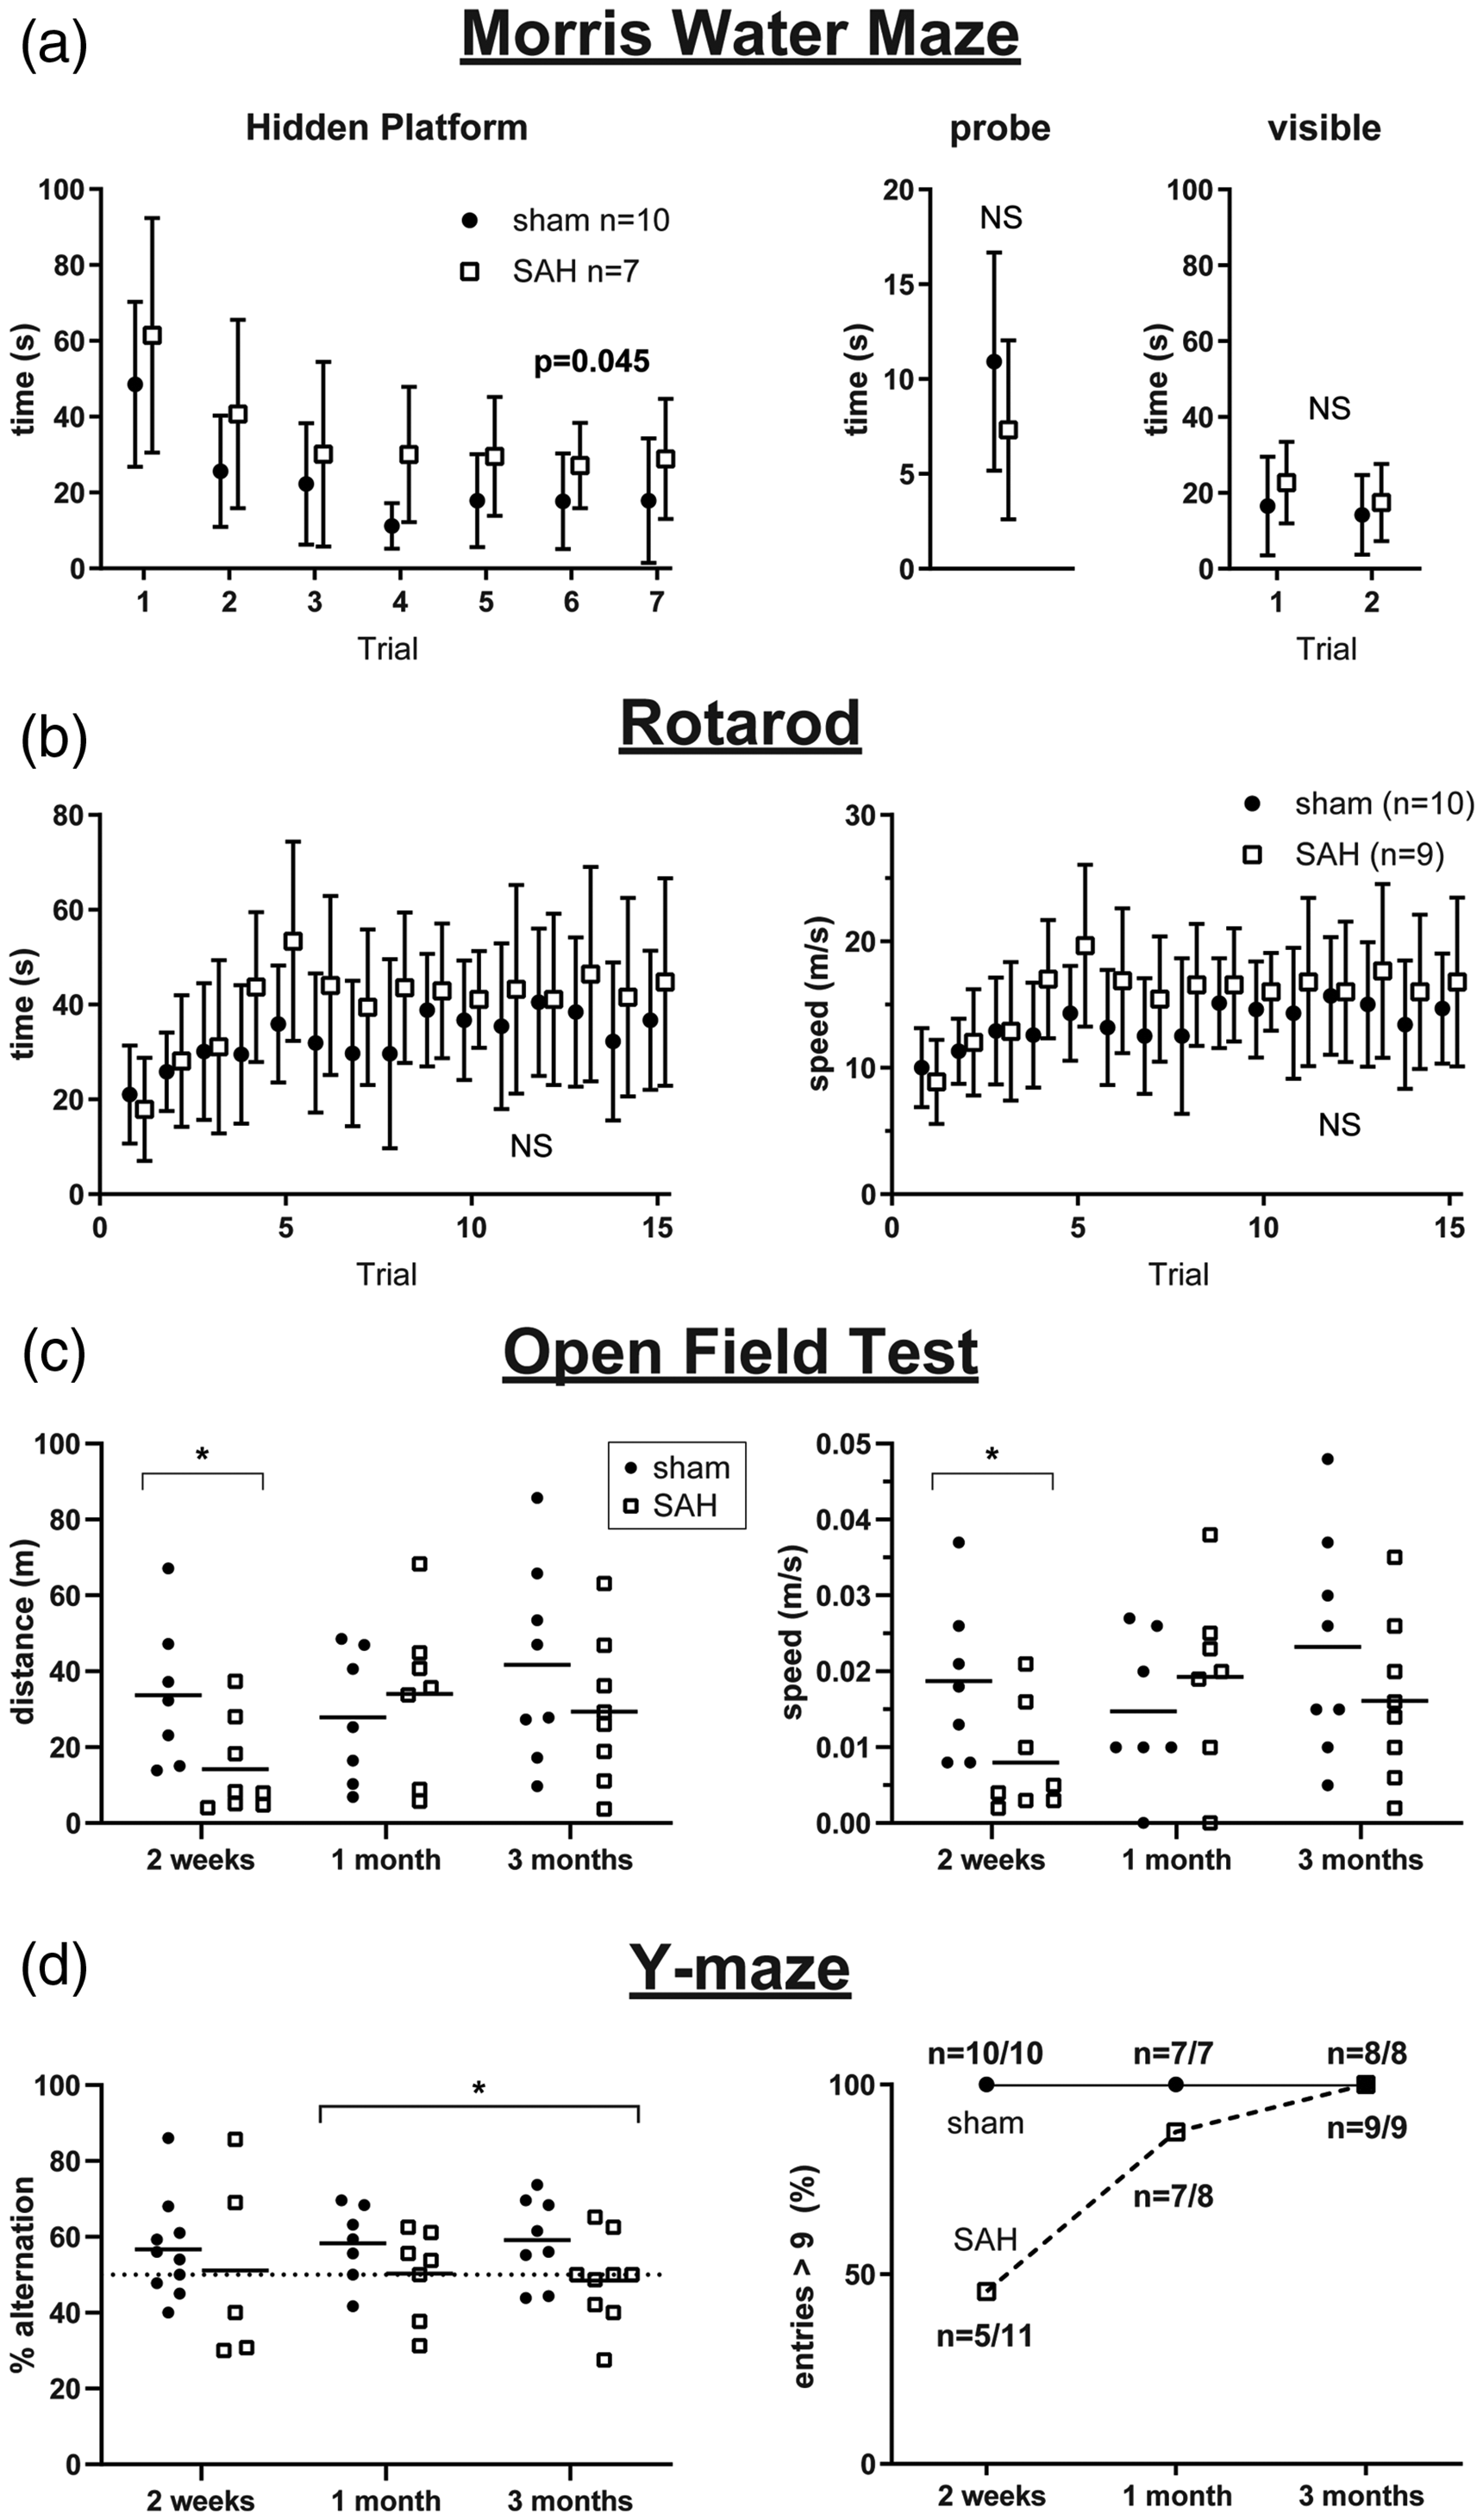
Subarachnoid hemorrhage (SAH) leads to deficits in the Morris water maze (MWM), open field test (OFT), and Y-maze. (a) MWM hidden platform, probe, and visible platform performance in sham and SAH mice at approximately two weeks. See Supplemental Figure 2 for reversal data at one and three months. Errors in SD. (b) Rotarod testing at two weeks. See Supplemental Figure 2 for similar results at one and three months. Errors in SD. (c) OFT distance traveled and speed at two weeks, one month, and three month time points in sham and SAH mice. Lines indicate the mean. Each data point represents a value from a single animal. (d) Y-maze percent alternation (left, each data point represents a value from a single animal) and percent of entries greater than 9 at two weeks, one month, and three months in sham and SAH mice (right). *p < 0.05
Discussion
Our data show that SAH leads to early and persistent changes in optical hemodynamic measures of resting state functional connectivity (RSFC). These changes correspond to deficits on the MWM and Y-maze. At earlier time points, there is a more general effect on imaging and behavioral findings. There also appears to be a stratification in SAH injury severity that is apparent on qualitative assessment of seed-based correlation coefficient maps. At later time points, there is persistent attenuation of RSFC measures which predominantly involves posterior network nodes. Taken together, we demonstrate that SAH causes detectable changes in blood volume-derived measures of RSFC in a well-defined mouse model of the disease.
This study employed recent advances in the optical assessment of RSFC. While fMRI is commonly used in human studies, it remains quite challenging to implement in mice.22,23 Therefore, White et al. 18 developed a practical, minimally invasive, optical measure of RSFC using visible light in mice which has allowed for the resolution, consistency, and throughput necessary to perform studies that assess the impact of conditions such as ischemic stroke and Alzheimer's disease on measures of functional connectivity.24,25 When coupled with a chronic glass coverslip implanted over intact and unaltered skull, the technique can be a powerful way to assess RSFC longitudinally in the same animal over weeks to months. 16 Another feature of the method is that it assesses blood volume fluctuations that are akin to the BOLD signal utilized in fMRI studies.23,26 Therefore, observations using the optical approach may be comparable to fMRI studies.
The specific behavioral findings that we report are novel, but other early and late behavioral deficits have been described previously by others. We find deficits in the MWM at two weeks, and it is worth noting that our MWM assessments at one month and three months are reversal tests (i.e. all mice are influenced by the earlier two week MWM testing). Others have described deficits in the MWM following SAH in mice using different experimental timelines. Using the same injection approach that we used, one group performed the MWM prior to SAH induction and found reversal of performance in SAH mice assessed for up to seven days.27,28 Interestingly, Provencio et al. 15 used a unique model of venous SAH which does not reproduce acute elevations in ICP and found that SAH leads to deficits on the first assessment of the MWM at one month. They also used the modified Barnes maze with results that might suggest early and delayed cognitive deficits.15,29 Therefore, although our RSFC imaging findings could be considered an early brain injury biomarker, our behavioral tests at approximately two weeks and beyond do not distinguish between early and delayed injury. We are not aware of other reports of Y-maze testing in the anterior prechiasmatic injection model of SAH. We found that it was useful to have the open field test (OFT) as an independent assessment of ambulation which strengthened our impression that early assessment of the Y-maze was confounded by decreased ambulation. As the ambulation and activity measures resolved, we were able to detect a signal for persistent SAH-associated deficits of percent alternation on the Y-maze. Interestingly, we found no deficits on the rotarod, whereas prior studies using an endovascular perforation model of SAH found early deficits.30–32 The difference from our findings could be due to earlier outcome assessment in the other studies (which were at day 3) or due to effects of early focal ischemic stroke that is associated with the endovascular perforation model. For our purposes, we view negative rotarod testing as a helpful control that strengthens the specificity of our findings for predominant deficits in spatial learning and working memory.
We did not assess for structural or anatomical changes to explain persistent long-term deficits in RSFC or behavior at three months. Prior work observed diffuse neuronal death up to seven days after SAH induction using the anterior prechiasmatic injection approach used for the current study.9,27,28,33 Additional studies using the endovascular perforation model have reported acute white matter injury—independent of ischemic stroke—using MRI,34–36 ultrastructural assessment with electron microscopy, 36 and assessment of molecular markers for white matter injury, including beta-APP. 34 Notably, investigators have described posterior dominant involvement of white matter tracts following an endovascular puncture model of SAH 37 which is consistent with our findings of persistent posterior-dominant deficits in RSFC (Figures 1 and 3). Future RSFC studies designed to look specifically at markers of neuronal damage and location of white matter tracts at both early and late time points in additional models of SAH would be informative.
Another question raised by our findings is if persistent changes in RSFC or behavior are due to changes in neuronal activity, problems with neurovascular coupling, or both. We assessed a hemodynamic measure of RSFC. We took this approach because it provides the most accessible means to study RSFC in mouse and is clinically analogous to the fMRI BOLD signal used in humans. However, prior animal studies suggest that there can be neuronal hyperexcitability 38 rather than a depression of activity. There is also a body of evidence suggesting that neurovascular coupling is diminished following acute brain injury, including SAH 39 ; however, the exact time course of neurovascular changes has not been fully defined. Regardless of underlying mechanisms, we have described what we hope to be, at a minimum, a useful biomarker for early brain injury after SAH. Future studies using genetically encoded neuronal calcium fluorescence reporters (i.e. GCaMP mice) or invasive electrophysiology40–43 might provide additional insight into what underlies changes in our observed hemodynamically derived measures of RSFC.
Our study has additional limitations. (1) We measured RSFC under anesthesia. We did this because the meaning and feasibility of optical measures of RSFC in awake animals have been questioned. 44 Therefore, we recently performed a systematic study to determine the optimal anesthetic for our purposes and found that TBE anesthesia provided the most robust results. 17 Regardless, our findings would be strengthened if future studies attempted awake assessments or assessments under other types of anesthesia. (2) We do not draw conclusions about why seeds with altered connectivity (in retrosplenial cortex, for example) are associated with the observed behavioral findings. (3) The optical approach is limited to imaging the surface, unlike fMRI which can assess connectivity to deeper structures. (4) We did not include an experimental arm consisting of saline injection. A saline injection group might provide additional knowledge about the pathomechanism of SAH-related RSFC and neurobehavioral changes and could lead to insights into the observed dichotomy in seed-based maps following SAH. Therefore, it would be valuable to evaluate a saline-injection group in the future. (5) We only used male mice in our study. Future studies should use both male and female mice. (6) Finally, we used only one of many animal models of SAH. We hope that measures of functional connectivity will be tested in additional mouse models and strains. Indeed, since there is no one perfect model of SAH, we believe that the only way to approach a useful understanding of the mechanisms and clinically relevant outcomes involved is to attempt similar investigations using multiple different models in different laboratories.
In conclusion, we find that SAH leads to early and persistent changes in resting state functional connectivity and deficits in spatial learning and working memory tasks. At a minimum, we have demonstrated how optical measures of hemodynamically-derived functional connectivity could serve as a non-invasive and longitudinal biomarker for severity in experimental SAH. We hope that our observations will serve to guide future work to determine mechanisms potentially linking SAH to altered functional connectivity and, ultimately, to better understand how functional connectivity might affect cognitive outcomes following SAH.
Supplemental Material
sj-pdf-1-jcb-10.1177_0271678X20940152 - Supplemental material for Subarachnoid hemorrhage leads to early and persistent functional connectivity and behavioral changes in mice
Supplemental material, sj-pdf-1-jcb-10.1177_0271678X20940152 for Subarachnoid hemorrhage leads to early and persistent functional connectivity and behavioral changes in mice by David Y Chung, Fumiaki Oka, Gina Jin, Andrea Harriott, Sreekanth Kura, Sanem A Aykan, Tao Qin, William J Edmiston III, Hang Lee, Mohammad A Yaseen, Sava Sakadžić, David A Boas, Michael J Whalen and Cenk Ayata in Journal of Cerebral Blood Flow & Metabolism
Footnotes
Declaration of conflicting interests
The author(s) declared no potential conflicts of interest with respect to the research, authorship, and/or publication of this article.
Funding
The author(s) disclosed receipt of the following financial support for the research, authorship, and/or publication of this article: This work was funded by the National Institutes of Health (R25NS065743, KL2TR002542, and K08NS112601 to D.Y.C., UL1 TR001102 to H.L., R00AG042026 and R01AA027097 to M.A.Y., R01NS091230 and R01MH111359 to S.S., and P01NS055104 and R01NS102969 to C.A.); the American Heart Association and American Stroke Association (18POST34030369 to D.Y.C.); Japanese Heart Foundation and Bayer Yakuhin Research Grant Abroad (F.O.); the Andrew David Heitman Foundation (D.Y.C. and C.A.); the Aneurysm and AVM Foundation (D.Y.C.); and the Brain Aneurysm Foundation’s Timothy P. Susco and Andrew David Heitman Foundation Chairs of Research (D.Y.C.).
Acknowledgements
We thank Jinglu Ai, Hoyee Wan, and the Macdonald Lab for helpful advice regarding the anterior prechiasmatic injection mouse model. Additional thanks to Brian Edlow, Leigh Hochberg, and Aman Patel for useful discussions about the connectivity data and to James Chung for comments on the manuscript.
Authors’ contributions
All authors (DYC, FO, GJ, AH, SK, SD, TQ, WJE, HL, MAY, SS, DAB, MJW, CA) made substantial contributions to conception and design, acquisition of data, or analysis and interpretation of data; drafting the article or revising it critically for important intellectual content; and gave final approval of the version to be published.
Supplemental material
Supplemental material for this article is available online.
References
Supplementary Material
Please find the following supplemental material available below.
For Open Access articles published under a Creative Commons License, all supplemental material carries the same license as the article it is associated with.
For non-Open Access articles published, all supplemental material carries a non-exclusive license, and permission requests for re-use of supplemental material or any part of supplemental material shall be sent directly to the copyright owner as specified in the copyright notice associated with the article.