
Abstract
Nearly three million people in the USA suffer traumatic brain injury (TBI) yearly; however, there are no pre- or post-TBI treatment options available. KCNQ2-5 voltage-gated K+ channels underlie the neuronal “M current”, which plays a dominant role in the regulation of neuronal excitability. Our strategy towards prevention of TBI-induced brain damage is predicated on the suggested hyper-excitability of neurons induced by TBIs, and the decrease in neuronal excitation upon pharmacological augmentation of M/KCNQ K+ currents. Seizures are very common after a TBI, making further seizures and development of epilepsy disease more likely. Our hypothesis is that TBI-induced hyperexcitability and ischemia/hypoxia lead to metabolic stress, cell death and a maladaptive inflammatory response that causes further downstream morbidity. Using the mouse controlled closed-cortical impact blunt TBI model, we found that systemic administration of the prototype M-channel “opener”, retigabine (RTG), 30 min after TBI, reduces the post-TBI cascade of events, including spontaneous seizures, enhanced susceptibility to chemo-convulsants, metabolic stress, inflammatory responses, blood–brain barrier breakdown, and cell death. This work suggests that acutely reducing neuronal excitability and energy demand via M-current enhancement may be a novel model of therapeutic intervention against post-TBI brain damage and dysfunction.
Introduction
Almost three million people in the USA suffer TBIs yearly and ∼50,000 of these do not survive.1,2 Besides acute mortality, TBIs are known to result in post-traumatic seizures (PTS) and the development of epilepsy with a latent period of up to 10 years.3–6 Approximately 6% of all epilepsies are caused by head trauma. 7 Compounding the problem, PTS accelerates the process of epileptogenesis 8 by exacerbating cellular metabolic crisis, further increasing brain damage.9–11 PTS likely adds upon the metabolic stress acutely induced by TBI due to vascular damage, hypoperfusion, and hypoxia. 12 Tissue that is already hypoxic/ischemic is especially susceptible to hyperactivity-mediated toxicity. The deleterious effects of TBI-induced ischemia/hypoxia and neuronal hyperexcitability are additive since most of the energy demand in the brain goes into Na+/K+ ATPase activity.13–16
Voltage-gated, M-type K+ currents are generated from combinations of KCNQ2-5 (Kv7.2-7.5) subunits. 17 KCNQ/Kv7/M channels are ubiquitously-expressed in the peripheral and central nervous systems, where they play dominant roles in the regulation of active and passive neuronal discharge properties, such as resting membrane potential, spike-frequency adaptation, and hyper-excitatory states.18–22 Conversely, M-current augmentation has been shown to be neuroprotective after oxygen and glucose deprivation in organotypic brain slices23,24 and have powerful protective effects after occlusive stroke, dampening inflammatory responses and blocking motor dysfunction. 25 This suggests that deleterious effects of TBI, including vascular damage, 12 might also be reduced by M-channel openers, such that their dampening of neuronal hyperactivity should have cerebro-protective effects after TBI, as for stroke 25 and epilepsy.26,27
TBI-induced tissue damage and cellular death lead to inflammatory/immunological responses in the brain and blood–brain barrier (BBB) breakdown, promoting secondary brain damage.28–32 Among the major components of the inflammatory response are microglial activation and macrophage infiltration, representing the first line of defense after tissue damage.17,18 Astrocytes also play important roles during metabolic stress in brain,33,34 further regulating activated microglia after trauma. 35 Here, we assayed the downstream deleterious events associated with TBI-mediated brain damage, including spontaneous seizures, seizure susceptibility, cell death, BBB breakdown, and the inflammatory response. For the latter, we measured biomarkers of microglial activation and macrophage infiltration (ionized Ca2+ binding adaptor molecule 1 (Iba1)),36,37 astrogliosis (glial fibrillary acidic protein (GFAP)), 38 and the inflammation-linked CD40 ligand (CD40L)39–42 all of which associated with increased mortality and severity of TBI. 43 Pro-inflammatory signals can lead to increased expression of cell-death related proteins, including receptor-interacting protein 1 (RIP1).44–46 We also assayed for commonly-seen neuronal necrosis. 44
Another possible response that could provide long-term protection against further brain damage is transcriptional post-TBI up-regulation of KCNQ2 and KCNQ3 gene expression. Indeed, several lines of inquiry have demonstrated activity-dependent changes in the expression of KCNQ2 and KCNQ3 gene products in neurons. 47 On the other hand, down-regulation of M-channel transcription by intense stimulation of sensory neurons has also been described, 48 which would be exacerbating. Therefore, effects of TBI-induced events and concomitant hyperexcitability on KCNQ2 and KCNQ3 transcription were investigated.
We hypothesize that dampening of neuronal excitability by pharmacologically augmenting M-type K+ currents, acutely after a TBI, might prevent the deleterious cascade of events that lead to widespread brain damage and dysfunction. The results presented here are in accord with this hypothesis.
Materials and methods
Animals
Adult 10-week-old C57BL/6 J mice (Jackson Labs) were group-housed in a 12:12-h light:dark cycle with food and water ad libitum. Male and female mice were used for all the experiments performed, except for GFAP, Iba1 and Fluro-Jade B histology experiments and for PSVue794 and Evans blues imaging. As the previous experiments displayed no gender-specific differences (Supplementary Table 1) the experiments cited above were performed only with male animals, avoiding estrus cycle-related variation. Animals were divided randomly among cohorts so that each cage would include animals from all treatments. Cohorts of animals included “Sham” animals that received all procedures except controlled closed cortical impact (CCCI), “TBI” animals subjected to CCCI and i.p. injection of vehicle only, and “TBI+RTG” animals that were subjected to CCCI followed by RTG administration 30 min after injury. The experimenters were blinded to group allocation during data collection and analysis. To study KCNQ2 expression “KCNQ2-mRNA EGFP-reporter mice” ((Kcnq2-EGFP)-FW221Gsat) (GENSAT), were used. All experiments were approved by the IACUC at UTHSA and followed the NIH Guide for Care and Use of Laboratory Animals. The experiments reported here follow the Animal Research: Reporting in Vivo Experiments guidelines.
Controlled closed cortical impact
The CCCI model was used to generate reproducible moderate brain injury. This model has the advantages of producing focal contusion in which the skull remains intact.49,50 CCCI most closely simulates blunt-head traumas resulting from falls or motor vehicle accidents and particularly in rodent models often produces spontaneous seizures within 24 h.51,52 We restricted our investigations to moderate CCCI (without skull fracture or obvious hematomas) that is thought to cause comorbidities possible to prevent.53–55 This model successfully reproduces the deleterious effects of TBI observed in the clinic, such as motor and cognitive deficits, brain edema, and mitochondrial dysfunction.49,53 The very large number of animals required to reach meaningful conclusions from even one CCCI compelled us to employ a single trauma per mouse, although we recognize that multiple traumas may exacerbate malevolent sequelae in important ways. 56 We also thought it most pragmatic to use a paradigm similar to our previous work,53,57 to readily compare results between studies.
CCCI was delivered by a pneumatic impact device (Leica Biosystems) following a protocol previously published.53,57 A cylindrical probe of 5 mm diameter was used to deliver a calibrated impact to the skull, 1 mm depth over the right parietal cortex and a small portion of the caudal end of the right frontal cortex, at a velocity of 4.5 m/s, to produce a moderate TBI. Sham mice underwent the same procedures of anesthesia and surgery but without any impact.
Retigabine or vehicle administration
Thirty minutes after CCCI, animals from the TBI+RTG group were injected i.p. with 1.2 mg/kg RTG (AdooQ Bioscience). Animals from the TBI group received i.p. injection of vehicle solution (0.5% (w/v) methylcellulose diluted in sterile 0.9% (w/v) saline). The dose used was the established maximally efficacious dose of RTG that is known to not be overly sedative to the point of reduction of requisite cerebral function (unaided respiration, swallowing, etc.).58,59
Electroencephalogram
To quantify seizure frequency and determine seizure susceptibility, mice of each cohort were implanted with electroencephalogram (EEG) electrodes 24 h after CCCI or sham. For EEG recording, a three-channel tethered EEG system was used following protocols used in our previous work.60,61 For detailed methods, see Supplementary Material. Computer-assisted cortical EEGs was recorded and reviewed for the presence of seizures and epileptiform spikes.62–64 Continuous video/EEG monitoring was performed for three consecutive days, starting 24 h after injury. Detected events were visually confirmed by blinded experimenters. All video/EEG recording data obtained are presented here as the percentage of animals that displayed seizures or epileptiform spike activity. No animals in the Sham group displayed any seizure or abnormal EEG activity.
To assay post-TBI seizure sensitivity, mice from TBI and TBI+RTG cohorts were injected i.p., on the 5th day after CCCI, with three subthreshold doses of pilocarpine (MP Biomedicals, 75 mg/kg per dose), separated by 30 min intervals. Pilocarpine is a cholinomimetic drug widely used as a chemo-convulsant in animal models to induce status epilepticus. 65 To minimize pilocarpine-induced peripheral cholinergic effects and mortality, animals were pretreated with scopolamine methyl nitrate (i.p. 1 mg/kg; MP Biomedicals), 30 min prior to pilocarpine injection. Both drugs were diluted in sterile 0.9% (w/v) saline. Immediately after pilocarpine injection, cortical activity was monitored for 24 h by video/EEG recording.
Lactate/Pyruvate quantification
Lactate and pyruvate were quantified in cortical samples collected 24 h after CCCI from an independent cohort of mice used only for this experiment (see Supplementary Material), using the Lactate Colorimetric (BioVision) and Pyruvate Assay Kits (Eton Bioscience) according to manufacturer’s protocols. For both, samples were tested in duplicates and average absorbances measured. Assay readings were executed in a Synergy HT plate reader (BioTek) at wavelengths of 450 (lactate) and 570 nm (pyruvate). Standard curves of 8 points from 0 to 200 µM were used to provide concentrations from linear regressions of the standard curves. Lactate/pyruvate ratios were obtained by dividing the lactate concentrations by the pyruvate concentrations independently for each sample.
Cell death and blood–brain barrier permeability
PSVue794, a near infra-red (NIR) fluorescent probe, was used to visualize the distribution of cell death throughout the brain. Through its bis(zinc2+-dipicolylamine) (Zn-DPA) targeting moiety, PSVue794 identifies apoptotic and necrotic cells by selectively binding to phosphatidylserines that are exposed to the outer surface of plasma membrane. 66 Briefly, 24 h after CCCI, mice were injected with PSVue794 (i.v. 3 mg/kg, Molecular Targeting) according to manufacturer’s protocol. The probe was allowed to circulate for 48 h. To simultaneously assess BBB permeability in a single animal, 72 h after CCCI, mice were further injected with Evans Blue dye (i.v. 2.5 mg/kg, Sigma-Aldrich). The dye was allowed to circulate for 2 h until transcardial perfusion to wash out intravascular probes. Evans blue has a high affinity to serum albumin and its fluorescence signal correlates with BBB disruption. 67 The IVIS Spectrum Imaging System (PerkinElmer) was used to detect both PSVue794 and Evans blue signals and ex vivo measurements were taken as described in Supplementary Material. Images obtained were analyzed using Living Image Software 4.5.5 (Caliper Life Sciences). Regions of interest (ROIs) were drawn around the peri-injured site of each sample and fluorescence values (Radiant efficiency = Emission Light (photons/sec/cm 2 /steradian)/Excitation Light (µW/cm 2 )) recorded.
Fluoro Jade B
Fluoro Jade B (FJB) staining was performed to confirm cell death histologically and detect the degree of neurodegeneration six days after CCCI. Staining was performed as previously described. 68 For details, see Supplementary Material. Ipsilateral cortical images were taken by a Nikon Swept field confocal microscope and cell counts obtained by nonbiased automatic quantification with ImageJ/FIJI (NIH, USA) particle analysis.
Immunohistochemistry
For visualization and quantification of KCNQ2 transcription, 24 h after TBI, reporter mice were used that are transgenic for a bacterial artificial chromosome (RP23-247P15) containing the kcnq2 locus with enhanced green fluorescent protein (EGFP) in the first exon ((Kcnq2-EGFP)-FW221Gsat, GENSAT). In such “KCNQ2-mRNA EGFP reporter animals”, the transcription of KCNQ2 mRNA is proportional to EGFP protein expression, serving as a probe for KCNQ2 transcription. In pilot experiments, we observed that intrinsic fluorescent emission from EGFP was too weak to be reliably imaged/quantified. This is likely to be an effect of tissue fixation, which can degrade EGFP fluorescence. 69 Hence, endogenous EGFP fluorescence was photobleached and EGFP protein immunostained for quantification, as before. 60 The number of EGFP-positive cells per image was counted. The maximum and mean fluorescent signals were independently quantified for each EGFP-positive cell, as described in detail in the Supplementary Material. All mice used in this experiment were subjected to CCCI and treated with RTG 30 min after injury.
GFAP and Iba1 expression was measured six days after CCCI as previously described. 70 Confocal images of each brain slice were taken by a Zeiss LSM710 confocal microscope under a 20× objective lens (Numerical Aperture = 0.8). GFAP and Iba1 corrected total cell fluorescence (CTCF) and the mean fluorescence intensities were quantified using ImageJ software. For details, see Supplementary Material.
Immunoblotting
For immunoblots, entire left and right hemispheres samples were collected six days post-CCCI and homogenized separately for quantification of immunoblots, as previously described. 71 Samples were homogenized using RIPA buffer (Thermo Fisher Scientific) and an Ultra EZgrind tissue homogenizer (Denville Scientific) at the lowest speed setting (5000 r/min). Immunoblot band intensities were normalized via the housekeeping proteins β-actin or glyceraldehyde 3-phosphate dehydrogenase (GAPDH). Primary antibodies used were: Iba1 (1:400, Wako 016-20001), CD40L (1:500, Abcam ab52750), RIP1 (1:1000, BD Biosciences 610459), GAPDH (1:25,000, Abcam ab125247), β-actin (1:20,000, Sigma A5316). We also performed a secondary independent normalization using Ponceau S (Sigma) staining and bands semi-quantified in the range of 37–100 kD. Results were standardized to ipsilateral averages from animals in the Sham cohort.
Quantitative real-time polymerase chain reaction
Quantitative real-time polymerase chain reaction (qRT-PCR) was performed to quantify the mRNA levels of KCNQ2 and KCNQ3, 24 h and six days after CCCI. Cortical samples were dissected as described in Supplementary Material. The qRT-PCR assays performed here were performed as previously described.47,71 Results were normalized to the average of Sham cohort contralateral side levels.
Statistical analysis
The details of the statistical analyses used are described in the Supplementary Material.
Results
In the results described below, we compared mouse cohorts consisting of (1) CCCI TBI followed by only vehicle administration (TBI), (2) CCCI TBI followed by retigabine (RTG) administration (TBI + RTG), and (3) Sham animals that received no trauma but went through the same anesthetic/surgical procedure (Sham). RTG or vehicle was administered i.p. 30 min post-TBI (Supplementary Figure 2).
RTG treatment blocks PTS and decreases susceptibility to epileptiform neuronal activity
We first tested if CCCI induces spontaneous PTS and increase seizure susceptibility, as seen in post-TBI human patients72–74 and if so, if that would be prevented by acute administration of RTG after insult (Figure 1(a)). Whereas five of fifteen animals of the TBI group displayed PTS, manifested by both tonic-clonic behavior and abnormal increase in EEG amplitude and/or frequency of cortical signals, no animal treated with RTG post-TBI displayed seizures (χ(1) = 4.16, p < 0.05). To assess for altered seizure susceptibility, we used the pilocarpine chemo-convulsant model.71,81,82 On the 5th day after injury, the same cohorts of mice were injected with a sub-threshold dose of pilocarpine and monitored for epileptiform neuronal spike activity,65–67 as previously observed after TBI.
83
In the RTG cohort of animals, there was a significant reduction of pilocarpine-induced abnormal spike activity (χ(1) = 3.96, p < 0.05) (Figure 1(b)). Since RTG has a half-life of only ∼2 h in mice,
84
any effect on the 5th day post-TBI is not from any acute anti-convulsive action.
M-current augmentation prevented TBI-induced seizures, abnormal cortical activity, and metabolic stress. (a) Top, bars summarize the percentage of animals that displayed spontaneous seizures in the TBI and TBI + RTG groups. The number of animals that displayed seizures in each group and the total number of animals per group are indicated above each bar (TBI n = 6♀ 9♂; TBI + RTG n = 5♀ 5♂). Bottom, examples of EEG recordings of a seizure, in an animal in the TBI cohort, and a phenotypically-normal EEG recording, in a mouse in the TBI + RTG cohort. (b) Top, bars summarize the percentage of animals that displayed epileptiform spike activity after pilocarpine challenge at a dose that is considered subthreshold in naïve mice (TBI n = 6♀ 7♂; TBI + RTG n = 5♀ 5♂). Whereas 61% of mice in the TBI group displayed abnormal spike activity, this was observed in only 20% of the mice in the TBI + RTG cohort. Bottom, EEG recordings of epileptiform spike activity recorded from a TBI animal and unremarkable cortical activity recorded from a TBI + RTG animal monitored for 24 h immediately after pilocarpine challenge. (c) Left, shown schematically is the placement of the epidural screw electrodes used for EEG recording. Right, shown is an image of a mouse fastened with an electrode head mount and preamplifier. (d, e) Bars summarize the lactate/pyruvate ratio in cortical and cerebellar samples from the Sham (n = 3♀ 3♂), TBI (n = 2♀ 3♂), and TBI + RTG (n = 3♀ 3♂) cohorts. Data are displayed as mean and S.D., *p < 0.05, **p < 0.01, ***p < 0.001.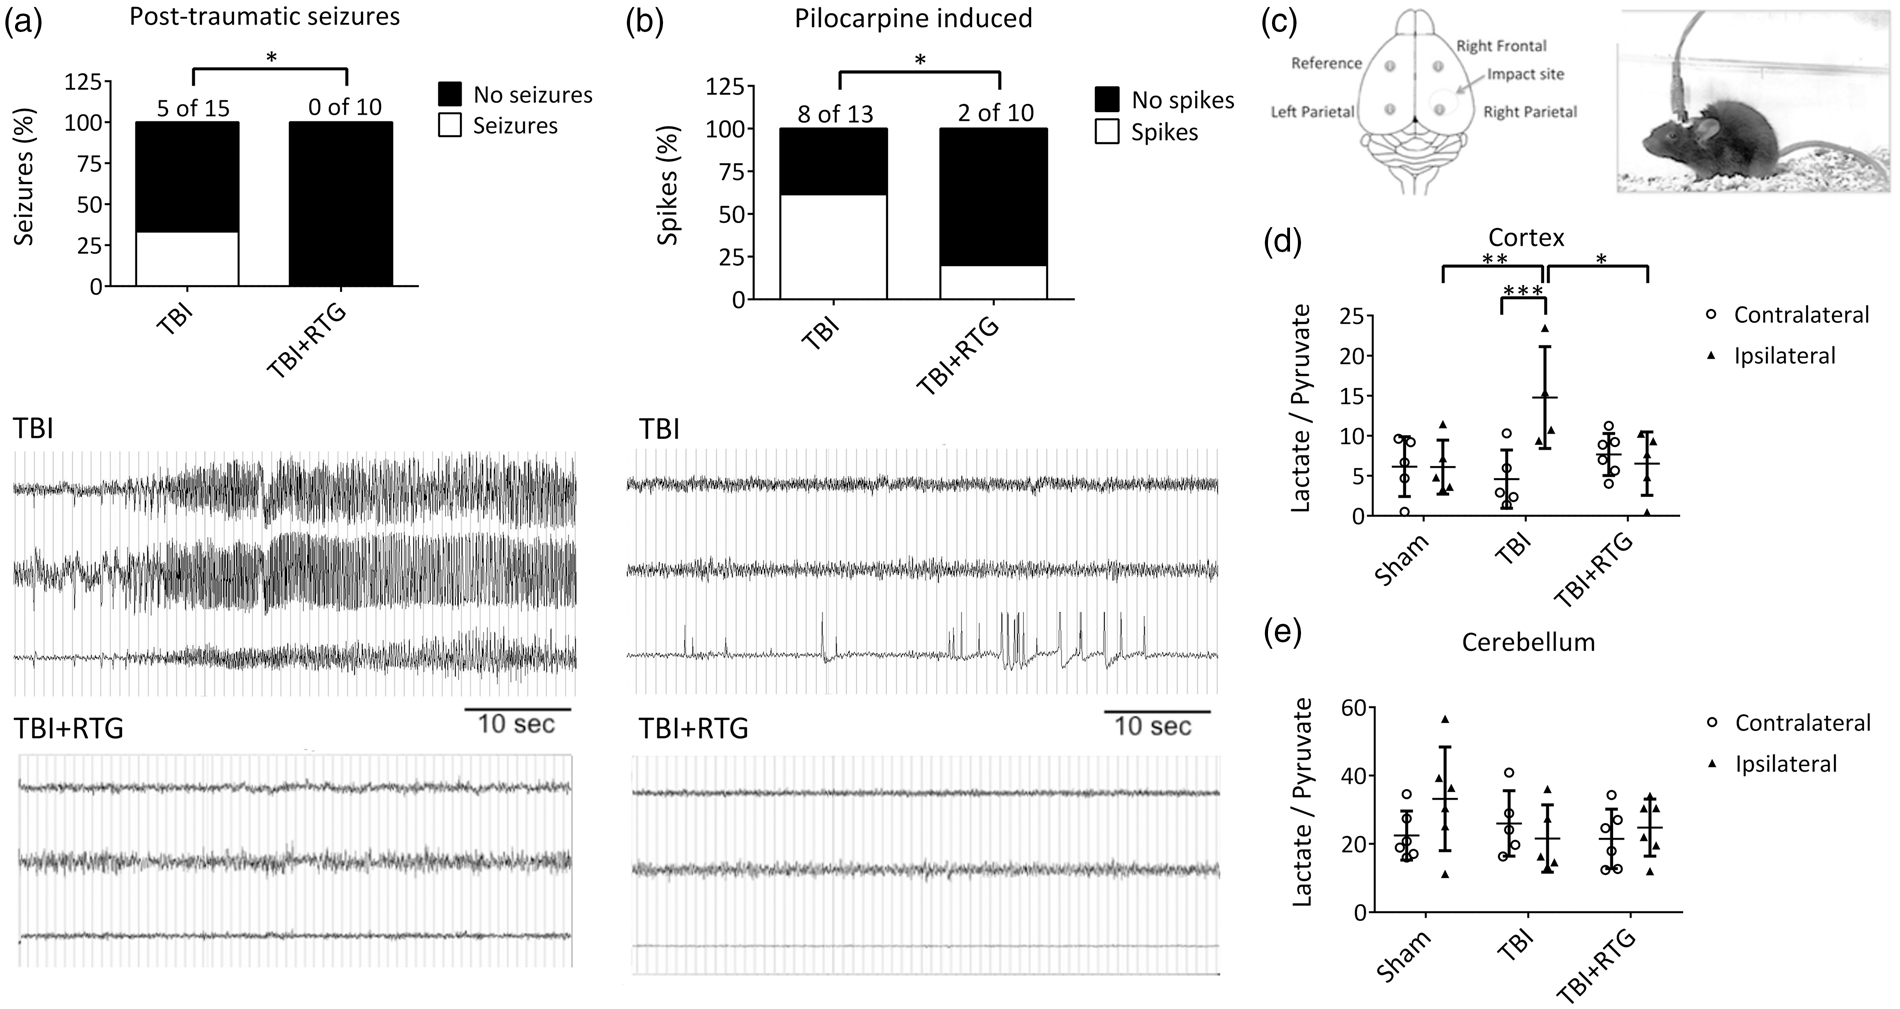
M-current treatment impairs TBI-induced metabolic stress
Our working hypothesis predicts that TBI-induced hyperexcitability results in exhaustion of neuronal energy stores. The ratio of lactate/pyruvate is a common measure of brain energy availability after injury.85,86 Cortical and cerebellar tissue from both ipsilateral and contralateral hemispheres to the CCCI was collected 24 h after injury, and the lactate/pyruvate ratio quantified (Figure 1(c)). A significant difference was observed between hemispheres and between Sham, TBI, and TBI + RTG cohorts (2-ANOVA – significant effect of hemisphere F1,29 = 4.2; p = 0.04; and interaction of hemisphere difference with group F2,29 = 5.9; p < 0.01). Only the TBI cohort displayed a significant increase in the lactate/pyruvate ratio in the ipsilateral vs. the contralateral hemispheres (Bonferroni analysis, t = 3.8; p < 0.001). Ipsilateral samples from the TBI cohort also manifested higher lactate/pyruvate ratios, vs. ipsilateral samples from Shams (t = 3.2; p < 0.01). In the TBI + RTG mice, the ipsilateral lactate/pyruvate ratio was significantly lower vs. the TBI cohort (t = 3.1; p = 0.01) and was not different from that from ipsilateral hemispheres of Shams (t = 0.1; p = 1.0). There was no significant difference in the contralateral lactate/pyruvate ratio between any of the mouse cohorts (Supplementary Table 2). Therefore, CCCI causes metabolic exhaustion of cells in the brain hemisphere ipsilateral to the site of TBI, which was prevented by acute RTG administration. No TBI or RTG-induced effects were observed in cerebellar samples (Figure 1(e); Supplementary Table 2), indicating that energy depletion was restricted to the area around the injury. This result correlates with the lack of effect of RTG alone in brain energy consumption, after 24 h.
M-current augmentation reduces injury related cell death and BBB disruption
We used PSVue 794 dye as a probe to assess TBI-induced cell death. NIR imaging with the IVIS system at 72 h post-TBI indicated CCCI-triggered cell death was mainly located around the site of impact (Figure 2(a)). This relatively focal injury was significantly reduced by RTG administration, indicating neuroprotection by M-current augmentation (Figure 2(b)). A significant difference between groups (Sham, TBI, TBI + RTG) was observed (1-ANOVA – F2,18 = 15.6; p < 0.001). Significantly higher staining for dead cells was seen in the cortex of TBI animals, compared to Shams (t = 5.5; p < 0.001) and TBI + RTG animals (t = 3.0; p = 0.02). No significant difference was observed between Sham and TBI + RTG animals (t = 2.5; p = 0.07), although there was some cell death in TBI + RTG animals. The cortical PSVue 794 staining corroborates with profound neuroprotection by M-current augmentation.
M-current augmentation prevented TBI-induced cell death and the focal increase in BBB permeability. (a) Representative ex vivo images of near-infrared fluorescent dye PSVue 794 probed brains. PSVue 794 was used to monitor cell death. The probe was localized to the peri-injured area. Radiant efficiency was illustrated by a pseudocolor scale ranging from black (least intense) to red (most intense) and quantified in Panel (b). Cell death was observed three days after CCCI, which was significantly reduced by RTG treatment (Sham n = 5♂; TBI n = 7♂; TBI + RTG n = 6♂). Evans blue dye was used to monitor BBB disruption. Panel (c) show Evans blue signal quantification for both rostral and caudal faces of two consequent sections (Sections A and B) around Bregma. The four sections correspond to two sides (rostral and caudal) of Sections A and B. “Section A rostral” is the most rostral and “Section B caudal” is the most caudal. Panel (d) shows representative ex vivo images of the most prominent BBB disrupted area, the epicenter of the hit (Section B-rostral). Although Evans Blue signal was more intense in the cortex, especially around the epicenter of the injury, subcortical regions like Hippocampus and Striatum also showed signs of BBB breakdown. However, since the intensity of the signal in the cortex was much higher them in other regions, the scale used for these images makes it hard to visualize the Evans Blue signal in the subcortical regions. Radiant efficiency was illustrated by a multicolor scale ranging from blue (least intense) to red (most intense) and quantified. BBB disruption was observed three days after CCCI, which was significantly reduced by RTG treatment (Sham n = 5♂; TBI n = 7♂; TBI + RTG n = 5♂). Panels (e–g) show linear regression analysis showing that BBB disruption is related to levels of cell death. Data are displayed as mean and S.D., *p < 0.05, **p < 0.01, ***p < 0.001.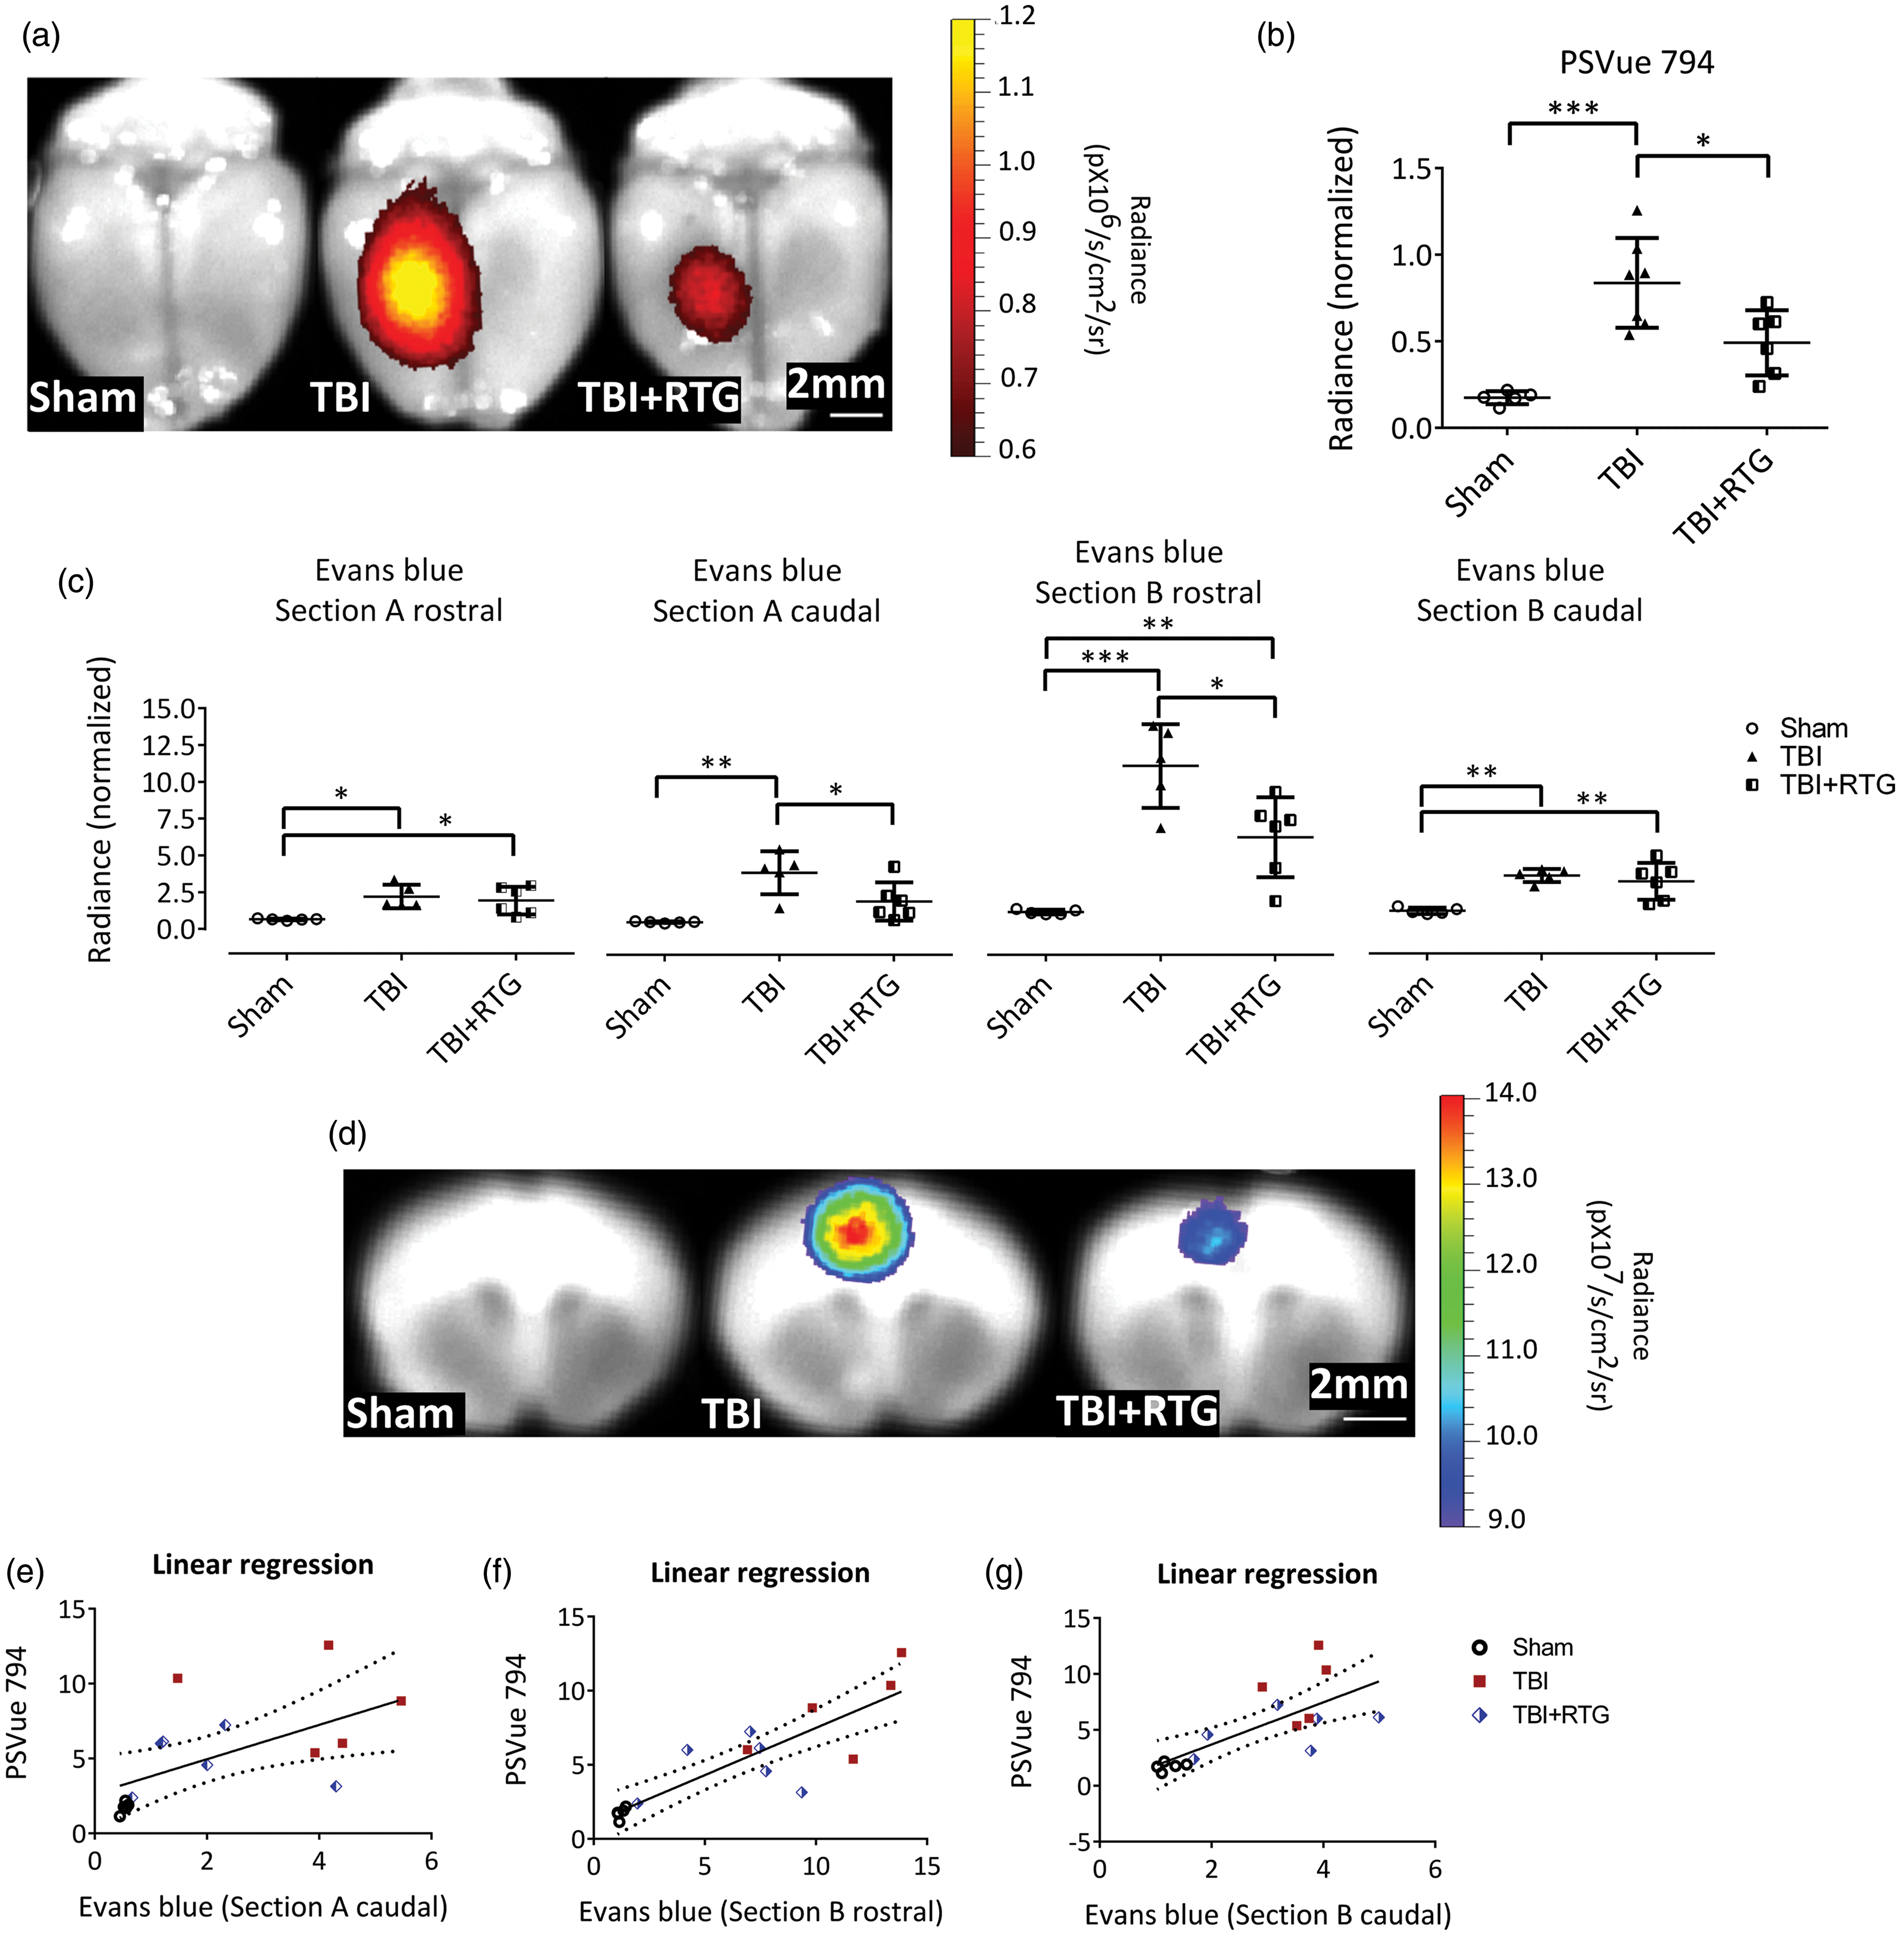
We investigated the severity of BBB disruption of the same cohorts as above, using the Evans blue extravasation assay at 72 h post-TBI, since the second wave of TBI-induced increase in BBB permeability has been shown to occur at this time point.87,88 After NIR imaging of PSVue 794, two coronal sections of the brain (sections A and B) were obtained, and the Evans Blue signals obtained from four faces of the brain (Figure 2(c) and (d)). The three groups of animals displayed significantly different levels of BBB permeability in all four areas (1-ANOVA – A rostral: F2,15 = 6.4; p = 0.01; A caudal: F2,15 = 10.7; p = 0.002; B rostral: F2,15 = 23.2; p < 0.001; B caudal: F2,15 = 12.1; p = 0.001). TBI mice manifested a significant increase in BBB permeability, compared to Shams in all four areas (Bonferroni – A rostral: t = 3.3; p = 0.01; A caudal: t = 4.6; p = 0.001; B rostral: t = 6.8; p < 0.001; B caudal: t = 4.5; p = 0.002). Compared to Shams, TBI + RTG mice displayed a significant increase in BBB permeability in sections A rostral (t = 2.8; p = 0.03), B rostral (t = 3.6; p = 0.009), and B caudal (t = 3.9; p = 0.005), but had levels of BBB permeability similar to Sham in A caudal sections (t = 2.0; p = 0.18). TBI + RTG animals displayed significantly decreased BBB breakdown vs. TBI mice in sections A caudal (t = 2.7; p = 0.04) and B rostral (t = 3.4; p = 0.01). We also observed a linear correlation between cell death profile and BBB permeability in sections A caudal (R2 = 0.34; t = 2.71; ANOVA F1,15 = 7.3; p = 0.01), B rostral (R2 = 0.73; t = 6.24; ANOVA F1,15 = 38.9; p < 0.001), and B caudal (R2 = 0.52; t = 3.93; ANOVA F1,15 = 15.4; p = 0.002) (Figure 2(e) to (g)).
M-current augmentation reduces inflammatory response and cell-death six days after TBI
To assess immunological/inflammatory responses, expression of Iba1 was quantified via immunoblotting of both hemispheres six days after injury (Figure 3(a)). We observed a significant difference between samples from the two hemispheres (2-ANOVA – F1,76 = 10.2; p = 0.002), as well as significantly different among groups (2-ANOVA – F2,76 = 9.0; p < 0.001) and the variation between groups was dependent on hemispheres, as the variation between hemispheres was dependent on cohort (2-ANOVA – F2,76 = 4.9; p = 0.01). A significant difference was seen between the ipsilateral, vs. the contralateral side, of animals in the TBI cohort (t = 4.5; p < 0.001) and between the ipsilateral side of animals in the TBI cohort vs. the ipsilateral side of Shams (t = 5.0; p < 0.001). There was also a reduction of Iba1 levels from ipsilateral samples from the TBI + RTG cohort vs. the TBI cohort (t = 2.6; p = 0.03).
M-current augmentation suppressed TBI-induced microglial activation in the ipsilateral cortex. (a) Top, bars summarize semi-quantification of immunoblots of Iba1 in ipsilateral and contralateral hemispheres from the Sham (n = 7♀ 5♂), TBI (n = 8♀ 6♂), and TBI + RTG (n = 8♀ 8♂) cohorts. β-actin was used as internal control and protein levels were normalized to the Sham ipsilateral average. Similar results were obtained using Ponceau red staining as an internal control (Supplementary Figure 4). Bottom, shown are representative exemplary immunoblot bands for each hemisphere from each mouse group. The full image obtained with the film exposure to the membrane can be found in Supplementary Figure 5. Immunostaining images of TBI-induced Iba1 increase and RTG action are exemplified in panel (b) (20×). Images are fluorescence emission of antibodies against Iba1 (green) and the nuclear marker DAPI (blue) of brain slices from Sham (n = 6♂), TBI (n = 4♂), and TBI + RTG (n = 5♂) animals. Mean fluorescence intensity per image of Iba1 staining was quantified in cortical slices (c). A significant increase in microglial/macrophage reactivation was observed after TBI, which was prevented by RTG treatment. Iba1 increase could also be observed in the contralateral hemisphere. Additionally, quantification of the corrected total cell fluorescence (CTCF = Integrated Density – (Area of selected cell × Mean fluorescence of background readings)) revealed an increase in Iba1 expression in TBI mice (d). Panel (e) shows representative exemplary images of immunohistochemical fluorescent staining of GFAP (red) and DAPI (blue), for the two hemispheres of Sham (n = 8♂), TBI (n = 6♂), and TBI + RTG (n = 7♂) animals. TBI induced a significant increase in astrogliosis that was attenuated by M-current augmentation (f–g). Finally, CCCI induced cell-death was visualized and quantified by Fluro Jade B (FJB) staining (H). Cortical slices of TBI + RTG animals (n = 5♂) had lower cell-death stanning than slices from TBI animals (n = 8♂) (I). Data are presented as the mean and S.D., *p < 0.05, **p < 0.01, ***p < 0.001.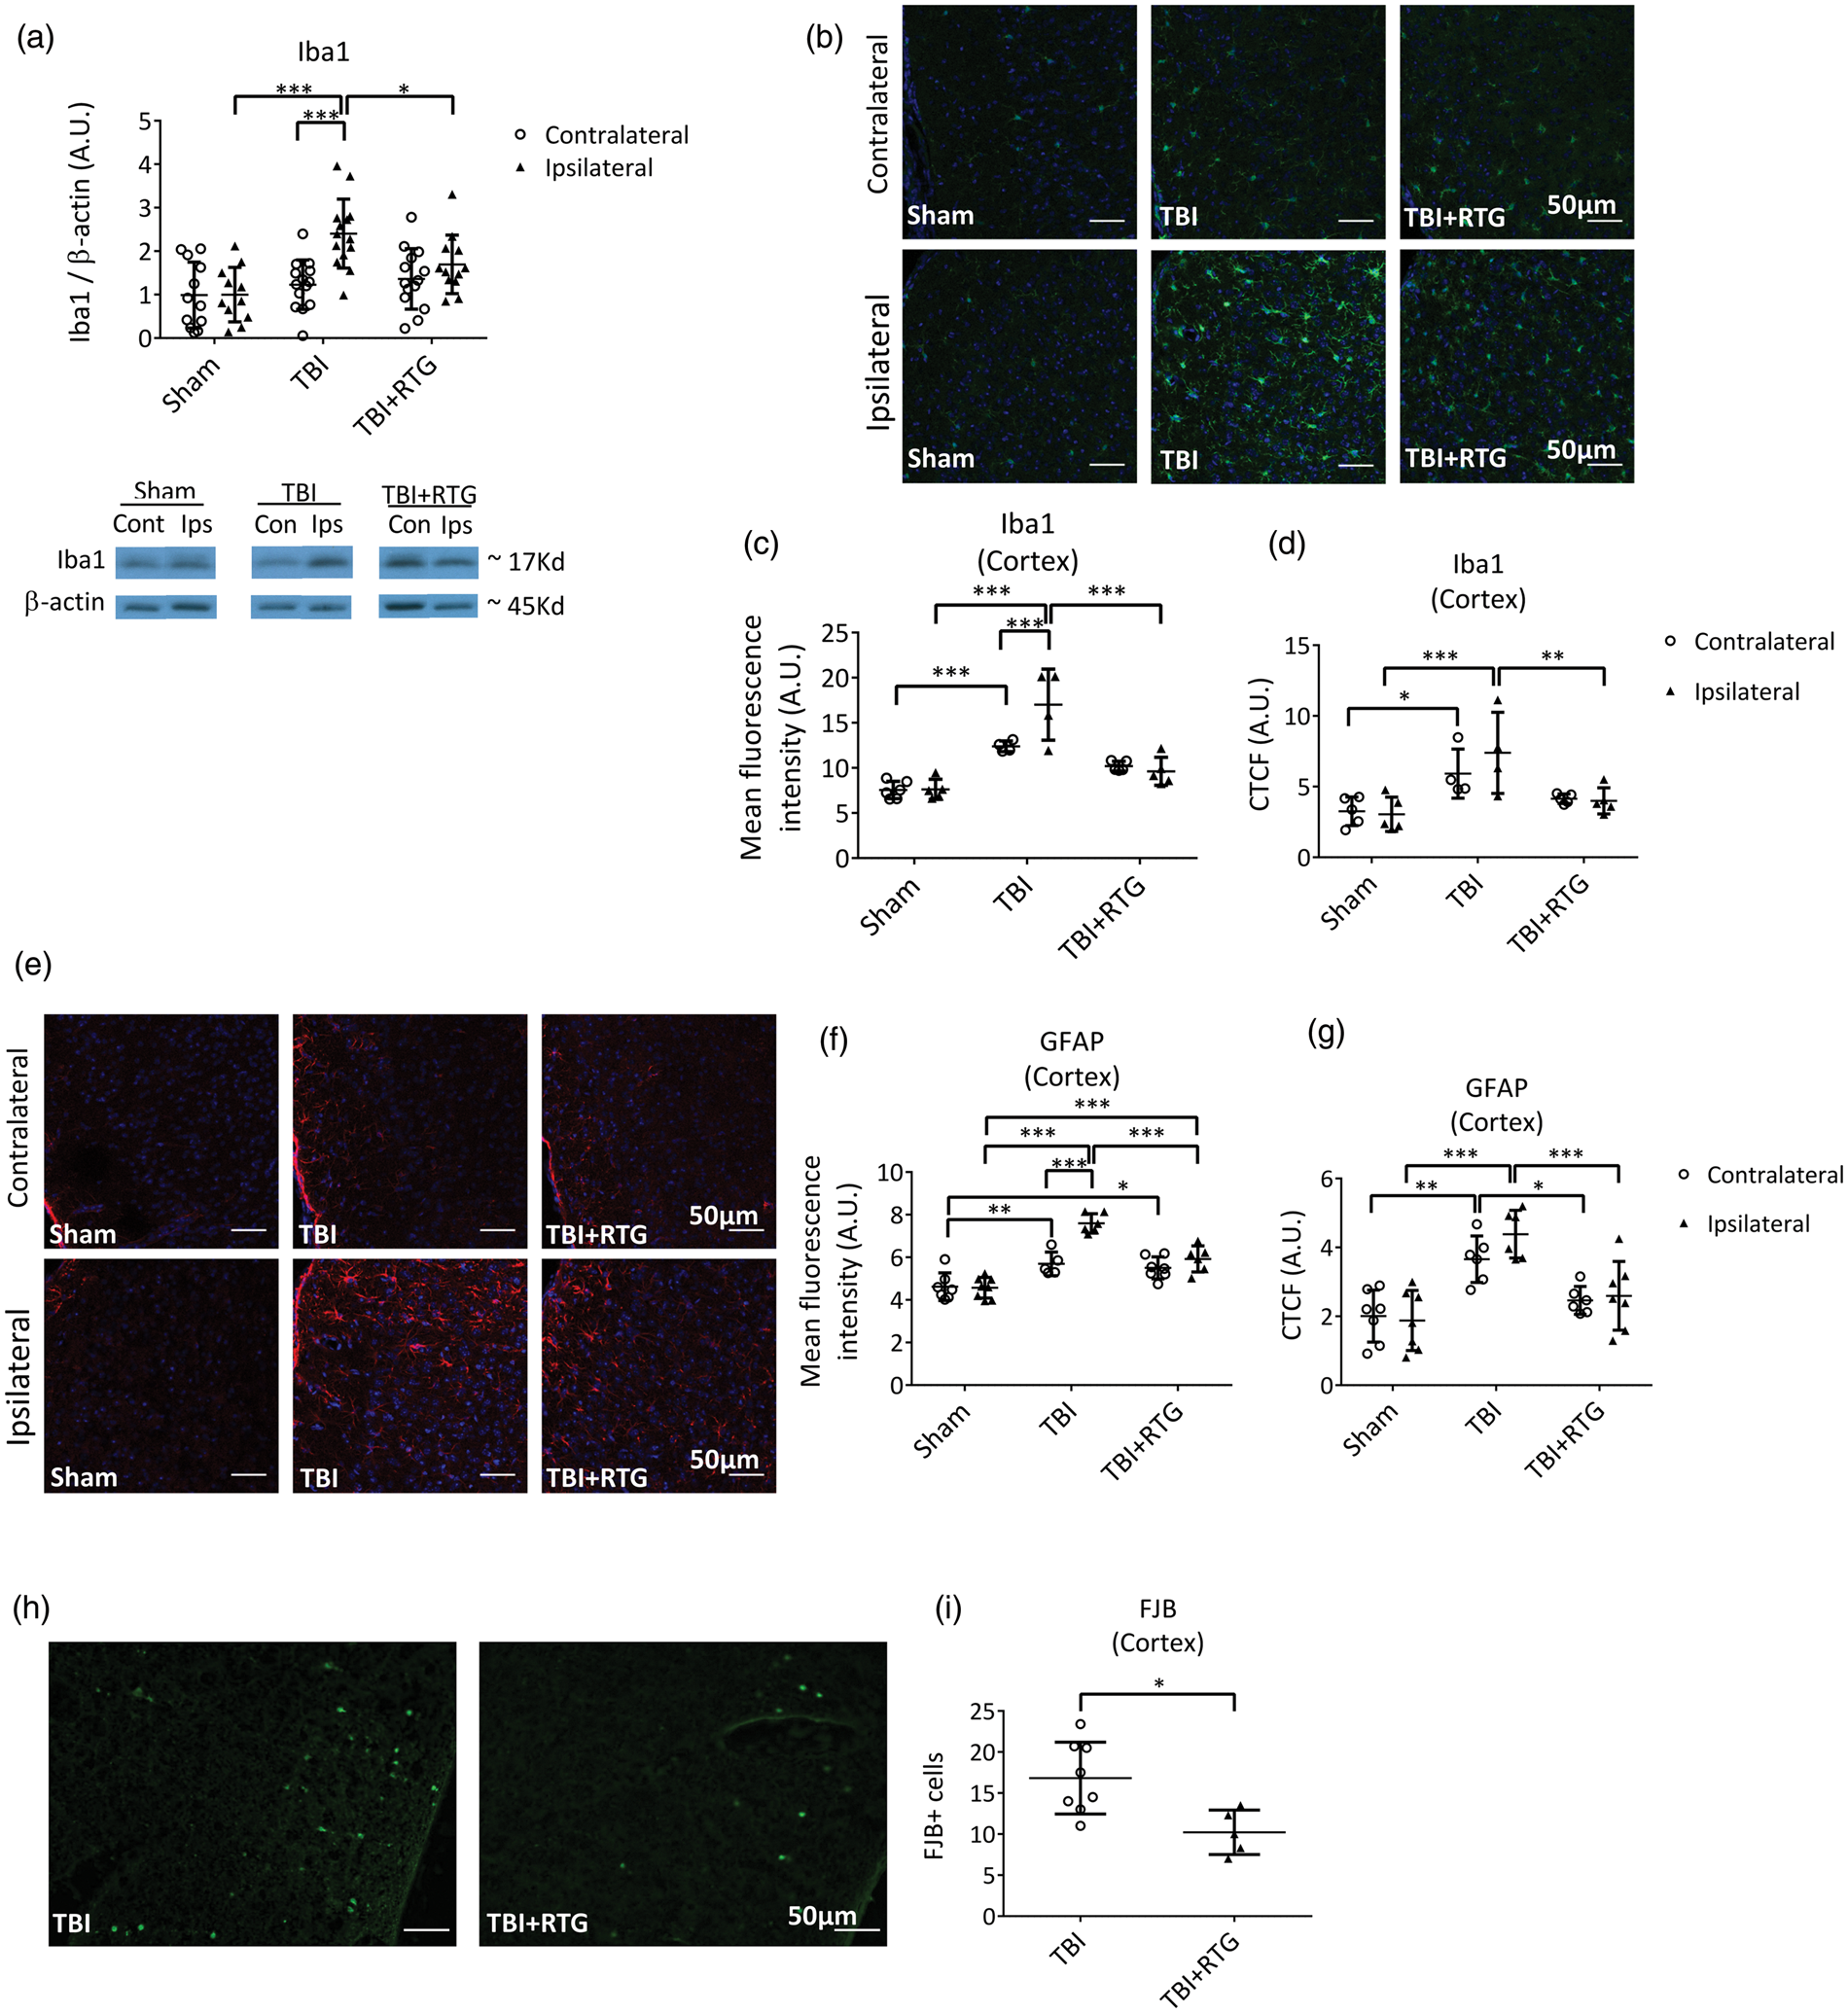
To complement these results, and to yield spatial information, we immunostained cortex slices for Iba1 expression (Figure 3(b)). A significant difference was observed of mean total fluorescence between the three cohorts (2-ANOVA – F2,28 = 40.1; p < 0.001), and between the two hemispheres within a cohort (2-ANOVA – F1,28 = 4.5; p = 0.04); additionally, the variations between hemispheres and between groups were correlated (2-ANOVA – F2,28 = 5.8; p = 0.009) (Figure 3(c)). The ipsilateral cortex of TBI animals displayed greater staining for Iba1 than the ipsilateral side of Sham (t = 8.1; p < 0.001) and TBI + RTG (t = 6.4; p < 0.001) groups. There was no difference in ipsilateral samples from the animals in the Sham and TBI + RTG groups (t = 1.8; p = 0.23). Only the TBI group displayed a significant difference between ipsilateral and contralateral cortical samples (t = 3.7; p < 0.001). There was a significant increase of staining in animals on the contralateral side of the TBI group vs. Shams (t = 4.3; p < 0.001). We found significant differences in CTCF values between samples from the three cohorts (Figure 3(d); 2-ANOVA – F2,27 = 13.2; p < 0.001). Bonferroni analysis revealed TBI ipsilateral samples to be significant differently from Sham ipsilateral (t = 4.4; p < 0.001) and from TBI + RTG ipsilateral (t = 3.4; p = 0.007) samples. Additionally, TBI contralateral samples showed higher Iba1 expression than Sham contralateral samples (t = 2.6; p = 0.04). These data suggest that the immunological response to CCCI goes beyond the site of impact, including the contralateral side, as opposed to the ipsilateral-only effects seen in Figure 2.
We also immunostained GFAP as a measure of astrogliosis in ipsilateral and contralateral cortical samples from the three groups of animals (Figure 3(e)). A significant difference was observed in GFAP expression per image between the three cohorts (2-ANOVA – F2,38 = 44.9; p < 0.001), and the two cortical hemispheres (2-ANOVA – F1,38 = 18.0; p < 0.001) (Figure 3(f)). There was also a significant interaction between these two factors, meaning that changes in one parameter (group or cortical side) were related to the changes observed in the other (2-ANOVA – F2,38 = 10.4; p < 0.001). GFAP levels of TBI ipsilateral samples were significantly higher than the levels of GFAP in ipsilateral Sham samples (t = 10.2; p < 0.001) and from TBI contralateral samples (t = 5.7; p < 0.001). TBI + RTG ipsilateral samples displayed lower GFAP levels than TBI ipsilateral samples (t = 5.2; p < 0.001), but higher levels than from Shams (t = 4.5; p < 0.001). Both TBI (t = 3.3; p = 0.006) and TBI + RTG (t = 3.0; p = 0.01) groups of mice displayed increased levels of GFAP in the contralateral hemisphere vs. those of Shams. We found the CTCF (Figure 3(g)) to be significantly different between samples from SHAM, TBI and TBI + RTG animals (2-ANOVA – F2,38 = 24.7; p < 0.001). TBI ipsilateral samples were also significantly different from Sham (Bonferroni analysis, t = 5.9; p < 0.001) and from TBI + RTG ipsilateral (t = 4.1; p < 0.001) samples. A significant difference was also observed between TBI contralateral and Sham contralateral samples (t = 3.9; p = 0.001) or TBI + RTG contralateral (t = 2.7; p = 0.03) samples.
FJB staining was used to assay cell death six days after CCCI (Figure 3(h)). No specific staining was observed in Sham samples and in subcortical regions of TBI animals only very weak staining was observed (Supplementary Figure 3). TBI ipsilateral cortical slices displayed significantly higher FJB staining compared to TBI + RTG cortical slices (Figure 3(i)) (1-ANOVA – F1,13 = 9.0; p = 0.01).
The same brain samples as in Figure 3(a) were used for semi-quantification of CD40L via immunoblotting (Figure 4(a)). We found a significant hemisphere-dependent effect (2-ANOVA – F1,72 = 8.4; p = 0.005). For TBI animals, there was a robust increase in CD40L expression on the ipsilateral vs. contralateral sides (t = 2.9; p = 0.009). However, in the TBI + RTG cohort, this was not seen (t = 1.6; p = 0.10). These data support the hypothesis that acute augmentation of M current after TBI reduces inflammatory/immunological responses to injury. Interestingly, levels of CD40L were directly related to those of Iba1, determined by fits of linear regression (Figure 4(b)) (R2 = 0.08; t = 2.47; ANOVA F1,66 = 6.1; p = 0.01), supporting the hypothesis that TBI-induced increase in CD40L and increased microglia/macrophage activation/migration are correlated. But, in the case of CD40L, this was observed to be more localized to the site of impact, as no rise in CD40L levels was evidenced contralateral to the impacted hemisphere.
M-current augmentation blocked the TBI-induced inflammatory/immunological response and the TBI-induced increase in the expression of a cell death-related protein at six days post-TBI. (a) Top, bars summarize the semi-quantification of CD40L levels in ipsilateral and contralateral hemispheres from mice of the Sham (n = 7♀ 5♂), TBI (n = 8♀ 6♂), and TBI + RTG (n = 8♀ 6♂) cohorts. CD40L levels were normalized by β-actin levels in each sample independently. Bellow, shown are exemplary bands of CD40L and β-actin immunoblots. (b) Analysis of the correlation between levels of CD40L and Iba1 plotted as scatterplots. The derived data were fit by a direct linear regression model, as shown by the line, which indicates a high correlation. (c) Top, bars summarize immunoblotting semi-quantification of RIP1 levels in Sham (n = 8♀ 5♂), TBI (n = 8♀ 6♂), and TBI + RTG (n = 9♀ 8♂) cohorts. RIP1 levels in each sample were normalized by GAPDH levels. Group means were normalized by the mean of levels from the sham ipsilateral samples. Similar results were obtained by normalizing CD40L or RIP1 to Ponceau staining (Supplementary Figure 4). Full immunoblotting images can be seen in Supplementary Figure 5. (d), (e) Plotted are the correlations between RIP1 and CD40L levels, or between Iba1 and Rip1 levels, both of which were seen to be significantly correlated by fits to a linear regression model. Data are plotted as the mean and S.D., *p < 0.05, **p < 0.01.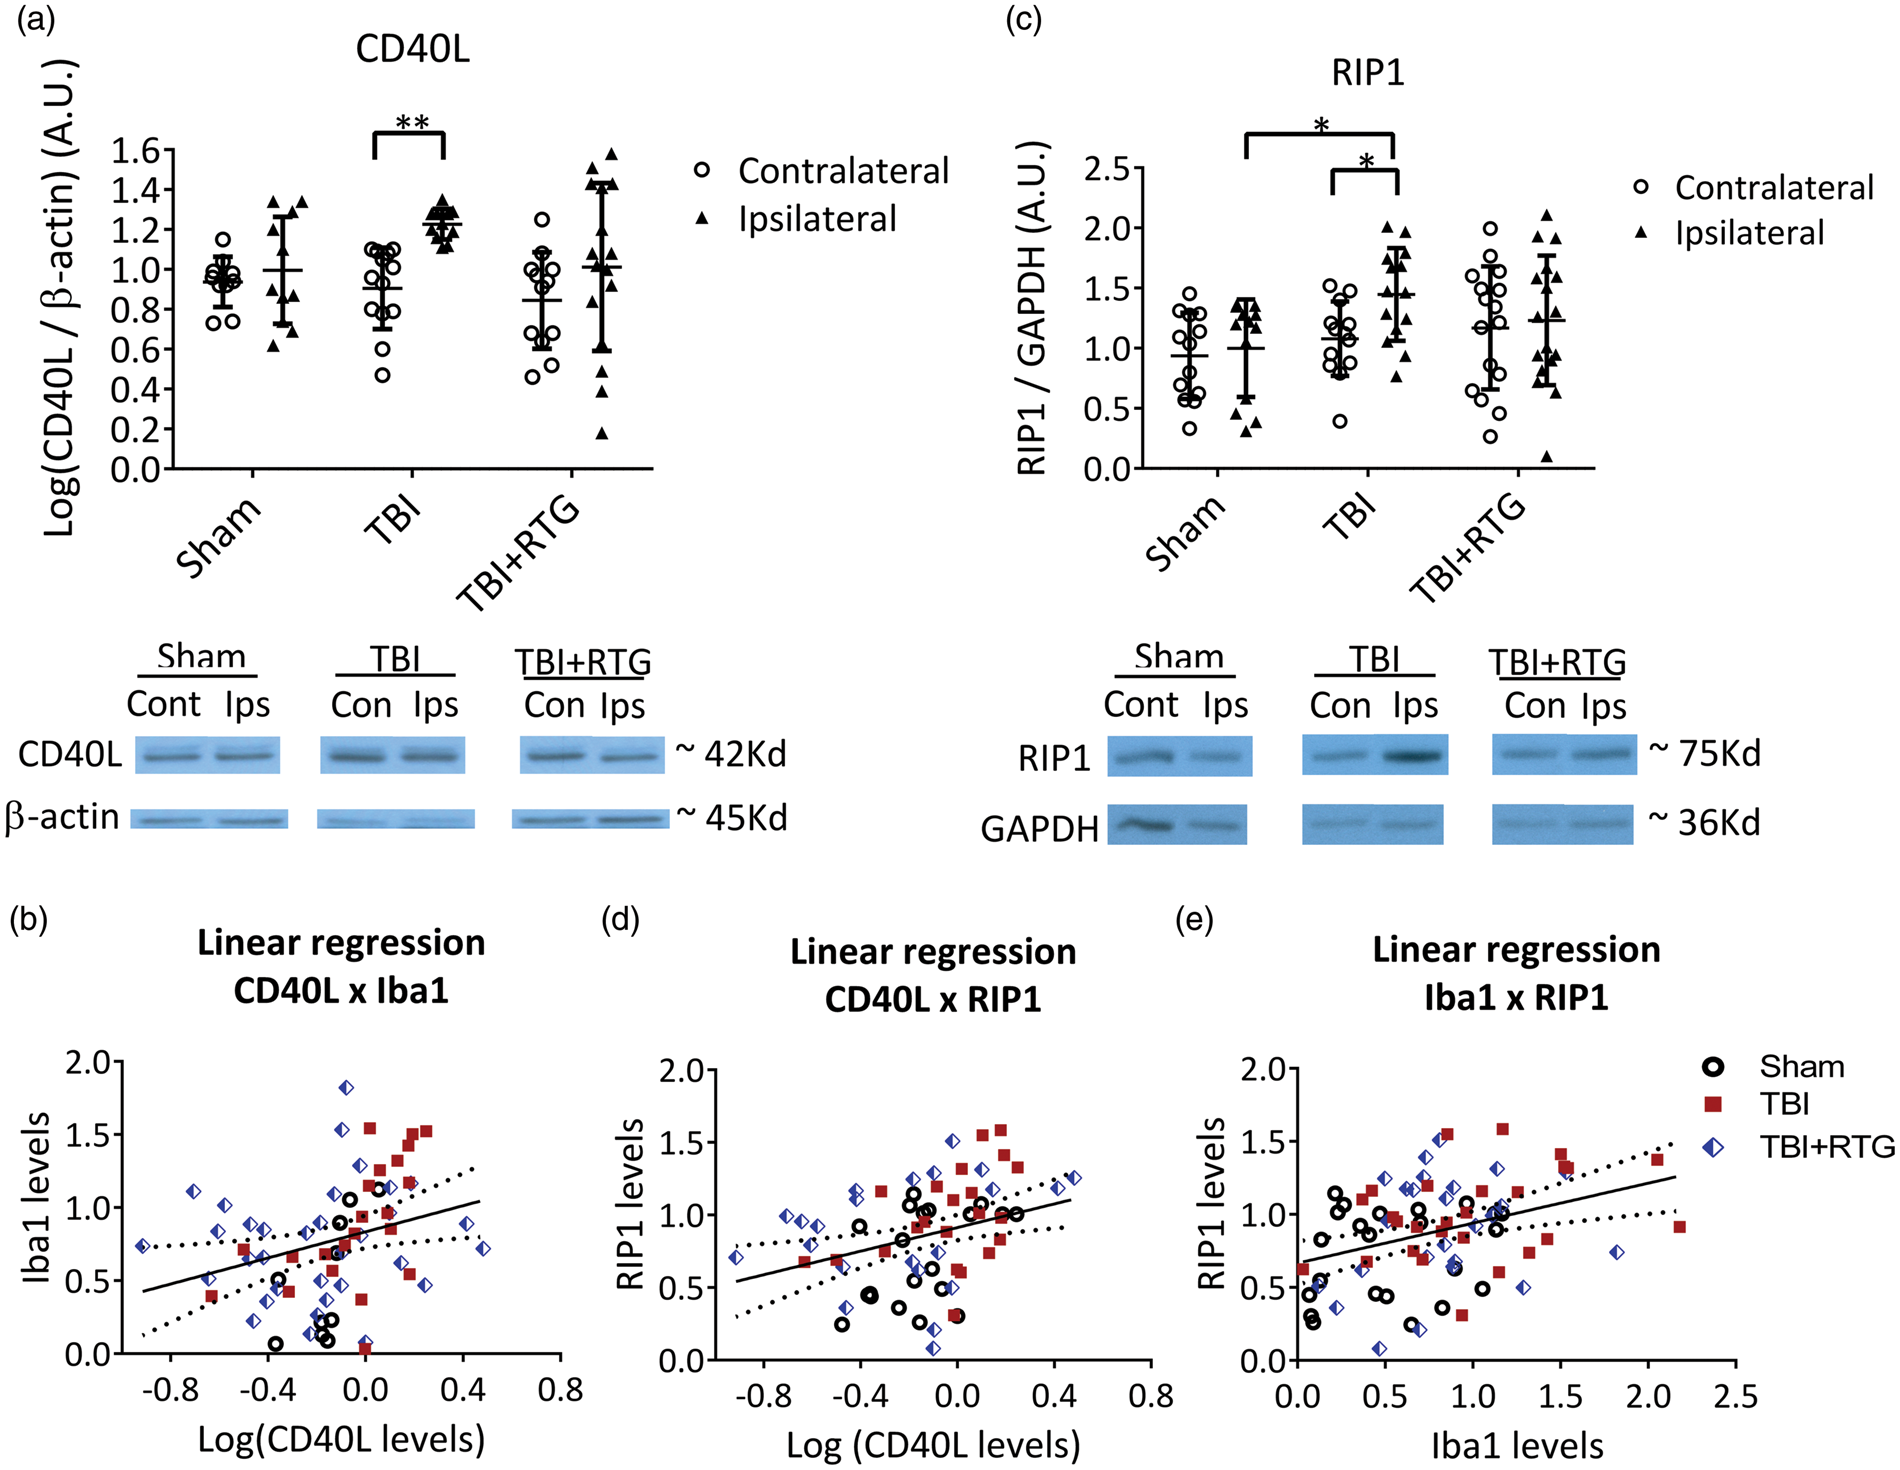
Post-TBI apoptosis and necrosis were assayed using RIP1.26–28 We found a significant difference in RIP1 expression between cohorts (Figure 4(c)) (2-ANOVA – F2,85 = 3.3; p = 0.03). In TBI animals, RIP1 expression was increased between the ipsilateral, vs. the contralateral, hemispheres (t = 2.1; p = 0.03). However, for the TBI + RTG group, there was no such difference (t = 0.4; p = 0.68). TBI also increased RIP1 levels in the ipsilateral side of the TBI cohort vs. Shams (t = 2.6; p = 0.02). RIP1 levels were correlated with those of Iba1 (R2 = 0.13; t = 3.33; ANOVA F1,74 = 11.1; p = 0.001) (Figure 4(e)) or CD40L (R2 = 0.10; t = 2.84; ANOVA F1,70 = 8.0; p = 0.006) (Figure 4(d)) levels. Hence, TBI provokes inflammatory/immunological responses that result in the production of cell-death-related proteins. Furthermore, the inflammatory response and cell death are correlated, suggesting an etiology of traumatic cerebral damage. As another control, immunoblots were also stained with Ponceau S and bands obtained in the range of 37–100 kD semi-quantified (Supplementary Figure 4). This analysis wholly paralleled those described above obtained for Iba1, CD40L, and RIP1, using β-actin as a housekeeping control.
Total KCNQ2 transcription is upregulated in the ipsilateral hemisphere of animals subjected to CCCI and acute RTG treatment
Cortical samples were collected 24 h after CCCI or Shams among each mouse group and mRNA levels of KCNQ2 and KCNQ3 quantified by qRT-PCR. There was a significant effect on total KCNQ2 transcription between the two hemispheres (2-ANOVA – F1,54 = 9.7; p < 0.005) (Figure 5(a)). We found no difference in total KCNQ2 mRNA between hemispheres of the Sham and TBI groups (Figure 5(a); Supplementary Table 2). However, for the TBI + RTG cohort, total KCNQ2 mRNA was higher in the ipsilateral vs. the contralateral hemisphere (t = 2.6; p = 0.03). No significant differences in expression were observed in KCNQ3 mRNA whatsoever (Figure 5(b); Supplementary Table 2). Possible reasons for this are discussed below.
Augmentation of M-current post-TBI increased KCNQ2 transcription in the ipsilateral hemisphere of mice acutely treated with RTG. A, B, graphs summarize qRT-PCR quantification of cortical mRNA levels of KCNQ2 (a) and KCNQ3 (b), 24 h after trauma, in Sham (n = 5♀ 5♂), TBI (n = 5♀ 5♂), and TBI + RTG (n = 5♀ 4♂) cohorts. (c) (d) Graphs summarize qRT-PCR quantification of cortical mRNA levels of KCNQ2 (c) and KCNQ3 (d), six days after trauma, in Sham (n = 5♀ 4♂), TBI (n = 4♀ 5♂), and TBI + RTG (n = 4♀ 5♂) cohorts. (e)–(h) Transgenic mice engineered to express EGFP as a reporter for KCNQ2 mRNA were subjected to CCCI, treated with RTG and sacrificed after 24 h, and brain slices immunostained for EGFP and MAP2. (e) Exemplary images of the fluorescent signal of cortical slices in TBI + RTG mice from the contralateral (top) or ipsilateral (bottom) hemisphere to the CCCI. (f)–(h) Graphs summarize the number of EGFP-positive cells per image (f) (number of images: ipsi = 21, contra = 19) mean fluorescent emission per EGFP-positive cell (g) or maximum fluorescent intensity per EGFP-positive cell (number of cells: ipsilateral = 493, contralateral = 392; number of mice = 2♂) (h). Normally distributed data are expressed as dot plots with mean and S.D. Not normally distributed data are shown in box plot graphs with median, 25% and 75% quartiles and lowest and higher values. *p < 0.05, ***p < 0.001.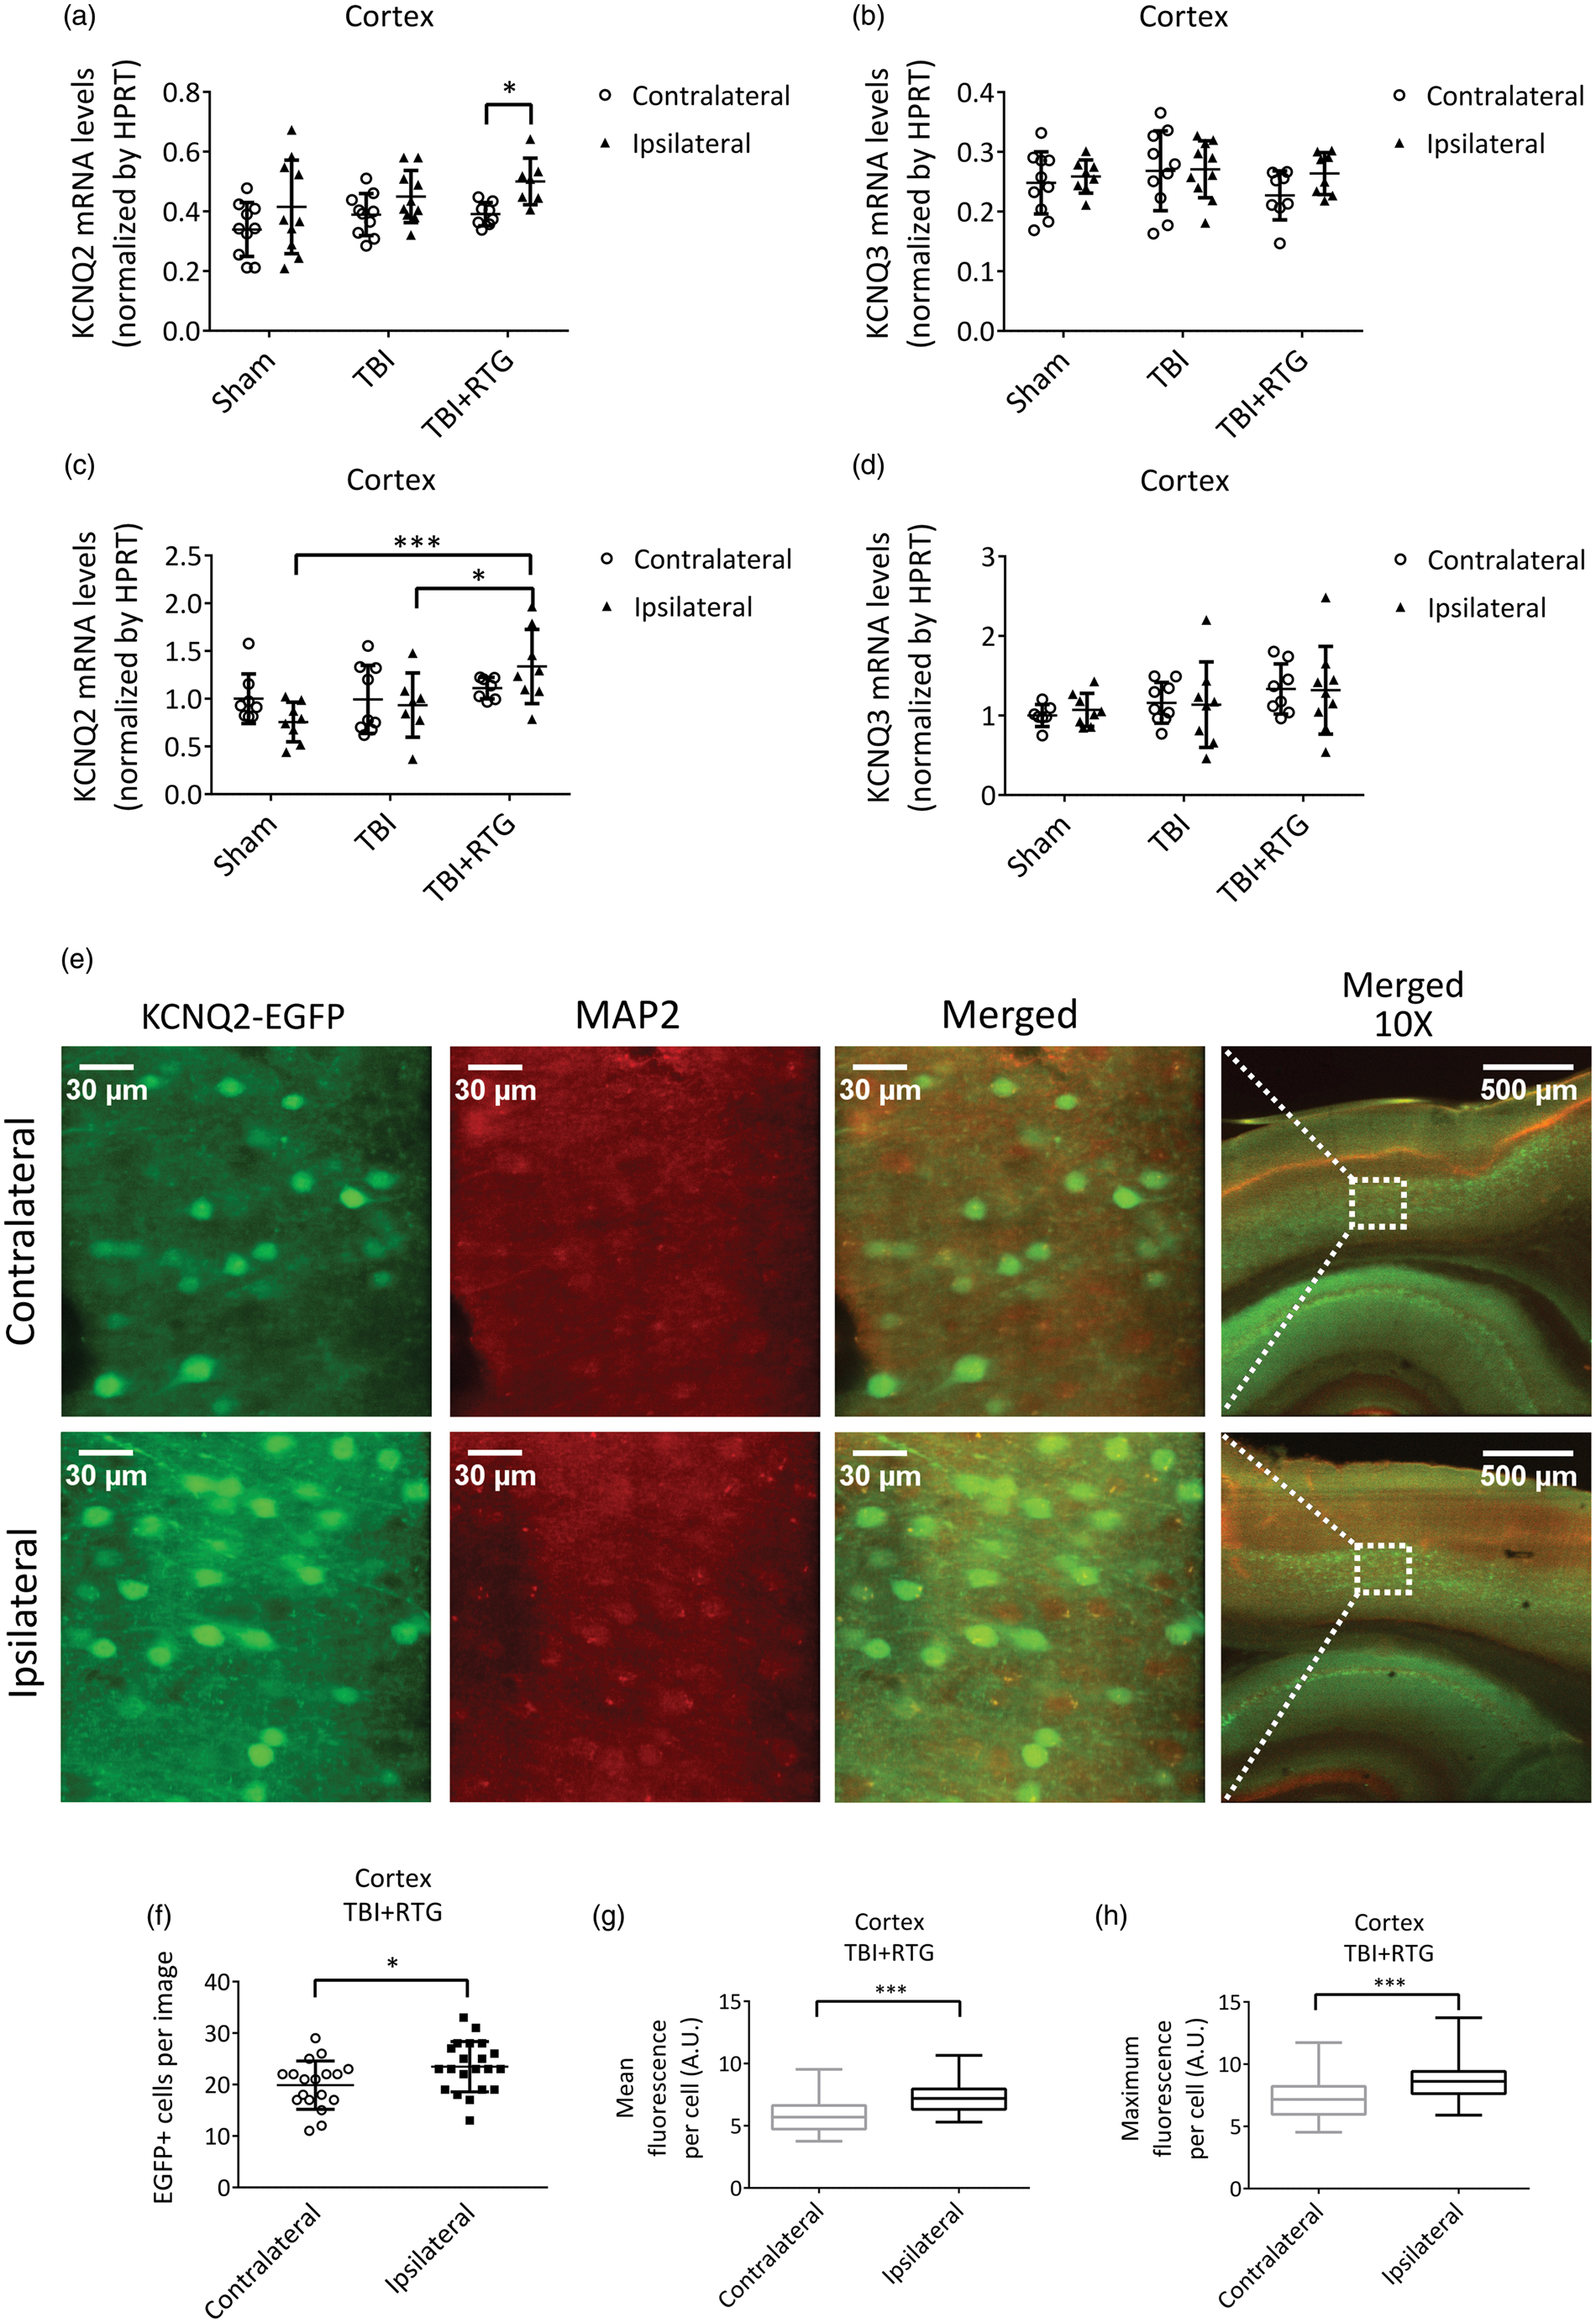
Parallel experiments were performed to assay for altered KCNQ transcription six days post-TBI, yielding very similar results (Figure 5(c) and (d)). There was a significant difference in KCNQ2 mRNA levels between cohorts (2-ANOVA – F1,46 = 5.7; p = 0.007). Samples from the TBI + RTG group manifested increased levels of KCNQ2 mRNA in the ipsilateral hemisphere, compared to Sham (t = 3.9; p < 0.001) and TBI ipsilateral samples (t = 2.6; p < 0.05). Again, we found no significant difference in total KCNQ2 mRNA levels between hemispheres or between either hemisphere of mice in the Sham and TBI groups (Supplementary Table 2). There was also no significant effect on KCNQ3 mRNA levels between hemispheres of any group, or between hemispheres among cohorts (Supplementary Table 2).
As another test for altered transcription of KCNQ2, we subjected KCNQ2-mRNA EGFP reporter mice to CCCI and RTG administration, to visualize KCNQ2 expression in individual cells of cortical regions (Figure 5(e) to (h)) and quantified expression at 24 h post-TBI. Cells from cortical layers 4/5 were examined and the numbers of EGFP-positive cells and the mean and maximum fluorescence per EGFP-positive cell quantified (Figure 5(f) to (h)). A significant increase in EGFP-positive cells (F1,39 = 5.4; p = 0.02), as well as mean (p < 0.001) and maximum (p < 0.001) fluorescent emission per EGFP-positive cell, were observed in the ipsilateral vs. contralateral cortex of TBI + RTG animals (Figure 5(e) to (h)). These results confirm similar changes in KCNQ2 mRNA expression observed in our qRT-PCR assays 24 h after CCCI (Figure 5(a)); thus, we conclude that both the number of neurons expressing KCNQ2 mRNA and their levels of expression were higher.
Discussion
TBI is known to induce acute hypoperfusion, due to vascular damage, that leads to metabolic stress. 12 The phenomena of hypoperfusion and PTS together exacerbate the destructive post-TBI “ischemic cascade”. PTS indisputably predicts a worse clinical outcome, correlating with the extent of brain atrophy, edema and cerebral dysfunction.9,75–78 We here observed that M-current augmentation completely blocked PTS and reduced susceptibility to epileptiform spike activity. M-current augmentation has previously been shown to be protective after oxygen and glucose deprivation and after ischemic stroke, which we attribute to a reduction of neuronal energy demand.23–25 Hence, M-current augmentation could be simultaneously tackling two main causes of TBI-induced metabolic stress, PTS and hypoperfusion, thus nipping the potential ischemic cascade “in the bud”. Accordingly, acute M-current augmentation severely blunted deleterious post-TBI events, such as the inflammatory/immunological response, cell death, and BBB disruption.
Our working hypothesis is that cell death, inflammatory/immunological responses, and PTS work in a “vicious cycle”, in which each one exacerbates the other. Several different TBI mouse models have reported an initial acute BBB breakdown, followed by a later increase in the BBB permeability 3–7 days after injury. This secondary increase in BBB permeability has been linked to the degree of inflammatory responses and metabolic stress. 79 Remarkably, induction of seizures with different convulsant drugs was found to result in BBB breakdown in distinct areas of the brain, dependent on the mechanism of action of the drug. 80 Whereas pharmacological induction of BBB breakdown results in epileptiform activity and seizures,81,82 regions of increased BBB permeability have been shown to correlate with the areas of focal cortical abnormal brain activity in TBI patients. 83 Therefore, the attenuation of TBI-induced BBB permeability by acute pharmacological augmentation of M current probably contributes to its efficiency in preventing the development of post-traumatic epilepsy, as it can break the cycle between PTS and BBB breakdown.
Another example of the TBI-induced maladaptive response involves cell death and inflammatory/immunological responses. Thus, mice subjected to CCCI displayed increased levels of CD40L. CD40L is produced by astrocytes and T-lymphocytes in pathological situations and stimulates CD40 receptors expressed in microglia and macrophages, increasing their activity.84–86 This stimulation can be via the soluble form of CD40L or the membrane-bound ligand.87,88 The membrane-bound form induces co-stimulation of both cells involved in the interaction (CD40 cells and CD40L cells).84–86 Although we did not differentiate those two forms here, there is evidence of a CD40/CD40L mechanism of co-stimulation after cortical stab injury. 89 Therefore, in the ipsilateral hemisphere, increased Iba1 and GFAP could be linked to each other via CD40/CD40L co-stimulation. In neurodegenerative models, the degree of CD40L,41,84,90–93 Iba1,94,95 and GFAP96–98 expression affects BBB breakdown and cell death. We also assayed RIP1 levels as a marker of necrotic and apoptosis cell death44–46 and found acute administration of RTG post-TBI to block rises in RIP1 expression. RIP1 expression can be increased by pro-inflammatory signals, such as activation of tumor necrosis factor (TNF) receptors.45,46 TNF-α is produced by microglia after a TBI99,100 and correlates with TBI-induced hyperexcitability. 101 Additionally, upregulation of CD40L reportedly induces RIP1-dependent cell death, 102 and TNF-α blockade decreases CD40L levels 103 and CD40 activation. 104 This synergistic line of thinking is consistent with the significant linear relationship observed between RIP1, CD40L, and Iba1, and between PSVue 794 and Evans blue staining. We are particularly interested in the role of TNF-α in such synergistic action.46,101
As opposed to our results, other anticonvulsant drugs, such as the Na+-channel blockers phenytoin and carbamazepine, has been shown to be unable to stop epileptic seizures after TBI.105–107 Several factors could account for these differing results. One is the above-mentioned additive effect of M-current enhancement in preventing TBI-induced metabolic stress through reduction of both PTS and neuronal energy demand post-TBI.23–25 Another factor might arise from the observed increase in KCNQ2 expression seen only in TBI mice treated with RTG. Such increases could be an indicator that enhanced M current helps cells survive via an intrinsic augmentation of M-channel expression provoked by TBI-induced hyperexcitability. Considering that the contralateral hemispheres of TBI + RTG mice did not show any change in KCNQ2 expression, it seems that KCNQ2 mRNA increases in the ipsilateral side of TBI + RTG mice arise from both TBI and RTG treatment. A plausible hypothesis is that TBI-induced hyperexcitability provokes an increase in KCNQ2 transcription of neurons;47,60 however, such neurons must be able to survive the immediate aftermath of the TBI to respond to hyperexcitability with increased KCNQ2 mRNA expression. By allowing neurons to survive the early effects of TBI, RTG increases KCNQ2 transcription throughout the ipsilateral hemisphere. Additionally, M current is known to be suppressed itself by inflammatory responses,108,109 but M-channel openers, such as RTG, can overcome such depression of M current. 82 This is probably an important mechanism underlying the acute phase of TBI damage. Later reduction of TBI-induced inflammatory responses, due to impairment of TBI-induced PTS/cell death/inflammation, may also help explain the effectiveness of M-current enhancement. The increase in KCNQ2 mRNA six days post-TBI, combined with RTG, opens the possibility of this treatment representing a much longer-term therapeutic intervention that might continue to protect the brain against TBI-induced hyperexcitability.
We found up-regulation of KCNQ2, but not KCNQ3, transcription in ipsilateral cortical samples of mice in the TBI + RTG group. Our group has described both KCNQ2 and KCNQ3 to be up-regulated in mouse sympathetic neurons after strong stimulation and in whole hippocampus after a seizure. 47 Nonetheless, due to the particular sensitivity of KCNQ2 subunits to several modulatory signals, 110 its transcriptional regulation exerts the most efficient control over M-current amplitudes. Accordingly, KCNQ2-null mice always result in epileptic phenotypes that usually end in sudden death, whereas KCNQ3-null mice only rarely do.22,111–122 In humans, there are ∼100 inherited mutations in KCNQ2 that lead to epileptic syndromes, but only a handful that do so for KCNQ3.123–125 Therefore, the specific increase of KCNQ2 mRNA may reflect a more prominent role of KCNQ2 in controlling neuronal activity.
Although we have focused on neurons in our interpretations of the effects of RTG, KCNQ channels are also regulators of excitability in smooth muscle, as augmented KCNQ4/5 currents decrease smooth muscle contraction. As for the efficacy of RTG against brain damage following ischemic stroke, 25 part of the beneficial effect of RTG we observed here could have been ascribed to increased blood flow and consequent increase supply of glucose/O2. However, such an effect would also increase the damage due to increased BBB permeability, whereas we observed a decrease. Therefore, we doubt such action on smooth muscle was pivotal here. Consistent with that conclusion, RTG action on bladder was recently reported to be via reduction in mouse bladder afferent nerve activity without affecting smooth muscle tone. 126 We also emphasize that whereas our data here support the post-TBI inflammatory response as a key culprit in TBI-induced brain dysfunction, we do not suggest that RTG directly suppresses immune-cell or inflammatory function. Rather, we suggest that RTG is beneficial due to prevention of early metabolic stress and neuronal death, due to its ability to suppress acute hyper-excitability and inflammation-induced M-current suppression.82,108,109
As a pharmacological agent, we used RTG, a prototype M-channel opener that, besides being used in a plethora of in vitro and in vivo studies, 127 is the only FDA-approved drug targeting M channels as an anticonvulsant. Therefore, the appropriate in vivo dose is well established. It is also the compound used in our previous work showing neuronal dampening via M-current augmentation to be highly neuroprotective after cerebrovascular thrombosis. 25 Nevertheless, RTG has ceased to be used in the clinic due to retinal abnormalities, urinary incontinence, and blue skin discoloration after prolonged use.128,129 Since this study commenced, a new generation of very potent compounds highly specific for KCNQ2/3-containing channels have been developed,130,131 and our continuing inquiry will utilize those new molecules.
In summary, the results presented here support M-current augmentation as a promising therapeutic target in reducing acute post-traumatic consequences of TBI. Although RTG administration 30 min post-TBI provided significant protection against brain damage, further studies with a wider time-window and larger cohorts are needed to better elucidate the potential of such pharmacological intervention. We also did not observe a significant difference between male and females. However, more experiments are necessary to completely confirm this.
Supplemental Material
Supplemental material for Prevention of brain damage after traumatic brain injury by pharmacological enhancement of KCNQ (Kv7, “M-type”) K+ currents in neurons
Supplemental Material for Prevention of brain damage after traumatic brain injury by pharmacological enhancement of KCNQ (Kv7, “M-type”) K+ currents in neurons by Fabio A Vigil, Eda Bozdemir, Vladislav Bugay, Sang H Chun, MaryAnn Hobbs, Isamar Sanchez, Shayne D Hastings, Rafael J Veraza, Deborah M Holstein, Shane M Sprague, Chase M Carver, Jose E Cavazos, Robert Brenner, James D Lechleiter and Mark S Shapiro in Journal of Cerebral Blood Flow & Metabolism
Footnotes
Funding
The author(s) disclosed receipt of the following financial support for the research, authorship, and/or publication of this article: This study was supported by DoD CDMRP grants W81XWH-15-1-0284 (M.S.S. and R.B.) and W81XWH-13-1-0284 (J.D.L.), and Morrison Trust Research grants to M.S.S. and R.B. Images were generated in the Core Optical Imaging Facility, supported by UT Health SA, NIH-NCI P30 CA54174 (CTRC at UT Health SA) and NIH-NIA P01AG19316.
Acknowledgements
The authors thank Exing Wang for assistance with confocal microscopy and image analysis, Jimmy Wewer for assistance with us of the IVIS imaging system, and Eric J. Chamberlain for making reagents available to us. They also thank Amy E. Pletz for expert technical assistance and Liliana Espinoza for suggesting RIP-1 as a biomarker.
Declaration of conflicting interests
The author(s) declared no potential conflicts of interest with respect to the research, authorship, and/or publication of this article.
Authors’ contributions
FAV and EB participated in the performance and analysis of all experiments, as well as the writing of this article; they also contributed equally to this work; VB obtained the EEG recordings; JEC participated in the analysis of the EEG recordings; RJV and IS participated in the immunoblotting experiments; SHC participated in GFAP and Iba1 immunohistochemistry, FJB and the IVIS experiments; DMH and SMS participated in the execution of the CCCIs; SDH and CMC participated in the KCNQ2 immunohistochemistry; MH participated in the qRT-PCR experiments; RB, JDL, and MSS designed and supervised all the experiments and in obtaining funding; MSS also participated in the writing of this article.
Supplemental material
Supplemental material for this article is available online.
References
Supplementary Material
Please find the following supplemental material available below.
For Open Access articles published under a Creative Commons License, all supplemental material carries the same license as the article it is associated with.
For non-Open Access articles published, all supplemental material carries a non-exclusive license, and permission requests for re-use of supplemental material or any part of supplemental material shall be sent directly to the copyright owner as specified in the copyright notice associated with the article.