
Abstract
Near-infrared spectroscopy (NIRS) is used to monitor cerebral tissue oxygenation (rSO2) depending on cerebral blood flow (CBF), cerebral blood volume and blood oxygen content. We explored whether NIRS might be a more easy applicable proxy to [15O]H2O positron emission tomography (PET) for detecting CBF changes during hemodialysis. Furthermore, we compared potential determinants of rSO2 and CBF. In 12 patients aged ≥ 65 years, NIRS and PET were performed simultaneously: before (T1), early after start (T2), and at the end of hemodialysis (T3). Between T1 and T3, the relative change in frontal rSO2 (ΔrSO2) was −8 ± 9% (P = 0.001) and −5 ± 11% (P = 0.08), whereas the relative change in frontal gray matter CBF (ΔCBF) was −11 ± 18% (P = 0.009) and −12 ± 16% (P = 0.007) for the left and right hemisphere, respectively. ΔrSO2 and ΔCBF were weakly correlated for the left (ρ 0.31, P = 0.4), and moderately correlated for the right (ρ 0.69, P = 0.03) hemisphere. The Bland-Altman plot suggested underestimation of ΔCBF by NIRS. Divergent associations of pH, pCO2 and arterial oxygen content with rSO2 were found compared to corresponding associations with CBF. In conclusion, NIRS could be a proxy to PET to detect intradialytic CBF changes, although NIRS and PET capture different physiological parameters of the brain.
Introduction
Cognitive impairment is highly common in patients with advanced chronic kidney disease (CKD). 1 Cognitive performance might be negatively affected by structural brain lesions that are often present in the CKD population, including lacunar infarctions, 2 microbleeds, 3 and loss of white matter integrity.4,5 Besides the many risk factors for cognitive decline that are present in patients with CKD, the hemodialysis procedure itself might also induce brain injury. In patients with advanced CKD, the transition to dialysis has been associated with an accelerated decline of cognitive function and an increased incidence of strokes.6,7 Hemodialysis involves repetitive fluid removal, thereby frequently resulting in alterations in blood pressure and volume status, which might induce circulatory stress. 8 The fluid removal during hemodialysis is accompanied by an increase of blood viscosity, and rapid shifts in electrolytes, acid–base balance, and uremic solutes.9,10 Furthermore, exposure of the blood to the extracorporeal circuit during hemodialysis triggers an inflammatory response with complement activation, endothelial activation, and activation of coagulation pathways.11–13 All these processes could theoretically affect the macro- and microvascular cerebral blood flow and cerebral oxygenation.
To unravel potential mechanisms that underlie the link between cognitive impairment and the hemodialysis procedure, we previously evaluated whether hemodialysis has a direct effect on cerebral blood flow (CBF). Using [15O]H2O positron emission tomography (PET), we found that hemodialysis induced a 10% decline in global and regional CBF in elderly hemodialysis patients. 14 This CBF decline does not automatically imply an impaired autoregulation, because the dynamic pressure–flow relationship may also be affected by alterations in cerebrovascular resistance apart from autoregulation, such as changes in pH, hematocrit and blood volume during hemodialysis. Second, we found that as hemodialysis-related factors, a higher pH, higher tympanic temperature, and a larger ultrafiltration rate and volume were associated with a lower CBF. However, [15O]H2O PET-scanning involves radiation, requires an on-site cyclotron for nuclide generation, and is complicated to perform during a hemodialysis session. Therefore, there is a need for an alternative method that is easier to apply to monitor changes in cerebral perfusion during hemodialysis. 15
A technique that has been proposed to monitor the adequacy of cerebral perfusion is non-invasive near-infrared spectroscopy (NIRS) by measuring frontal cerebral tissue oxygenation. 16 During hemodialysis, relative drops of more than 15% in frontal cerebral tissue oxygenation (rSO2) were associated with decreased executive cognitive function one year after the start of hemodialysis. 17 Changes in frontal rSO2 are commonly considered to reflect changes in (frontal) CBF,18,19 but whether an intradialytic decline in frontal rSO2 reflects a simultaneous and similar fall in frontal CBF is unknown.
In this study, we aimed to evaluate whether changes in frontal cerebral oxygenation can identify changes in frontal CBF during hemodialysis. In detail, we investigated (i) the correlation and agreement between intradialytic changes in frontal rSO2 and frontal gray matter CBF, and (ii) how hemodialysis and oxygenation-related factors and markers of inflammation and endothelial activation are associated with changes in rSO2, as compared to CBF.
Materials and methods
Ethics
The study was performed according to the principles of the Declaration of Helsinki and was approved by the Medical Ethical Committee of the University Medical Center Groningen, and registered at clinical trials.gov (NCT02272985). All patients gave written informed consent.
Study design and patient recruitment
The study was performed between March and November 2015 and comprised two objectives: (i) to evaluate the effect of hemodialysis on cerebral perfusion, which was published recently, 14 and (ii) to study the correlation between changes in frontal rSO2 and changes in frontal and global CBF, as measured by [15O]H2O PET-CT.
Hemodialysis patients aged ≥65 years from the department of Nephrology of the University Medical Center Groningen and from the Dialysis Center Groningen with an arteriovenous fistula without significant recirculation were eligible for this study. Patients with a history of dementia, hydrocephalus, cerebrovascular accident, raised intracranial pressure, end-stage liver disease, actively treated cancer, a known significant (>70%) internal carotid artery or major intracranial vessel stenosis, and patients with a contra-indication for MRI were excluded. After study-inclusion, routine Duplex evaluation was performed to exclude subjects with an asymptomatic internal carotid artery stenosis of more than 70% or major intracranial vessel stenosis, because this may interfere with the interpretation of CBF. Patient characteristics were assessed at study entry and retrieved from the patients' medical history. Based on the highly sensitive technique of [15O]H2O and based on former studies that mainly used transcranial Doppler in which the number of hemodialysis patients varied between 12 and 27,20–25 we expected that a total of 14 patients would be sufficient, and aimed to include 14 patients.
Setting
NIRS monitoring and three PET-CT scans were performed simultaneously during a single, regular hemodialysis session after the longest interdialytic interval (Monday or Tuesday). All hemodialysis study sessions were performed in the afternoon in the PET-CT camera room, with a constant ambient room temperature of 20℃, excluding an effect of outside temperature on cardiovascular stability during the study sessions.
First, NIRS monitoring was started. Next, the first PET-CT scan was performed (T1), after which patients started hemodialysis still being in a horizontal position in the PET-CT camera. After the second PET-CT scan (T2), which was performed at a mean of 21 min (range 13–29) after the start of hemodialysis, patients were transferred to a hospital bed adjacent to the PET-CT camera to continue dialysis in a 30–45° supine position. Before the third PET-CT scan (T3), which was performed at the end of the hemodialysis session at mean 209 min (range 168–223 min) after the start of hemodialysis, patients were transferred back to the PET-CT camera. Prior to each PET-CT measurement, patients rested in the supine position for at least 20 min, thereby reducing the influence of postural change on both NIRS and PET measurements.26,27 Blood pressure, heart rate, and tympanic temperature were measured every 30 min and before every PET-CT scan. Blood pressure was measured using an automated blood pressure monitor. Cerebrovascular resistance was calculated as the mean arterial pressure (MAP) divided by the CBF of the frontal gray matter. For the dialysis settings, see Supplemental Material.
NIRS monitoring and analysis
For NIRS monitoring, an In Vivo Optical Spectroscopy device (INVOS™ 5100C Cerebral/Somatic Oximeter|Covidien–Medtronic, Minneapolis, USA) was used, with sensors placed bilaterally on the patient's forehead according to the manufacturer's recommendations. The adhesive optodes were connected to the NIRS device and the sampling rate was 0.2 Hz. For the analysis of rSO2, we excluded values of zero and excluded rSO2 values with a quality score <4, to increase accuracy and exclude movement artifacts. Mean rSO2 values were calculated for the 5-min time periods during which the three [15O]H2O PET-CT scans were performed.
PET and MRI acquisition
For the [15O]H2O PET-CT, a Siemens Biograph 64-mCT (Siemens Medical Systems, Tennessee, USA) was used. After performing a low-dose CT scan for attenuation and scatter correction, the dynamic PET acquisition (310 s) was started, followed after 10 s by an intravenous bolus injection of [15O]H2O. The injected dose of [15O]H2O was 500 MBq per scan, and 1500 MBq per patient for the study in total. Three of the 36 scans could not be analyzed due to a technical problem with the automated sampling system (patient-identity 106 [T1], patient-identity 107 [T2], patient-identity 102 [T3]).
To define regional CBF, we also performed magnetic resonance imaging (MRI) in all patients using a 1.5T whole body system (Aera, Siemens, Erlangen, Germany) on a separate day. The scan protocol included T1-weighted, T2-weighted, three-dimensional fluid-attenuated inversion recovery, diffusion-weighted imaging, susceptibility weighted imaging, and two-dimensional phase contrast sequences. No intravenous contrast was used.
Image reconstruction and processing
Image processing and pharmacokinetic analysis were performed with PMOD 3.8 software (PMOD Technologies Ltd., Zurich, Switzerland). The average image (time-weighted) was used for rigid matching registration of the individual PET to the individual MRI. The PET list-mode data were reconstructed using the 3D OSEM algorithm (3 iterations and 24 subsets), point spread function correction and time-of-flight, and reconstructed to 28 dynamic frames (1 × 10 s, 12 × 5 s, 6 × 10 s, and 9 × 20 s). Data were corrected for attenuation, scatter and radioactivity decay. This resulted in images with a matrix of 400 × 400 × 111 of 2 mm voxels, smoothed with a 2 mm filter at full width at half maximum. The volumes of interest were transformed into the individual space, based on the Hammers atlas and limited to the gray matter tissue in the cortical regions (>30% gray matter probability based on standard probability). 28 After spatial registration, pharmacokinetic modeling was applied to the dynamic PET images to calculate the CBF, based on the implementation of the 1-tissue compartment model developed by Meyer. 29 Delay of the arterial input function and dispersion in the model were first calculated for the whole brain, and then these resulting values were fixed for the volumes of interest. For additional information on PET processing, see the Supplemental Material.
Laboratory measurements
For the laboratory measurements, including hemoglobin, hematocrit, pO2, pCO2, SaO2, and pH, arterial blood was sampled from the arterial dialysis line just before each PET-CT scan. Arterial O2 content (CaO2) was calculated using the following equation:
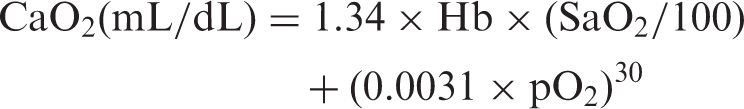
Markers of inflammation included high sensitive C-reactive protein (CRP), and pentraxin-3. Pentraxin-3 responds rapidly to inflammatory stimuli and is considered an appropriate marker for the intradialytic inflammatory response. 31
Markers of endothelial activation included angiopoietin-1, angiopoietin-2, the angiopoietin 2:1 (AP 2:1) ratio, and von Willebrand factor (vWF).32–34
Statistical analyses
First, absolute changes in rSO2, CBF, and clinical and laboratory characteristics were studied using linear mixed models (LMM), which allowed for individual random effects. The likelihood ratio test was used to determine whether the LMM including a random intercept and slope statistically better fitted the data as compared to including a random intercept only.
For the primary study objective, the relative change in rSO2 (ΔrSO2) was compared with the relative change in frontal gray matter CBF (ΔCBF) during hemodialysis. We decided to study the correlation between relative changes instead of absolute changes, because NIRS and PET measure different physiological parameters (oxygenation vs. perfusion) and have different units. Besides, we chose the frontal gray matter CBF instead of the total (gray and white) frontal lobe CBF, because it has been estimated that approximately 85% of rSO2 is derived from more superficial cortical cerebral tissue, thus not including frontal white matter. 18 First, ΔrSO2 and ΔCBF were calculated as the mean of the individual percent change between T1 and T3 using descriptive statistics, reported as mean (%) ± SD. Second, Pearson or Spearman correlation tests, whether appropriate, were used to evaluate the correlation between ΔrSO2 and ΔCBF. Finally, we created a Bland-Altman plot with the difference between ΔCBF and ΔrSO2 as a function of ΔCBF, since PET is considered the reference method.35,36 95% levels of agreement were calculated as the mean of the differences ±1.96*SD. Subsequently, we checked for fixed and proportional bias using a T-test and linear regression model, respectively. In an additional analysis, we tested the correlation and agreement of ΔrSO2 and ΔCBF between T2 (as a second baseline shortly after the start of hemodialysis) and T3, and between T1 and T2. Furthermore, we additionally calculated cerebrovascular resistance (CVR) as MAP/CBF.
For the secondary study objective, associations of hemodialysis and oxygenation-related factors and of markers of inflammation and endothelial activation with rSO2 and frontal gray matter CBF were explored. For this objective, we studied absolute instead of relative rSO2 and CBF values at all time points using LMM, thereby increasing power since this enabled us to use all 33 and 36 measurements of CBF and rSO2, respectively, instead of 10 and 12 measurements of ΔCBF and ΔrSO2, respectively. Furthermore, rSO2 and CBF values of the left and right hemisphere were merged for the analyses, because rSO2 and CBF changes did not differ significantly between the left and the right hemisphere. The hemodialysis-related factors were defined previously based on literature and included MAP, 17 pCO2, 37 pH, 37 tympanic temperature, 38 hematocrit,20–22,39,40 and ultrafiltration (UF) volume and rate.21,22 For this study, we additionally studied the relation of oxygenation-related factors (CaO2 and pO2) and markers of inflammation (CRP and pentraxin-3) and endothelial activation (angiopoietin-1, angiopoietin-2, AP 2:1 ratio and vWF) with both rSO2 and frontal gray matter CBF change. All the hemodialysis and oxygenation-related factors and markers of inflammation and endothelial activation were studied univariately using LMM, checking the significance of interactions with scan-order. We did not perform adjusting for multiple testing, because the hemodialysis and oxygenation-related factors and markers of inflammation and endothelial activation were selected beforehand.
In supplementary analyses, we repeated the main analyses after excluding one outlier. Second, we tested the correlation between the absolute rSO2 and CBF values at all time points. Third, we tested the correlation of Δmean frontal-rSO2 (mean of left and right rSO2) with Δglobal-CBF (from a volume of interest covering the whole brain).
Two-sided P < 0.05 was considered statistically significant. Statistical analyses were performed with SPSS, version 23 (SPSS Inc, IBM company, USA), Stata/Se 14.2 (StataCorp LLC, USA), and GraphPad Prism version 5.0 (GraphPad Software, USA).
Results
Patient enrolment and characteristics
Patient characteristics (N = 12).
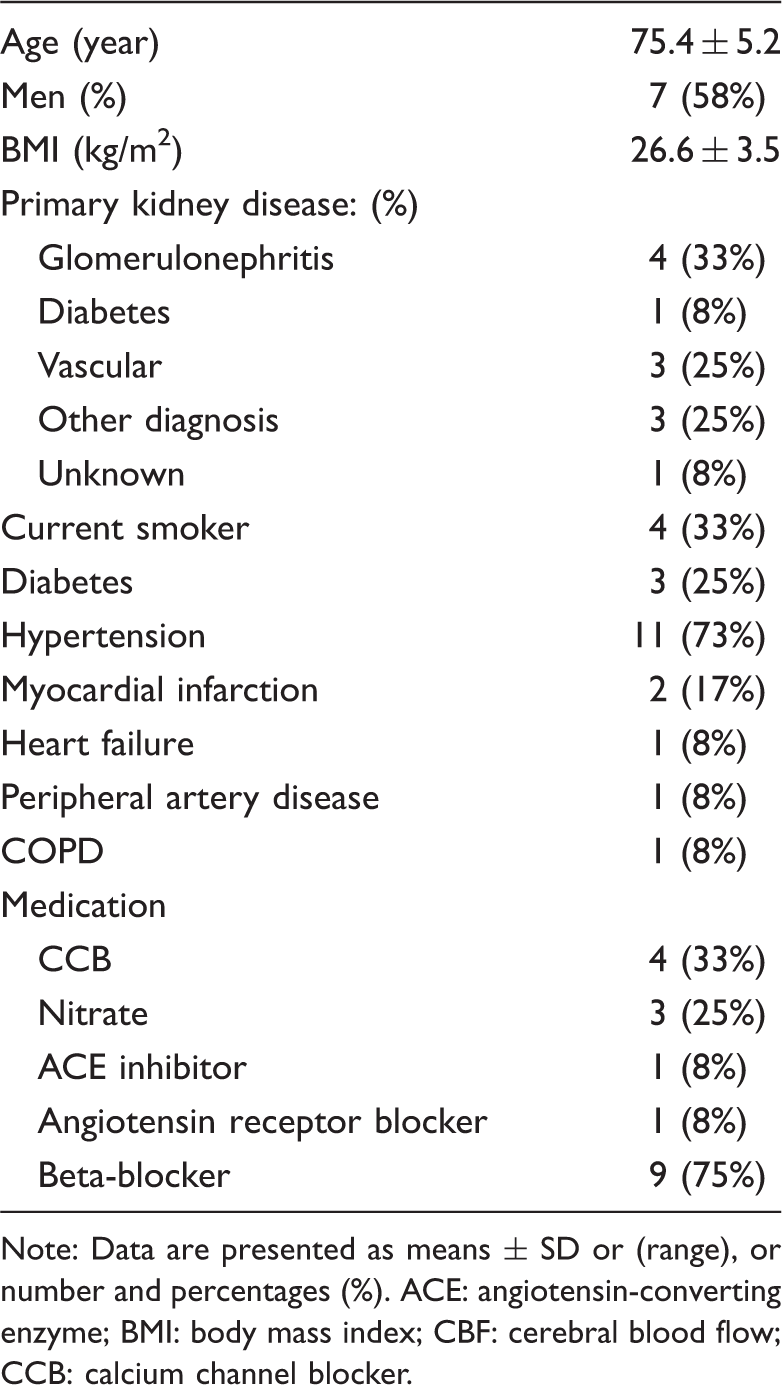
Note: Data are presented as means
Intradialytic NIRS-rSO2 and frontal gray matter PET-CBF changes
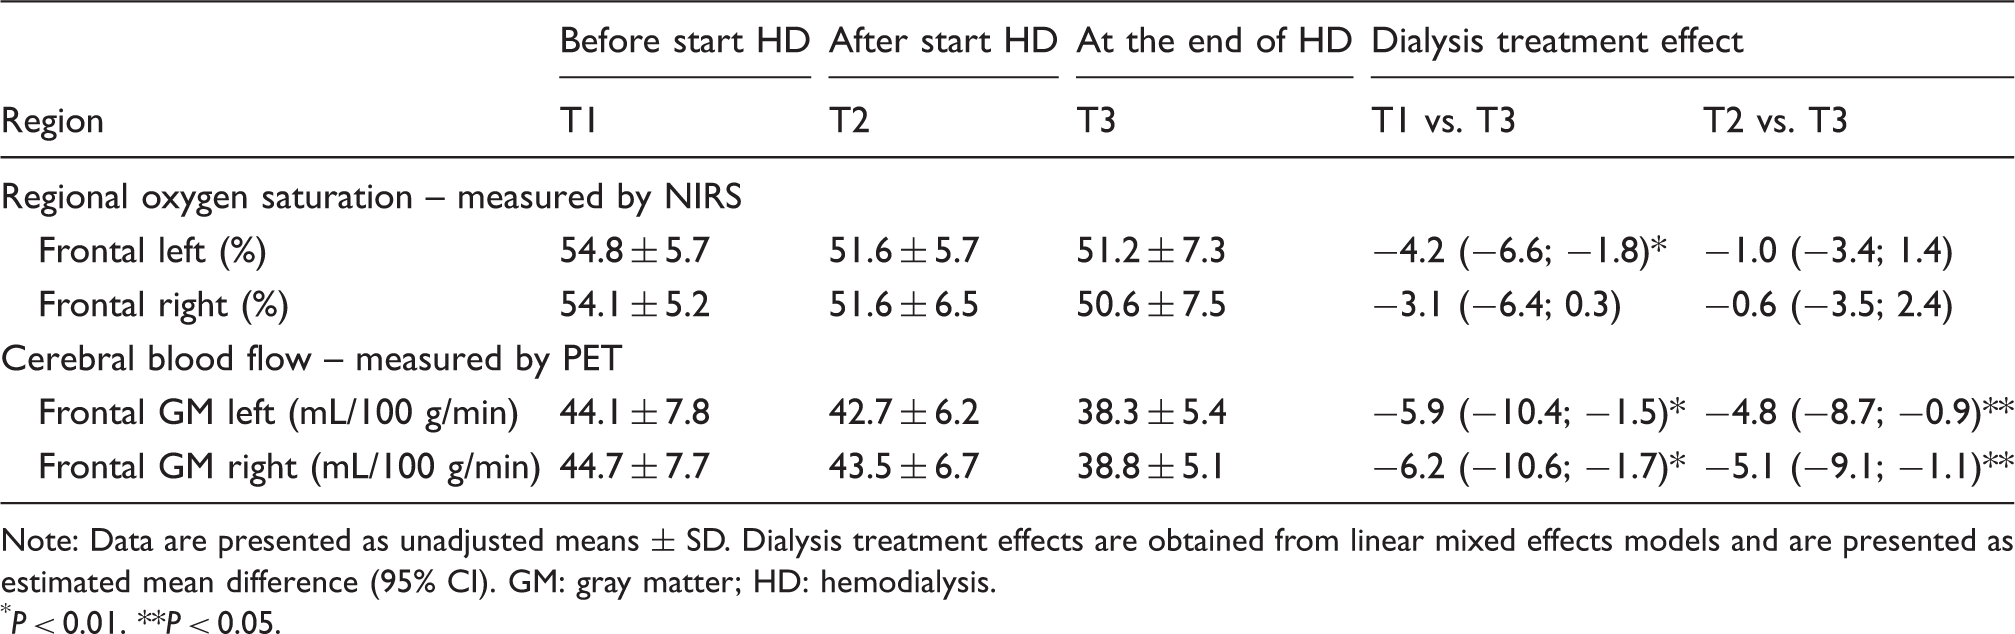
Raw individual rSO2 levels during hemodialysis are shown in Figure 1 for the left and right hemisphere. Using LMM, left rSO2 declined from 54.8 ± 5.7% to 51.2 ± 7.3% (absolute difference −4.2% [95% CI, −6.6; −1.8]; P = 0.001), whereas right rSO2 declined from 54.1 ± 5.2% before hemodialysis (T1) to 50.6 ± 7.5% (absolute difference −3.1% [95% CI, −6.4; 0.3]; P = 0.08) at the end of hemodialysis (T3) (Table 2). Frontal gray matter CBF declined from 44.1 ± 7.8 mL/100g/min at T1 to 38.3 ± 5.4 mL/100g/min at T3 (absolute difference −5.9 mL/100g/min [95% CI, −10.4; −1.5]; P = 0.009) in the left hemisphere, and from 44.7 ± 7.7 mL/100g/min at T1 to 38.8 ± 5.1 mL/100g/min at T3 (absolute difference −6.2 mL/100g/min [95% CI, −10.6; −1.7]; P = 0.007) in the right hemisphere (Table 2).
Individual rSO2 trajectories during hemodialysis of the left (a) and right (b) hemisphere. NIRS/PET measurement 1 was performed at a mean of 18 min (range 15–31 min) before the start of hemodialysis. Hemodialysis is regarded as baseline (t = 0). Measurements 2 and 3 were performed at a mean of 21 min (range 13–29 min) and 209 min (range 168–223 min) after the start of hemodialysis, respectively. Each line represents one patient. Intradialytic changes in NIRS-rSO2 and in PET-CBF. Note: Data are presented as unadjusted means P < 0.01. P < 0.05.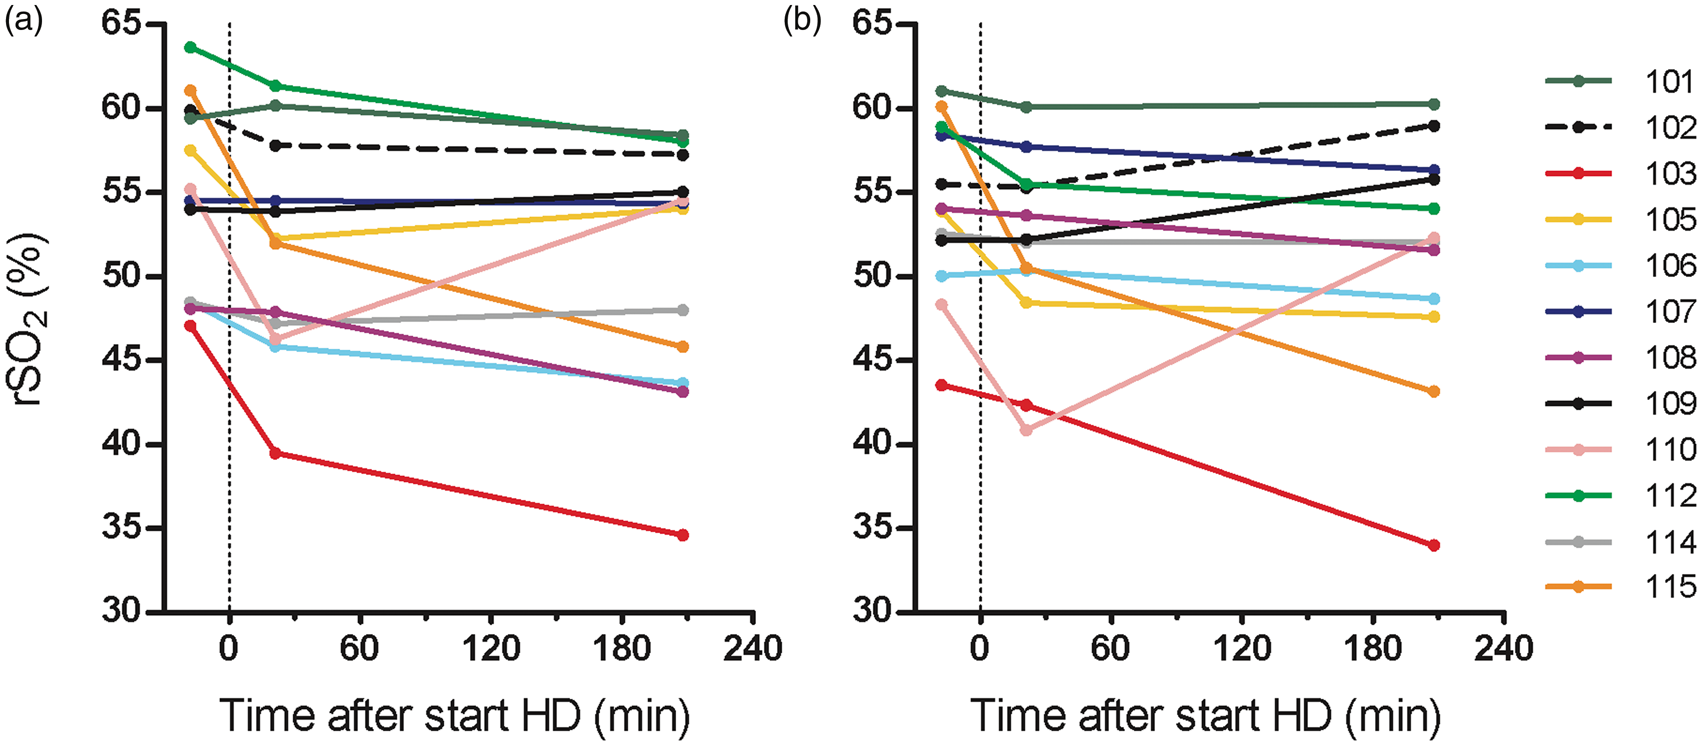
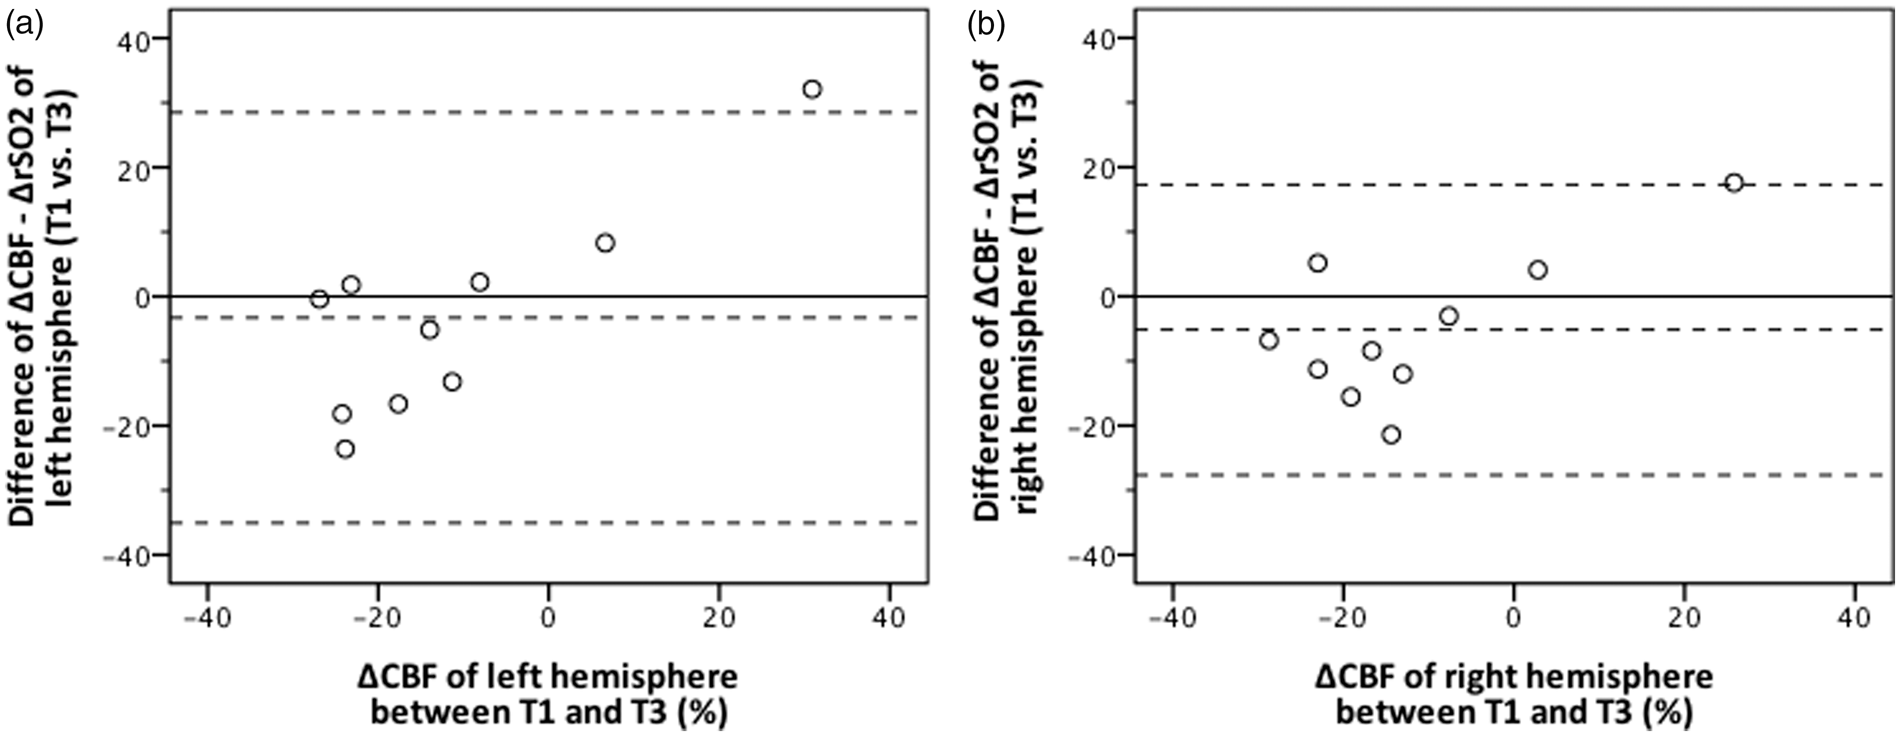
The relative change in rSO2 between T1 and T3 (ΔrSO2) was mean −8 ± 9% for the left hemisphere and −5 ± 11% for the right hemisphere, respectively. The relative change in frontal gray matter CBF between T1 and T3 (ΔCBF) was −11 ± 18% for the left hemisphere and −12 ± 16% for the right hemisphere, respectively. The individual relative changes in ΔMAP, ΔCBF, ΔrSO2 and ΔCVR per patient between T1 and T3 are shown in Table S1. ΔrSO2 and ΔCBF were moderately correlated for the right hemisphere (ρ 0.69, P = 0.03), but weakly correlated for the left hemisphere (ρ 0.31, P = 0.4) (Figure 2). The Bland–Altman plot showed moderate agreement (Figure 3). The overall bias was −3 ± 16% (P = 0.5) for the left and −5 ± 12% (P = 0.2) for the right hemisphere (Figure 3). Furthermore, linear regression suggested a proportional bias, indicating underestimation of ΔCBF by NIRS with larger CBF increases or decreases.
Correlation between ΔrSO2 and Δ frontal gray matter cerebral blood flow of the left and right hemisphere. Scatter plots of Δ cerebral blood flow (X-axis) and Δ regional oxygen saturation (Y-axis) calculated between T3 and T1, displayed per left (a) and right (b) hemisphere. Correlation coefficient for the left hemisphere: ρ 0.31 (P = 0.4), and the right hemisphere: ρ 0.69 (P = 0.03). Bland–Altman plot of percentage changes in rSO2 (ΔrSO2) and in CBF (ΔCBF) between T1 (before hemodialysis) and T3 (at the end of hemodialysis), displayed for the left (a) and right (b) hemisphere. The X-axis represents ΔCBF (%), while the Y-axis represents the difference between ΔCBF and ΔrSO2. The central solid line represents zero bias. The central dashed line indicates overall bias, which is −3% for the left, and −5% for the right hemisphere, calculated as the mean of the differences, while the lower and upper dashed lines represent limits of agreement: −35% and 29% for the left, and −28% and 17% for the right hemisphere, respectively. Linear regression suggested the presence of proportional bias (left hemisphere: P = 0.003, regression equation: Y = 5.1 + 0.8x; right hemisphere: P = 0.03, regression equation: Y = 0.6 + 0.5x, but after removal of one outlier this effect was not significant).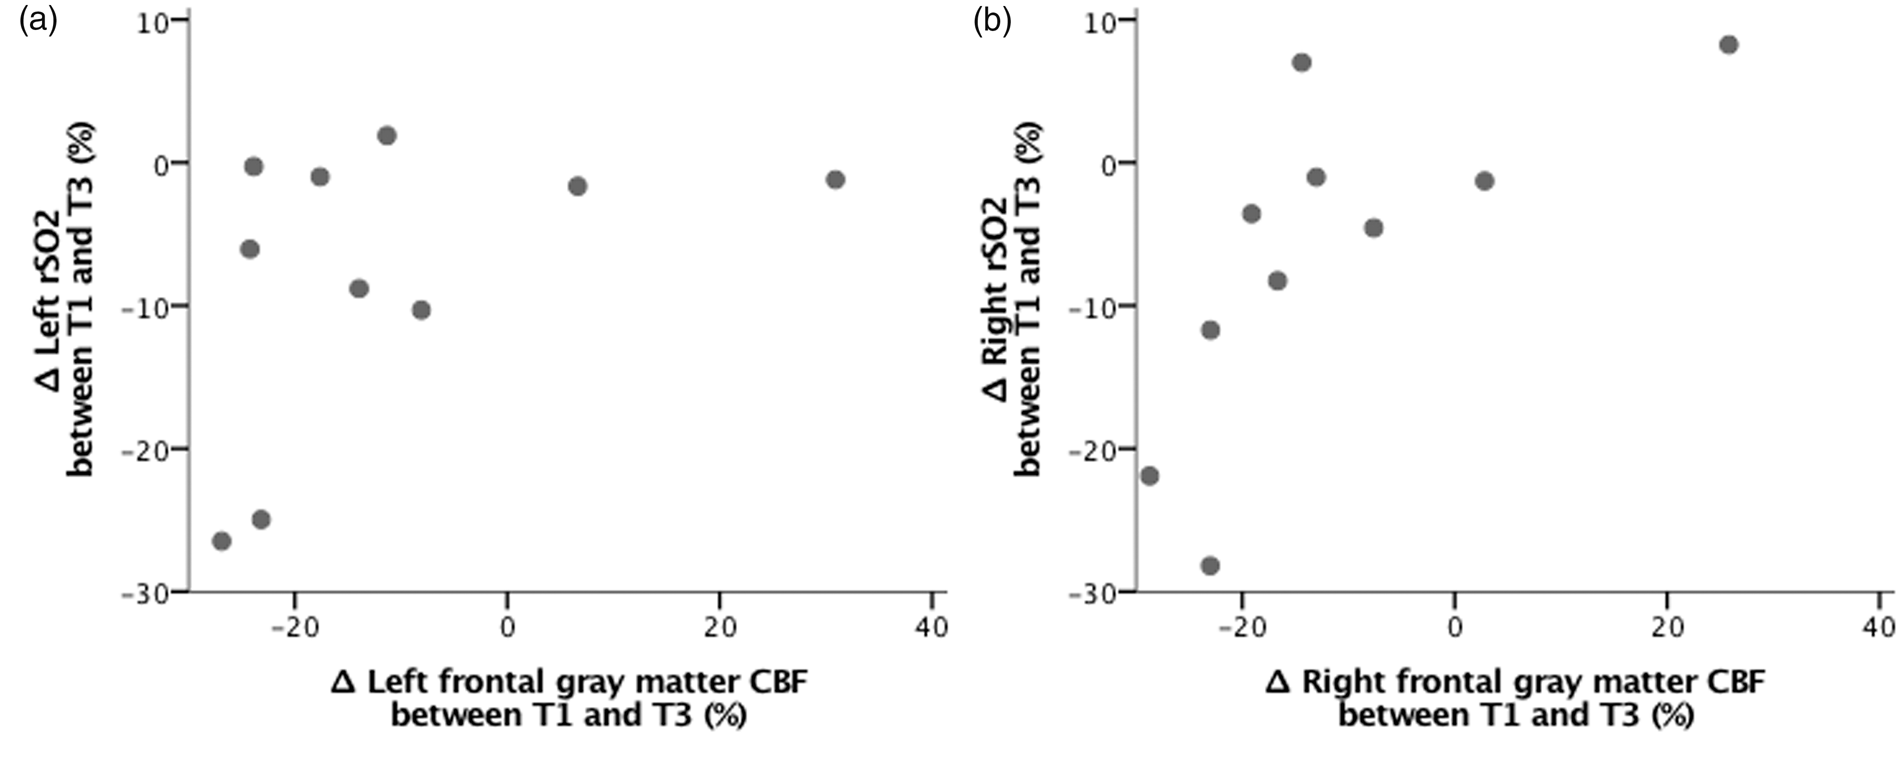
One patient showed a large increase in CBF (patient-id 110) and could be regarded as an outlier, although it is unknown whether a 30–40% increase in CBF is physiologically implausible during hemodialysis. After removal of this outlier, the correlation coefficients were almost similar (correlation ΔrSO2 and ΔCBF left hemisphere: ρ 0.30 (P = 0.4), and right hemisphere: ρ 0.64 (P = 0.06). However, removal of this outlier changed the Bland–Altman analysis yielding an (almost) significant fixed bias now, instead of a proportional bias (left hemisphere: fixed bias −7% (P = 0.09), lower and upper limits of agreement −29% and 14%; right hemisphere: fixed bias −8% (P = 0.03), lower and upper limits of agreement −25% and 9%).
Additionally, we studied ΔrSO2 and ΔCBF between T2 and T3, and between T1 and T2. Between T2 and T3, the correlation between ΔrSO2 and ΔCBF was moderate for the left (ρ 0.64, P = 0.048) and strong for the right hemisphere (ρ 0.76, P = 0.01) (Figure S1). The agreement plot was almost similar as for T1 vs. T3, and linear regression again suggested proportional bias (Figure S2). Between T1 and T2, ΔrSO2 and ΔCBF did not correlate for both hemispheres (Figure S3), and the agreement plot again suggested proportional bias (Figure S4).
Supplementary analyses showed no significant correlation between ΔMAP and ΔrSO2 (Figure S5), or between ΔMAP and ΔCBF (Figure S6). Second, using LMM, CVR did not change significantly during hemodialysis, and no significant correlation between ΔCVR and ΔrSO2 was found (Figure S7). Third, no significant correlation between the absolute rSO2 and absolute CBF values at any time point was found (Figure S8). Finally, defined as T1 versus T3, Δmean-frontal rSO2 (mean of left and right ΔrSO2) and Δglobal-CBF (the whole brain as region of interest) were non-significantly correlated (ρ 0.51, P = 0.1). Defined as T2 versus T3, Δmean-frontal rSO2 and Δglobal-CBF showed a strong correlation (ρ 0.72, P = 0.02).
Associations of hemodialysis-related factors with NIRS-rSO2 and frontal gray matter PET-CBF
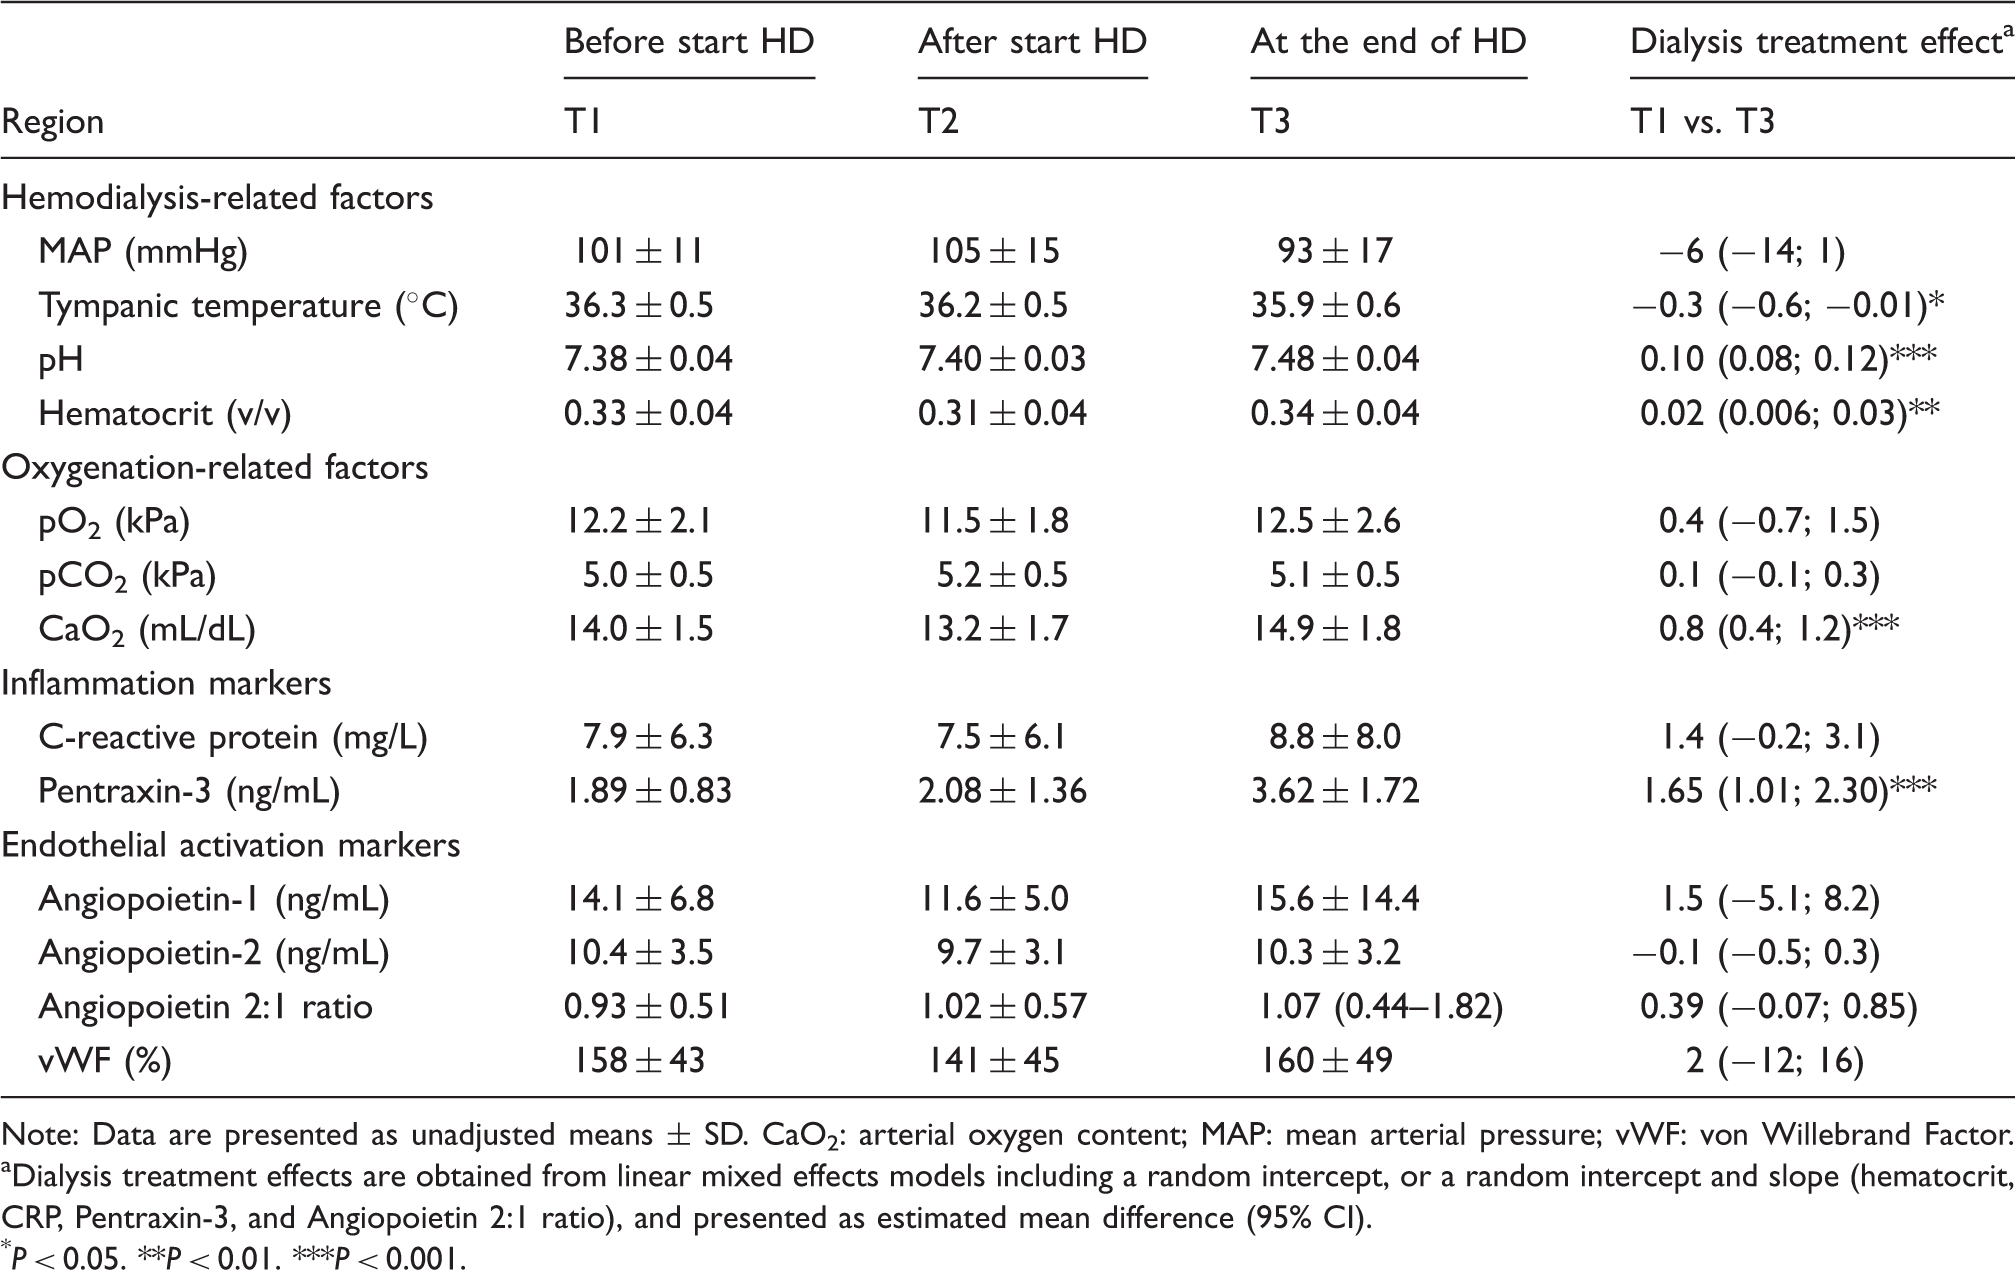
Intradialytic changes in hemodialysis and oxygenation-related factors, and in inflammation and endothelial activation markers.
Note: Data are presented as unadjusted means
Dialysis treatment effects are obtained from linear mixed effects models including a random intercept, or a random intercept and slope (hematocrit, CRP, Pentraxin-3, and Angiopoietin 2:1 ratio), and presented as estimated mean difference (95% CI).
P < 0.05.
P < 0.01.
P < 0.001.
Associations of hemodialysis and oxygenation-related factors, and of inflammation and endothelial activation markers with NIRS-rSO2 (left panel), and frontal gray matter PET-CBF (right panel).
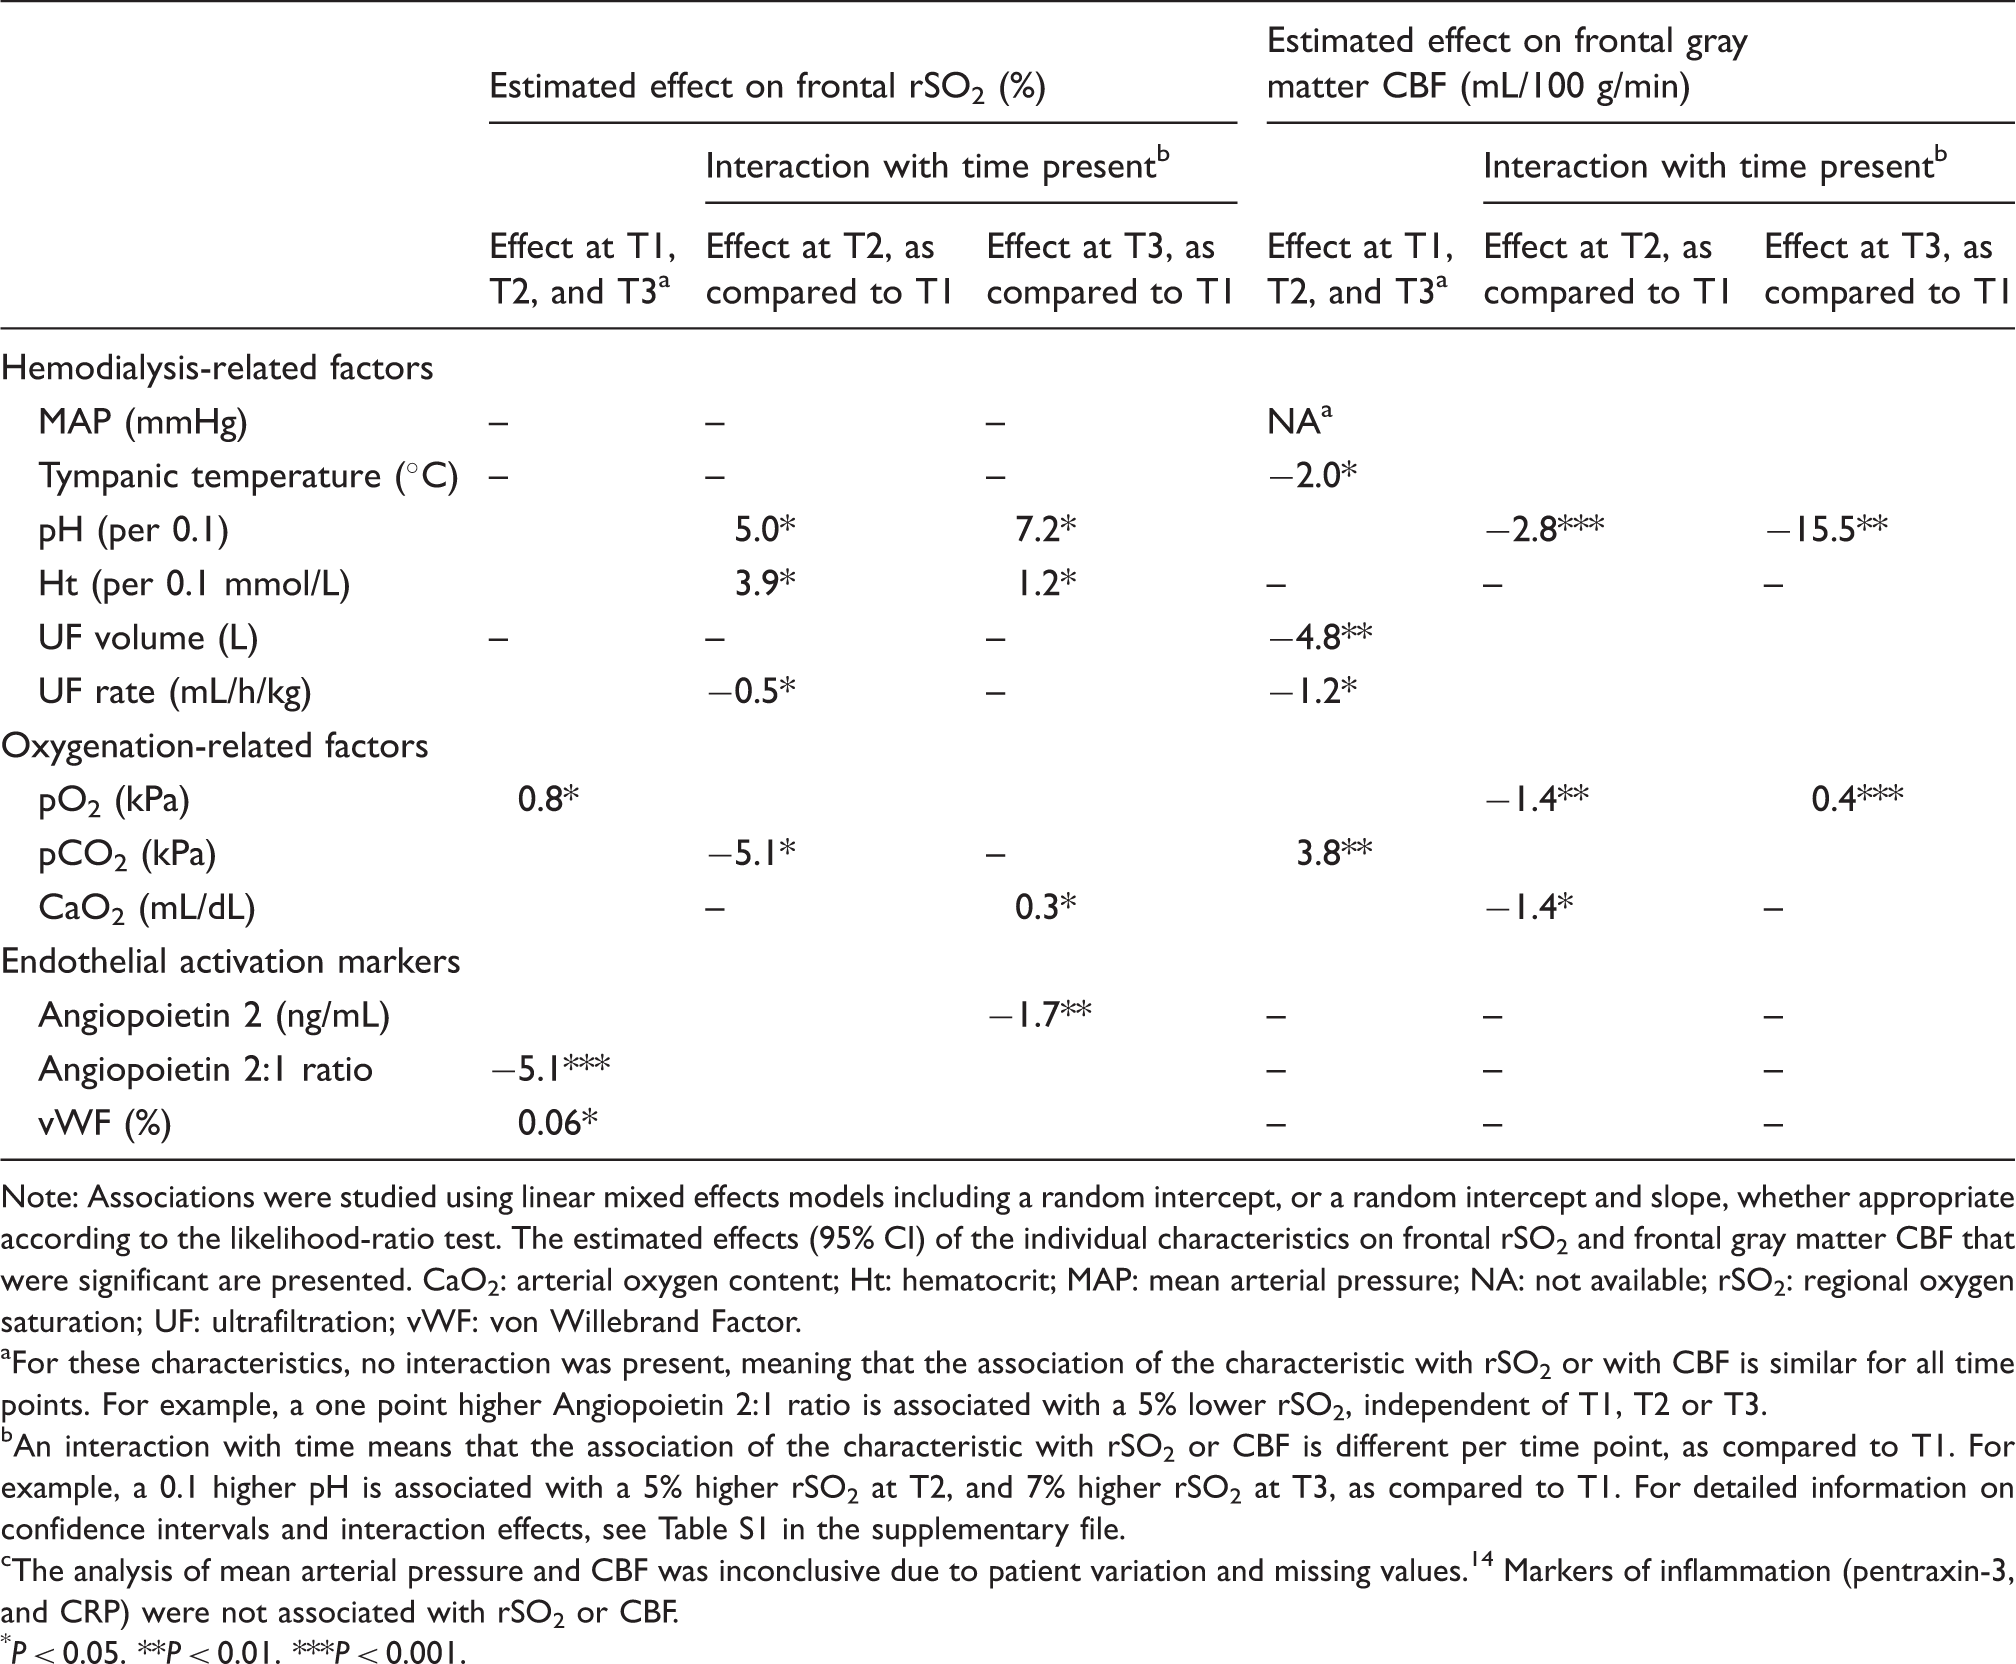
Note: Associations were studied using linear mixed effects models including a random intercept, or a random intercept and slope, whether appropriate according to the likelihood-ratio test. The estimated effects (95% CI) of the individual characteristics on frontal rSO2 and frontal gray matter CBF that were significant are presented. CaO2: arterial oxygen content; Ht: hematocrit; MAP: mean arterial pressure; NA: not available; rSO2: regional oxygen saturation; UF: ultrafiltration; vWF: von Willebrand Factor.
For these characteristics, no interaction was present, meaning that the association of the characteristic with rSO2 or with CBF is similar for all time points. For example, a one point higher Angiopoietin 2:1 ratio is associated with a 5% lower rSO2, independent of T1, T2 or T3.
An interaction with time means that the association of the characteristic with rSO2 or CBF is different per time point, as compared to T1. For example, a 0.1 higher pH is associated with a 5% higher rSO2 at T2, and 7% higher rSO2 at T3, as compared to T1. For detailed information on confidence intervals and interaction effects, see Table S1 in the supplementary file.
The analysis of mean arterial pressure and CBF was inconclusive due to patient variation and missing values.14 Markers of inflammation (pentraxin-3, and CRP) were not associated with rSO2 or CBF.
P < 0.05.
P < 0.01.
P < 0.001.
Associations of oxygenation-related factors, and markers of inflammation and endothelial activation with NIRS-rSO2 and frontal gray matter PET-CBF
CaO2 and pentraxin-3 increased significantly during hemodialysis. Intradialytic pCO2, pO2, CRP, and the endothelial activation markers did not change significantly (Table 3).
Of the oxygenation-related markers, a higher pCO2 was significantly associated with a lower rSO2 at T2, as compared to T1. Conversely, a higher pCO2 was significantly associated with a higher CBF (Table 4). Higher pO2 was significantly associated with higher rSO2, whereas the association between pO2 and CBF yielded different effects over time (Table 4). CaO2 was positively associated with rSO2 whereas it was negatively associated with CBF. The inflammation markers were not associated with rSO2 or CBF. Of the endothelial activation markers, a higher angiopoietin-2 and AP 2:1 ratio was associated with a lower rSO2, and a higher vWF was associated with a higher rSO2. None of the endothelial activation makers had an association with CBF.
Adverse event
One patient (identity 115) lost consciousness due to dialysis-induced hypotension shortly after the third NIRS/PET measurement. The mean decline in CBF of left and right frontal gray matter was 23% (both hemispheres −23%) and the mean frontal rSO2 decline was 27% (left −25%; right −28%). The patient made a full recovery without sequelae.
Discussion
In this study, we found a moderate correlation between frontal ΔrSO2 as measured with NIRS and ΔCBF of the frontal gray matter as measured with [15O]H2O PET during hemodialysis. The agreement analysis showed moderate agreement and a trend towards predominantly a fixed bias with underestimation of ΔCBF by NIRS. Thus, NIRS could be a proxy for PET to capture intradialytic CBF changes, but some correction factor may be needed to correct for the underestimation of ΔCBF by NIRS. Furthermore, considerable differences were noted with regard to associations of hemodialysis- and oxygenation-related factors and markers of endothelial activation with rSO2 as compared to CBF. This underscores that rSO2 and CBF represent different physiological parameters of the brain.
Few studies have simultaneously performed cerebral oximetry and PET scanning. One study evaluated the change in cerebral blood volume (ΔCBV) as measured by NIRS, with ΔCBV as measured by PET, during normoventilation and during pCO2 manipulation procedures. 41 They reported a moderate correlation (ρ = 0.56) between ΔCBV-NIRS and ΔCBV-PET, and an underestimation of ΔCBV by NIRS. Villringer et al. compared changes in rSO2 by NIRS with simultaneous changes in PET-CBF during rest and during cognitive activation tasks. They found a strong correlation (ρ = 0.88) between Δtotal-Hb (i.e. the sum of Δoxy-Hb and Δdeoxy-Hb) and ΔCBF, if a penetration depth of near-infrared light of 0.9 cm into the brain cortex was assumed. 42 Another study from the same group showed strong correlations of Δoxy-Hb (ρ range: 0.74–0.75), Δdeoxy-Hb (ρ range: −0.64 to −0.69), and Δtotal-Hb (ρ range: 0.88–0.93) with ΔCBF, when assuming various penetration depths ≤1.35 cm of near-infrared light. 43 Several differences limit the comparison of their findings to ours. First, Villringer et al. compared NIRS to frontal CBF of a small semisphere, a so-called “banana-shaped” region behind the NIRS optode. In contrary, we studied the correlation of NIRS with CBF of the total frontal gray matter. Second, Villringer et al. did not describe the correlation between ΔrSO2 (i.e. Δoxy-Hb/Δdeoxy-Hb) and ΔCBF. Besides, neither the studies from this group nor other studies investigated patients with CKD or encompassed the hemodialysis process.
The hemodialysis process is a unique physiological stimulus involving many simultaneous hemodynamic and metabolic changes, 44 e.g. a change in pH due to bicarbonate infusion that is not necessarily accompanied by simultaneous changes in pCO2 or pO2. Previous studies reported either no change in rSO2 during hemodialysis,45,46 or an rSO2 decline only during the first 35 min of hemodialysis, with a subsequent increase in rSO2 yielding a net non-significant change at the end of hemodialysis. 47 Our study is new insofar that we simultaneously studied intradialytic changes in rSO2 by NIRS and changes in CBF by PET.
There is increasing interest in the utilization of NIRS to monitor adequacy of brain perfusion non-invasively. The underlying assumption is that changes in rSO2 reflect changes in CBF, which is theoretically correct if cerebral metabolism, CBV, and additionally CaO2, blood transit time, and oxygen extraction fraction (OEF) remain constant. 48 However, to our knowledge, it is unknown whether this is true during the hemodialysis procedure. First, absolute systemic blood volume was reported to decline by 17% during hemodialysis, 49 but it is unknown whether CBV also declines. Second, during hemodialysis 10% of the patients of a hemodialysis cohort experienced prolonged hypoxia (arterial oxygen saturation < 90% at least one-third of the treatment time). 50 Third, apart from an intradialytic effect, it was reported that cerebral oxygen metabolism, 51 blood transit time, 52 and oxygen extraction, 51 were altered in hemodialysis patients compared to controls. Nevertheless, since our primary study aim was to evaluate the correlation between ΔrSO2 and ΔCBF, we are not able to draw any conclusion on the other parameters such as CBV, OEF, or blood transit time.
The underestimation of CBF changes by NIRS seems to be related to predominantly a fixed bias, since with removal of an outlier no proportional bias was present anymore. The underestimation of ΔCBF by NIRS could be the result of scattering effects of extracerebral tissue on the transmission of light. Computer modeling showed that in a typical tissue volume interrogated by NIRS, approximately 30% was brain and 70% was extracerebral tissue. 53
Remarkably, we noted an absent correlation between ΔrSO2 and ΔCBF, defined as T1 versus T2 including the first 30 min of hemodialysis. Previous studies reported that PaO2 initially declined during the first 60 min of hemodialysis treatment.50,54 We speculate that early intradialytic changes in PaO2 influenced ΔrSO2 rather than ΔCBF between T1 and T2 thereby limiting the correlation. Of note, the divergent association of PaO2 with rSO2 as compared to CBF seems to underscore this hypothesis.
Another remarkable finding was the left–right asymmetry in the correlation and Bland–Altman analyses. Because removal of one outlier did not change this asymmetry, we consider this asymmetry a change finding.
We found that on average CVR did not change significantly during hemodialysis. This constant CVR could suggest that static autoregulation might have been disturbed. However, we cannot draw any definite conclusions, since this was not an autoregulation study and many factors change simultaneously during hemodialysis (e.g. pH, hematocrit), which might directly affect CVR.
Four patients experienced an rSO2 drop of > 20% during hemodialysis. A 20% rSO2 decline has been proposed as predictor of cerebral ischemia in patients during carotid endarterectomy and cardiac surgery.55,56 A > 15% drop in rSO2 during hemodialysis was shown to correlate with executive function decline at one-year follow-up. 17 Therefore, although NIRS tended to underestimate PET-CBF, in our opinion NIRS is still a promising technique to monitor declines in cerebral oxygenation during hemodialysis. Intradialytic changes in cerebral oxygenation might yield important information on intradialytic brain homeostasis, apart from intradialytic changes in cerebral perfusion. More studies are needed to explore whether large intradialytic rSO2 drops are associated with incident cerebral ischemic injury and decline of cognitive function during follow-up.
The second aim of this study was to explore associations of several clinical and laboratory parameters with rSO2 as compared to CBF. No association of MAP with rSO2 was found, similar to previous studies.45,46 Remarkably, pH was positively associated with rSO2 and negatively with CBF. The positive association of pH with rSO2 might be explained by a leftward shift of the oxygen–hemoglobin dissociation curve due to the increase in pH during dialysis, thereby theoretically increasing rSO2. However, others have reported a negative association of pH with rSO2 in dialysis patients. 57 Further examination is required on the effects of pH on CBF and rSO2 during hemodialysis, especially because the intradialytic change in pH is a modifiable factor by lowering the bicarbonate concentration in the dialysate.
To our knowledge, potential associations of inflammation and endothelial activation markers with cerebral tissue oxygenation have not been reported previously. We found an association between endothelial activation markers and rSO2, since a higher angiopoietin-2 and angiopoietin 2:1 ratio was associated with lower rSO2. Angiopoietin-1 stabilizes the endothelium, whereas angiopoietin-2 functions as a vessel-destabilizing molecule. 58 A higher angiopoietin 2:1 ratio seems to represent loss of endothelial barrier integrity, 59 and might be an early marker of endothelial activation and dysfunction.60,61 A possible explanation for the association between angiopoietin-2, and the angiopoietin 2:1 ratio with rSO2 might be found in the lungs. Recently, angiopoietin-2, which is stored in pulmonary epithelial cells, was suggested to have effects on gas exchange. 62 Nevertheless, the relation between angiopoietin-2 and the angiopoietin 2:1 ratio and rSO2 needs further examination, and is beyond the scope of this study.
There are a number of potential weaknesses to this study. The sample size of this study was small and one outlier had a relative large influence in the analyses. Furthermore, the findings on our second study aim, i.e. associations of hemodialysis and oxygenation-related factors, and inflammation and endothelial activation markers with rSO2 and CBF, should be purely considered as hypothesis generating. Larger studies are needed to evaluate the effect size of various factors and markers dynamically by multivariate analysis, especially because various hemodynamic, metabolic, and laboratory characteristics change simultaneously during hemodialysis. Second, NIRS and CBF measurements were performed in a supine position, whereas in general patients are in a semi-upright sitting position during hemodialysis. A semi-upright sitting position might have changed the rSO2 and CBF values but should not alter the correlation between both. Third, for a future study the use of a NIRS device that provides oxyHb, deoxyHb and total Hb levels is advised, because oxyHb better relates to arterial inflow than rSO2, which is a mix of arterial and venous circulation. Besides, such study might also provide more information on transit time (changes) during hemodialysis, which we were not able to take into account.
In conclusion, NIRS could be used as a proxy to PET to detect intradialytic CBF changes, but a correction factor may be needed to correct for the underestimation of CBF changes by NIRS. The different associations of hemodialysis- and oxygenation-related factors and markers of endothelial activation with rSO2 as compared to CBF underscore that NIRS and PET capture different physiological parameters of the brain.
Supplemental Material
Supplemental material for Changes in cerebral oxygenation and cerebral blood flow during hemodialysis – A simultaneous near-infrared spectroscopy and positron emission tomography study
Supplemental Material for Changes in cerebral oxygenation and cerebral blood flow during hemodialysis – A simultaneous near-infrared spectroscopy and positron emission tomography study by Harmke A Polinder-Bos, Jan Willem J Elting, Marcel JH Aries, David Vállez García, Antoon TM Willemsen, Peter J van Laar, Johanna Kuipers, Wim P Krijnen, Riemer HJA Slart, Gert Luurtsema, Ralf Westerhuis, Ron T Gansevoort, Carlo AJM Gaillard and Casper FM Franssen in Journal of Cerebral Blood Flow & Metabolism
Footnotes
Acknowledgements
We want to thank the positron emission tomography technicians Yvonne van der Knaap, Eelco Severs, Paul van Snick, Johan Wiegers, and Aafke Zeilstra of the Medical Imaging Center, Department of Nuclear Medicine and Molecular Imaging at University Medical Center Groningen, The Netherlands for their technical support during the study sessions. Furthermore, we want to thank medical students Brandt Dijksterhuis, Thom Eshuis, Rozemarijn Ettema, Marleen Huberts, and Renske Wiersema for their help with the study sessions.
Authors' contribution
HAPB, JWJE, MJHA, DVG, ATMW, PJL, JK, WPK, RHJAS, GL, RW, RTG, CAJMG and CFMF made a substantial contribution to the concept and design, acquisition of data or analysis, and interpretation of data; HAPB drafted the article and HAPB, JWJE, MJHA, DVG, ATMW, PJL, JK, WPK, RHJAS, GL, RW, RTG, CAJMG, and CFMF revised it critically for important intellectual content; HAPB, JWJE, MJHA, DVG, ATMW, PJL, JK, WPK, RHJAS, GL, RW, RTG, CAJMG, and CFMF approved the final version of the manuscript.
Funding
The author(s) disclosed receipt of the following financial support for the research, authorship, and/or publication of this article: This study was financed by a grant from the Healthy Aging Pilot Fund of the University Medical Center Groningen, The Netherlands (grant no. 2014-1/193).
Declaration of conflicting interests
The author(s) declared no potential conflicts of interest with respect to the research, authorship, and/or publication of this article.
References
Supplementary Material
Please find the following supplemental material available below.
For Open Access articles published under a Creative Commons License, all supplemental material carries the same license as the article it is associated with.
For non-Open Access articles published, all supplemental material carries a non-exclusive license, and permission requests for re-use of supplemental material or any part of supplemental material shall be sent directly to the copyright owner as specified in the copyright notice associated with the article.