
Abstract
Parameter-free assessment of the time-to-peak (TTP) histogram, termed ‘TTP-distribution curve’ (TDC), of dynamic susceptibility contrast-enhanced magnetic resonance imaging (DSC-MRI) was introduced as a robust method to evaluate cerebral perfusion. TDC-assessment works fully automatically without the need of an arterial input function, thereby providing full comparability between different measurements. In the investigated sample of 106 patients, a strong dependency of TDC on the hemodynamic state of cerebral microvessels and the arterio-venous bolus-transit time
Keywords
Introduction
Recently, the analysis of the time-to-peak (TTP) histogram of dynamic susceptibility contrast-enhanced magnetic resonance imaging (DSC-MRI), termed as ‘TTP-distribution curve’ (TDC), was reported to detect hemodynamically meaningful variances of the individual cerebral bolus transit time.
1
Most of the routinely used DSC-MRI-derived hemodynamic parameters, e.g. mean transit time, TTP, relative TTP, standardised TTP and Tmax, depend on the cerebral bolus transit time, which is a quantity of the mean arterio-venous transit time.2,3 In comparison to these parameters, it seems noteworthy that for TDC-based evaluations, no specific assumptions have been used except few basic physiological facts, i.e. that the blood is entering the brain from the arterial side, passing the parenchyma, and leaving via the venous branches. Investigations of the TDC revealed considerable variations of the individual cerebral bolus transit time even in control patients, which are not yet fully understood. According to a previous report, most of the encountered variability of the cerebral hemodynamics seems to relate to alterations in cerebral microvessels, namely arterioles, capillaries and venules.
1
As TDC appeared quite sensitive to hemodynamic alterations triggered within these vessel segments, this could lead to a novel approach to investigate the state of cerebral small vessels on the one hand, and to correct DSC-derived perfusion parameters for degenerative vascular adaptions of the arterio-venous transit time on the other hand. Therefore, we specifically investigated the relation between TDC-derived parameters (i.e. bolus transit time
Materials and methods
Patients
A random sample of 106 patients with DSC-MRI examinations of sufficient image quality showing various degrees of WMHs was drawn from our institutional database (n = app. 6862 DSC-MRI examinations). 5 Only patients with various degrees of leukoaraiosis and/or lacunar infarctions < 20 mm were eligible, while subjects presenting with circumscribed acute or chronic lesions, such as tumor, hemorrhage, thromboembolic infarcts (non-subcortical, > 20 mm), vascular malformations, inflammations, etc. were excluded. Although within the spectrum of cSVD, patients depicting signs of small lobar hemorrhages were also excluded from further analysis in order to reduce the overlap with cerebral amyloid angiopathy. Subjects suspected to suffer rare hereditary forms of cSVD (e.g. CADASIL, COL4A1-mutations) as well as patients with known chronic heart failure according to New York Heart Association (NYHA) class IV were also not included in the study. Written informed consent was obtained from all patients. The study was approved by the Lower Austrian Ethics Commission (GS4-EK-4/220-2013). All patients and data were handled following the WMA-recommendations of ethical principles for medical research involving human subjects. 6
Magnetic resonance imaging and assessment environment
All examinations were performed on a clinical 1.5T MR-scanner (Avanto, Siemens Medical Systems, Erlangen, Germany) according to our standard perfusion-MRI protocol, which consisted of DSC-MRI, diffusion weighted MRI (dual-b SE-EPI: b1 = 0 s/mm2; b2 = 1000 s/mm2), MR-angiography and conventional MRI including enhanced proton density (PD)/T2w-IR-imaging.
7
Specifically, DSC-MRI was performed using a short-TR dynamic contrast-enhanced
Assessment of T2-weighted white matter hyperintensities
WMH-volumes were assessed using in-house developed R-scripts together with SPM12 segmentation routines. The first echo images of the enhanced PD/T2w-IR-sequence served to obtain masks for grey and white matter, which defined all voxels considered to belong to brain parenchyma. An automatically generated contrast threshold defined as: median + 2 × MAD (median absolute deviation) was derived from this parenchyma-voxel fraction using the signal intensities from the second echo images of the enhanced PD/T2w-IR-sequence. The latter images were also used to segment the WMHs. The second echo of this sequence is equivalent to extended fluid attenuated inversion recovery imaging. From this segmentation, an estimate of the absolute WMH volume was computed and subsequently normalised to the sample mean total brain volume (TBV) to avoid bias from differing absolute brain volumes. Attempting to separate presumably ‘age-related’ micro-vascular degeneration from advanced cSVD, the small variance of the rather low normalised WMH (nWMH) volumes in patients aged less than 53 years in our sample was striking. Visual differentiation of manifest cSVD from most likely ‘age-related’ degeneration via the size of the nWHM-volumes alone was impossible in these patients. Compared to a widely accepted visual rating scale often used in large cSVD trials, these patients resembled grade 1 at maximum of the visual scale, where a grade 1 in visual scoring is given for minimal white matter hyperintensities only.10,11 Therefore, their nWMH-findings were considered as the most acceptable base line for the whole sample, which then defined group 0 (young control patients: n = 18, age < 53 years) in our study. According to investigations of WMHs attributable to cSVD and their correlation to cerebral vessel density, an exponential instead of a linear regression model was applied to extrapolate this base-line to patients aged ≥ 53 years.
12
To this end, linear regression was applied to the logarithm of the data, and regression line subsequently transformed back into the original scale. Finally, the variance of the base line was considered by adding the MAD estimated from group 0 to the exponentially increasing regression line, which allowed definition of an age-dependent threshold to additionally separate groups 1 (elderly control patients: n = 38, age ≥ 53 years, nWMH-volume ≤ threshold) and 2 (cSVD-patients: n = 50, age ≥ 53 years, nWMH-volume > threshold) (Figure 1)), both covering the same age range. Consistent with our data driven analysis, groups 0 and 1 were comparable to Fazekas grades 1 and 2 ( = controls) and group 2 corresponded to Fazekas grade 3 ( = cSVD patients).
Using a sample-driven exponentially increasing regression model, three groups were differentiated: group 0 included young controls (age < 53 y [sample-defined], blue dots), where a differentiation of manifest cSVD from ‘age-related’ degeneration using nWMH-volumes was not possible. The model-derived base line (grey) and its estimated variance (yellow) are depicted as dashed lines. Patients aged ≥ 53 years with a nWMH-volume smaller or equal to the predicted upper variance-limit were judged as elderly controls (group 1, green dots), all other cases were considered as cSVD-patients (group 2, red dots).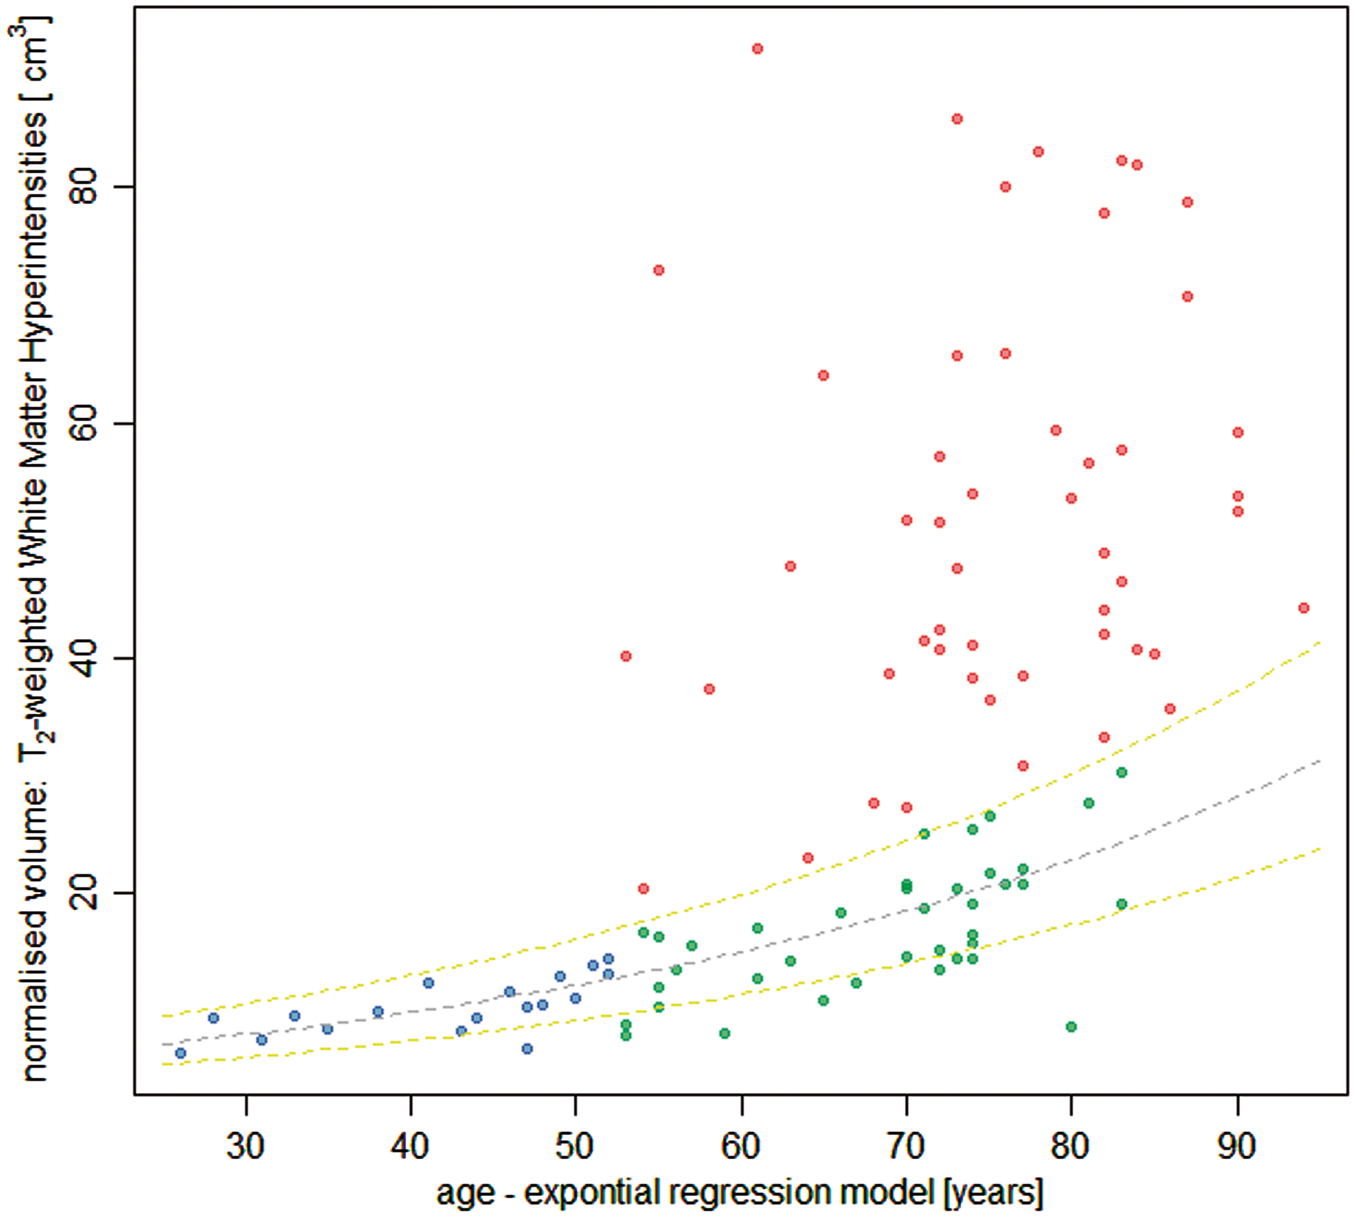
Assessment of cerebral hemodynamics
Image data were anonymised and reviewed on a PC-work station using freely available and in-house developed software packages (MRIcro 13 ). Perfusion images were coregistered to morphological images of the enhanced PD/T2w-IR-sequence using SPM12 (Statistical Parameter Mapping 12, UCL-Wellcome Trust Centre for Neuroimaging). The time-to-peak histogram or TDC, respectively, of each DSC-examination was provided by full-automatic calculation of standardised time-to-peak (stdTTP) parameter maps using in-house developed software (jPerfusionModule, version 2.0.0; available from the corresponding author). 14 R-implemented scripts (R – statistical package) automatically detected the TDC-main peak by a probability driven algorithm and fitted a generic double Gaussian model to that peak. 15 This unambiguously linked each absolute TTP-value ttp from the TDC to a distinct generic TDC f -quantile z f of the fitted model, which allowed optional switching between z f - and corresponding absolute ttp-values. Thus, direct comparisons of different examinations were possible, as each z f -value represents a unique point in the fitted model distribution TDC f and thus indicates the same quantile in every DSC-examination. On the other hand, measurements of individually different hemodynamic aspects of a given DSC-examination still could be performed via the correlated absolute individual ttp-values. 1
The TDC-main peak originates in the cascaded filling of the cerebral vessels during the first pass of the administered contrast bolus and is described by TDC
f
. By separation of certain z
f
-intervals from TDC
f
, assumed to represent different vessel segments, the course of the hemodynamic characteristics of the bolus transit was investigated. According to a former study, the complete bolus transit includes all voxels defined in the interval


Note that max
TDCf
is also the inflection point of the antiderivate of TDC
f
, which represents the perfused total brain volume pTBV (unit: cm3) over time during the first pass of the bolus (Figure 2). The sum of pTBV and the volume of flagged unperfused voxels lying inside the brain parenchyma, provided automatically by the stdTTP-calculation, was taken as TBV. Additionally, an analysis of the whole arterio-venous transit interval I
av
, with Iav = Iart + Iven, was performed. The duration The TTP-histogram of a DSC-examination constitutes TDC (dashed yellow line), which was considered to show the bolus spread velocity ν. Accordingly, its first derivate TDC' (dashed green line) relates to the bolus spread accelerations 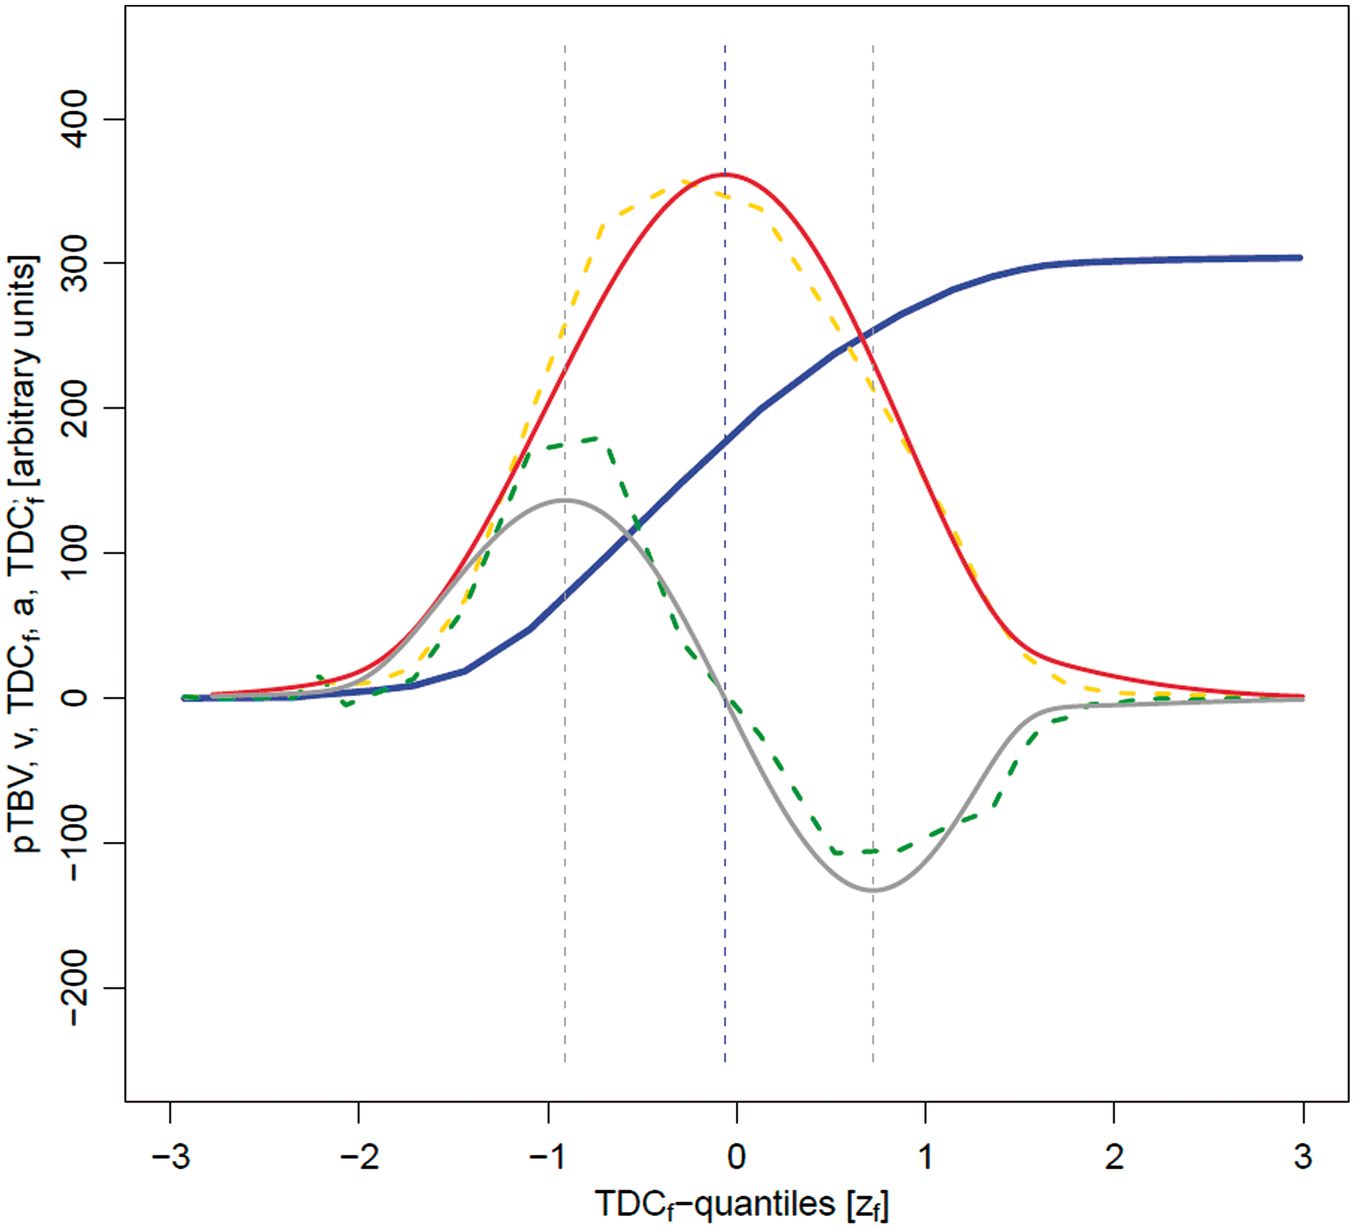

TDC
f
showing the chronological change of pTBV per measured time step, where time step means the sequence repetition time TR was considered to model the velocity of the bolus spread or, simply, bolus spread velocity in the brain (ν, unit: 

Statistical analysis
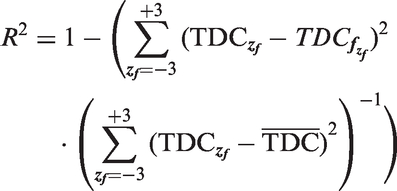
Quality of model fit was estimated by calculating R2 and the Spearman rank correlation coefficient ρ between TDC and TDC
f
. Note that R2 is not simply ρ2, but was calculated as
Validity of nWMH-grouping and TCD-interval definition was visualised by creating cumulative maps showing the extent of nWMHs of the three groups and the location of the voxels included in the various TDC-intervals according to their z f -value. Absolute measures of nWMHs and z f -interval differences were further assessed statistically by group-level comparisons testing the whole microvascular arterio-venous transit, the micro-vessel arterial wash-in and the venous wash-out phase intervals I av , I art and I ven , since only these intervals represented the parenchymal microvessels targeted in the study. Group-level comparisons were performed using Kruskal–Wallis (K–W) tests with Dunnett's Modified Tukey–Kramer Pairwise Multiple Comparison Test (DTK) as post hoc analysis to take potentially significant deviations from the normal distribution and inhomogeneity of variances, as well as the different size of the groups, into account. Correction for multiple comparisons was performed conservatively using the Bonferroni-method. Step-wise regression analysis was performed to explain dependencies of nWMH-volume using least trimmed squares and MM-estimation to treat outliers in the explanatory and responsive variables. 16
Descriptive statistics are given as mean, SD or/and confidence intervals. Otherwise, if applicable, data are quoted as median, MAD or/and 95% percentiles. All TDC calculations and statistical evaluations were performed in R (version 3.2.0) invoking packages FlexMix, robustbase, vcd and DTK.15–19
Results
Demographic data.
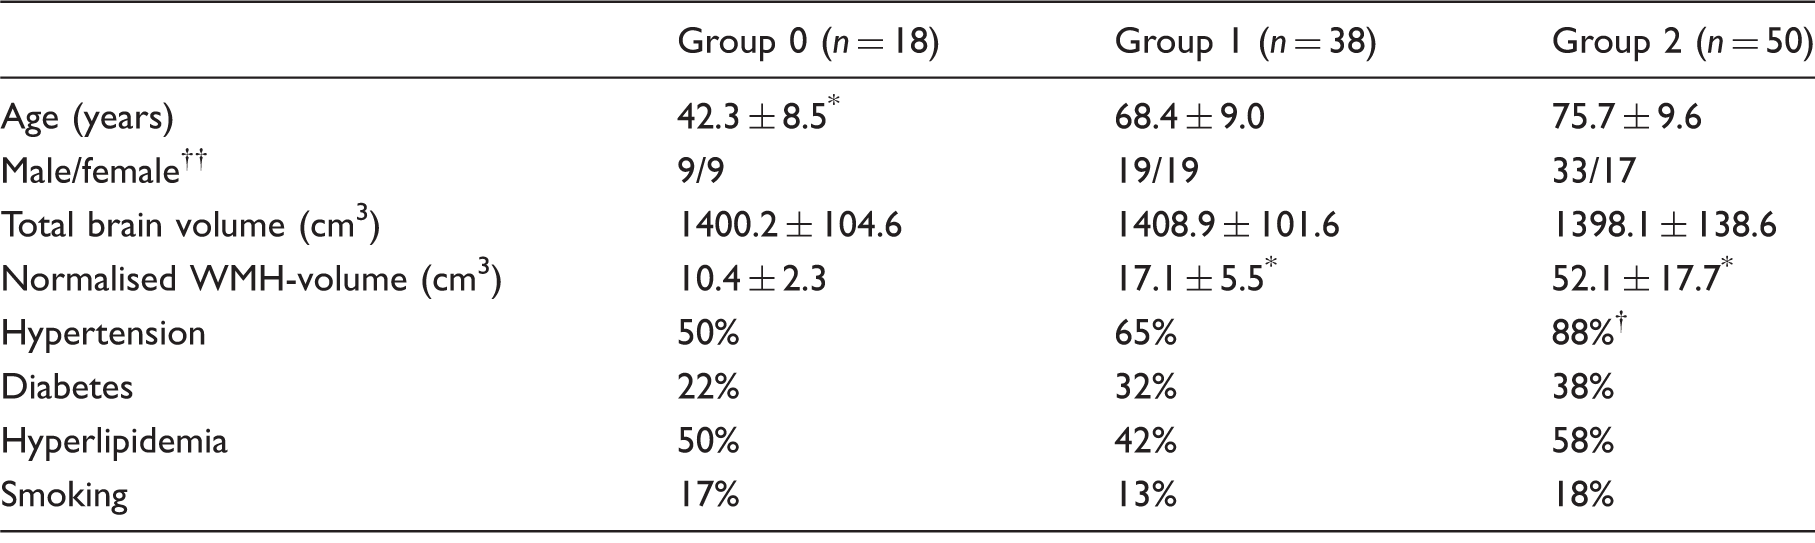
Note: Demographic data of group 0 (young controls), group 1 (elderly controls) and group 2 (cSVD-patients).
Significantly different at p < 0.01.
Significantly higher odds for risk factor at p < 0.003.
No significant effect from gender within and between groups.
The group-classification concerning the extent of WMHs was reviewed using cumulative maps, where, expectedly, group 0 and group 1 were visually comparable, while both groups exhibited clearly smaller WMH-volumes than group 3 (Figure 3). Nevertheless, in the statistical analysis, a significant difference between all three groups was obtained (K–W test: nWMH-volume; p < 0.05; post hoc: DTK; correction: Bonferroni). In the same way, validity of vessel segment classification based on TDC
f
-quantiles z
f
= {z
f
(IP
a
), z
f
(max
TDCf
), z
f
(IP
v
)} was verified by cumulative maps showing the location of all voxels belonging to the respective intervals I
A
, I
art
, I
ven
, and I
V
, where the interval-definitions for I
art
and I
ven
effectively included the parenchymal microvessel segments (Figure 4). The quality of the model fit was excellent with ρ = 0.992 (Spearman; 95% interval: 0.965–0.997) and R2 = 0.985 (95% interval: 0.882–0.996).
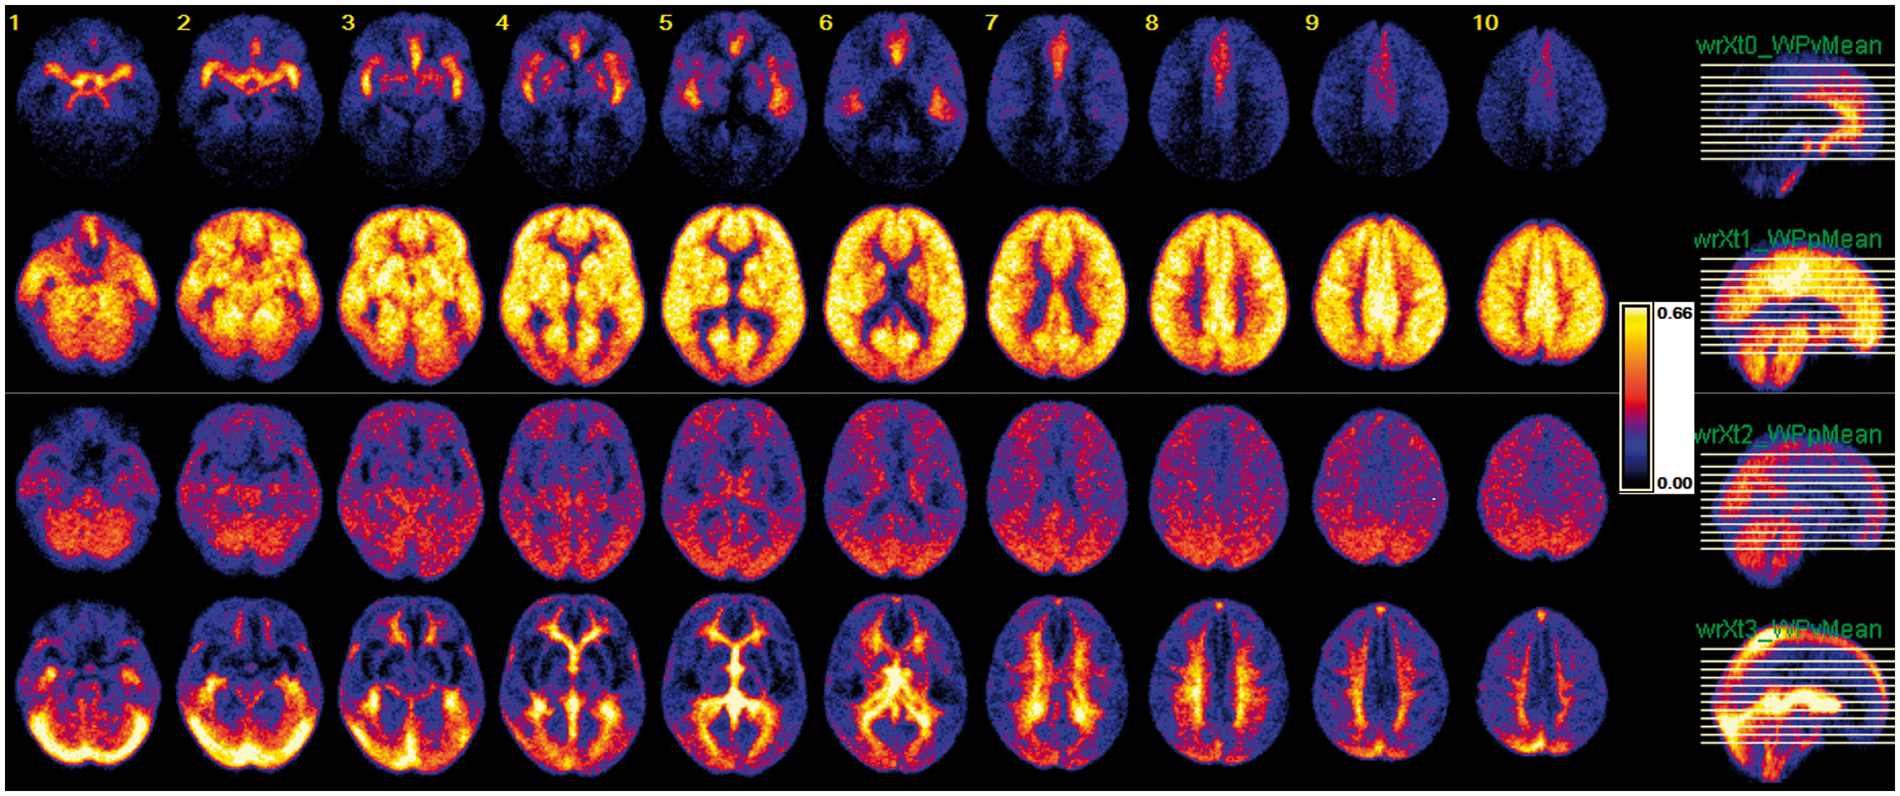
Normalised cumulative maps showing the extent of nWMHs (depicted as black areas) in the three different groups.: The nWMH-volume was significantly different between all three groups. Nevertheless visually, group 0 (top row; young controls, n = 18) was comparable to group 1 (middle row; elderly controls; n = 38), while in group 2 (bottom row; elderly cSVD-patients; n = 50) the cerebral white matter was severely affected by multiple confluent WMHs. Note that column-numbers given in the top row mark the same slices as in Figure 4. Normalised cumulative maps (n = 106) showing arterial macrovessel wash-in phase I
A
(first row), the arterial microvessel wash-in phase I
art
(second row), the venous microvessel wash-out phase I
ven
(third row) and the venous macrovessel wash-out phase I
V
(fourth row). The proposed TDC
f
intervals provide an acceptable general description of the different phases of cerebral bolus transit. Note that column-numbers given in the top row mark the same slices as in Figure 3.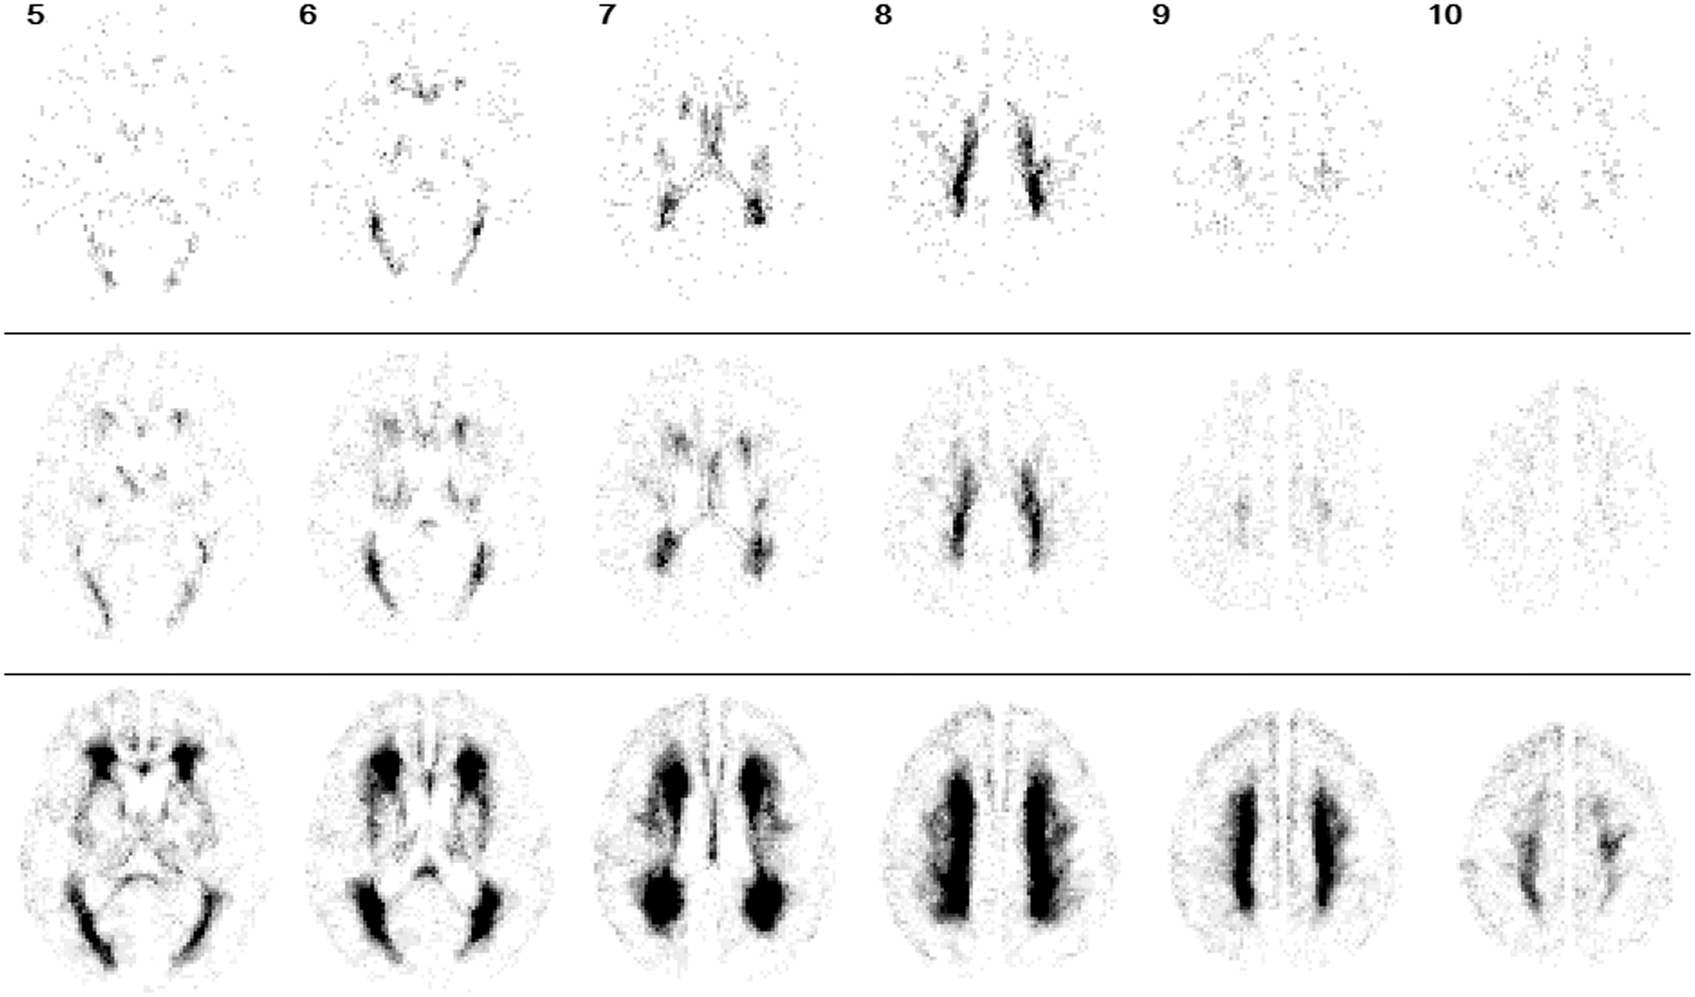
The evaluation of the bolus transit duration
Results from TDC analysis.
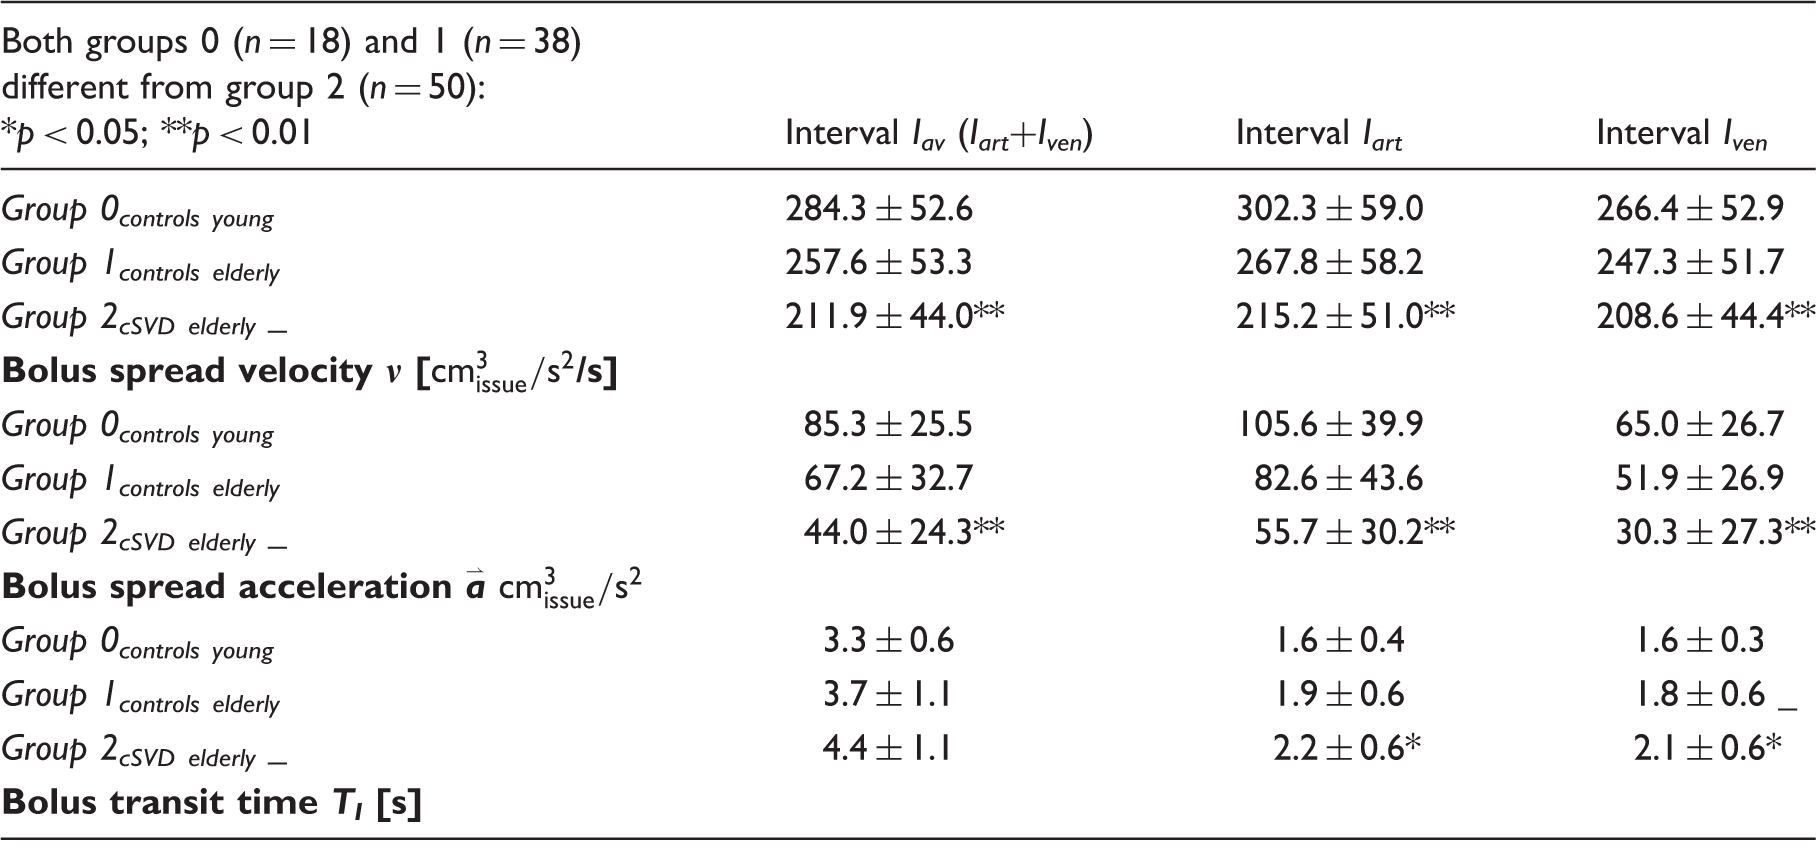
Note:
A scatter analysis of Bolus spread velocity 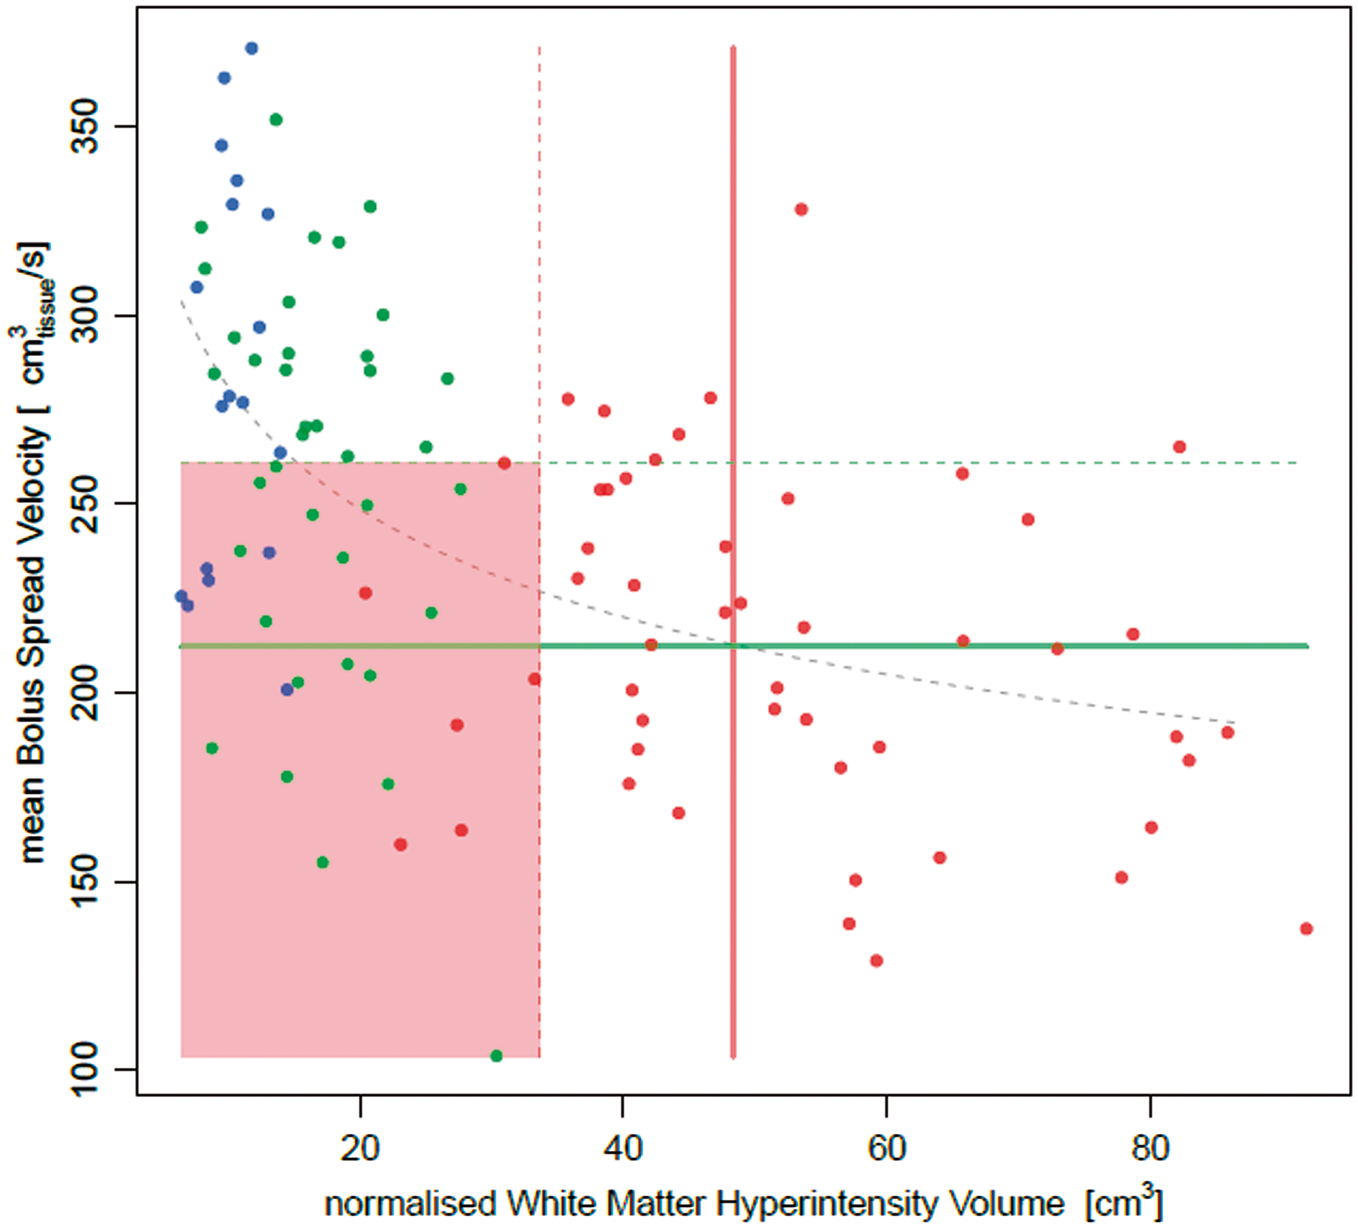
Finally, we performed robust regression analysis explaining the extent of nWMH-volume by
Discussion
Investigating TTP-histograms, dubbed TDC, derived from established DSC-MRI, we found striking evidence that a substantial part of the hemodynamic alterations detected by the TDC may directly arise from modifications in the cerebral microvascular bed. The evaluation of the bolus transit dynamics in cerebral parenchyma revealed an exponential decrease of the TDC-derived mean bolus spread velocity
In a conceivable cascade of endothelial failure, perfusion impairment and loss of capillaries, quasi as a subsequent feature in the course of cSVD, arteriolar tortuosity and venous collagenosis were also reported to deteriorate microvascular flow and, therefore, to reinforce the effect from initial endothelial failure. Despite the fact that the exact relationship between these findings and cSVD is discussed controversially, a histologically visible loss of white matter cellular components was proven in all patients in the respective study, where the authors themselves stated that: “.… Only the very largest of these lesions might be detected on MRI scans, ….”
26
This underlines our proposal to rather focus TDC-evaluations on patients of groups 0 and 1 who present with a drop of
Importantly, our results suggest that microangiopathic flow impairment is sensitively reflected by the increase in
However, we also acknowledge certain limitations. Vascular risk factors and certain properties of those, such as duration and severity, could not be assessed specifically and we neither aimed to measure their effects on cerebral hemodynamics nor did we intend to relate hemodynamic findings with clinical manifestations caused by cSVD. Our investigation focused rather on the grade of hemodynamic alterations potentially caused by modifications in the microvascular bed due to any reason for cSVD in order to expand diagnostic capabilities of DSC-MRI. Despite this, the frequencies of the various risk factors in the respective groups were widely comparable, except for hypertension, which was more frequently found in group 2. Anyway, including hypertension into the model did not improve the model significantly, while age did. This poses the question whether patients at higher age often share a longer duration of cerebrovascular disease, which in turn increases the possibility for a higher nWMH-volume. On the other hand, relatively low nWMH-volumes in older patients could be very well explained by a late onset of cSVD. Interestingly, the only severe outlier from the model was an 80-year-old woman who presented with multiple recently discovered risk factors and a low nWMH-volume, but showed a clear decrease of
Also, we used an unbiased fully automatic segmentation algorithm that was designed to yield classifications comparable to the visual scores proposed by the LADIS study.10,11 Yet, patients of group 0 were to some extent assigned visually from the distribution of the nWMH-volumes to define the base-line. While this did not completely exclude an inclusion-bias in group 0, where bias should be lowest, this was quite avoided in groups 1 and 2. Though this has to be validated further in larger samples, differentiation of cSVD from controls seems acceptable in this study, which could be demonstrated by the cumulative maps depicting the extent of WMHs of the different groups. The automatic classification assigned grade 1 to group 0, group 1 resembled very much grade 2, and group 2 fitted grade 3, according to visual scoring as proposed in the literature.10,11 Note also that extracting patients from a hospital database per se widely precludes inclusion of truly healthy persons. Thus, it has to be emphasised that our groups 0 and 1, used as controls, rather represent the lowest grade of cSVD detectable, which is a common limitation found in trials investigating cSVD. Nonetheless, direct comparisons of our results with those from other studies based on pure visual scoring should be done very carefully.
Furthermore, our study lacks an age-matched group of younger patients with severe WMH-manifestations, which is widely owed to the fact that hereditary vasopathies were excluded. Nevertheless, in a sonographic study, the hemodynamic impairment in younger patients suffering a hereditary vasopathy was comparable to group 3 in our sample.27,28 Thus, we do not expect a significant effect on our results.
Finally, gender is known to show an effect on cerebral perfusion. 34 While groups 0 and 1 contained equal numbers of male and female patients, in group 2 predominantly male patients were represented. Multiple comparisons between male and female subgroups within and between groups including cross-over testing (i.e. male vs. female) did not reveal any effect from gender differences in our sample. This could result from the fact that TDC evaluates the global cerebral bolus transit, which might turn out as more robust to this confounding effect than the voxel-wise evaluations usually performed. It is important to note that age, also yielding a strong effect on both transit time and nWMH-volume, was comparable between groups 1 and 2. This additionally underlines a strong effect from presumably microvascular alterations on the measured differences of cerebral hemodynamics between these groups.
In conclusion, our findings support the hypothesis of a direct relationship between the extent of normalised WMH-volume, attributable to underlying cSVD, and its presumably direct influence on the arterio-venous transit time measured by TDC derived from DSC-MRI. This is of great interest since, on the one hand, TDC could be used to support further adjustment of the DSC-MRI derived perfusion time parameters, which depend on the arterio-venous transit time. On the other hand, TDC could provide a novel approach to robust assessment of early cSVD. As a future prospect, our approach could provide a more accurate analysis of early stages of cSVD that might help to improve therapeutical treatment.
Footnotes
Funding
The author(s) disclosed receipt of the following financial support for the research, authorship, and/or publication of this article: This work was financially supported in part via a grant from the Austrian Science Fund (FWF P23533-B13) and an unrestricted grant to E.M. by Siemens Medical Solutions, Austria. Parts of the data were presented at ESMRMB 2015.
Declaration of conflicting interests
The author(s) declared the following potential conflicts of interest with respect to the research, authorship, and/or publication of this article: Christian Nasel received lecture and consulting fees from Bracco and Guerbet, both unrelated to this study. All other authors declare no conflict of interest.
Authors' contributions
NC contributed to preparation of the paper, MR measurements and data evaluation; BRN and KK contributed to preparation of the paper and data evaluation; and ME contributed to preparation of the paper and final approval of the manuscript.
Statement on underlying research materials
All underlying research materials related to our paper can be accessed anonymously upon request. Otherwise, all relevant data are included in the manuscript.