
Abstract
Delirium is common during critical illness and is associated with morbidity and mortality, but its pathophysiology is unknown. We tested whether dysfunctional cerebral autoregulation (CA) contributes to the development of delirium. Adult patients (n = 40) with respiratory failure and/or shock were prospectively enrolled. Continuous recordings of regional cerebral oxygen saturation (rSO2) were obtained by near-infrared spectroscopy (NIRS) during the first 72 h of intensive care unit (ICU) admission. CA function was estimated by the cerebral oximetry index (COx), which is the time-varying correlation between rSO2 and mean arterial pressure (MAP). Delirium was assessed daily. The median ICU stay was seven days (IQR 4–13). Twenty-four patients (60%) screened positive for delirium on at least one day during their stay. Taking positive COx values to reflect periods of CA dysfunction, we found that the cumulative duration of CA dysfunction during the first one to three days in the ICU was significantly associated with the subsequent development of delirium. Additionally, we assessed two alternative methods for estimating optimal MAP targets in individual patients. In summary, early disturbances in CA may contribute to delirium, and NIRS-derived rSO2 may be used to identify individual perfusion targets in critically ill patients.
Introduction
Acute neurological dysfunction is a common complication of critical illness. Delirium, defined as an “acute change in level of consciousness characterized by impaired attention and disorganized thinking” can affect up to 80% of patients admitted to intensive care units (ICUs).1,2 Delirium is associated with negative patient-oriented outcomes, such as longer lengths of stay in ICU and mortality.1,2 A recent systematic review and meta-analysis suggested that delirium is the most consistent risk factor for long-term cognitive impairment following ICU admission. 3 However, the underlying pathophysiology of delirium is not understood. 2
Cerebral oxygenation can be measured non-invasively from the superficial regions of the frontal cortex using near-infrared spectroscopy (NIRS). Using NIRS-derived regional cerebral oxygen saturation (rSO2) measurements, we recently demonstrated that low cerebral oxygenation was an independent risk factor for the subsequent development of delirium in patients with respiratory failure or shock. 4 Although the mean rSO2 was significantly lower in individuals who spent the majority of their ICU stay delirious, there was considerable variability within each group (delirious vs. non-delirious), suggesting that mean rSO2 does not completely capture the complex relationship between cerebral perfusion and delirium.
Cerebral autoregulation (CA) is a vascular reflex mechanism that responds to changes in systemic blood pressure in order to maintain constant blood flow in the brain. Dysfunctional CA can lead to suboptimal brain tissue oxygenation and/or edema, and has been associated with negative outcomes in cardiac surgery, traumatic brain injury and subarachnoid haemorrhage.5–7 CA function is less well understood in the setting of critical illness. Emerging evidence suggests that CA dysfunction is common in patients with sepsis (in the absence of primary brain injury), and may play a key role in the neurocognitive impairments often observed in critically ill patients more generally. 8
One way to non-invasively assess CA function is with the cerebral oximetry index (COx), which is the time-varying (‘rolling’) correlation coefficient between mean arterial pressure (MAP) and NIRS-derived rSO2.9,10 Since positive COx values (e.g. as MAP increases, rSO2 increases) are taken to reflect dysfunctional CA,11–13 it is possible to quantify a patient’s exposure to CA dysfunction. We computed COx from rSO2 and MAP data streams recorded up to the first 72 h in the ICU from 40 critically ill patients, and examined the association between early CA dysfunction and the subsequent development of delirium, as assessed daily using the validated tool, Confusion Assessment Method-ICU (CAM-ICU).7,14 Last, we explored the use of COx-based approaches to identify patient-specific MAP targets for optimizing cerebral blood flow.11–13
Materials and methods
Research ethics and patient consent
The Queen’s University Health Sciences and Affiliated Hospitals Research Ethics Board approved this study according to ethical principles, regulations and guidelines including (but not limited to) the Food and Drugs Act, the International Conference on Harmonisation Good Clinical Practice Guidelines, and the Declaration of Helsinki: Ethical Principles for Medical Research Involving Human Subjects. A 24 h deferred-consent model was used. Informed consent was obtained from all subjects or their proxy (if patients were unable to consent themselves) as soon as possible.
Study design and setting
This study is an analysis of a nested cohort of critically ill patients in the Cerebral Oxygenation and Neurological outcomes FOllowing CriticAL illness (CONFOCAL) study, a single-centre prospective observational study in a 33-bed academic medical/surgical/trauma ICU. This trial was retrospectively registered on clinicaltrials.gov (Identifier: NCT02344043). The full protocol has been published. 15
Participants and delirium screening
Adult patients (≥18 years) were eligible if they were expected to require mechanical ventilation for > 24 h and/or had shock of any etiology, and had been admitted to the ICU within the previous 24 h. Shock was defined by vasopressor dose requirement (to achieve MAP = 65 to 80 mmHg), adapted from previous studies.7,15 Participants were excluded if they had a life expectancy <24 h, a pre-ICU diagnosis of cognitive dysfunction as indicated by their medical records on admission, or a primary central nervous system diagnosis (e.g. traumatic brain injury, see Supplemental Methods). Patients were screened on each calendar day of their ICU stay with the CAM-ICU by a trained researcher when it was convenient for the patient, family, and health care team. For patients receiving continuous infusions of sedative drugs, every attempt was made to perform delirium assessments during daily interruptions of sedation. Unresponsive patients (i.e. Richmond Agitation-Sedation Scale (RASS) of −4 or −5) were defined as comatose and unable to participate in delirium screening. Delirium outcomes were assessed according to whether patients ever exhibited delirium during their ICU stay (ever-delirious) or whether all CAM-ICU assessments were negative (never-delirious), and also by the total number of delirious (non-comatose) days.
Physiological data collection
Immediately following enrolment, patients underwent rSO2 monitoring with the FORESIGHT monitor (CASMED, Caster Medical, Canada). A single 5 cm sensor was placed in the centre of each patient’s forehead, >3 cm from the superior rim of the orbit, 16 and rSO2 data were captured every 2 s for the first 10–72 h in the ICU (median, 24 h; IQR, 22–25 h). Treating clinicians were blinded to the rSO2 recordings. Commercially available software (Bedmaster, Excel Medical Electronics, FL, USA) was used to simultaneously record high-fidelity vital signs from invasive arterial sensors (i.e. MAP). The data were stored locally on dedicated servers at the Queen’s University Centre for Advanced Computing (cac.queensu.ca).
Measuring CA function
Custom algorithms (MATLAB R2017b, MathWorks, MA, USA) were written to calculate COx, which was given by the Spearman’s correlation coefficient between the MAP and rSO2 time-series computed through time with a moving time window advanced in 1 min steps. Spearman’s method was used instead of Pearson’s since linearity in the relationship between MAP and rSO2 was not assumed. We performed an optimization procedure for COx by varying the window length parameter across a wide range (5, 10, 15, 20, 25, 30, 35, 40, 45, 50, 55, 60, 120, 180, 240, 300 min, see Supplemental Methods). Positive COx values were taken to reflect CA dysfunction.12,17 We defined CA dysfunction using a statistical significance threshold for positive COx correlation values (p < 0.05 or p < 0.0001, see Results). The cumulative duration of CA dysfunction was given by the total accumulated time spent above threshold; the cumulative duration of CA dysfunction divided by the total recording time (multiplied by 100) was the % time with CA dysfunction.
Estimating optimal MAP
To calculate optimal MAP as previously shown, the computed COx values were binned by the average MAP value in their respective moving windows (in 5 mmHg bins: MAPOPT-A).11–13 An alternative strategy was tested by inverting the MAPOPT binning procedure, instead binning MAP values by their corresponding COx values (from −1 to +1, in bins of 0.05: MAPOPT-B) (see Supplemental Methods).
Statistical analysis
All correlations were assessed by Spearman’s rank correlation coefficient (rho) and their associated p-value. For between-group statistical comparisons, Fisher’s exact test was used to compare categorical data in 2 × 2 contingency tables, and the Wilcoxon rank sum test was used to compare continuous data. Statistical significance for group comparisons was assessed at p < 0.05. Computer algorithms for COx were developed blindly to the patients’ delirium status.
Results
Patient characteristics
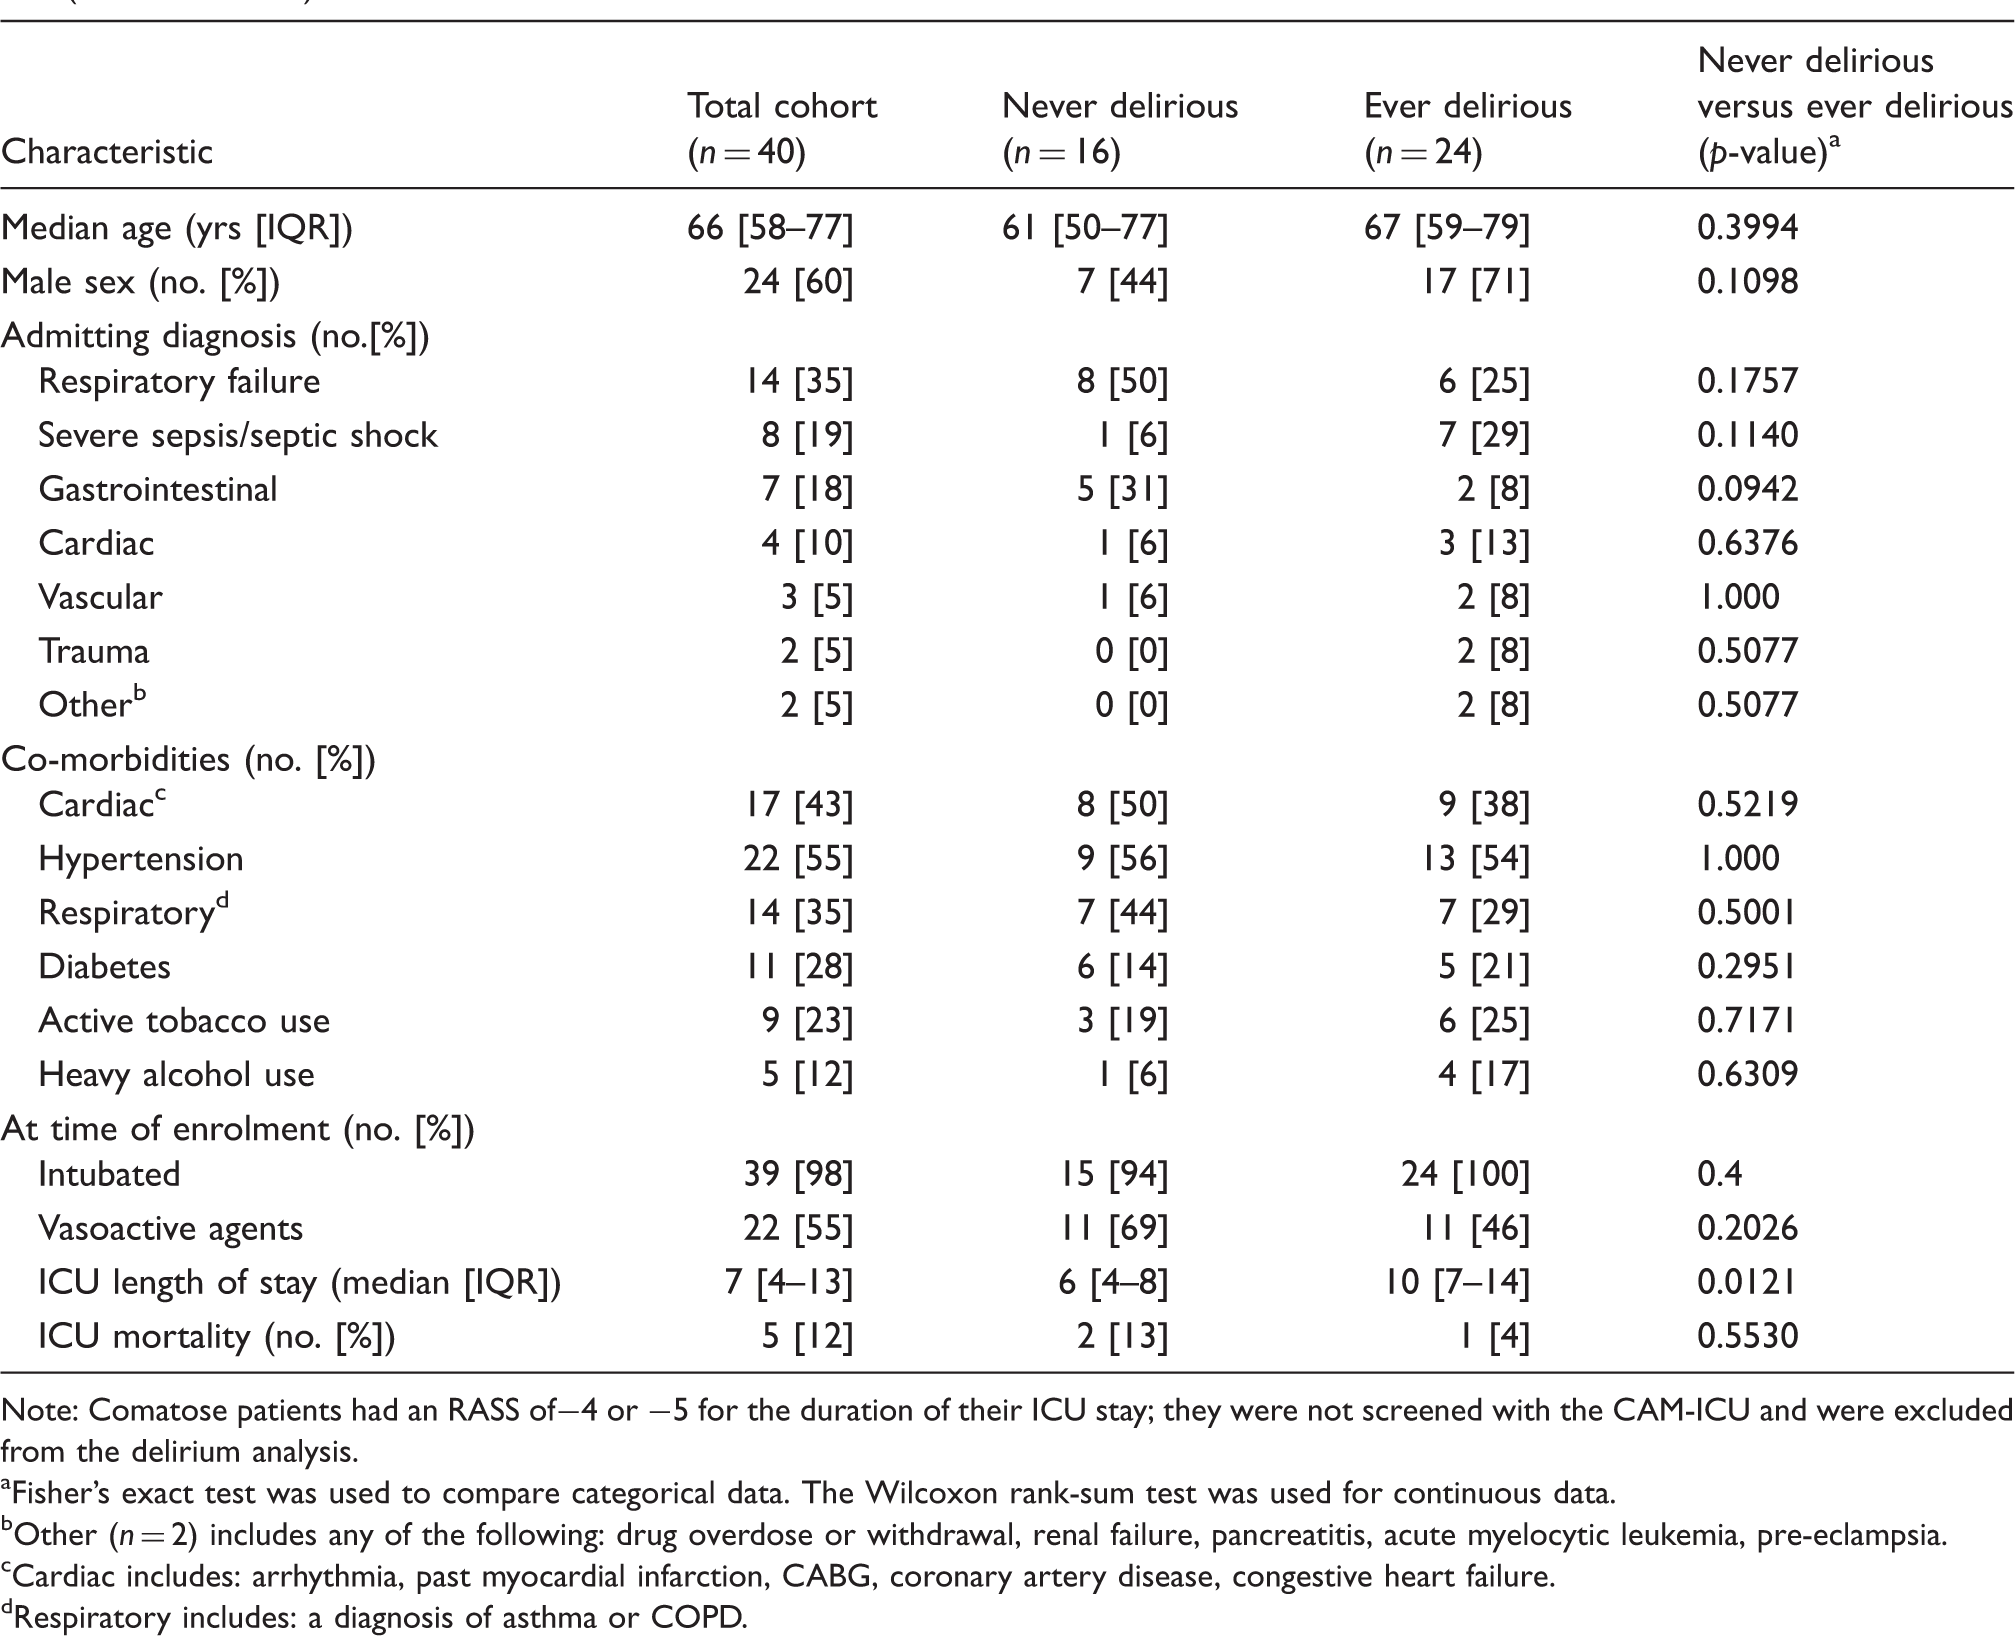
From March 2014 to September 2016, 1155 patients were assessed for eligibility, and 104 were enrolled (Figure 1). As the infrastructure for high-fidelity vital sign recording was implemented part way through patient recruitment, 49 of these patients (47%) had their vital signs captured and stored. Seven patients were excluded due to contamination with spurious arterial line readings (Supplemental Methods); two other patients were comatose for their entire ICU stay (i.e. RASS of −4 or −5) and did not survive, which precluded delirium assessments with the CAM-ICU. The clinical and demographic features of this patient cohort are summarized in Table 1. In the remaining 40 patients, the average age was 65 years (IQR, 56–78); 24 (60%) were male, 39 (98%) were intubated at time of enrollment, 22 (55%) were being treated with vasopressors, and 21 (53%) were both intubated and treated with vasopressors. Twenty four patients (60%) screened positive for delirium on at least one day of their ICU stay, while 16 (40%) did not. The median length of ICU stay was 7 days (IQR, 4–13) and 37 (93%) survived to ICU discharge.
Consort diagram demonstrating patient inclusion and exclusion during study recruitment. Demographic and clinical characteristics of the patient cohort, divided by the development of delirium (ever delirious) or not (never delirious). Note: Comatose patients had an RASS of−4 or −5 for the duration of their ICU stay; they were not screened with the CAM-ICU and were excluded from the delirium analysis. Fisher’s exact test was used to compare categorical data. The Wilcoxon rank-sum test was used for continuous data. Other (n = 2) includes any of the following: drug overdose or withdrawal, renal failure, pancreatitis, acute myelocytic leukemia, pre-eclampsia. Cardiac includes: arrhythmia, past myocardial infarction, CABG, coronary artery disease, congestive heart failure. Respiratory includes: a diagnosis of asthma or COPD.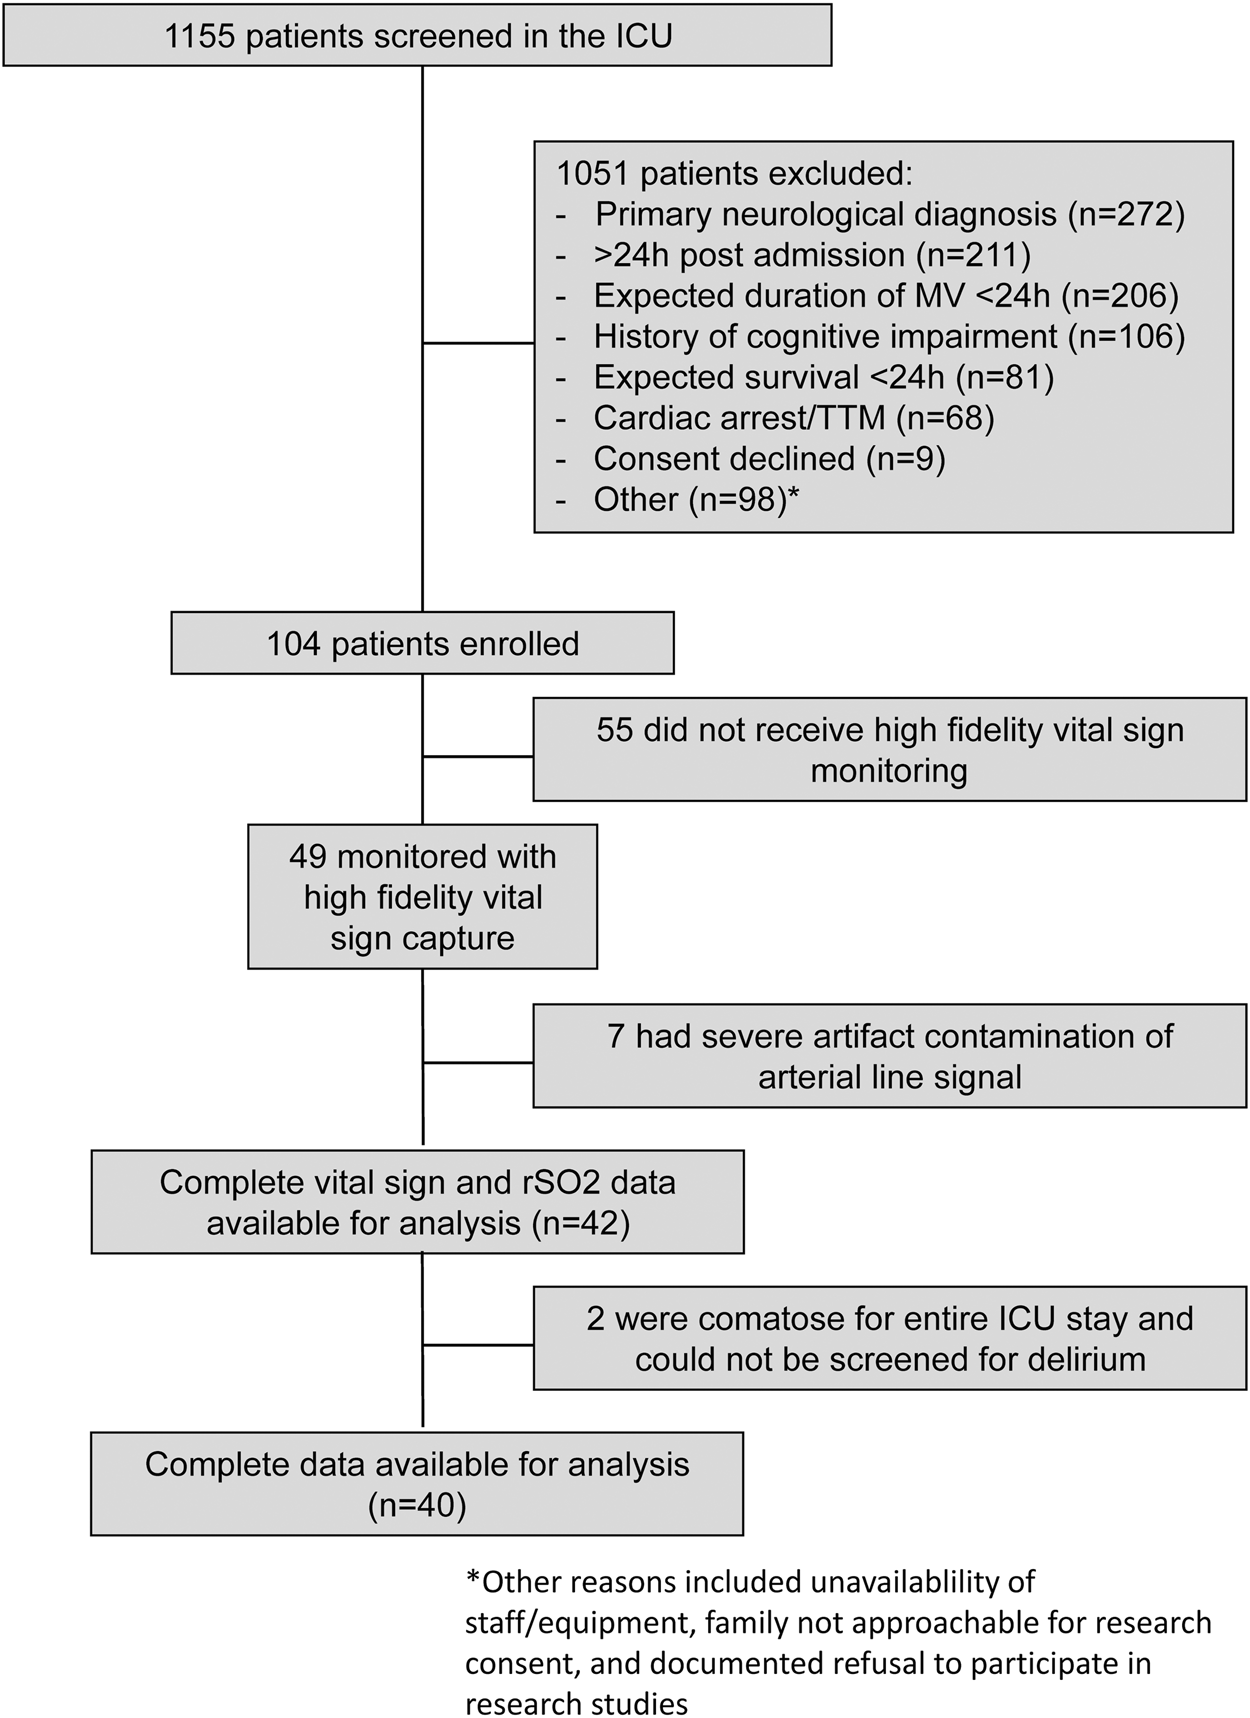
Optimizing COx to resolve CA dynamics through time
The cerebral oximetry index, COx, is the rolling correlation coefficient between MAP and rSO2 and has been used as a proxy for CA function, where positive COx values are taken to reflect CA dysfunction and zero or negative COx values are taken to reflect intact CA.11,12,17 We systematically varied the moving window length parameter (between 5 and 300 min) to compute COx, which enabled optimization of the procedure for detection of CA dysfunction (Figure 2). The shortest moving windows produced relatively noisy COx signals that were largely indistinguishable between patients. Intermediate-length windows (20–60 min) exposed unique features in the COx time series between individual patients (Figure 2(b) and (d)). With these intermediate-length moving windows, we routinely observed periods of intact CA (zero or negative COx values) interrupted by variable periods of CA dysfunction (positive COx values). Progressively longer moving windows had a smoothing effect on the COx signal, which degraded the granularity of the COx dynamics observed with the intermediate-length windows. This parameter variation-based sensitivity analysis suggests that the optimum window length for identifying CA dysfunction is between 20 and 60 min (see Supplemental Figure 2 and Supplemental Methods).
The COx rolling correlation analysis with different moving window lengths. (a, b) Data from a patient who never became delirious (never-delirious). (c, d) Data from a patient who was delirious on two screening days (ever-delirious). (a, c) 24 h recordings of MAP and rSO2. (b, d) COx signals computed with different moving window lengths. COx values are coloured light gray (p > 0.05), dark gray (p < 0.05) or black (p < 0.0001).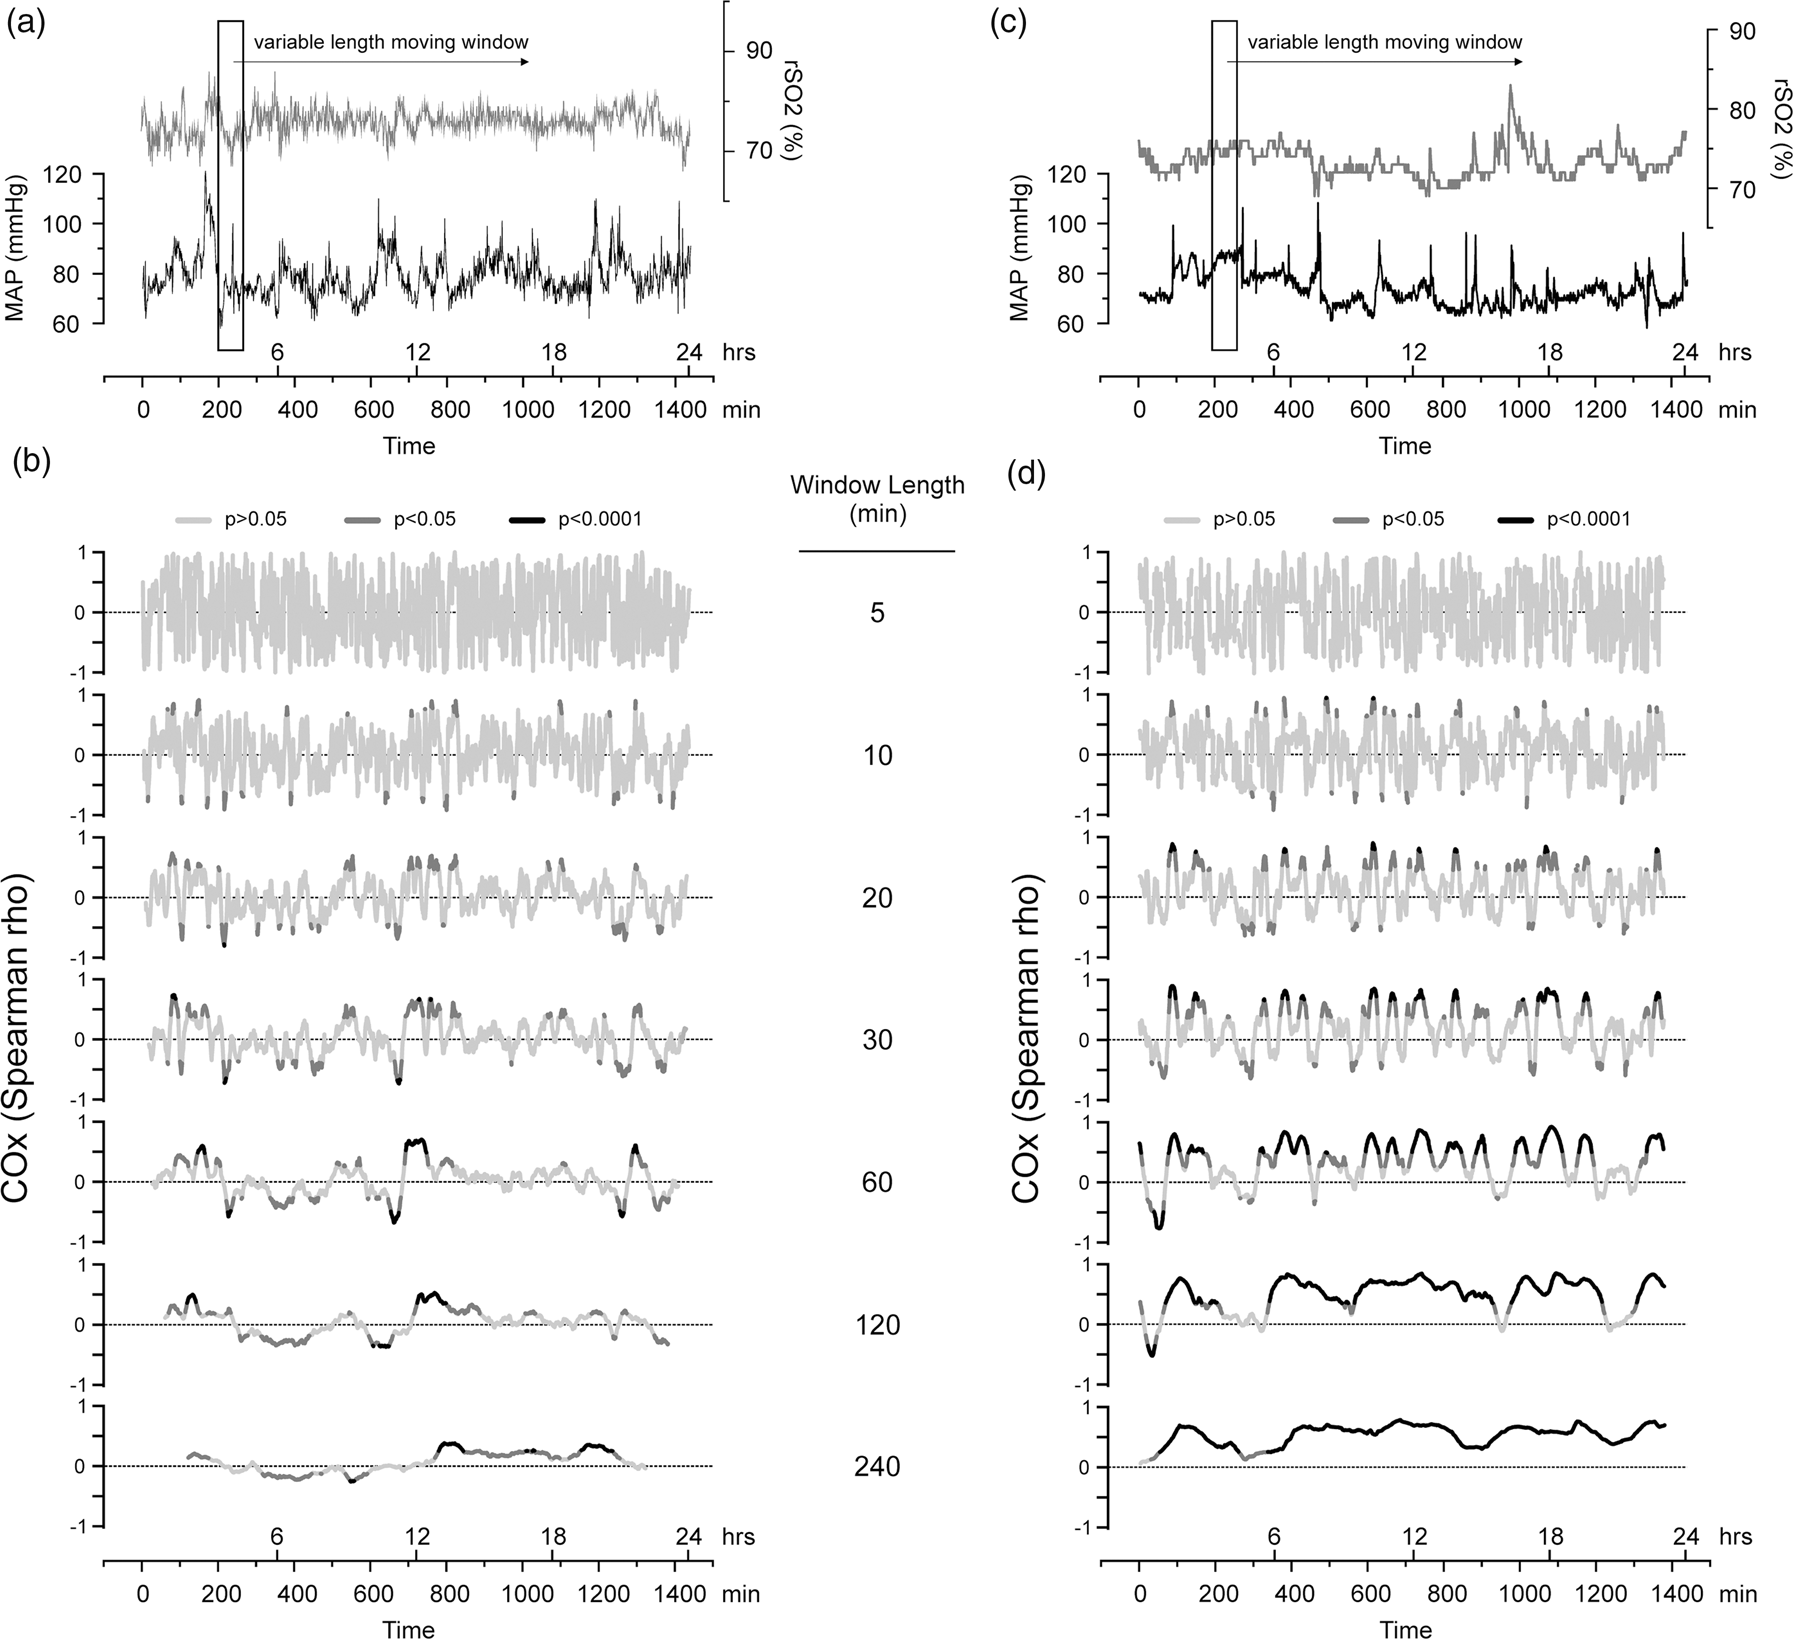
Association between CA and delirium in critically ill patients
We hypothesized that early CA dysfunction in the ICU is positively associated with the subsequent development of delirium. To test this hypothesis, we analyzed the relationship between delirium outcomes and % time spent with CA dysfunction during the recording period (up to the first 72 h in ICU). All patients exhibited some degree of CA dysfunction. Consistent with our hypothesis, we found that never-delirious patients exhibited significantly less CA dysfunction compared to ever-delirious patients (Figure 3(a), % total recording time, median (IQR); never-delirious: 5.2 (3.3–12.9); ever-delirious: 10.4 (6.7–18.6); p = 0.032). The % time with CA dysfunction was significantly correlated with the total number of days delirious (Figure 3(b), Spearman rho = 0.3420; p = 0.0307). Vasopressor treatment could in principle affect CA mechanisms, but there was no association between vasopressor use and the duration of CA dysfunction in our study sample (% total recording time, median (IQR); untreated: 9.0 (6.0–18.4); treated: 7.3 (3.6–15.3); p = 0.3345). These results suggest that CA dysfunction is associated with an increased risk of subsequently developing delirium in the ICU.
(a) Box-and-whisker plot showing % time with dysfunctional cerebral autoregulation (CA) for never- and ever-delirious patients. The box outlines the 25th, 50th and 75th percentiles and the whiskers show the 10th and 90th percentiles; means are marked by a dot. (b) Scatter plot of % time with dysfunctional CA plotted against the number of days with delirium.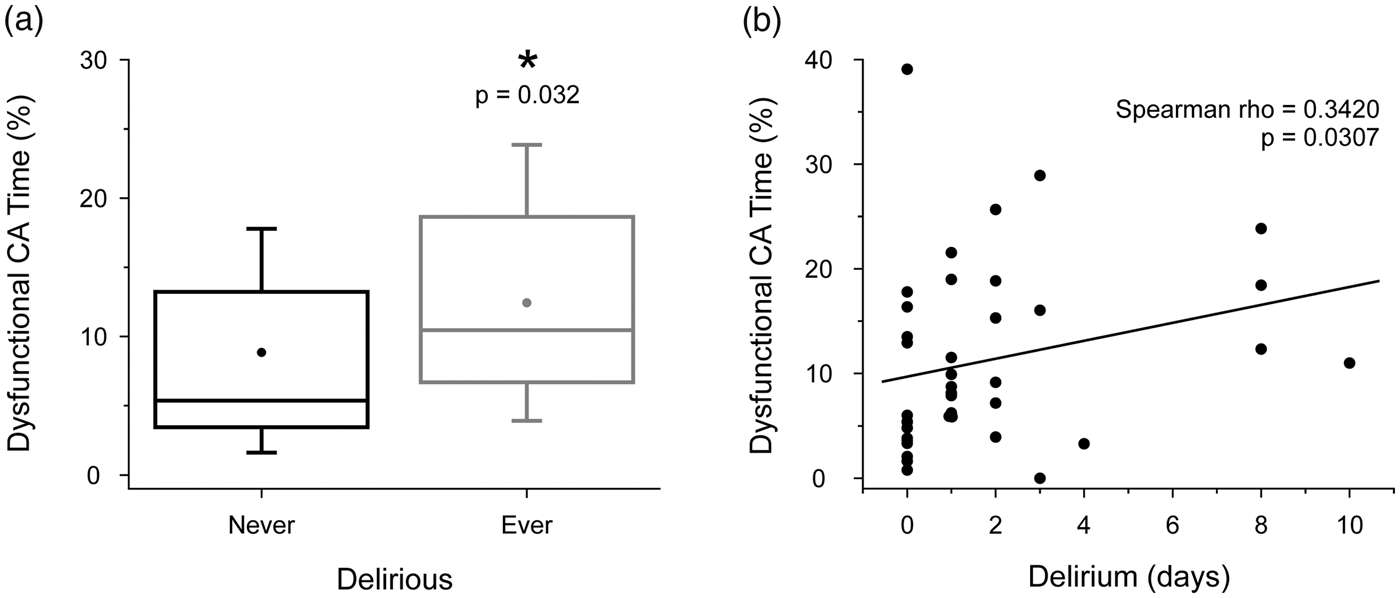
Identifying clinical targets to optimize cerebral perfusion
There is interest in developing methods to identify individualized physiological target parameters such as MAP in order to help guide patient-specific treatments. We computed MAPOPT in our recordings using a 5-min moving window as previously shown, referred to here as the ‘MAPOPT-A’ method.11,12 The resulting plots, where COx values were binned by MAP, routinely showed intact CA (near-zero or negative COx values) spanning a large MAP range (tens of mmHg, Figure 4(a) and Supplemental Figure 4(a) to (c)). Moreover, it was not possible to statistically distinguish these COx values from one another. As such, we were unable to identify a putative MAPOPT value in all but one patient using the MAPOPT-A approach. After repeating the analysis on a better-resolved COx signal given by longer moving windows (30 and 45 min), MAPOPT remained equivocal in 35 out of 40 cases. These results suggest that the MAPOPT-A method may not reliably offer clear MAP targets in critically ill patients, and that alternative approaches should be explored.
An individual example of the MAPOPT-A and (inverse) MAPOPT-B methods to identify optimal targets for MAP. The rSO2 and MAP recordings were acquired during the first 24 h in ICU from a 67-year-old female who subsequently screened positive for delirium on two days. (a) The MAPOPT-A analysis (COx binned by MAP, bottom panel) and the distribution of time spent in each MAP bin (top panel). The grey box indicates where COx values were not statistically significant (p > 0.05). (b) The MAPOPT-B analysis (MAP binned by COx, bottom panel) and the distribution of time spent in each bin (top panel). Black data points in (b) indicate statistically significant COx values (p < 0.05). The grey shaded regions indicate putative ‘safe’ and ‘danger’ zones.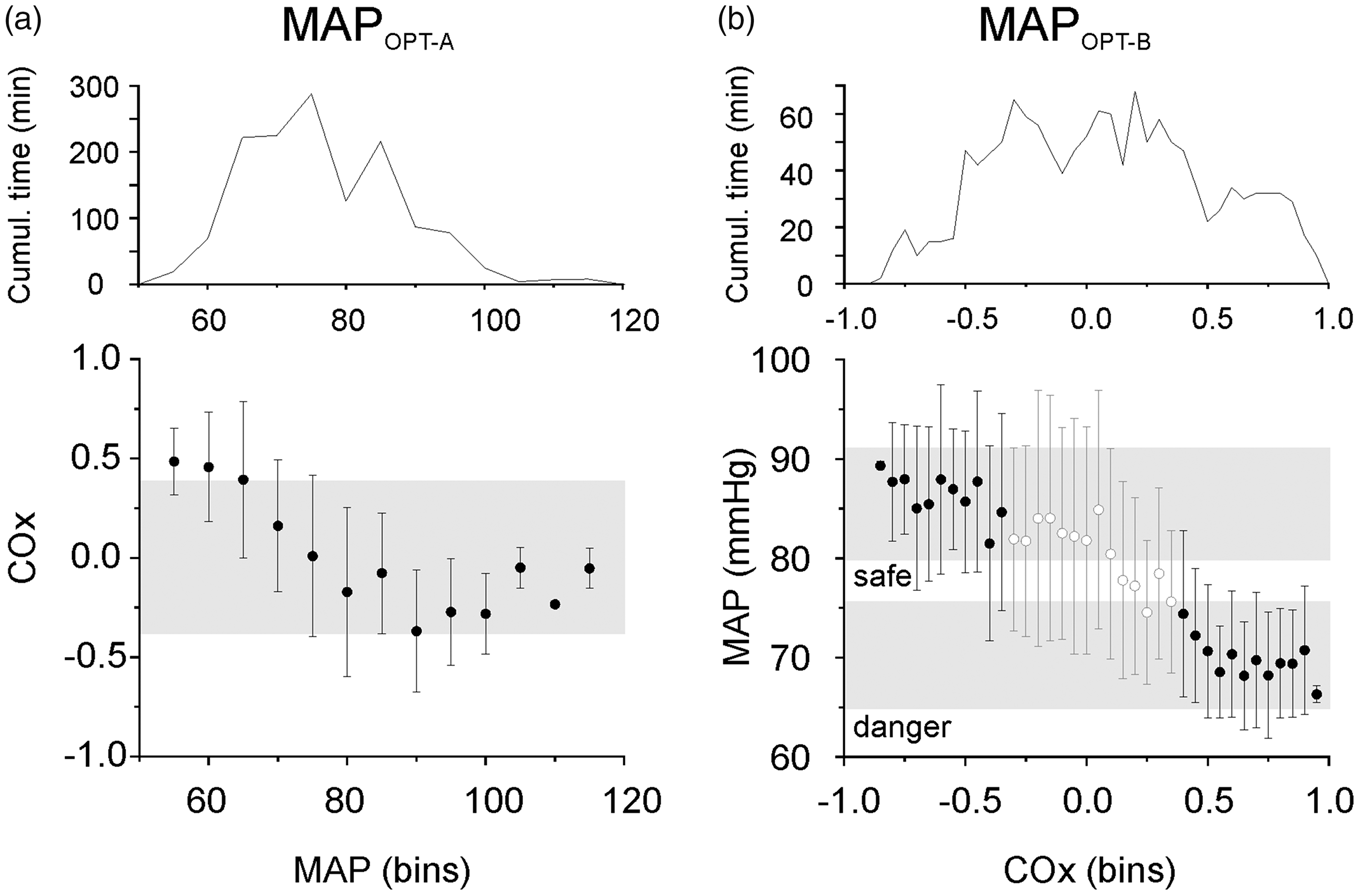
Since positive COx values are taken to reflect CA dysfunction, we asked whether certain MAP values were preferentially associated with COx. To answer this, we set COx as the independent variable. We therefore inverted the binning procedure of MAPOPT-A, instead sorting MAP values with respect to COx bins. The MAPOPT-B data plots adopted four general patterns: positive slope (n = 2/40), negative slope (n = 18/40), flat (n = 13/40) and complex (n = 7/40) (Figure 4(b) and Supplemental Figure 4(a) to (c)). Plots with positive or negative slope showed narrow MAP ranges that were clearly associated with CA dysfunction (positive COx). These ‘danger’ zones could be readily delineated from ‘safe’ MAP ranges, where COx values were near-zero or negative (Figure 4(b) and Supplemental Figure 4(a)). On average, these putative danger zones and safe zones were separated by 8 ± 4 mmHg, with mean values of 76 ± 8 mmHg and 82 ± 10 mmHg, respectively. Optimal MAP targets could not be discerned from the plots with flat or complex patterns (Supplemental Figure 4(b) and (c)).
Discussion
In this study, we tested the hypothesis that disturbed CA during the first one to three days in ICU is associated with the subsequent development of delirium in critically ill patients. This was accomplished non-invasively using NIRS, from a sample population that showed a representative prevalence of delirium in the ICU.1,2 We optimized the moving window length parameter used to compute the cerebral oximetry index, COx, which increased its sensitivity for reporting putative periods of CA dysfunction. Our analysis showed that the duration of CA dysfunction early in the ICU stay may be a contributing factor to the development of delirium in subsequent days. Further analyses showed that the COx signal may be clinically useful for identifying optimal MAP values in guiding patient-specific target-oriented therapy.
We recently showed that low rSO2 is an independent risk factor for delirium in critically ill patients. 4 However, the variability in rSO2 among delirious and non-delirious patients was such that a single patient’s rSO2 was not particularly telling of their individual delirium risk. Here, we found that early accumulation of CA dysfunction was associated with the subsequent development of delirium. It is important to note that the computation of COx in the present study differs subtly from previous studies that used COx to monitor CA function.11–13 One key change was that we applied longer moving time windows (e.g. 45 min vs. 5 min) to calculate the time-varying correlation coefficients between rSO2 and MAP. As such, the COx values presented here may reflect a physiological process different from COx found elsewhere in the literature, yet in some way is still related to mechanisms of cerebral blood flow regulation. In this line, we observed that positive COx values were roughly congruent through time in a given recording, across the range of moving window lengths employed. This suggests that the same events are being detected, but with different temporal resolution.
One potential clinical application for COx is to identify optimal patient-specific MAP targets to guide clinical management in real-time. We tested a method previously used to calculate putative MAPOPT targets, whereby COx values are binned by their associated MAP values. The nadir of a U-shaped curve fitted to the data (where MAP is associated with the lowest COx) has been suggested to reflect MAPOPT. However, we found only 9 of 40 patients in our study exhibited U-shaped plots, with the relative nadir of the curves routinely spanning a wide MAP range; COx values were statistically indistinguishable across tens of mmHg, making it impossible to derive precise MAP targets in this way. Inversion of the binning procedure, with COx as the independent variable, provided a different perspective on the relationship between MAP and CA function/dysfunction. We observed putative ‘danger’ and ‘safe’ zones in half the patients (n = 20/40), an improvement on the method described above. We surmise that the different plot patterns observed in our analysis likely relate to the patient’s position on their autoregulation curve, but future studies are required to explore this idea. The average MAP difference between danger and safe zones was ∼8 mmHg, highlighting a blood pressure gap that could be targeted clinically. Danger zones were associated with lower MAP (∼76 mmHg) than safety zones (∼82 mmHg), but both exceeded the MAP target of 65 mmHg recommended for critically ill patients.18,19 This suggests that a one-size-fits-all approach to MAP targets may put patients at risk for suboptimal brain perfusion. It will be necessary to further develop and validate such methods for obtaining MAPOPT before they can be used clinically.
There are a number of potential limitations to our study to consider. A recent study using different oximeters (INVOS-4100 and NIRO-200NX) suggested that up to 35% of the NIRS signal may be contaminated by blood flow in extra-cerebral tissues such as skin. 20 However, the device selected for the present study is the longest commercially available sensor (5 cm), which allows the deepest tissue penetration and reduces the likelihood of extra-cerebral signal contamination and provides a reliable estimate of frontal lobe perfusion. 21 We have also previously demonstrated that the NIRS signal significantly correlates with other metrics of tissue oxygenation in this cohort, such as haemoglobin concentration and central venous O2.4 Our study focussed specifically on the differences between delirious and non-delirious patients. It needs to be acknowledged that disturbances in autoregulation may differ in coma (RASS of −4 or −5), but we could not explore this further given the known heterogeneity of coma (due to sedative medications and/or severity of illness) and our limited sample size (only two patients were comatose for their entire ICU stay; both were excluded from delirium analysis). Sample size limitations also precluded our ability to account for several other factors that could in principle influence the relationship between MAP and rSO2 (e.g. PaO2/FiO2, central venous pressure, acid-base status, Hb, effect of specific vasopressors, etc.). We have just started recruiting to the multicentre CONFOCAL-2 Study (NCT03141619, www.clinicaltrials.gov), which is designed to address these important questions. A final limitation of the present study was the once-daily delirium assessments, which provided only a binary (yes/no) picture of delirium. Future studies may benefit from quantification of delirium severity, with tools such as the CAM-ICU-7. 22
The fact that rSO2 was recorded for the first 24-72 h of critical illness, but delirium screening occurred throughout the ICU stay may be viewed as a potential limitation of our study. Importantly, however, it was not our hypothesis that low tissue oxygenation or disturbed CA temporally correlates with the incidence of delirium. Specifically, our hypothesis was that during the early period of critical illness (i.e. when patients are the most ill), the brain is exposed to poor oxygenation, with altered perfusion due to abnormal CA. These acute alterations in cerebral perfusion and oxygenation may expose the brain to the subsequent risk of developing delirium. Our findings of early disturbances in CA correlating with duration of ICU delirium are consistent with this hypothesis; however, these results will need to be validated in a larger cohort.
Supplemental Material
Supplemental material for Dysfunctional cerebral autoregulation is associated with delirium in critically ill adults
Supplemental material for Dysfunctional cerebral autoregulation is associated with delirium in critically ill adults by Kevin FH Lee, Michael D Wood, David M Maslove, John G Muscedere and J Gordon Boyd in Journal of Cerebral Blood Flow & Metabolism
Footnotes
Funding
The author(s) disclosed receipt of the following financial support for the research, authorship, and/or publication of this article: This work was funded by Physician Services Incorporated and the Southeastern Ontario Academic Medical Organization New Clinician Scientist Program for which JGB was the recipient. The funding agencies had no role in the design, data collection or analysis in this study.
Acknowledgments
The authors would like to thank the study coordinators, Ms. Miranda Hunt, Ms. Tracy Boyd, and Ms. Ilinca Georgescu. We would also like to thank Dr. Yoanna Skrobik for her thoughtful commentary on our manuscript through internal peer-review, as part of the Canadian Critical Care Trials Group policy.
Declaration of conflicting interests
The author(s) declared the following potential conflicts of interest with respect to the research, authorship, and/or publication of this article: Dr. John Muscedere is the scientific director of the Canadian Frailty Network. Dr. J. Gordon Boyd receives a stipend from the Trillium Gift of Life Network for his role as Regional Medical Lead. All other authors report no conflicts.
Authors’ contributions
KL was responsible for data analysis, drafting, and editing of the manuscript. MW performed the daily delirium screening, and was involved in manuscript editing. DM was involved in the inception of the project, and was involved in manuscript drafting and editing. JM was involved in the inception of the project, and was involved in manuscript drafting and editing. JGB is the principal investigator, and was involved in the inception of the project, data collection and analysis, manuscript drafting and editing.
References
Supplementary Material
Please find the following supplemental material available below.
For Open Access articles published under a Creative Commons License, all supplemental material carries the same license as the article it is associated with.
For non-Open Access articles published, all supplemental material carries a non-exclusive license, and permission requests for re-use of supplemental material or any part of supplemental material shall be sent directly to the copyright owner as specified in the copyright notice associated with the article.