
Abstract
Cerebral metabolic rate of oxygen (CMRO2) can be assessed quantitatively using 15O2 and positron emission tomography. Determining the arterial input function is considered critical with regards to the separation of the metabolic product of 15O2 (RW) from a measured whole blood. A mathematical formula based on physiologic model has been proposed to predict RW. This study was intended to verify the adequacy of that model and a simplified procedure applying that model for wide range of species and physiologic conditions. The formula consists of four parameters, including of a production rate of RW (k) corresponding to the total body oxidative metabolism (BMRO2). Experiments were performed on 6 monkeys, 3 pigs, 12 rats, and 231 clinical patients, among which the monkeys were studied at varied physiologic conditions. The formula reproduced the observed RW. Greater k values were observed in smaller animals, whereas other parameters did not differ amongst species. The simulation showed CMRO2 sensitive only to k, but not to others, suggesting that validity of determination of only k from a single blood sample. Also, k was correlated with BMRO2, suggesting that k can be determined from BMRO2. The present model and simplified procedure can be used to assess CMRO2 for a wide range of conditions and species.
Introduction
Cerebral metabolic rate of oxygen (CMRO2) can be quantitatively assessed using 15O-labeled oxygen (15O2) and positron emission tomography (PET). This technique is based on an estimation of influx rate of 15O2 to the cerebral tissue from arterial blood. Using information of cerebral blood flow (CBF) that may be obtained either from a separate scan with 15O-labeled water (H215O) or from the clearance rate 15O2 of tissue, the oxygen extraction fraction (OEF) can also be calculated. The arterial input function must be determined before beginning this calculation. More specifically, a metabolic product of 15O2 in the arterial blood, as a form of 15O-labeled water (i.e., recirculating 15O-water or RW) needs to be accurately estimated.
The arterial whole blood radioactivity curve can be obtained by measuring the radioactivity concentration of continuously withdrawn whole blood using a monitoring device (Eriksson et al, 1988; Eriksson and Kanno, 1991; Votaw and Shulman, 1998; Kudomi et al, 2003). Assessment of a time-dependent RW curve may be achieved by separating the plasma from the whole blood samples. This, however, requires labor-intensive procedures of frequent, manual arterial blood samplings, the centrifugation of all collected blood samples, and radioactivity measurements for both whole blood and plasma (Holden et al, 1988).
Ohta et al (1992) proposed to neglect the component of RW from the arterial input function. This technique fits three parameters of CMRO2, CBF, and cerebral blood volume (CBV) to the kinetic 15O2 data obtained from a single PET scan after the bolus administration of 15O2. To minimize errors which result from neglecting RW, only the initial 3 mins of data after the bolus inhalation of 15O2 were used when calculating the parameters. This approach has been applied to evaluate the magnitude of increase in CMRO2 relative to that in CBF during cognitive stimulation tasks (Fujita et al, 1999; Vafaee and Gjedde, 2000; Okazawa et al, 2001a, b ; Yamauchi et al, 2003; Mintun et al, 2002), but one of the drawbacks to this technique is the lack of accurate statistics, which is due to the use of a short scan duration.
Iida et al (1993) have developed a mathematical formula to predict the production of RW based on a physiologic model, which allows prolongation of the PET acquisition period with an additional statistical accuracy. The formula assumes a fixed rate constant for production of RW from 15O2 in the body. This is based on the fact that the observed rate constant did not vary among clinical subjects, and thus causes nonsignificant errors in CMRO2. However, the study is limited only to human subjects studied at rest, and results have not been verified using other species such as rat and mouse (Magata et al, 2003; Temma et al, 2006; Yee et al, 2006). Also, the findings have not been evaluated on humans who are under physiologic stress, though under such conditions the whole-body oxygen consumption is expected to change. Moreover, it is important to extend the approach to physiologically stressed conditions as recent progress for assessing CMRO2 and CBF simultaneously from a short period dynamic scan by using a dual tracer autoradiography (DARG) (Kudomi et al, 2005). The DARG has enabled the 15O2 PET to assess CMRO2 and CBF simultaneously at various physiologically activated conditions.
The aim of this study is to verify the method used to estimate the arterial RW during the 15O2 inhalation for simultaneous determination of CMRO2 and CBF from the rapid procedures of 15O2 PET. The feasibility of a simplified procedure is also being investigated. Applicability of this approach was tested for a wide range of species under various physiologic conditions. Experiments were designed to apply for different species as well as different physiologic conditions. A simulation study was also performed to evaluate the level of error sensitivity associated with this approach.
Materials and methods
Theory
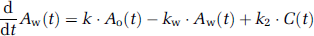
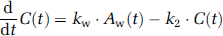
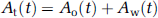
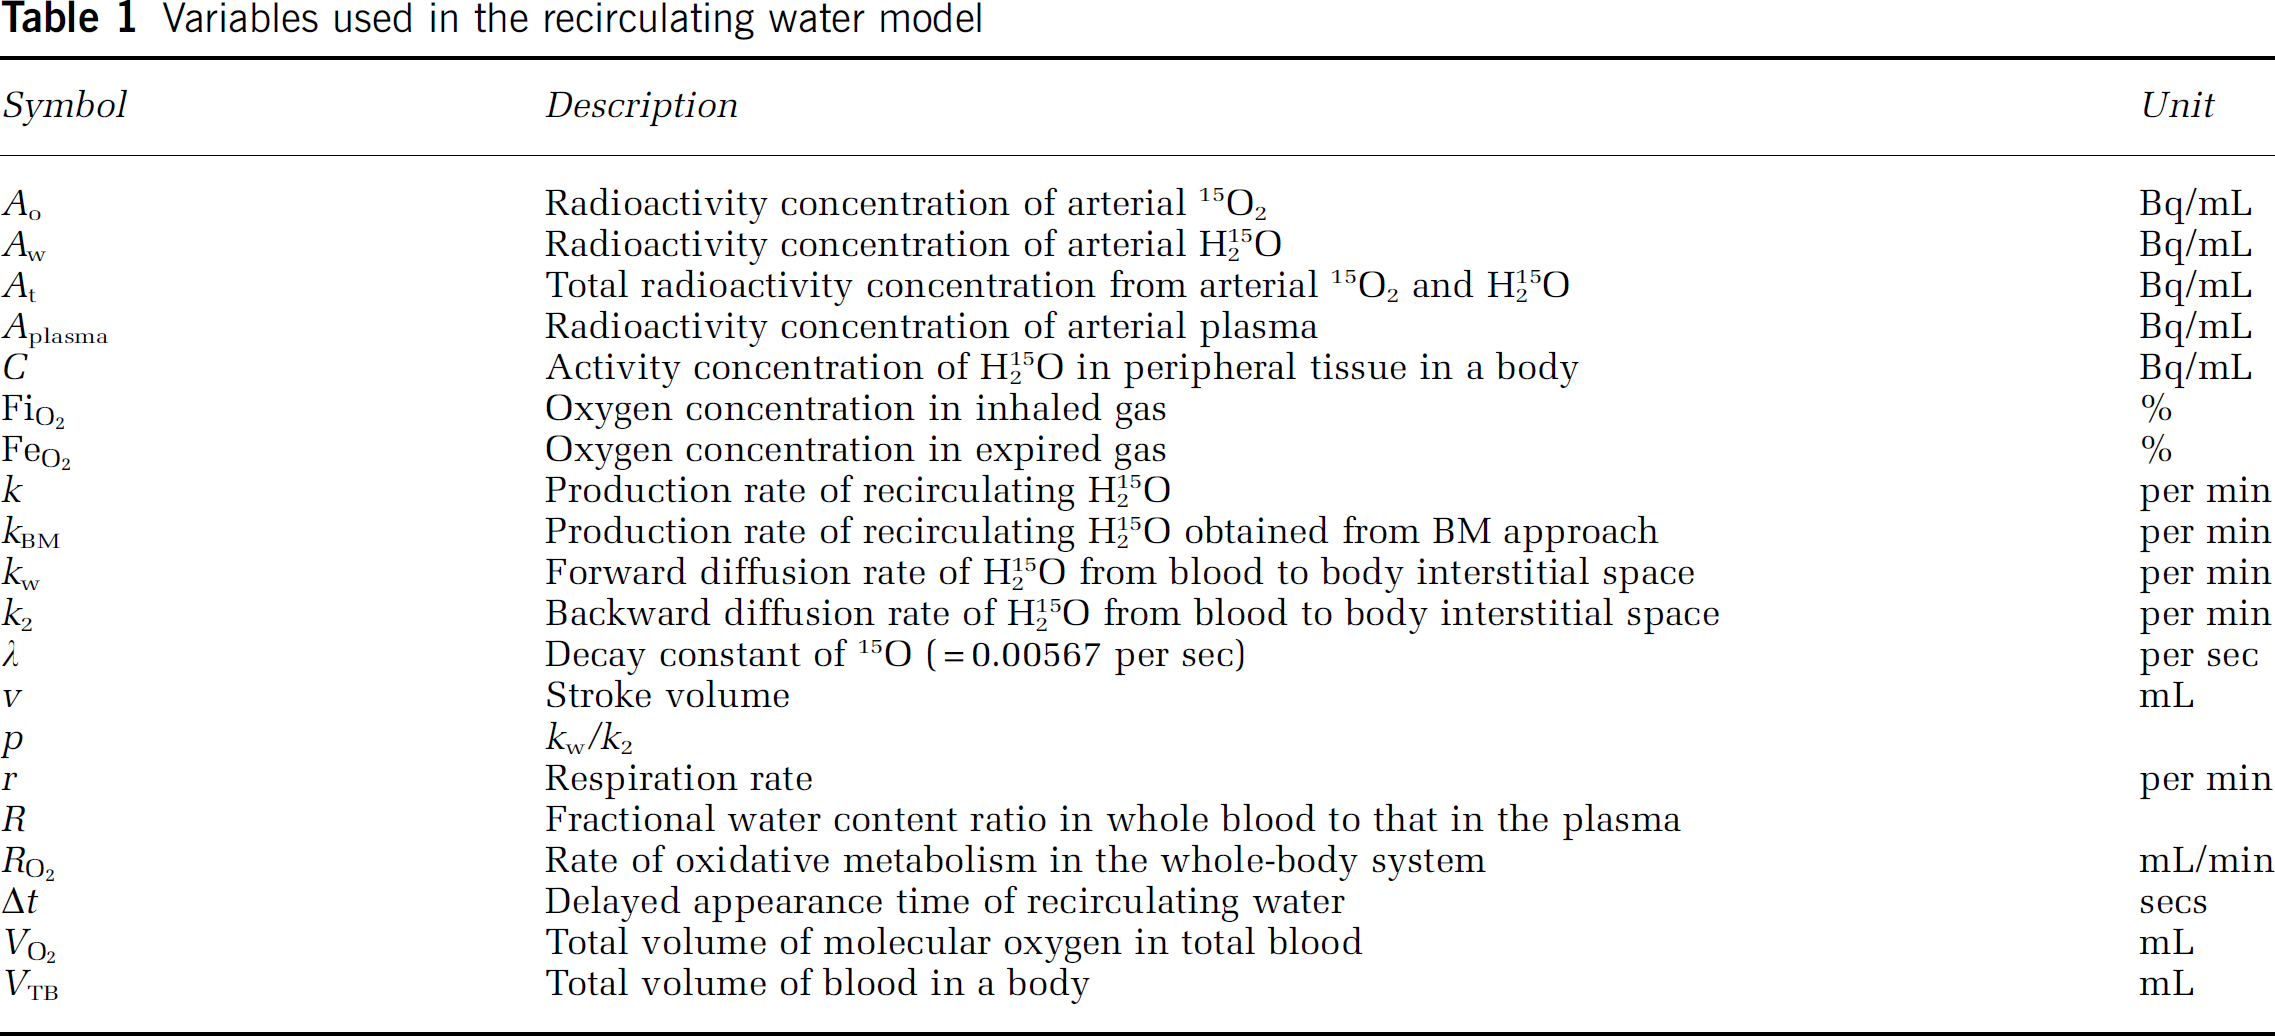
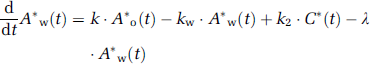
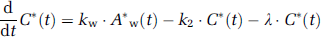
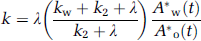
Variables used in the recirculating water model are summarized in Table 1. The mathematical model that formulates the time-dependent RW in arterial blood consists of three rate constants: (1) the production rate of RW or k (per min), proportional to oxidative metabolism in the total body system (BMRO2), (2) the forward diffusion rate (kw, per min) of the metabolized 15O-water between the blood and interstitial spaces in the body, and (3) the backward diffusion rate (k2, per min) of the metabolized 15O-water between the blood and interstitial spaces in the body. The differential equations for the arterial activity concentration of 15O-water at a time t (secs) (Aw(t), Bq/mL), after the physical decay correction can be expressed as follows (Huang et al, 1991):
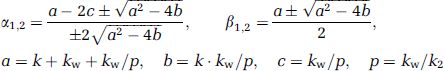
Variables used in the recirculating water model
Following four approaches were performed to determine the rate constants and Aw(t).
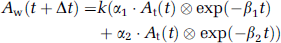
Approach by four parameters fitting: Four parameters, k, Δt, kw, and p (= kw/k2), can be determined from the observed RW (Aw(t)) and the At(t) curves by means of the nonlinear least square fitting (4PF approach).
Approach by one parameter fitting: Once three parameters, Δt, kw, and p, are fixed by averaging values determined by the 4PF approach, k can then be determined by fitting the Equation 2 to measured Aw(t) from At(t) (1PF approach). In this procedure, single datum is sufficient, and thus k can be determined from At(t) and the RW counts sampled at a single time point.
Approach from steady-state condition: Similarly to the 1PF procedures, k can be determined from the steady state condition, which is achieved by a continuous administration of 15O2 as follows (SS approach). Incorporating the decay constant of 15O (λ = 0.00567 per secs) into Equations 1a and 1b provides:
Thus, the following equations hold:


Given the values of kw and k2 which are determined as averages of 4PF, k can be calculated from the arterial 15O2 and H215 concentrations at steady state as follows:
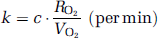
Approach by the rate of whole body oxidative metabolism: In this study, an alternative approach is provided to obtain k, from the rate of oxidative metabolism in the whole-body system (BM approach). With this alternative approach, we assume that the production rate of RW or k is proportional to the rate of oxidative metabolism in the whole-body system (i.e., BMRO2 (RO2, mL/min)). The rate of oxidative metabolism may change dependent on physiologic status of the subject. In addition, we assumed that this index can be defined from the difference of oxygen concentration between inhaled and exhaled trachea air samples. Therefore, the above can be expressed as follows:
Simulation
A series of simulation studies were performed to investigate the effects of errors on estimated CMRO2 value in the model parameters (k, Δt, kw, and p). In these simulations, a typical arterial blood time activity curve (TAC) of 15O2 and H215 after DARG protocol (Kudomi et al, 2005) obtained in a monkey study was used. RW TACs were generated from the whole blood TAC by assuming baseline values of k as 0.13, 0.11, 0.34, and 0.73 per min, Δt as 20, 11, 5, and 3 secs, kw as 0.38, 0.43, 0.98, and 0.87 per min, and p as 1.31, 1.01, 0.98, and 0.83, corresponding to humans, pigs, monkeys, and rats, respectively. Tissue TACs were generated by assuming CBF = 50 mL/min per 100 g and OEF = 0.4 (CMRO2 was defined as: CMRO2 = CBF × OEF ×CaO2, where CaO2 is the arterial oxygen content. This simulation was intended to investigate magnitude of error as a percentage difference, so that arbitrary value of CaO2 was assumed) (Hayashi et al, 2003), using a kinetic formula for oxygen and water in the brain tissue (Mintun et al, 1984; Shidahara et al, 2002; Kudomi et al, 2005). CMRO2 values were calculated by the DARG method (Kudomi et al, 2005), in which RW TACs were separated from the whole blood by changing k from 0.0 to 1.0 per min, Δt from 0 to 30 secs, kw from 0.0 to 2.0 per min, and p from 0.0 to 2.0, respectively. Errors in the estimated CMRO2 were presented as a percentage difference from the assumed true values.
Subjects
Subjects consisted of four groups including monkeys, pigs, rats, and clinical patients. Monkeys were six healthy macaca fascicularis with body weight of 5.2 ± 0.8 kg and age ranging from 3- to 4-year old. Pigs were three farm pigs with body weight of 38 ± 9 kg and age from 4 to 12 months. Rats were 12 male Wistar rats with body weight of 300 ± 54 g and age from 7 to 8 weeks. All animals were studied during anesthesia. The animals were maintained and handled in accordance with guidelines for animal research on Human Care and Use of Laboratory Animals (Rockville, National Institute of Health/Office for Protection from Research Risks, 1996). The study protocol was approved by the Subcommittee for Laboratory Animal Welfare of National Cardiovascular Center.
Human data were retrospectively sampled from an existing database at National Cardiovascular Center which documented subjects who underwent PET examination after the 15O-steady-state protocol. There were 231 total samples, with body weight and age ranging from 58 ± 10 kg, and 63 ± 14 years, respectively. Only the arterial 15O2 and H215 radioactivity concentrations measured at the steady-state condition were used for the present analysis.
Experimental Protocol
The six monkeys were anesthetized using propofol (4 mg/kg/h) and vecuronium (0.05 mg/kg/h) assigned as a baseline in contrast to the after physiologically stimulated conditions. Animals were intubated and their respiration was controlled by an anesthetic ventilator (Cato, Drager, Germany). Each monkey inhaled 2,200MBq 15O2 for 20 secs. After 3 mins, the monkeys were injected with 370MBq H215 for 30 secs by the anterior tibial vein. This was aimed at assessing both CBF and CMRO2 according to the DARG technique (Kudomi et al, 2005). At 30 secs before inhaling 15O2 to the monkeys, arterial blood was withdrawn from the femoral artery for 420 secs at a rate of 0.45 mL/min using a Harvard pump (Harvard Apparatus, Holliston, MA, USA). The whole blood TAC was measured with a continuous monitoring system (Kudomi et al, 2003) and the At(t) was obtained. Meanwhile, we also manually obtained 0.5mL of arterial blood samples from the contralateral femoral artery at 30, 50, 70, 90, 110, 130, 160, 190, and 360 secs after the 15O2 inhalation. For the analysis of sampled blood, 0.2mL of the blood were used for measurement of the radioactivity concentration of the whole blood, and the rest of the blood sampled (~0.3 mL) was immediately centrifuged for separation to measure the plasma radioactivity concentration (Aplasma(t), Bq/mL). The radioactivity concentration was measured using a well counter (Molecular Imaging Laboratory Co. Ltd, Suita, Japan).
In two monkeys, anesthetic level was changed by altering the injection dose of propofol from 4 (baseline) to 8 and then to 12 and 16 mg/kg/h in one monkey, and to 5 and then to 7, 10, and 15 mg/kg/h in the other. In another monkey, PaCO2 level was varied from 39 (baseline) to 47, and then to 33, 26, and 42 mmHg by changing the respiratory rate. Each measurement for 15O2 inhalation and H215 injection was initiated after at least 30 mins of applying the physiologic stimulation to achieve a steady state. All procedures were the same as those for the baseline, with the exception of the manual blood sample, which was obtained only once at 70 secs.
Before and after 6 mins of the 15O2 inhalation, oxygen concentration in both inhaled (FiO2, %) and end-tidal expiratory gas (FeO2, %) was measured by the anesthetic ventilator in five out of the six monkeys. Using the respiration rate (r, per min) and the stroke volume (v, mL) indicated on the ventilator, the BMRO2 (RO2 mL/min) was calculated using the following equation:

All monkeys received a PET measurement to assess the CMRO2 at physiologically baseline condition. The scan protocol followed the DARG technique (Kudomi et al, 2005) in which a 6-mins single dynamic PET scan was performed in conjunction with the administration of dual tracers (i.e., 15O2 followed by H215 after a 3-mins interval). PET scanner used was ECAT HR (Siemens-CTI, Knoxville, TN, USA), which provided 47 tomographic slice images for an axial field-of-view of approximately 150 mm. We performed arterial—sinus blood sampling to obtain a global OEF (OEFA—V) (A—V difference approach). We sampled 0.2mL of arterial and sinus blood simultaneously during each PET scan and measured their oxygen content (CaO2 and CvO2, respectively) (Kudomi et al, 2005). The OEFA—V was calculated as: OEFA—V = (CaO2–CvO2)/CaO2.
With regards to the farm pigs involved in this experiment, we used existing data, which were originally obtained in one of the myocardial projects. During the study, three farm pigs were anesthetized. Anesthesia was induced by ketamine (10 mg/kg) and maintained using propofol (4 mg/kg/h). Animals were intubated and their respiration was controlled by the anesthetic ventilator. Venous blood was labeled with 15O2 using a small artificial lung unit (Magata et al, 2003). 15O2-labeled blood (222 to 700 MBq) was injected for 10 secs via anterior tibial vein. At 30 secs before this injection, arterial blood was withdrawn from the femoral artery at a rate of 0.45 mL/min using the Harvard pump and continued for 420 secs. The whole blood TAC (At(t)) was then measured with a continuous monitoring system (Kudomi et al, 2003). Meanwhile, we manually sampled 0.5mL of arterial blood from the contralateral femoral artery at 30, 60, 90, 90, 120, 180, 240, and 300 secs after the 15O2-labeled blood injection. For the analysis of sampled blood, 0.2mL of the blood were used for measurement of the radioactivity concentration of the whole blood, and the rest of the blood sampled (~0.3 mL) was immediately centrifuged for separation to measure the plasma radioactivity (Aplasma(t), Bq/mL). The radioactivity was measured using the well counter.
Data for rats were also originally obtained for other projects, and only the blood counts were used in this study. Anesthesia was induced with pentobarbital (50 mg/kg). A 10mL of venous blood was labeled 15O2 using a small artificial lung unit as described previously (Magata et al, 2003), and approximately 1mL of 15O2-labeled blood (37 to 74 MBq) was injected for 30 secs via the tail vein. Arterial blood samples of 0.1mL each were obtained from the femoral artery at 5-secs intervals for 60 secs and 10-secs intervals for another 60 secs after the injection. Whole blood radioactivity concentration was measured using the well counter to be used as At(t). Arterial blood samples of 0.2mL each were obtained at 30, 60, 90, and 120 secs, and the plasma radioactivity concentration (Aplasma(t)) was measured by the well counter.
For clinical patients, the blood radioactivity concentration was obtained from previously performed PET examinations, which followed the steady-state protocol (Hirano et al, 1994). Each patient inhaled both 15O2 and C15O2 to reach the steady state with an inhalation dose of approximately 1,200 and 500 MBq/min, respectively. Five to seven arterial blood samples were obtained during the steady state from the brachial artery. Mean values of radioactivity concentration of the whole blood and plasma, At(t) and Aplasma(t), respectively, were obtained for both 15O2 and C15O2 PET examination.
Data Analysis
Using the blood activity data obtained from monkeys, pigs, and rats at baseline conditions, k as well as Δt, kw and p were first determined by the 4PF approach, in which Equation 2 was applied to fit the Aw(t) using the observed At(t). Because the solubility of the oxygen is negligibly small in the plasma, we assumed that all radioactivity in plasma fraction comes from H215 and that the water content ratio of whole blood to plasma (R) does not change during measurement, which means that the kinetics of water molecules immediately reach equilibrium between the plasma and the cellular fraction (Mintun et al, 1984; Iida et al, 1993). Thus, Aw(t) was obtained from the equation: Aw(t) = Aplasma(t)·R, where R value was obtained from the sampled blood at the end of the scan (at which all the radioactivity in the blood can be considered as coming from H215 because inhaled 15O2 is all metabolized).
Given that the values of Δt, kw, and p were averages determined from 4PF for monkeys, pigs, and rats, only k was determined by fitting Equation 2 to Aw. This was calculated at various points in time, more specifically, in 30, 50, 70, 90, 110, 130, 160, and 190 secs for monkeys, in 30, 60, 90, 90, 120, 180, and 240 secs for pigs, and in 30, 60, 90, and 120 secs for rats. The optimal time point for k under the 1PF approach was determined, so that (k4PF–k1PF)/k4PF reaches a minimal value. Here, k4PF and k1PF denote k values determined by the 4PF and 1PF approaches, respectively. The values of k in monkeys at baseline condition, together with those in pigs and rats were compared between 4PF and 1PF approaches, in which a k value from the optimal single time point was used.
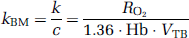
In three of the monkeys, which were physiologically stimulated, k of 1PF approach was obtained using single time point of Aw. Assuming the total blood volume (VTB) for monkeys as 360mL (Lindstedt and Schaeffer, 2002), and using Hb as measured value in each experiment, kBM was calculated from RO2 according to Equation 7b. Then, kBM obtained as: kBM = 0:00204RO2 was compared with k determined by 1PF.
For clinical data obtained from the steady-state (SS approach) PET examinations, Equation 6 was used to determine the k values of the SS approach for each patient, in which values of kw and k2 were 0.38 and 0.29 per min as obtained in a previous work by Huang et al (1991).
CMRO2 and OEF values in monkeys at baseline condition were calculated using the RW TACs obtained by four different methods (i.e., directly measured Aw(t) (n = 6), 4PF (n = 6), 1PF (n = 6), and BM approaches (n = 5)). Regions-of-interest were selected for over the whole brain, and CMRO2 and OEF values were obtained in those regions-of-interest. The CMRO2 values compared among the four methods mentioned above to estimate RW TACs. The Bland—Altman method was applied to analyze the agreement of OEF values between the methods. Also, OEF values were compared with OEFA—V.
All data were presented as mean±1 standard deviation. Student's t-test was used and Pearson's regression analysis was applied to compare two variables. A probability value of < 0.05 was considered statistically significant.
Results
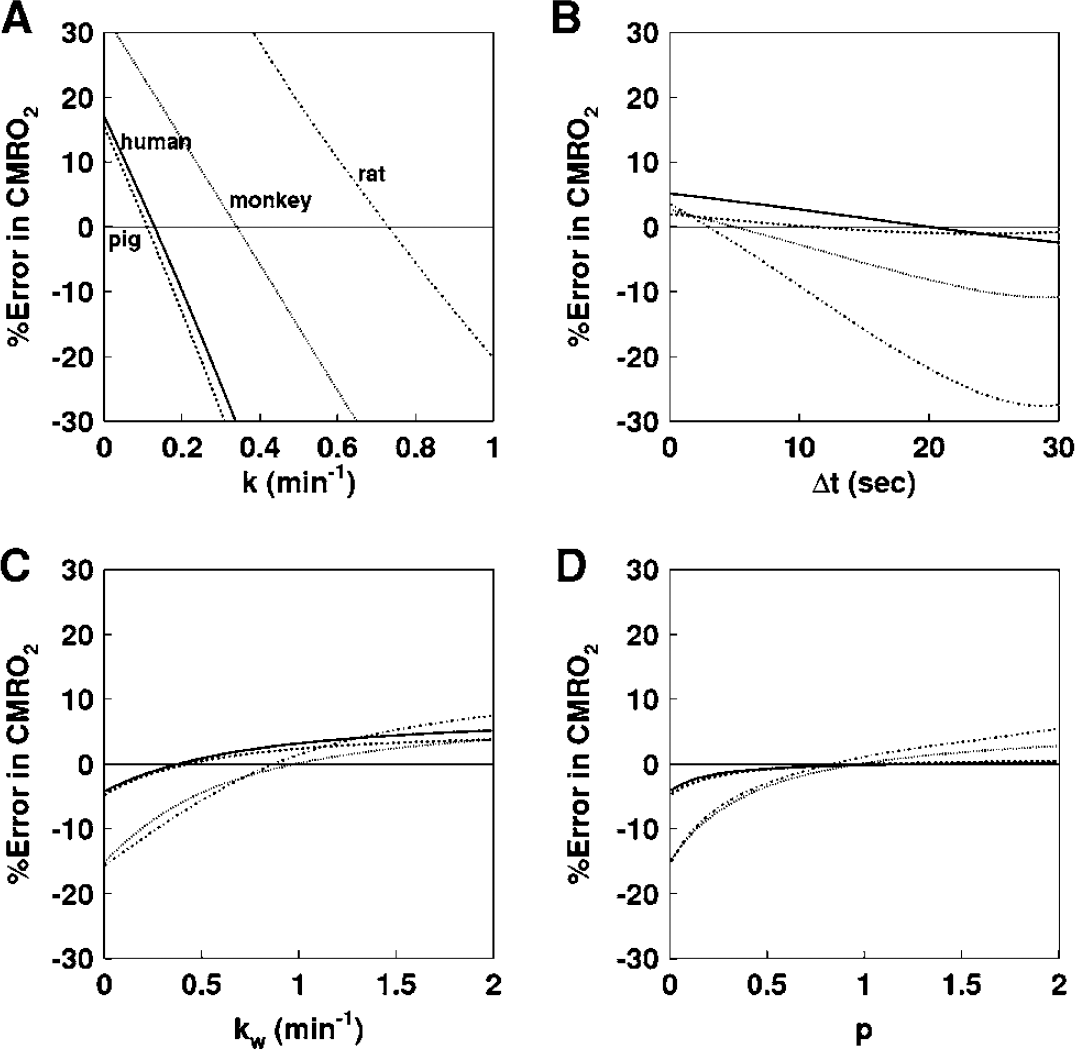
Figure 1 shows results from the simulation study, and shows the magnitude of errors in CMRO2 calculated by the DARG method as well as errors in the parameters, k, Δt, kw, and p. Errors in CMRO2 were most sensitive to errors in k amongst all species, namely the production rate constant of RW in the arterial blood. After errors in k, errors in CMRO2 were sensitive to errors in Δt. Errors in kw and p, however, appeared to cause relatively insignificant errors in CMRO2. More specifically, only 5 to 10% errors are caused in CMRO2 by a change of ±50% in kw and p.
Error in CMRO2 values due to errors in (
Figures 2A–2C show examples of the arterial whole blood curves (At) and RW TAC (Aw) observed in typical studies on a monkey, a pig, and a rat, respectively. The RW curves became constant after a period in all species. The rise time or appearance of the RW curves, Aw(t), was significantly delayed compare to that of whole blood curve, At(t). Aw(t) curves fitted by 4PF well reproduced the measured RW curves in three species: monkeys, pigs, and rats. Table 2 summarizes values of k, Δt, kw, and p obtained by the four parameter fitting (4PF approach), at the baseline for monkeys, pigs, and rats, and also k value obtained by the steady-state formula for clinical patients. Those comparisons showed that the k was significantly different among species (P < 0.001) except between pig and human subjects, and it was significantly lower in smaller animals. Likewise, Δt showed significant differences among the three species (P < 0.001), and it was also lower in smaller animals.
Averaged values of k, Δt, kw, and p for monkeys, pigs, rat, and human subjects under baseline condition
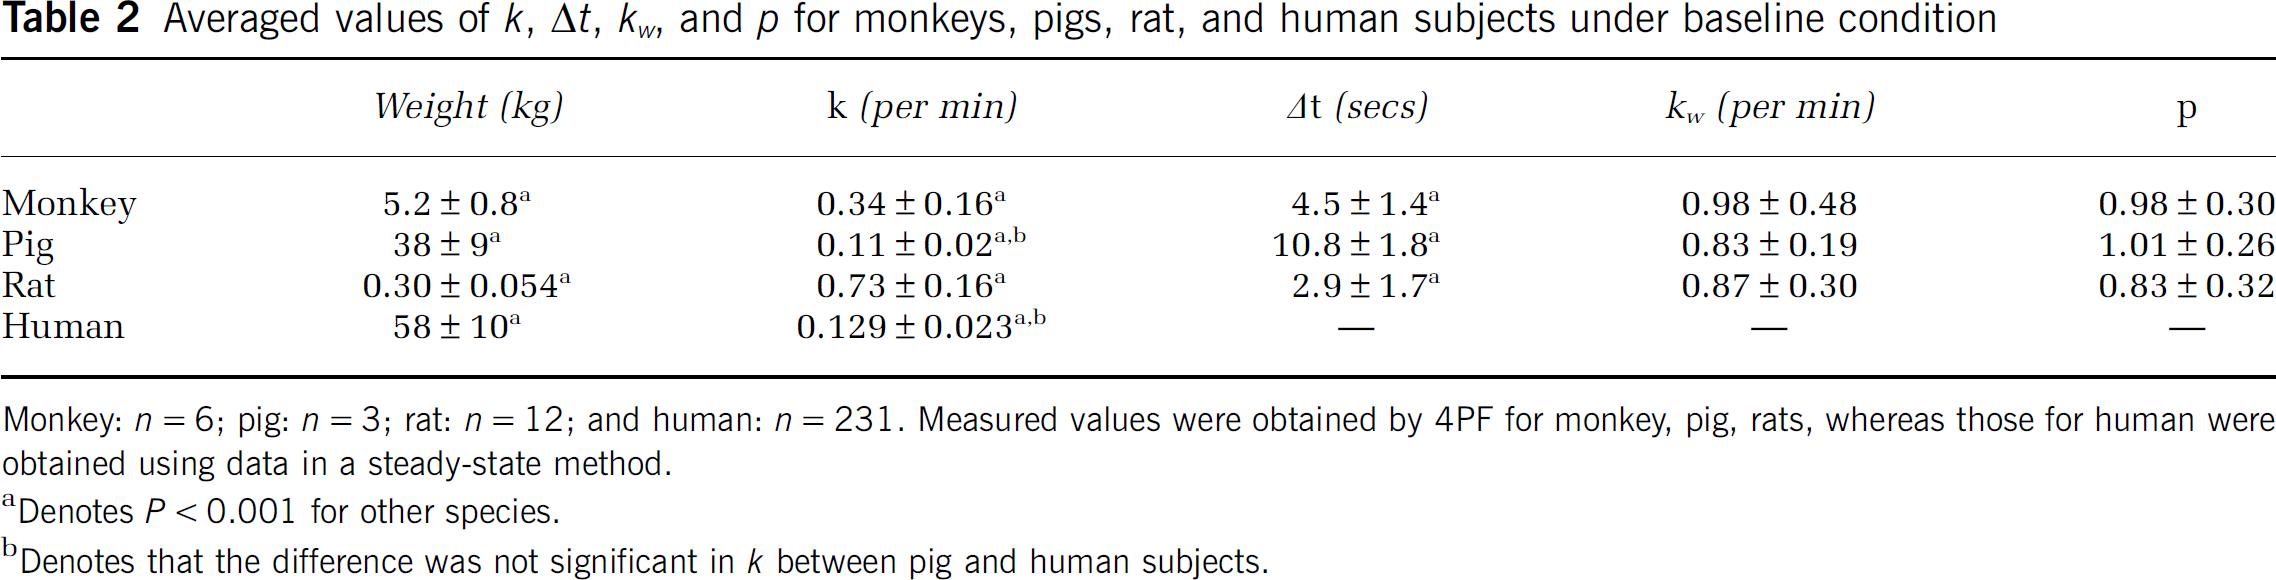
Monkey: n = 6; pig: n = 3; rat: n = 12; and human: n = 231. Measured values were obtained by 4PF for monkey, pig, rats, whereas those for human were obtained using data in a steady-state method.
Denotes P<0.001 for other species.
Denotes that the difference was not significant in k between pig and human subjects.
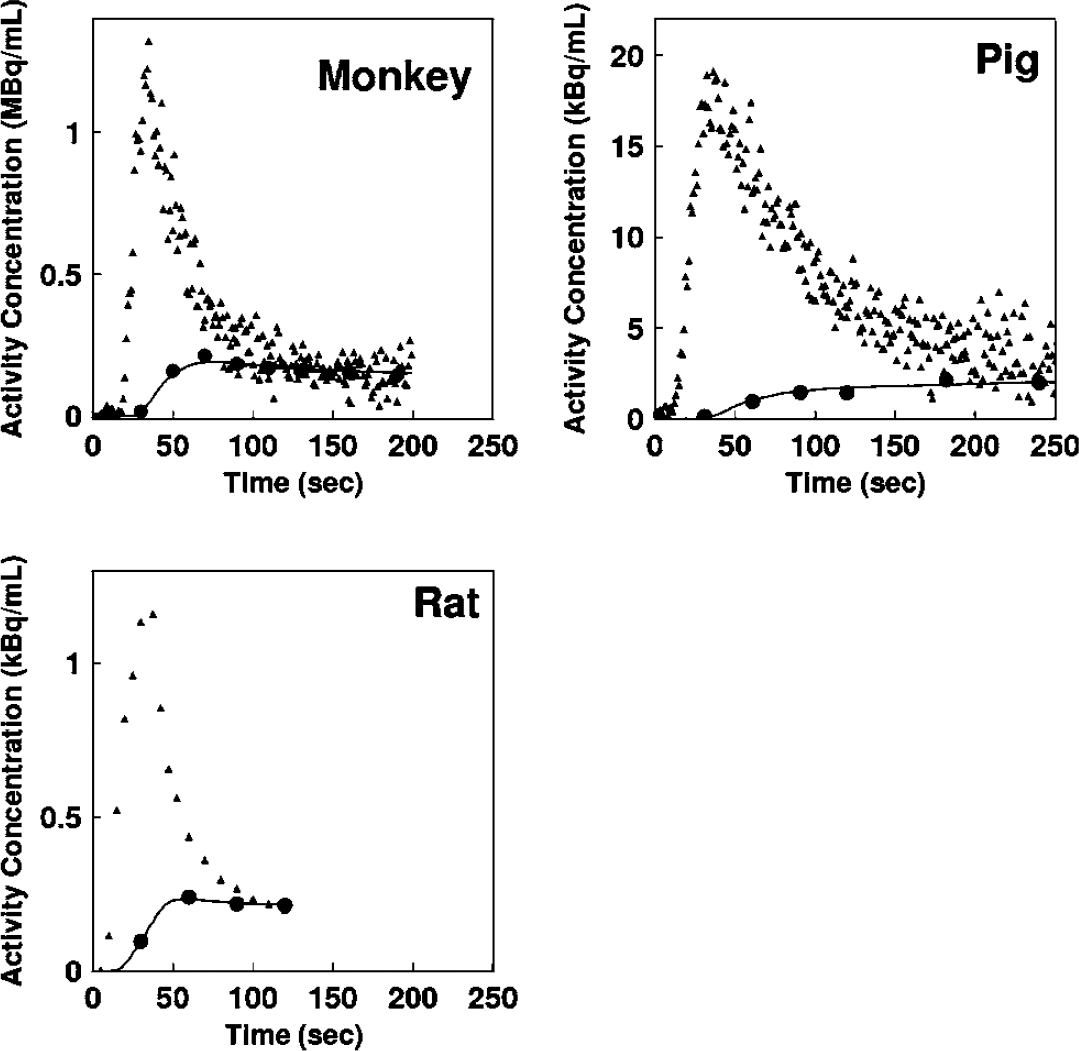
Representative comparison of the measured arterial whole blood and RW time activity curves for monkey, pig, and rat. Closed triangles and closed circles represent the measured whole blood and RW time activity curves, respectively. Estimated time activity curves by 4PF approach were also plotted in a solid line, and indicated a good agreement with the measured one.
Table 3 summarizes k and CMRO2 values obtained from a series of PET experiments performed on six monkeys at baseline condition, and for increased anesthesia (in two monkeys), and changed PaCO2 levels (in one monkey). The best agreement of k values between 4PF and 1PF approaches was obtained from the blood sample data taken at 60, 70, and 60 secs in pigs, monkeys, and rats, respectively, and was used in the 1PF approach. With this optimized calibration protocol, k values were in a good agreement between 4PF and 1PF approaches. As shown in Figure 3, the regression analysis showed significant correlation for 21 animals including 6 monkeys, 3 pigs, and 12 rats (P < 0.001), and there was no significant difference between the two variables. Figure 4 shows that k values calculated by the 1PF approach (at an optimized time) were in a good agreement with those calculated with the BMRO2. Namely, the regression analysis showed significant correlation (P < 0.001, n = 16) and also that there was no significant difference between the two variables. Note that, in the CMRO2 calculation by BMRO2, k values were normalized according to the regression line shown in Figure 4. It should also be noted that calculated CMRO2 values at the baseline shown in Table 3 were not significantly different among the four techniques. The average (±s.d.) values of obtained OEF were 0.53 ± 0.08, 0.52 ± 0.09, 0.54 ± 0.08, 0.54 ± 0.09, and 0.56 ± 0.04 from A—V difference, directly RW measured approach, 4PF, 1PF, and BM approaches, respectively. The Bland—Altman analysis of OEF values between from A—V difference and from others showed small over/underestimation, that is., with bias±s.d. of −0.02 ± 0.09, 0.01 ± 0.07, 0.01 ± 0.08, and 0.02 ± 0.09, by direct RW, 4PF, 1PF, and BM approaches, respectively. Neither of the current methods (direct RW, 4PF, 1PF, and BM) was significantly different from A—V difference approach.
Values of k and CMRO2 in the whole brain region for monkeys under physiologically baseline and stimulated conditions
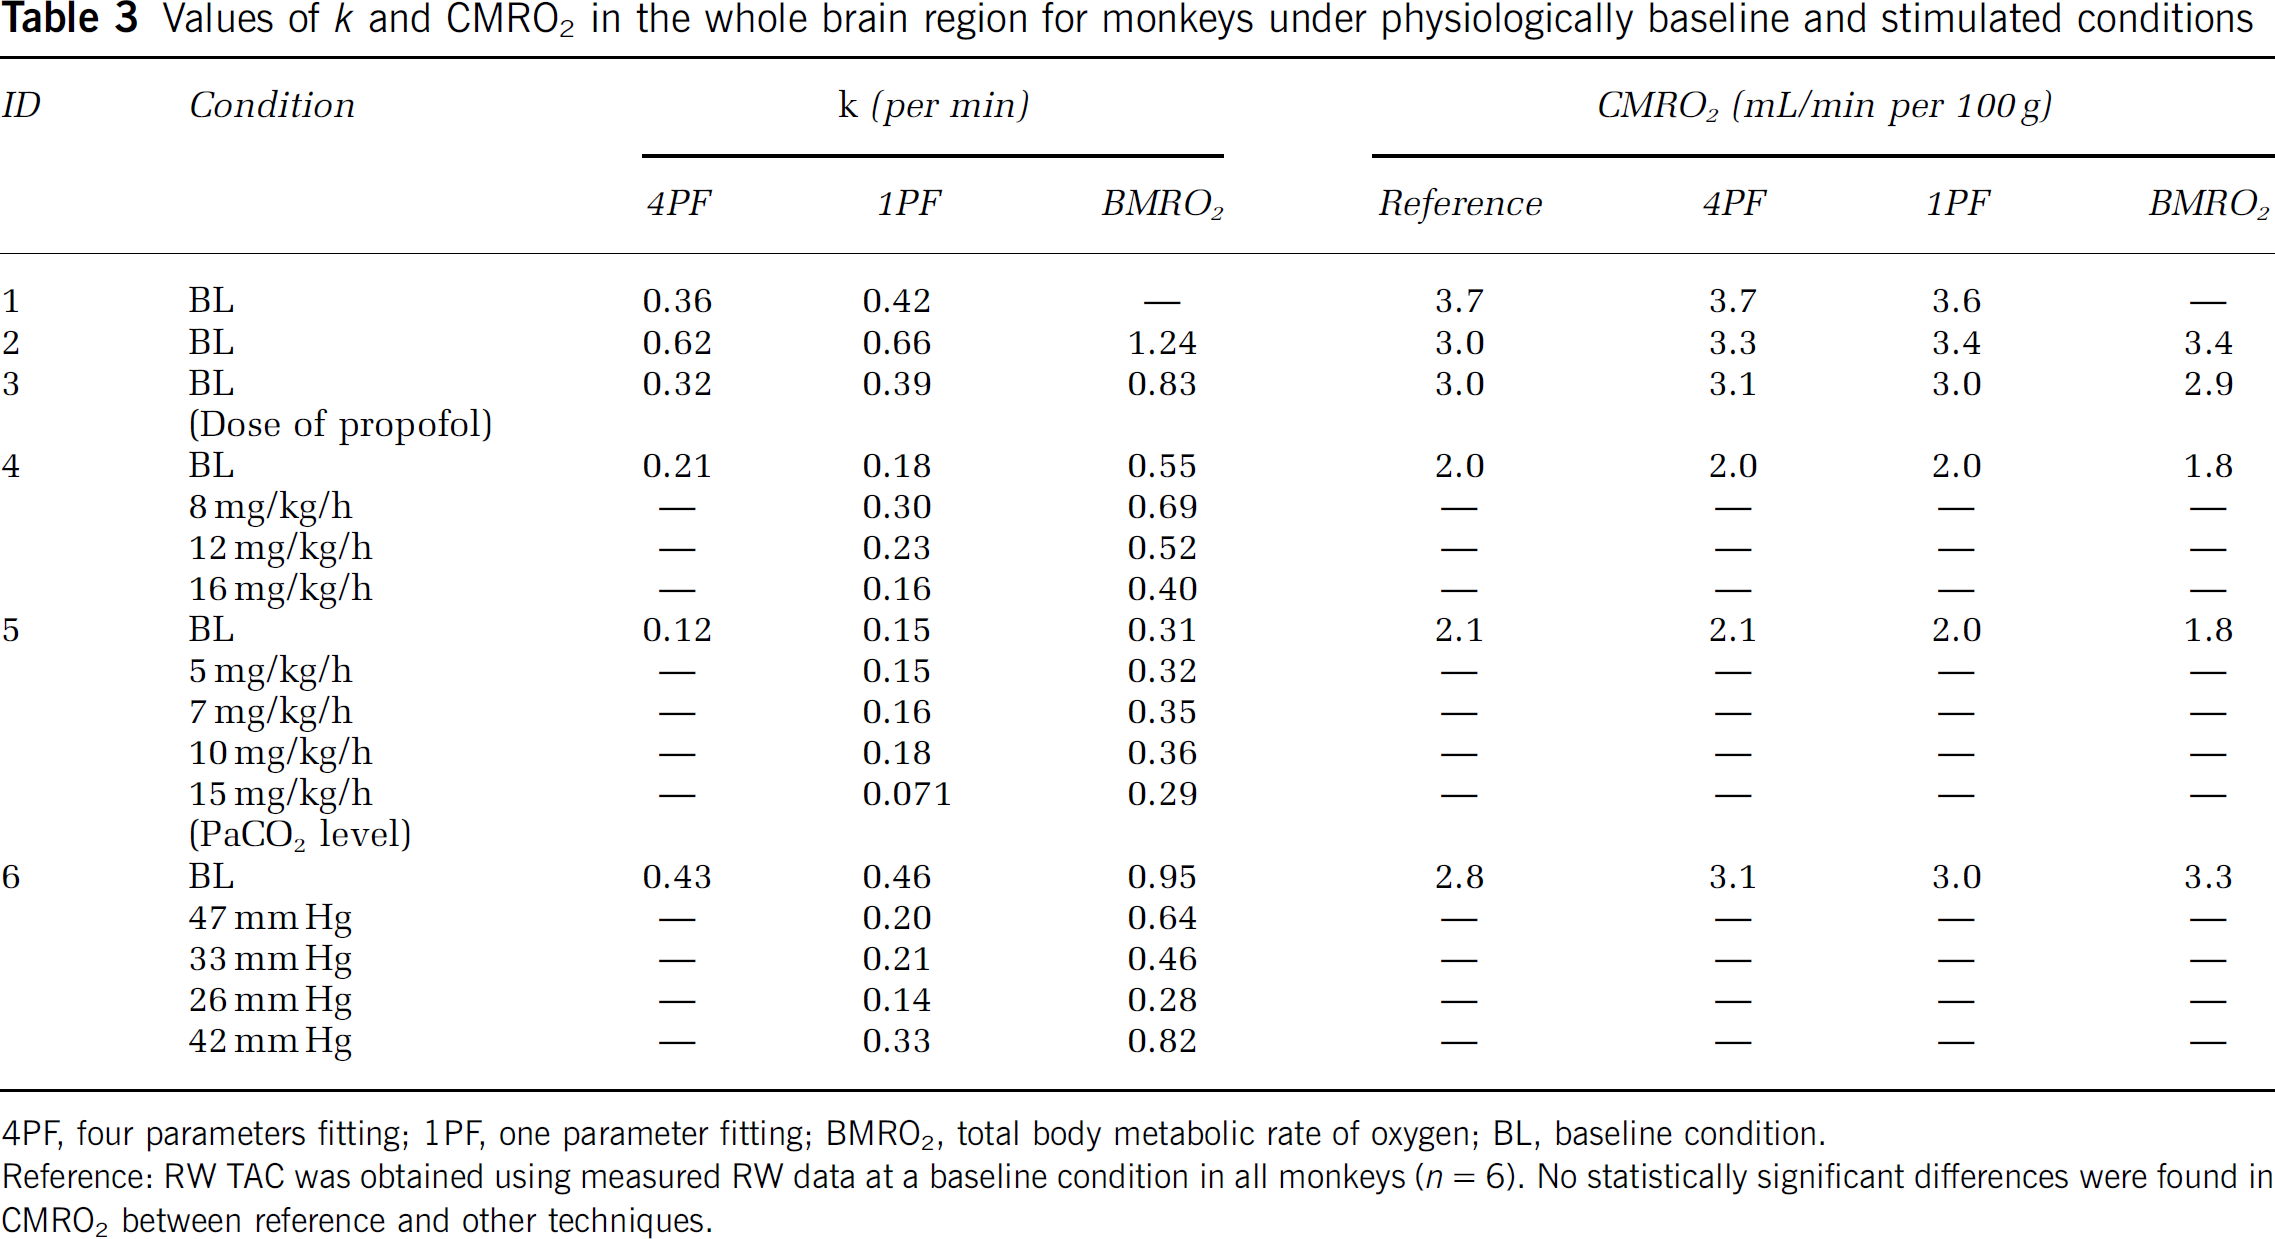
4PF, four parameters fitting; 1PF, one parameter fitting; BMRO2, total body metabolic rate of oxygen; BL, baseline condition.
Reference: RW TAC was obtained using measured RW data at a baseline condition in all monkeys (n = 6). No statistically significant differences were found in CMRO2 between reference and other techniques.
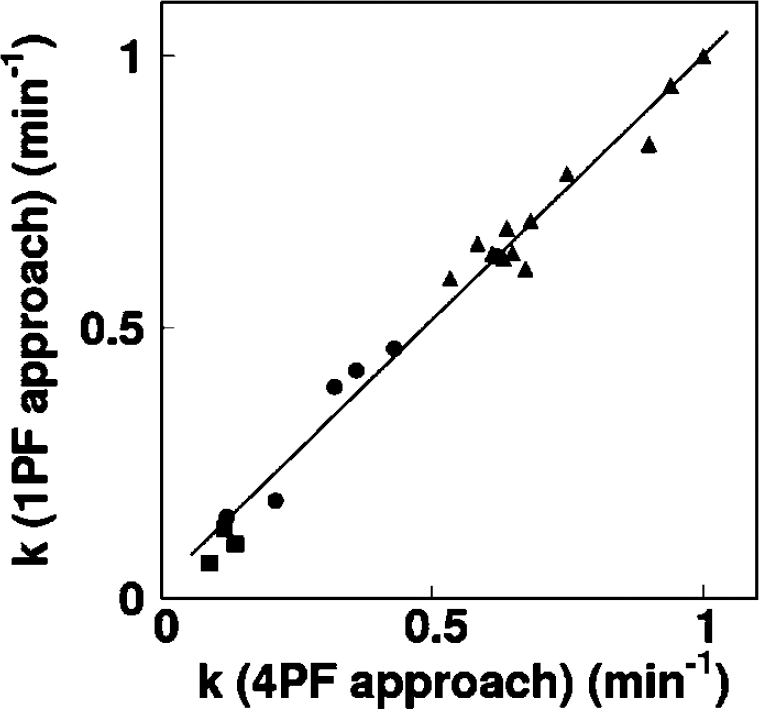
Comparison of the production rates of RW (k, per min) obtained by 4PF and those by 1PF. Squares, circles, and triangles correspond to pigs, monkeys, and rats, respectively. The regression line was y = 0.97x+0.026 (per min) (r = 0.98).
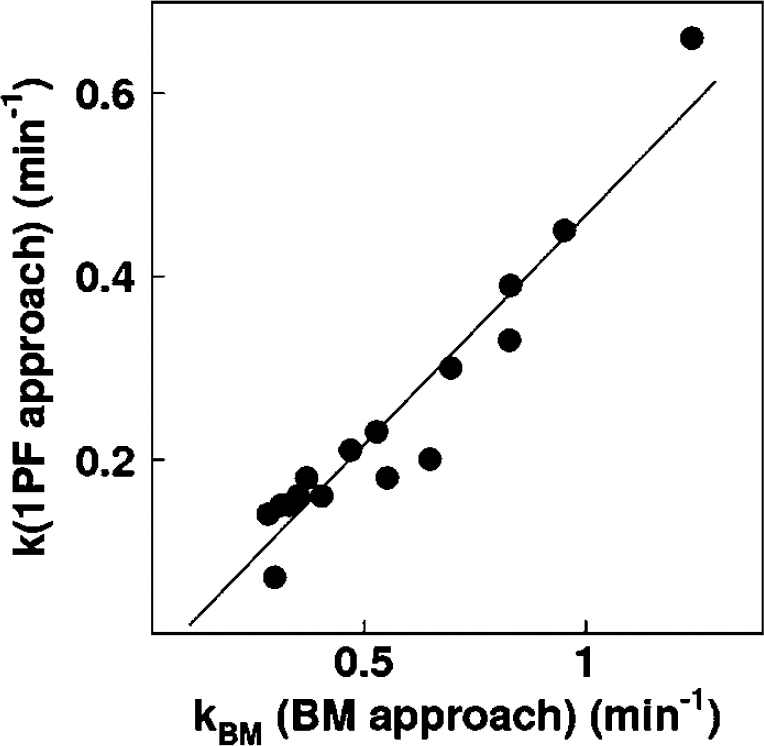
Comparison of the production rates of RW obtained by BM approach and those by 1PF approach in five monkeys at various anesthetic and PaCO2 levels. The regression line was y = 0.50x–0.034 (per min) (r = 0.95).
Discussion
Our study showed that the mathematical formula based on the physiologic model that reproduced the time-dependent concentration of RW in the arterial blood after a short-period inhalation of 15O2 is indeed adequate. Our approach also simplified the procedures for sequential assessment of RW in 15O2 inhalation PET studies, although previous approaches required frequent blood samples and centrifuges of each arterial blood sample. The present approach is an extension of a previous study by Iida et al (1993) and Huang et al (1991). It is essential if one intends to apply the rapid 15O2 PET technique (Kudomi et al, 2005) to pharmacologic and physiologic stress studies on a wide range of species. Because the PET acquisition period can be prolonged > 3 mins, statistical accuracy can be significantly improved as compared with Ohta et al (1992) and other researchers (Fujita et al, 1999; Vafaee and Gjedde, 2000; Okazawa et al, 2001a, b ; Yamauchi et al, 2003; Mintun et al, 2002), under which to avoid effects of RW, the data acquisition period was limited only to < 3 mins (Meyer et al, 1987; Ohta et al, 1992).
The present RW formula consists of three rate parameters of the production rate of RW in the arterial blood (k), and the forward and backward diffusion rate constants of RW between the blood and the peripheral tissues. The k was presumed to correspond to the oxygen metabolism in the total body system, BMRO2, and was in fact shown to be significantly correlated to BMRO2, as measured from the trachea gas sampling (Figure 4). The latter two parameters (kw and p) appeared to be consistent and did not differ across various species (Table 2). Also, change in those parameters was less sensitive in CMRO2 (Figure 1). These findings suggest that the production of RW after inhalation of 15O2 could be described only by a single parameter of k, as shown in Figure 3, although further studies are required to validate this because the method was only tested in a group with small number of subjects of particular physiologic situation (under anesthesia) and has not been applied to different populations. It is also important to note that this parameter (k) estimated from the BMRO2 (i.e., BM approach) provided CMRO2, which was consistent with the trachea gas samplings shown in Figure 4, and that the obtained OEF values by the approaches of 4PF, 1PF, and BM applied in the present study were not significantly different to that by A—V difference approach as revealed by Bland—Altman analysis.
The simulation study also showed that the most sensitive parameter in CMRO2 was the RW production rate constant, k, followed by Δt. It was therefore suggested that k could be determined with a single blood sampling procedure using the 1PF approach, in which other parameter values were determined and fixed from results from the 4PF approach. It was further showed that k could be obtained from the BM approach as determined from oxygen concentration in the expiration gas. Both 1PF and BM approaches appeared to be robustly useful in 15O2 PET for assessing quantitative CMRO2 and CBF in clinical studies.
It is important to note that k varies significantly depending on the physiologic status even in the same species, as seen in Figure 4. According to the simulation study in Figure 1, this variation causes nonnegligible errors in CMRO2, if a constant k is used. Changes in k from 0.1 to 0.6 per min causes errors in CMRO2 of ±30% in anesthetized monkeys. Results from clinical studies, however, showed the variation in k being less. As shown in Table 2, k for clinical patients was 0.129 ± 0.023 per min, and the coefficient of variation was approximately 18%. Previous work by Huang et al (1991) also showed similar value with comparable variations, namely 0.131 ± 0.026 per min in six human subjects. These variations caused only ±5% errors in CMRO2, according to the simulation shown in Figure 1. The small variation in k in clinical patients is attributed to the fact that all subjects were studied at a relatively stable condition without physiologic stimulation. However, careful attention is needed if one intends to scan the patients whose whole-body oxygen metabolism is largely changed from the baseline condition. For example, during several pharmacologically stressed (Wessen et al, 1997; Kaisti et al, 2003), exercise-induced physically stressed, and hyper- or hypothermia (Sakoh and Gjedde, 2003) conditions.
The simulation also showed that size of errors in CMRO2 increased in smaller animals, where the value of k was larger. Recently, CMRO2 as well as CBF have been measured in rats using a small animal PET scanner (Magata et al, 2003; Yee et al, 2006). Magata et al performed multiple blood samplings and plasma separation for multiple blood samples to estimate the RW in their experiment involving rats. The procedures were crucial, but have caused serious alterations of physiologic condition in heart pressure and heart rate due to large amount of blood samples for small animals. Our proposed simplified technique for estimating RW from a single blood sample or from BMRO2, is essential for small animals to be able to maintain the physiologic status. The calculation of CMRO2 also requires whole blood arterial TAC, which can be obtained from arterial blood samplings and could change the physiologic condition. However, such blood sampling could also be avoided by an arterial—venous bypass (Weber et al, 2002; Laforest et al, 2005), by placing a probe in femoral artery (Pain et al, 2004), or by a noninvasive method (Yee et al, 2006).
Mintun et al (1984) has proposed a simple procedure for RW correction based on a linear interpolation for the bolus 15O2 inhalation 60-secs PET scan. As shown in Figure 2, the RW curve is not linear particularly in smaller animals, and a systematic error may be caused or scan duration is limited. Ohta et al (1992) and other investigators (Ohta et al, 1992; Fujita et al, 1999; Vafaee and Gjedde, 2000; Okazawa et al, 2001a, b ; Yamauchi et al, 2003; Mintun et al, 2002), however, have used a technique which does not take into account the RW contribution. Only initial short-period data, namely the 3 mins after the bolus inhalation of 15O2, were used in their approach, and thus estimated parameters suffered from statistical uncertainties. The present methodology to estimate RW in the arterial blood allows the prolongation of a PET acquisition period. The technique can also be applicable to the recently proposed sequential administration protocol of 15O2 followed by H215 to estimate CMRO2 and CBF simultaneously from a single session of a PET scan (Kudomi et al, 2005). This protocol, however, required a separation of a RW TAC from the whole blood TAC as showed recently (Kudomi et al, 2007).
The kBM determined from the total body oxygen metabolism, namely the BM approach, was significantly greater than k obtained by the 4PF or the 1PF approach, by a factor 2, as shown in Figure 4. The reason is not clear, but partly attributed to the limitation of the simplified model. The body system consists of various organs which have different oxygen metabolism along with different circulation systems and with transit times. It is well known that the apparent rate constant defined with a simplified compartmental model could be underestimated as compared with an average of true rate constants, known as heterogeneity effects (Iida et al, 1989; Aston et al, 2002). This is, however, not essential. Simply, linear correction could be applied to convert to the apparent k value as has been performed in this study. CMRO2 values calculated using BM approach for the RW separation, were in good agreement with those determined with the direct measurement of RW as shown in Table 3.
The current method with modeling approach and simplified procedure provided consistent results in terms of time-dependent RW component, and consequently metabolic product of 15O2 was separated from arterial whole blood for the CMRO2 assessment in PET examination. The modeling approach to separate metabolite from authentic tracer has been showed previously for 6-[18F]fluoro-L-dopa study (fdopa) (Huang et al, 1991). We expect that the modeling approach in conjunction with the simplified method showed in our study could be applied for various kinds of tracers, which require the separation of metabolic product such as fdopa. This approach enables us to assess parametric images for those tracers by eliminating the laborious procedures and by avoiding the amount of blood samplings, particularly for smaller animals.
In conclusion, the present RW model was feasible to reproduce RW TAC from a whole radioactivity concentration curve obtained after 15O2 inhalation, and for a wide range of species. The simplified procedure to predict the RW TAC is of use to calculate CMRO2 in smaller animals as well as clinical patients.
Footnotes
Acknowledgements
We acknowledge Mr N Ejima for operating the cyclotron and daily maintenance of CTI ECAT HR. We also gratefully thank Ms Atra Ardekani for her invaluable help on preparing the present paper. We also thank the staff of the Investigative Radiology, Research Institute, National Cardiovascular Center, especially, Dr T Inomata, Dr H Jino, Dr N Kawachi, and Dr T Zeniya for their assistance.