
Abstract
Patients with end-stage renal disease (ESRD) undergoing hemodialysis are known to suffer cognitive deficits and stroke of unknown etiology. It has been suspected that the treatment itself may contribute to the syndrome by unknown mechanisms, which we investigated in this study. End-stage renal disease patients on hemodialysis (n = 19) or peritoneal dialysis (PD, n = 5) were compared with 14 healthy controls. Subjects participated in magnetic resonance imaging (MRI) measurements of cerebral atrophy, cerebral blood flow (CBF) arterial spin labeled-MRI (ASL-MRI), quantitative Doppler blood flow through the internal carotid artery, and cerebral oxymetry. The Doppler and oxymetry procedures were also performed at the beginning and end of a single hemodialysis session. End-stage renal disease patients on hemodialysis showed significant cerebral atrophy, associated with longer hemodialysis duration and cognitive deficits, including focal bilateral lesions in the caudate nucleus and midbrain. Cerebral oxygenation was extremely low before dialysis (rSO2 41 ± 13, compared with 70 ± 2 in controls, P < 0.02) and improved only slightly after dialysis. Carotid blood flow was also very low at the start of dialysis (115 ± 28mL/sec, versus 193 ± 56 in controls, P < 0.005) but normalized at the end of the session (181 mL/sec). The PD patients showed intermediate values, between the hemodialysis and controls. Notably, duration of hemodialysis treatment predicted global gray-matter volume (r = −0.74), change of blood flow during dialysis (r = −0.65), and baseline rSO2 (r = −0.65). The findings suggest that ESRD patients on hemodialysis suffer low CBF during the interdialytic cycle. Coupled with low cerebral oxygenation levels and atherosclerosis, this may contribute significantly to the etiology of the observed cerebral atrophy, cognitive deficits, and high stroke prevalence.
Introduction
Uremic encephalopathy is a common syndrome in end-stage renal disease (ESRD), characterized by variable, fluctuating course, and commonly demonstrating neurological symptoms (fatigue, clumsiness, grasp, and palmomental reflex), personality changes (apathy, emotional lability, and agitation), and neuropsychological deficits (attention, speed, learning and memory, and decision-making) typical of frontal lobe dysfunction (Burn and Bates, 1998). The high prevalence of cognitive deficits and dementia in ESRD is well recognized (Murray et al, 2006), but its cause and pathophysiology are not yet characterized. Dialysis dementia (because of aluminum toxicity) and dialysis disequilibrium syndrome (because of plasma/brain osmotic gradient, caused by rapid dialysis, which generates cerebral edema), recognized decades ago, are rare nowadays.
Although little is known about the etiology and mechanisms of cognitive deficits in ESRD, it appears that vascular dementia is much more common than Alzheimer's disease (AD). In a large Japanese study of 508 patients undergoing hemodialysis for an average duration of 11 years (Fukunishi et al, 2002), the incidence rate of AD was age-normal, whereas the incidence of ‘multi-infarct’ dementia was over sevenfold higher than in the general population. Notably, the duration of hemodialysis treatment appeared relevant: ‘multi-infarct’ dementia incidence rose gradually during the initial 15 years of hemodialysis, and then accelerated at longer durations. This was not observed for AD.
Cerebrovascular disease has been strongly implicated in ESRD. Silent lacunar infarction and stroke are common in this population (Nakatani et al, 2003). A recent large study of patients with cardiovascular disease (Morag et al, 2006) showed that even mild chronic kidney disease significantly increases the risk for transient ischemic attack and stroke, independently of associated comorbidity; the risk increased with greater renal insufficiency.
Hemodialysis is the most common treatment for ESRD. Transient hypotension, arterial hypoxemia, and fluctuations in electrolytes and cerebral water content might occur during hemodialysis and possibly induce subtle brain damage. It is unestablished whether dialysis treatment improves or exacerbates the cognitive deficits of ESRD or the underlying cardiovascular disease (Monk and Bennett, 2006). Previous literature suggests the possibility of deleterious hemodialysis effects on cognition (Gilli and De Bastiani, 1983), stroke (Iseki et al, 2000), atherosclerosis (Shoji et al, 2002), and cerebral atrophy (Kamata et al, 2000; Savazzi et al, 2001).
A recent editorial (Monk and Bennett, 2006) called for more research on the mechanisms of stroke in chronic kidney disease. This study was undertaken to investigate the circulatory pathophysiology of ESRD patients undergoing hemodialysis treatment. To examine possible mechanisms, and begin to generate a physiological model of this condition, we utilized four quantitative and independent techniques: quantitative magnetic resonance imaging (MRI) measures of atrophy, MRI measurement of regional cerebral blood flow, quantitative Doppler measurements of blood flow (BF) in the internal carotid artery, and measurement of oxygen saturation in frontal cortex.
Materials and methods
We present below data from a total of 24 consecutive dialysis patients from the nephrology services of the Bronx VAMC and the Mount Sinai Medical center (all male patients; age = 63 ± 11 years, range = 44–85) and 14 healthy controls recruited from the community to participate in a study of normal aging, as well as staff and students (11 male; age = 61 ± 18 years, range = 30–87). The only exclusion criterion for all subjects was contraindications to MRI and inability to provide informed consent. Among the patients, 19 were treated with hemodialysis (age = 64 ± 11 years) and five were treated with peritoneal dialysis (PD, age = 59 ± 10 years). Three of the hemodialysis patients had a history of stroke (these were not included in the MRI studies). End-stage renal disease was caused by hypertension (42% among hemodialysis and 20% PD), diabetes (53% hemodialysis and 60% PD), or primary glomerular dysfunction (5% hemodialysis and 20% PD). Owing to the multiplicity of investigational methods and their length, not all subjects participated in all procedures, so specific values for subsamples are provided below for each procedure. None of the patients met the criterion for dementia. Hemodialysis patients participated in MRI scans (24 h before, and 1 h after, a dialysis session), internal carotid artery (ICA) Doppler BF measurements (in the beginning and end of the dialysis session), and cerebral oxymetry (throughout the dialysis session). All other subjects had the procedures only once.
Magnetic resonance imaging scans were performed on a Siemens Symphony 1.5 T MRI system enhanced with quantum gradients and standard quadrature head coil. Brain anatomy was visualized by a three-dimensional magnetization-prepared rapid gradient echo (MP-RAGE) sequence, using an axial slab of 160 slices (1/0.5 mm, field of view = 240, yielding voxel dimensions = 0.9 × 0.9 × 1 mm), A > P phase encode (6/8 partial Fourier) with 25% phase oversampling and 30% slice oversampling. We use TR/TE/TI 2,150/4.38/1,100, FA 8, for an imaging time of 8 mins 38 secs. To quantify cerebral atrophy, we employed SPM99 and the optimized voxel-based morphometry (VBM) method (Good et al, 2001), using 12 mm smoothing and moderate correction with the gray-matter (GM) template. Five hemodialysis patients had these scans after dialysis and five before dialysis, and they were combined for analysis (there were no significant differences between the pre- and postconditions on any MP-RAGE variable).
Cerebral blood flow was assessed with the pulsed arterial spin labeling (ASL) technique using the QUIPPS II method proposed by Wong et al (1997). We acquire 12 axial slices (6/3 mm, field of view = 224, 64 × 64 matrix, yielding voxels 3.5 × 3.5 × 6mm), using A > P phase encode with 50% oversampling and fat saturation. Imaging parameters are TR 3,170 (single shot TR 84.2, TR delay 718 ms), TE 37, FA 90, TI1 700, TI2 1,400, gap 25 mm. Imaging time for 120 pairs is 12 mins 45 secs. For absolute quantification, we also measured T1 in with identical resolution and slice positions by a series of slice-selective inversion-recovery sequences (TR/TE 10,000/25, phase partial Fourier 5/8) using two concatenations to prevent slice crosstalk artifacts. We use 11 TI values to acquire data points for model fitting (0.05, 0.1, 0.2, 0.3, 1, 1.4, 1.8, 2.2, 2.6, 3.2, 4 secs), each requiring 20 secs, for a total time of 3:40 mins. The T1 and ASL values in each voxel were inserted into the standard formula to derive CBF values in mL per 100 g per min. After computation of CBF, all T1W scans were automatically segmented into four compartments by a Fuzzy C-Means algorithm (Ding et al, 2005); only findings of the mean flow in gray and white matter (WM) are reported here. Measurements were conducted on the day before dialysis and 1 h after dialysis. All image analyses were performed with SPM99 and home-written Matlab routines.
Volume BF through the internal carotid arteries was determined by angle-independent Doppler BF that provides real-time BF volume and velocity readings (Quantix/ND, Neoprobe Corporation, Dublin, OH, USA). The technology is based on simultaneous application of a combination of narrow beams with a known angle between them. On the basis of trigonometric and Doppler considerations, the angle of insonation can be obtained. Angle-independent Doppler BF permits multiple sampling of the blood passing through a vessel and a simultaneous calculation of vascular diameter. This provides a more accurate measurement of the volume of total BF than other commercially available technology, which either estimates vessel size to calculate the vessel diameter or averages flow velocity in arriving at an estimate of BF. The measurements were performed at a location as distal to the carotid bifurcation as possible, under the submandibular angle. Measurements were only considered valid if there was at least one 4 secs epoch with a measured angle of 55°–65°, and the difference between the two diameter determinations < 0.6 mm. Vessels that did not satisfy these criteria were excluded from analysis. Values of both right and left ICA were obtained whenever possible, and averaged for data analysis.
Cerebral oxygenation was monitored in a small region of frontal cortex with the INVOS 4100 (Somanetics, Troy, MI, USA), based on near-infrared spectroscopy technology. Each subject was monitored for a period of approximately 30–250 mins; the shorter durations were used for healthy controls, where oxygenation is expected to remain stable. Hemodialysis patients were monitored before, during, and after a dialysis session. Both oxygen saturation (rSO2) and an index of cerebral blood volume were monitored continuously.
All statistical analyses were performed with JMP (SAS Institute, Cary, NC, USA).
Results
Cerebral Atrophy
The 10 hemodialysis patients were all male (mean age 61 ± 10 years); the six controls (mean age 78 ± 7 years) included two females. Global volume of GM, WM, and cerebrospinal fluid (CSF) were computed from statistical parameteric mapping (SPM) segmentation procedures. To express global atrophy, we used the ratio of (GM + WM)/CSF. An analysis of covariance, with diagnosis as grouping factor and age as covariate, showed significant main effects of diagnosis (F = 6.28, P < 0.05) and age (F = 6.58, P < 0.05) with no significant interaction. The unadjusted raw mean ratio was 2.93 ± 0.55 in patients versus 3.18 ± 0.33 in controls, that is the patients had 8% less brain matter, despite being 17 years younger. The regression of brain fraction against age was 5.8–0.03* age in controls (P = 0.07) and 5.1–0.04* age in patients (P = 0.05). Examination of the data (Figure 1) suggests that ESRD patients show atrophy corresponding to approximately 10–20 years of chronological age in controls. Further, this ratio correlated significantly with Mini-Mental Status Examination within the hemodialysis patients (n = 7, r = 0.78, P < 0.05), as did the ratio of GM/CSF voxels (r = 0.94, P < 0.05). Most notably, the global GM volume was strongly related to the duration of hemodialysis treatment (n = 9, r = −0.74, P < 0.05).
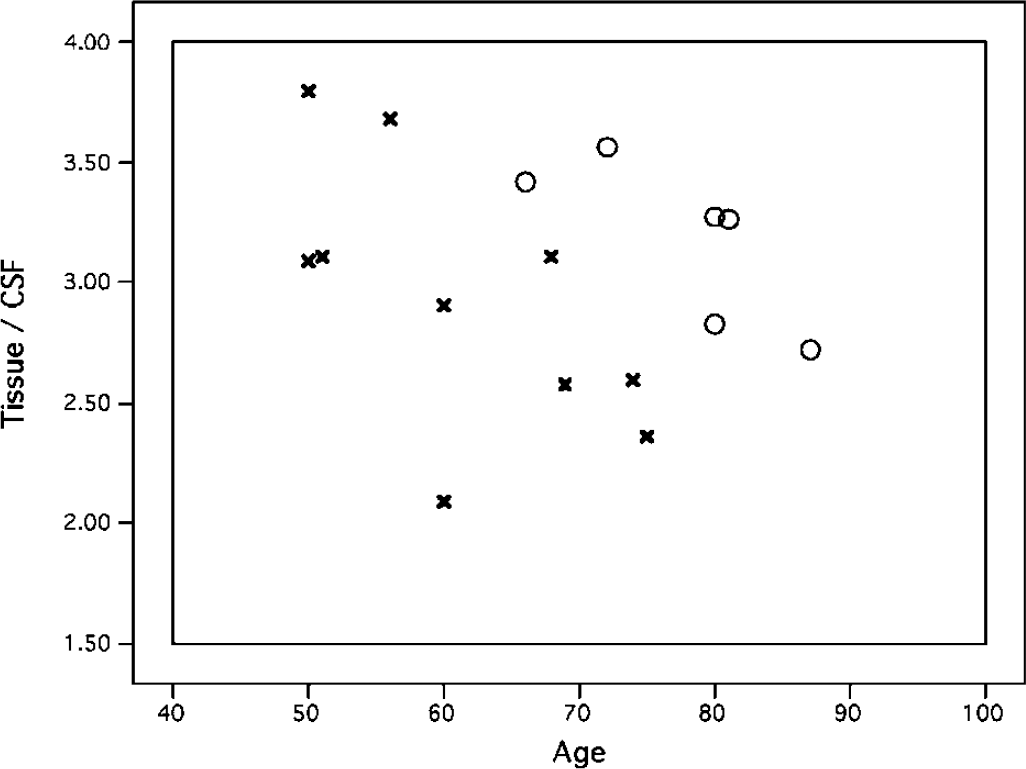
Ratio of parenchymal volume (GM + WM) to CSF volume, against age, in ESRD patients (×) and healthy controls (empty circles). The ESRD patients show significantly lower brain volume, suggesting atrophy equivalent to 10 to 20 years of normal aging.
The regional VBM analyses were also conducted as an analysis of covariance with diagnosis (ESRD versus normal) as between-subject grouping factor and age as a covariate; all analyses were performed at P = 0.001, uncorrected. We first examined the CSF compartment. Hemodialysis patients had higher CSF amounts in multiple regions, mainly in cortical sulci (primarily frontal and temporal), and edges of the third and lateral ventricles (including the anterior nucleus of the thalamus). Significant differences were also found bilaterally in the pons/midbrain (Figure 2A). No cerebellar atrophy was noted. There were no areas where controls had higher amounts of CSF. Significant positive correlations of CSF density with age were found in numerous regions, mainly in frontal and parietal cortical surfaces and the third ventricle (Figure 2B); the fourth ventricle was not related to age. There were no negative correlations with age; thus, as expected, aging is associated with increased CSF amounts in the brain.
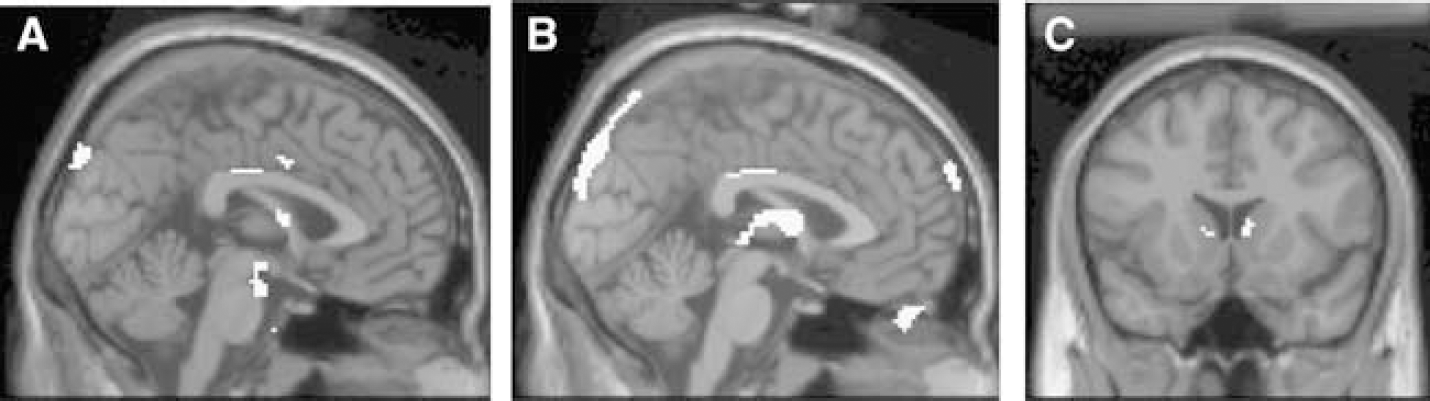
Significant (P < 0.001 uncorrected, k > 10) findings of the SPM VBM analysis of structural MRI, depicting (
A similar VBM analysis was conducted for GM volume. Patients had significantly lower GM volume bilaterally in the caudate nucleus (Figure 2C), and age was negatively correlated with GM volumes around the third ventricle. In no area were the hemodialysis patients higher than controls. No significant effects were found for WM.
Regional Cerebral Blood Flow
The subjects who participated in MRI regional cerebral blood flow determinations were the same subjects described above for the structural MRI. Owing to the known reduction of CBF with age, the mismatch of our samples by age, and the atrophy results above, we constructed age correction for CBF in the normal controls. Within the normals, a linear regression between gray-matter blood flow (CBFg) and age yielded the equation CBFg = 113.7–0.73*age. On the basis of this equation, control CBF values were adjusted to the predicted BF level at the patients' age. At an equivalent age, control CBFg was 69 ± 6 mL per 100 g per min, compared with the patients' flow of 55.6 ± 4.7 (NS). For WM, the age regression in normals was CBFw = 98.8–0.61*age. Using this equation to correct the control CBFw, their flow value was again higher than the patients, although nonsignificantly.
SPM analysis was used to test for regional effects. Analysis of covariance (age covariate) was performed without mean scaling or global mean calculation at an absolute threshold of 5 mL per 100 g per min, using an explicit brain mask and an uncorrected P = 0.001. Patients were not higher than normals at any location. Flow was higher in the normals in the left posterior middle temporal gyrus and a left inferior hypothalamic area bordering the fourth ventricle. Relaxing the significance threshold to 0.01 enlarged these areas and revealed a similar area in the right middle temporal gyrus; the patients still showed no area of flow higher than the normals. Similarly, there were no areas of positive correlation between age and CBF. Negative correlations reaching P < 0.001 were seen in left hypothalamus and midbrain.
Quantitative Doppler and Blood Gas Analysis
Because the angle-independent Doppler BF technology is new, requires skill, and its accuracy has not yet been sufficiently established, we ensured its reliability in our hands by studying 16 healthy controls twice to verify reproducibility (7 women, age 45 ± 17 years and 9 men, age 49 ± 12 years, NS). Mean BF was 201 ± 29 mL/min for women and 182 ± 48mL/min for men (NS). In the complete sample, there was a nonsignificant negative correlation of BF with age (BF = 209–0.40*age, r = −0.14, NS). There were no significant differences between right and left carotids, either as a main effect or as a gender interaction. Reliability was assessed by a repeated-measures multivariate analysis of the variance using gender as a grouping factor and examination (first versus second) as repeated measure on the mean (Rt/Lt) BF (these data were analyzed in four men and four women). For flow, there were no significant main effects or interactions. Flow did not change significantly in women or in men; overall, the difference from first to second measurement in the eight controls was 137 58 mL/min. Mean diameters observed in the first examination were approximately 4.6 mm, with women higher than men (4.8 versus 4.5, F1.7 = 5.30, P < 0.06). Mean angle was approximately 59°, with no side or gender differences. Overall, in our 16 normals, mean ICA BF was 187 ± 41 mL/min, with a diameter of 4.76 ± 0.53 mm and an angle of 59 ± 2.52°.
The clinical data in this section were collected from 10 hemodialysis patients (all men, age 61 ± 11 years), 5 PD patients (all males, age 59 ± 10 years), and 5 matched normal controls (all men, age 58 ± 5 years). The first analysis addressed chronic BF levels in all three groups. For this analysis, we used the BF and other values obtained at the start of dialysis for the hemodialysis patients. The data are presented in Table 1, referring to a standard factorial analysis of the variance. There were no significant differences between the samples on any variable, except BF (F2,14 = 5.14, P = 0.02). Individual t-tests on this variable indicated that the hemodialysis patients, but not PD, had significantly (P < 0.05) lower BF than controls. The PD subjects, in fact, had intermediate values between hemodialysis and controls. Thus, baseline BF in hemodialysis patients is only 60% of normal, and in PD patients 84% of normal, with similar duration of treatment. Both ESRD patient samples showed slightly reduced ICA diameter, but the effects did not reach significance.
Baseline values for three subject samples
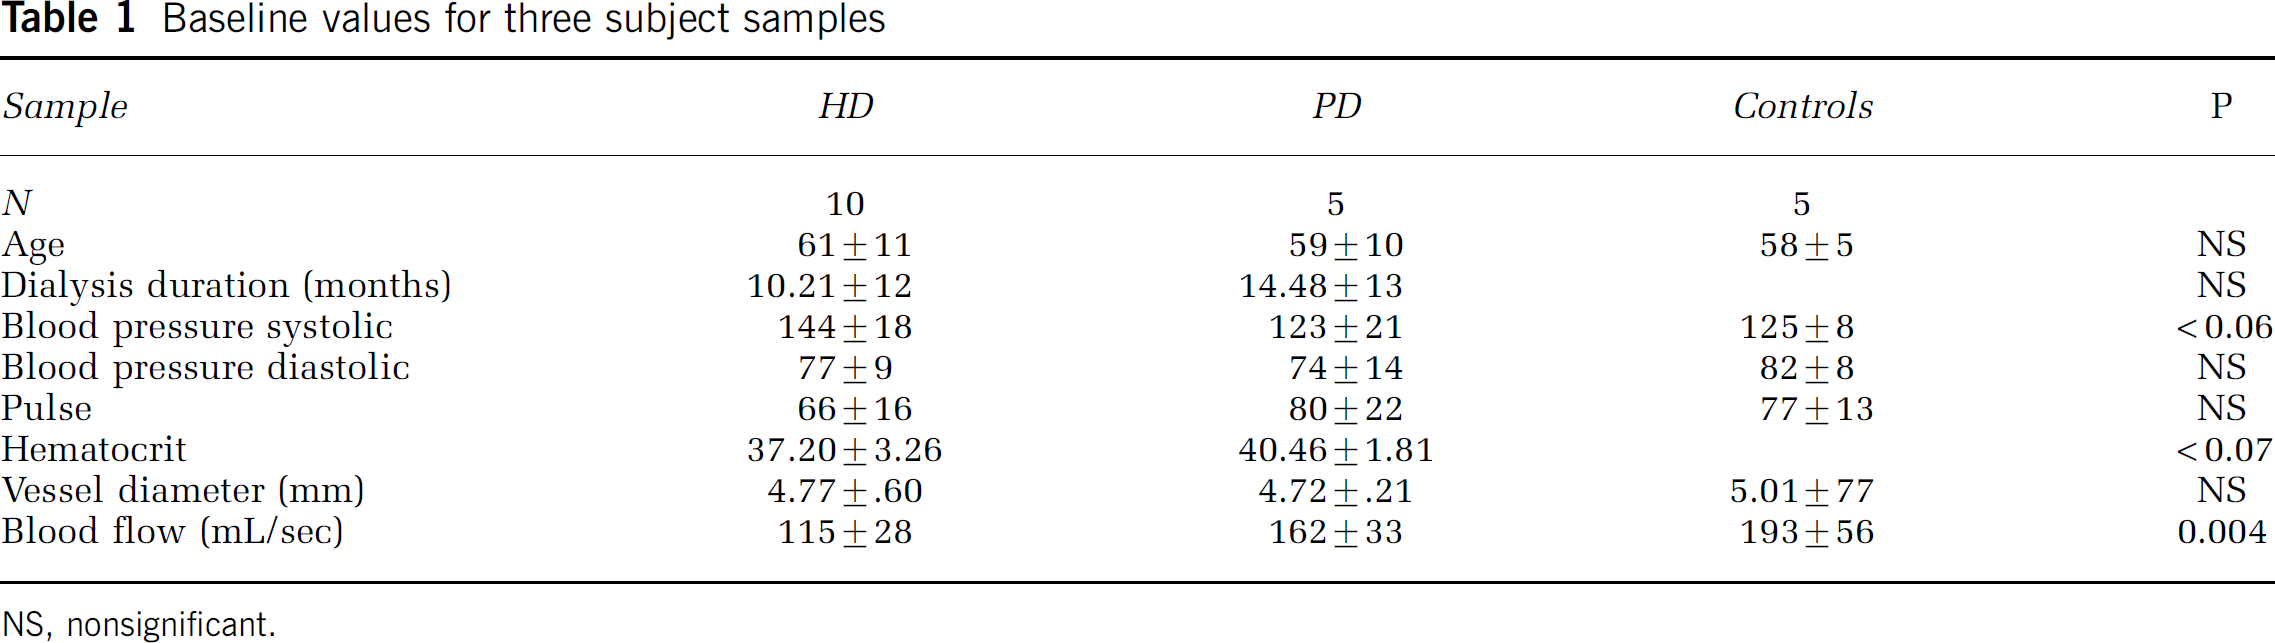
NS, nonsignificant.
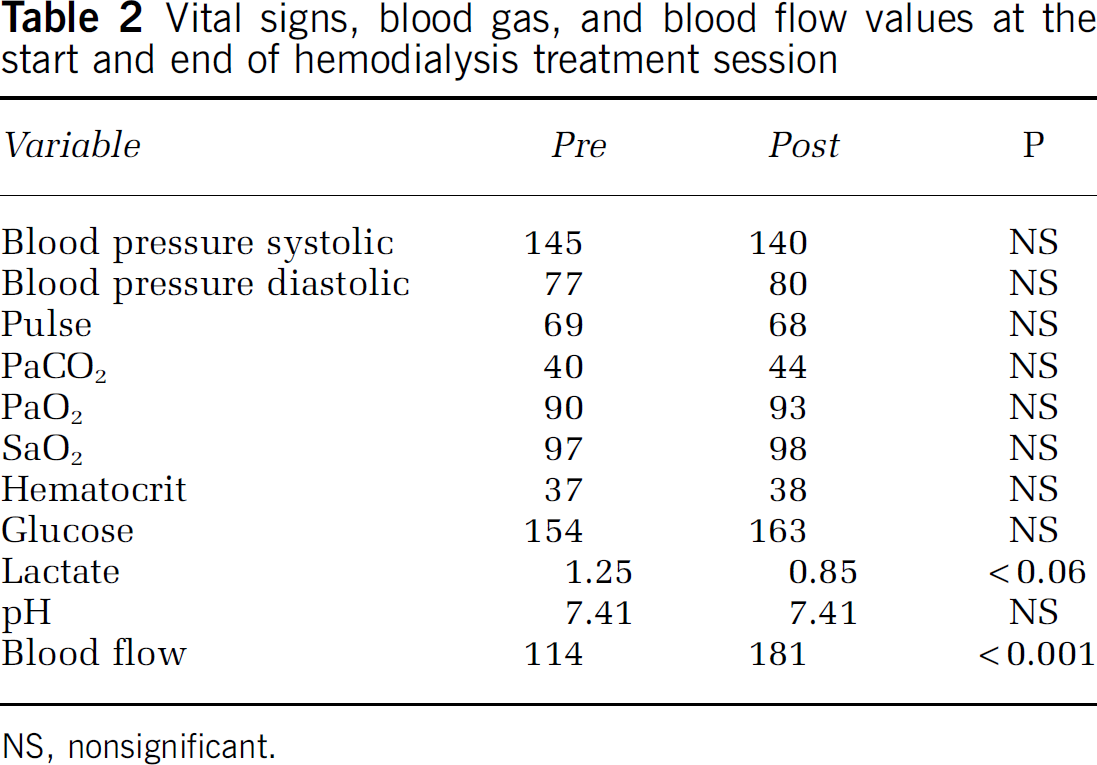
The second analysis was aimed at elucidating the acute changes of cerebral perfusion that occur during dialysis. For this purpose, nine hemodialysis patients had repeated BF measurements at the start and end of one treatment, as well as blood gas analysis (Bayer 865 Analyzer, Norwood, MA, USA) on arterial blood samples obtained at the same time. Basic data and significance of change by paired t-test (two-tailed) are shown in Table 2. Blood flow increased from 114 ± 30 to 181 ± 38 (paired t8 = 5.18, P < 0.001). Every subject increased the flow, with a mean increase of 67 ± 46% (range 13–127%). There was neither significant change of diameter or probe angle, nor blood pressure or pulse rate. There was no significant change in pCO2, pO2, hemoglobin (Hb), sO2, hematocrit (Hct), Na, Ca, Cl, or pH. The major factors that are known to affect CBF (pCO2, pO2, pH, and Hct) thus were stable, or at least did not change sufficiently to explain the dramatic increase of perfusion. To evaluate the possible covariates of the perfusion increase, all clinical and biochemical variables were also expressed identically as % change. In univariate analyses, the change of BF was correlated with baseline BF (r = −0.71), duration of hemodialysis treatment (r = −0.65), glucose change (r = −0.73), O2/gl (r = 0.60), and pH change (r= −0.67). The end-dialytic BF was also related to duration of hemodialysis treatment (r = −0.59, P < 0.10).
Cerebral Oxymetry
Seven hemodialysis patients were monitored before, during, and after a dialysis session. All subjects were men (mean age 63 ± 13 years), and they were compared with three healthy controls (age 40 ± 13 years) as well as published norms. Both oxygen saturation (rSO2) and an index of cerebral blood volume (rCBV) were monitored continuously, and the data subjected to a linear regression to estimate changes during dialysis. Individual baseline rSO2 values are depicted in Figure 3. Whereas in our three healthy male controls, the values were all approximately 70%, in all hemodialysis patients they were substantially lower. The patients had lower baseline rSO2 (t8 = 3.76, P < 0.01) and cerebral blood volume (t8 = 2.73, P < 0.05). Within the hemodialysis patients, rSO2 slightly rose during dialysis (mean slope 0.004 ± 0.12/min), as did the cerebral blood volume index (mean slope 0.0005 ± 0.0004/min).
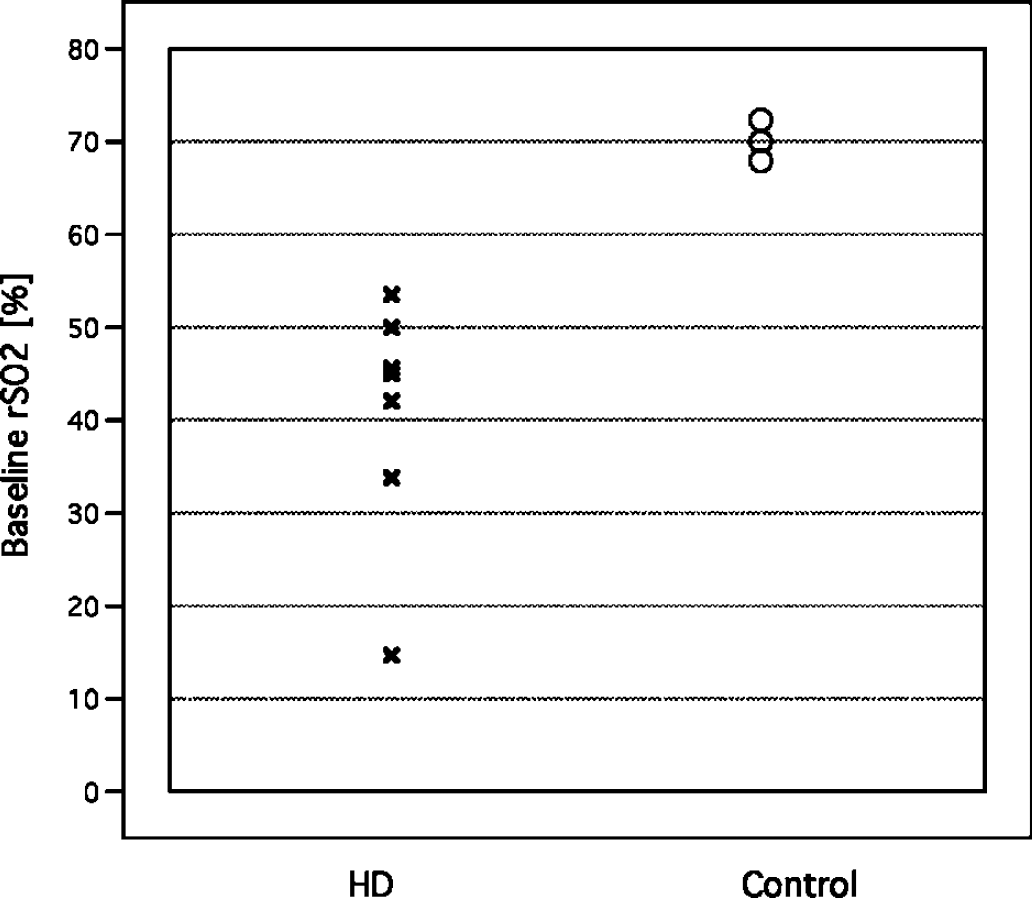
Individual values of rSO2 (frontal cortex oxygen saturation) by near-infrared spectroscopy in hemodialysis patients (at the beginning of a dialysis session) and normal controls.
Within the hemodialysis patients, age did not correlate with any variable. We also computed correlations with the hemodialysis Doppler and BGA values (obtained during a different dialysis session). Baseline brain rSO2 was correlated with the fraction of arterial oxyhemoglobin (FO2Hb, r = 0.97, P < 0.002); additional trends were found with pO2 (r= 0.56), fraction of carboxyhemoglobin (FCOHb, r= −0.79), and hemodialysis duration (r= −0.65). Baseline cerebral blood volume was correlated with baseline BF (r= −0.81, P < 0.05), baseline and end Hct (r = 0.70 and 0.78), initial Cl (r = −0.82, P < 0.05), and the changes in ICA diameter (r = 0.75, P = 0.05) and arterial pH (r = 0.79, P < 0.05).
Vital signs, blood gas, and blood flow values at the start and end of hemodialysis treatment session
NS, nonsignificant.
Discussion
We found marked cerebral abnormalities in ESRD patients undergoing hemodialysis treatment, regarding atrophy, perfusion, and oxygenation. Our cerebral atrophy results replicate and quantify previous findings, as well as reveal novel focal lesions in the brain. We found significant cerebral atrophy in ESRD patients, mainly consisting of sulcal enlargement and ventricular dilatation, and related to both age and cognitive deficits in the expected directions, that is it was greater in older patients and those with greater deficits. Moreover, global loss of GM was associated with longer duration of hemodialysis treatment. Our atrophy findings corroborate previous reports (Vorstrup et al, 1992; Burn and Bates, 1998), and the relationship with longer duration of hemodialysis treatment is also consistent with other works (Savazzi et al, 1995, 2001; Kamata et al, 2000). We also found focal increase in CSF density in suprapontine areas of the midbrain, adjacent to, but not clearly identical to, the pontine changes seen in osmotic demyelination syndrome (Tarhan et al, 2004); none of our patients were documented to show clinical symptoms consistent with that syndrome, but they were not specifically assessed for this purpose and we cannot exclude this possibility.
When investigating regional changes in GM density, we found significant reductions, bilaterally, in the caudate nucleus of hemodialysis patients. The bilaterality of the caudate atrophy in these patients suggests a fundamental anatomic mechanism. The caudate nucleus is highly vulnerable to transient or permanent middle cerebral artery occlusion in the rat (Reese et al, 2002) and baboon (Giffard et al, 2005), with greater reduction of local CBF, as well as to prolonged hypoxia in humans (Juengling et al, 2005). This vulnerability of the striato-capsular region is thought to result from end-zone perfusion through deep perforating vessels. Caudate lesions are generally associated with variable language, memory, personality, and cognitive deficits, compared with the more typically motor deficits of lentiform lesions (Narumoto et al, 2005). Future research should clarify the possible association of the apparent caudate lesions we observed with the cognitive deficits typically seen in dialyzed patients (Murray et al, 2006).
If caudate lesions are caused by hemodynamic insufficiency, inadequate perfusion, chronic or episodic, may be present. Little is known about cerebral perfusion and metabolism in ESRD, and the bulk of the studies to date only reflect the effects of uncorrected anemia. The seminal observation on uremia was made by Scheinberg in 1954: using the Kety—Schmidt technique, he showed elevated CBF and deficient cerebral metabolic rate for glucose (CMRgl) and oxygen (CMRO2). Anemia, prevalent in such patients before modern recombinant human erythropoietin was available, is known to raise cerebral perfusion in other conditions (Prohovnik et al, 1989); its correction by transfusion (Venketasubramanian et al, 1994) or dialysis (Hirakata et al, 1992) lowers the abnormal hyperemia. This effect, however, seems unrelated to the intrinsic disease. Hirakata et al (1992) reported a severe reduction (32%) of CMRO2, accompanied by elevated CBF and OEF, in five anemic, normotensive hemodialysis patients with normal Mini-Mental Status Examination. Partial correction of the anemia with recombinant human erythropoietin (Hct rose from 21 to 31) reduced CBF and OEF to near-normal levels, but the CMRO2 remained depressed. Similarly, Vorstrup et al (1992) reported that CBF in their hemodialysis patients was high owing to anemia, but when corrected to control Hct values was significantly reduced, suggesting metabolic reductions. Reduced CMRO2 and slightly elevated OEF, with anemia-associated hyperemia, in interdialytic day were also found by Kuwabara et al (2002). These previous results are consistent with our finding of CBF reductions by 19% (in interdialytic ASL-MRI studies) and 40% (ICA BF at the start of dialysis) in non-anemic hemodialysis patients.
Our Doppler BF measurements demonstrated a substantial increase, almost doubling, of cerebral perfusion during the dialysis session. Previous velocity measurements (e.g., Hata et al, 1994) have shown reduced velocity after dialysis, but they were conducted before the introduction of recombinant human erythropoietin as standard therapy to eliminate anemia. A recent TCD report (Skinner et al, 2005) also showed a mild reduction of velocity after hemodialysis, but it was also associated with a significant elevation of hemoglobin. As mentioned above, there are strong negative correlations between hemoglobin and cerebral perfusion, which would tend to mask or distort other effects. Our patients were not anemic (Hct 37 at the beginning and 38 at the end of dialysis), and therefore our Doppler BF measurements are free of this confound. We also confirmed that other vasoactive changes (e.g., paCO2) did not occur during dialysis. Our normal values are in good agreement with the literature (Schebesch et al, 2004), confirming our procedures and technique. The technology also showed good correlations with 133Xe regional cerebral blood flow measurements (Rothoerl et al, 2003), and our main findings pertain to repeated measurements, averaged bilaterally, in the same patients, further reducing the likelihood of artifactual explanations. We therefore conclude that carotid volume flow increases substantially during hemodialysis.
Although CBF increases during hemodialysis, it obviously must decline again later, as it is generally depressed in these patients, as shown by our interdialytic CBF measurements and previous work. Cross et al (2001) documented enhanced reactive hyperemia in the brachial artery after hemodialysis, persisting for 5 h but disappearing at 24 h, in agreement with our model. Our data suggest that cerebral perfusion in hemodialysis patients oscillates, dropping to approximately 60% of normal levels at the end of the interdialytic interval and rising again to normal levels during the 3 to 4 h of dialysis every 2 to 3 days. The consequences of this situation are not known, and we could not find any data on equivalent conditions. The precise causative mechanisms are also unclear, although obviously associated with uremic pathophysiology. It seems reasonable to assume that the gradual decline of CBF during the interdialytic interval does not reflect changes of metabolic demands; instead, they must reflect changes of perfusion pressure or, more likely, gradual and cumulative changes of blood viscosity, uremic toxins, and/or cerebrovascular resistance. None of the procedures conducted here provides data to test these hypotheses, and they remain for future research. It is also unclear what precisely happens at the time of maximal reductions, just prior to dialysis. A drop of perfusion to approximately 60% of normal would be fairly close to ischemic thresholds even in a healthy cerebrovascular bed. Chronically repeated drops of this magnitude in a system already challenged by numerous other factors may easily exceed the limit. This, coupled with the risk of hypotensive episodes during the dialysis treatment itself, may inevitably lead to infarction in border zone areas, such as the caudate lesions we report.
Our oxymetry measurements showed low oxygen saturation in frontal cortex of hemodialysis patients. The mean level of rSO2 was 41 ± 13%, compared with 70 ± 2% in our controls. The low saturation in our hemodialysis patients was similar to values observed in symptomatic, untreated sickle-cell disease (rSO2 48 ± 9) by Raj et al (2004), and in patients presenting with normotensive acute congestive heart failure and cerebral symptoms (mean rSO2 of 34, and a range of 19 to 58; Madsen et al, 2000). In contrast to ICA BF, which normalized at the end of the session, oxygenation remained depressed. The causes and mechanisms of this continued hypoxia are not yet known; the technique is relatively novel, and artifactual results are possible. Our control oximetry values are in very good agreement with results reported by others in normal adults and medical-surgical populations (Kishi et al, 2003), indicating the validity of our instruments and procedures. The technology itself, while fairly new, has been validated in several previous experiments. In particular, Kim et al (2000) compared cerebral rSO2 to arterial SaO2 and internal jugular SjvO2 in 42 healthy subjects undergoing experimental isocapnic and hypercapnic hypoxia. These authors found excellent agreement (r= 0.99, P < 0.0001 across the 10 conditions studied) between cerebral rSO2 and jugular SjvO2. In clinical populations, several recent reports documented prediction of postoperative outcomes from intraoperative cerebral oxymetry changes (e.g., Yao et al, 2000; Edmonds et al, 2004; Olsson and Thelin, 2006). Further, our oxymetry results were meaningfully related to our other measurements, although the sample sizes are small. For example, CBF determined by ASL-MRI in GM was significantly higher in the two patients with rSO2 ≥ 50 than in the four patients with low oxygenation (72 ± 13 versus 48 ± 3mL per 100 g per min, t4 = 4.05, P < 0.02). Further, baseline rSO2 was significantly correlated with the fraction of arterial oxyhemoglobin (FO2Hb, r = 0.97, P < 0.002); additional trends in the expected directions were found with pO2 (r = 0.56), and fraction of carboxyhemoglobin (FCOHb, r = −0.79).
Although the technology has been validated in healthy and clinical populations, our own control values are consistent with the literature, and the covariance structure with other measured variables suggests strong face validity, we are not sure of the causes and implications of the very low saturation values in these patients. It is still possible that the low saturation we observed may be caused by artifacts unique to the hemodialysis patients, such as unusual blood composition (e.g., the shear-dependent red blood cells aggregation raised by Tomita et al, 2006). Uremic patients show numerous physiological abnormalities, systemic, hematologic, and cerebral, whose possible effects on cerebral oxygen metabolism and transport, as well as near-infrared spectroscopy measurements, remain to be elucidated (cf., Hirakata et al, 1992). We also cannot offer an explanation to the absence of saturation normalization at the end of dialysis, despite markedly increased perfusion. Both phenomena may be related to abnormalities in the local cortical microcirculation. In this respect, our observation is reminiscent of the findings in sickle-cell disease, where oxygenation only slightly improves after transfusion (Raj et al, 2004) despite substantial elevation of CBF (Venketasubramanian et al, 1994). Hematologic abnormalities in ESRD patients may, thus, explain both the low saturation and its failure to respond to elevated flow in the large input vessels; the nature of these abnormalities remains to be elucidated.
In conclusion, the emerging pattern suggests that ESRD patients undergoing hemodialysis treatment have generalized cerebral atrophy, as well as focal degeneration of the head of the caudate nucleus, very low interdialytic cerebral perfusion, which acutely normalizes after each treatment, and depressed oxygenation that appears chronic. These abnormalities are related to each other, as well as to cognitive deficits in these patients. End-stage renal disease patients undergoing PD show more normal perfusion; this observation as well as correlations within the hemodialysis patients between abnormalities and duration of treatment, suggests the possibility of iatrogenic adverse cerebral effects of hemodialysis treatment. This might be related to the dosage and administration of hemodialysis. Our patients received long-term intermittent hemodialysis three times per week. The dose of hemodialysis for each patient was prescribed in accordance with the National Kidney Foundation Dialysis Outcomes Quality Initiative Adequacy Guidelines. The effect of higher hemodialysis dose on the above-mentioned variables is largely unknown. Presumably, higher doses of hemodialysis or utilizing dialyzer membranes with larger pore size might affect the degree to which endovascular toxins are removed. Theoretically, more efficient removal of toxins, which interfere with endothelial function, would result in restoration of normal perfusion and metabolism. Other modifications of the dialysis prescription may create a more stable cerebral hemodynamics. More continuous forms of hemodialysis, such as nocturnal hemodialysis where patients are dialyzed each night, could potentially avoid fluctuations in cerebral hemodynamics by maintaining more consistent intravascular volumes and lower levels of toxins, which interfere with endothelial function.
This is a complex study, employing four independent, and mostly novel, technologies. Each technology we used may be prone to its own artifacts and inaccuracies, especially in this unusual population with complex pathophysiology. Our patient and control samples were relatively small, and unmatched for age, which had to be controlled statistically, and treatment assignment was not randomized. Although these limitations need to be addressed in future work, the combined pattern, and the meaningful correlations among the methods, indicate a coherent picture with considerable face validity. The results suggest that ESRD patients on hemodialysis treatment undergo an oscillation of their cerebral perfusion every 2 days. Coupled with their known atherosclerosis, other vascular risk factors, and the low cerebral oxygenation levels observed here, they appear to be exquisitely vulnerable to cerebrovascular accidents.
Footnotes
Acknowledgements
We thank Siemens Medical Equipment, Somanetics Corporation, and Neoprobe Corporation for technical and equipment support, and Dr Ron Widman of Somanetics Corp, Dr Carl Bosch of Neoprobe Corporation, and Dr Harvey L Edmonds of the University of Louisville School of Medicine for useful discussions regarding these technologies. Some of these data were previously presented at the 14th Annual Meeting of the International Society for Magnetic Resonance in Medicine, Seattle, WA, USA, 6 to 12 May 2006.