
Abstract
The recently developed oscillating-gradient diffusion MRI (OG-dMRI) technique extends our ability to examine brain structures at different spatial scales. In this study, we investigated the sensitivity of OG-dMRI in detecting cellular and subcellular structural changes in a mouse model of neonatal hypoxia ischemia (HI). Neonatal mice received unilateral HI injury or sham injury at postnatal day 10, followed by in vivo T2-weighted and diffusion MRI of the brains at 3–6 h and 24 h after HI. Apparent diffusion coefficient (ADC) maps were acquired using conventional pulsed-gradient dMRI (PG-dMRI) and OG-dMRI with oscillating frequencies from 50 to 200 Hz. Pathology at cellular and subcellular levels was evaluated using neuronal, glial, and mitochondrial markers. We found significantly higher rates of ADC increase with oscillating frequencies (Δ f ADC) in the ipsilateral edema region, compared to the contralateral side, starting as early as 3 h after HI. Even in injured regions that showed no apparent change in PG-ADC or pseudo-normalized PG-ADC measurements, Δ f ADC remained significantly elevated. Histopathology showed swelling of sub-cellular structures in these regions with no apparent whole-cell level change. These results suggest that OG-dMRI is sensitive to subcellular structural changes in the brain after HI and is less susceptible to pseudo-normalization than PG-dMRI.
Keywords
Introduction
Diffusion magnetic resonance imaging (dMRI) 1 is an important tool to detect ischemic brain injury.2,3 The apparent diffusion coefficient (ADC), which measures the extent of water molecule diffusion, drops within minutes after the onset of ischemic stroke3,4 and has been routinely used as a marker of acute ischemic brain injuries.5,6 While it has been assumed that the drop in ADC after ischemic insults is primarily the result of cell swelling,7,8 a range of subcellular pathological processes also take place, including swelling of organelles and neurite beading,9–13 which could also contribute to the change in ADC.14–16 It remains to be investigated how these pathological processes contribute to changes in dMRI signals and to what degree.
Previous studies in animal models of neonatal hypoxic-ischemic (HI) brain injury revealed the presence of both necrosis and apoptosis with structural changes at both cellular level, e.g. swelling of cells and break-down of cellular membrane, and subcellular level, e.g. swelling of mitochondria, synapses, and astrocytic processes.9–12,17–21 A continuum of necrotic and apoptotic cells have been demonstrated, and the necrotic and apoptotic cells exhibit unique cellular and subcellular level changes.11,12,22–25 An untapped potential of dMRI is to provide real-time information on these changes in a way to better understand the ongoing pathological mechanisms, in addition to gross anatomical changes. Information on these pathological changes at varying scales could aid the diagnostic evaluation of ischemic brain injury, such that future therapies can be effectively implemented and efficacy can be tracked in the living neonatal brain.
Recently, diffusion-time-dependent dMRI has showed great potential in characterizing tissue microstructures at different spatial scales.26–28 In dMRI, the estimated ADC reflects the restrictive effects of multiple structural barriers (e.g. the phospholipid-rich membranes of cells and cellular organelles) encountered by water molecules within a certain time period, called the diffusion time. With a long diffusion time, water molecules may travel a distance spanning several cells, and the dMRI signals may reflect both large-scale (e.g. the packing density of cells) and small-scale (e.g. the size of nucleus) structural features. By reducing the diffusion time, the contributions of small-scale microstructural features to the dMRI signals will be enhanced. The introduction of oscillating-gradient dMRI (OG-dMRI)26,29 has made it feasible to measure ADCs at relatively short diffusion times (∼1 ms), which are unattainable with conventional pulsed-gradient dMRI. At such short diffusion times, the dMRI signals mainly reflect sub-cellular level microstructural barriers, as suggested by simulation30,31 and in vitro32–35 studies.
Previously in a mouse model of neonatal HI brain injury, we reported that at 24 h after injury, OG-dMRI ADCs in the cortex and hippocampus with severe edema rise significantly faster with increasing frequency than normal tissues, gradually erasing the edema contrasts observed in PG-dMRI ADC maps. 36 The result suggested that cellular level structural changes, such as swelling, are the main contributors of the drop in PG-dMRI ADC values in the HI-injured brain tissues. In this study, we used the same model to examine the sensitivity of OG-dMRI to detect cellular and sub-cellular level structural changes in tissues with severe and mild edema, at both acute (3–6 h) and sub-acute (24 h) stages.
Methods
Animals and hypoxic-ischemic brain injury
All animal procedures were approved by the Animal Use and Care Committee of Johns Hopkins University School of Medicine. All experiments were conducted in accordance with the Guidelines for the Care and Use of Laboratory Animals of the National Institute of Health and the Animals in Research: Reporting In Vivo Experiments (ARRIVE) guidelines. In this study, 30 C57BL/6 mouse pups from 7 litters (Jackson Laboratory, Bar Harbor, ME, USA) were used. The HI group had 21 pups that were randomly selected to be subjected to HI insults using the Rice–Vannucci model adapted for the neonatal mouse, 37 with unilateral ligation of the right carotid artery followed by 45 min of hypoxia (FiO2 = 0.08). The sham control group had nine pups (one to two from each litter) that had their right carotid artery exposed but no ligation or hypoxia. At 3–6 h after the surgery, MRI data were acquired from four to five mice per litter each time, and two animals (one from the sham group and one from the HI group) from each litter were sacrificed for pathology. The rest were imaged again at the 24 h after the surgery and then sacrificed for pathology. During imaging, mice were anesthetized with isoflurane (1%) together with air and oxygen mixed at 3:1 ratio via a vaporizer.
MRI acquisition
In vivo MRI experiments were performed on a horizontal 11.7 Tesla scanner (Bruker Biospin, Billerica, MA, USA). MR images were acquired using with a 15 mm receive-only planner surface coil, a 72 mm quadrature transmitter coil, and a B-GA 9 S gradient system (maximum gradient strength = 740 mT/m, maximum slew rate = 6600 T/m/s). OG-dMRI data were acquired at four oscillating frequencies (50, 100, 150, and 200 Hz) using a cosine-trapezoid oscillating-gradient spin echo (OGSE) waveform. 38 Conventional PG-dMRI data were acquired with a pulsed-gradient spin echo (PGSE) waveform with diffusion gradient duration (δ)/diffusion separation (Δ) = 4/20 ms. Both OGSE and PGSE dMRI data were acquired using 4-segment multi-slice echo planar imaging (EPI) and the following parameters: echo time (TE)/repetition time (TR) = 52/2000 ms, four signal averages, six diffusion directions, diffusion weighting b = 600 s/mm2, in-plane resolution = 0.17 mm × 0.17 mm, eight slices with a slice-thickness of 0.80 mm, and an imaging time of 6.5 min for each frequency. The OGSE and PGSE sequences were calibrated with a 4% agarose gel phantom as described in our previous study. 36 Co-registered T2-weighted images were acquired using a fast spin echo sequence with TE/TR = 50/3000 ms, two signal averages, echo train length = 8, in-plane resolution = 0.08 mm × 0.08 mm, slice-thickness = 0.80 mm, and an imaging time of 1.6 min. Co-registered PGSE diffusion tensor imaging (DTI) data were acquired using a 4-segment multi-slice EPI and the following parameters: TE/TR = 30/2000 ms, 1 signal averages, 30 diffusion directions, δ/Δ = 4/15 ms, b = 1000 s/mm2, in-plane resolution = 0.17 mm × 0.17 mm, eight slices with a slice-thickness of 0.80 mm, and an imaging time of 4 min. The total imaging time for each mouse was approximately 40 min.
Data analysis
From the PGSE and OGSE measurements, ADC values were calculated for all diffusion directions with ADC = −ln(S/S0)/b and averaged, where S and S0 are signals acquired with and without diffusion weighting (b). 1 The rate of ADC increase with oscillating frequency, namely, Δ f ADC, was calculated by linear fitting of the ADC values against the oscillating frequencies (0 Hz for the PGSE data). The 30-direction DTI data were analyzed using DTIStudio (www.mristudio.org), which generated maps of fractional anisotropy (FA) for structural delineation. Regions of interest were manually defined on the FA images using ROIEditor (www.mristudio.org) in the external capsule (EC), hippocampal CA1, and neighboring cortical regions. Similar regions of interest were also defined on the T2-weighted images using ROIEditor to calculate the mean intensity value in each region and ratios between ipsilateral and contralateral regions. Due to the apparent differences in MRI results between the HI and sham groups, blinding procedures were not used.
Neuropathology
Mice were perfused intracardially with phosphate-buffered saline then 4% paraformaldehyde. Isolated brains were cyroprotected in sucrose and sectioned at a thickness of 80 µm on a freezing sliding-microtome. Brain sections were assigned for Nissl staining, cytochrome-c-oxidase (COX) enzyme histochemistry to detect enzyme activity in situ,9,39 and immunohistochemistry. For immunohistochemistry, sections were stained with the following primary antibodies: mouse monoclonal anti-cyclophilin D (CypD, MitoScience) or rabbit polyclonal anti-superoxide dismutase-2 (SOD2, Stressgen) as mitochondrial markers,40,41 mouse monoclonal anti-microtubule associated protein-2 (MAP2, Sigma) as a neuronal marker, or rabbit polyclonal anti-glial fibrillary acidic protein (GFAP) as an astrocyte marker.
Brain sections were imaged using an Olympus bright-field microscope with a ProgRes C14 Plus digital camera and Progres CapturePro imaging software. Because of the section thickness, images were taken at different Z-axis depths to ensure nuclear discernibility. Nuclear diameters were measured in CA1 pyramidal neurons and layer V cortical neurons with intact or centrally cut nuclei at 1000× in non-overlapping microscopic fields. For each hemisphere of each mouse, 20–40 neurons were measured in the dorsal hippocampus and neocortex. Similarly, for mitochondrial diameter measurements (within the CA1 neuronal cell body) in SOD2 and CypD stained sections, images were taken at different Z-axis depths to ensure mitochondrial discernibility.
Statistical analysis
Two-way analysis of variance (ANOVA) was used to evaluate the effects of oscillating frequencies (0–200 Hz) and the differences among ipsilateral, contralateral, and sham groups using Prism (GraphPad software, Inc. www.graphpad.com), followed by post hoc pairwise t-tests with Bonferroni correction to evaluate the group differences at each oscillating frequency. The differences in Δ f ADC among the ipsilateral, contralateral, and sham groups were evaluated using one-way ANOVA at 3–6 h or 24 h, followed by post hoc pairwise t-tests with Bonferroni correction. The differences in the ipsilateral-contralateral ratio of T2 signal intensities between severe edema and sham groups and between mild edema and sham groups were evaluated using one-way ANOVA at 3–6 h or 24 h, followed by post hoc pairwise t-tests with Bonferroni correction. Neuronal nuclear and mitochondrial diameter measurements were used to determine group means and variances, and comparisons among groups were analyzed using paired t-tests between the ipsilateral and contralateral sides.
Results
T2-weighted and conventional PG-dMRI showed two distinct patterns of brain edema in this neonatal mouse model. Among the 21 HI-injured mice studied, five mice developed severe edema with hyper-intense T2-weighted signals and reduced PGSE-ADC values, primarily in the ipsilateral cerebral cortex and hippocampus (Figure 1(a)). Twelve mice showed mild edema with hyper-intense T2-weighted signals and increased PGSE-ADC values along the external capsule (EC), and some mice showing T2 hyper-intensity in the hippocampus, but without widespread hemispheric infarct (Figure 1(b)). Increased PGSE-ADC in EC after HI has been reported in rodent HI models.42,43 For both edema patterns, T2-weighted images at 24 h often showed enlarged hyper-intense regions compared to images from the same mice at 3–6 h, suggesting progression of edema. Four mice in the HI group were excluded from this study (in addition to the 21 HI mice used in the analysis) because they did not show any abnormal T2 or dMRI signals compared to the sham controls (Figure 1(c), n = 9).
MR images of neonatal mouse brains with severe (a) and mild (b) edema as well as images of sham controls (c) at acute (3–6 h) and sub-acute (24 h) stages post-injury. At 3–6 h, axial T2-weighted images show widespread hemispheric infarct (red arrows) in the severe edema case, and more localized edema (orange arrows) in the external capsule (EC) and hippocampus in the mild edema case. In the severe edema case, pseudo-normalization of PGSE-ADC signals (from 3 to 6 h to 24 h) can be found in the hippocampal CA1 region (indicated by the yellow arrows), whereas the OGSE-ADC (at 100 and 200 Hz) and Δ
f
ADC images consistently highlight the damaged CA1 hippocampus. In the mild edema cases, early signal abnormality in CA1 hippocampus (orange arrows) was evident as early as 3 h after HI from OGSE-ADC at 200 Hz and Δ
f
ADC maps. Hyperintense ADC signals in the CA1 hippocampus and EC (white arrows) are more pronounced in the OGSE-ADC maps than the PGSE-ADC maps at 24 h post-injury.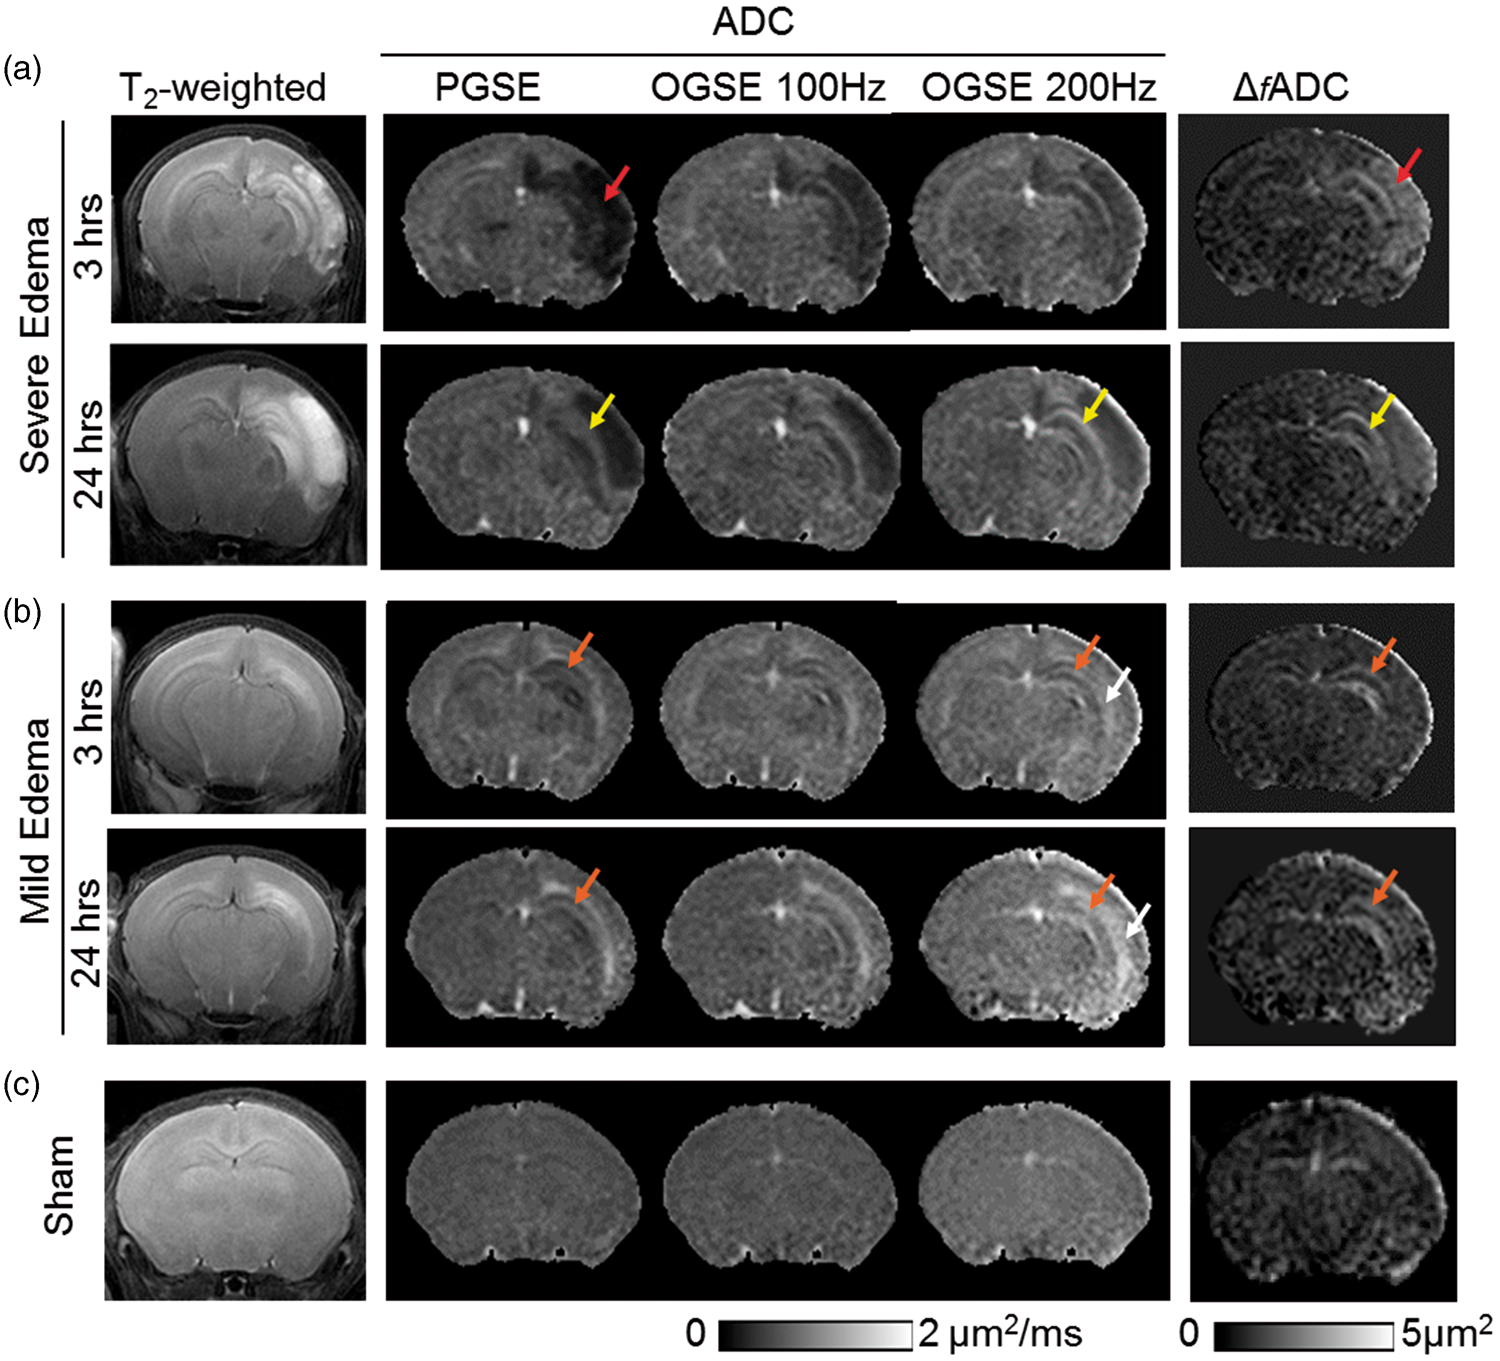
Histologically, histochemical enzyme activity stained for COX in brain sections (Figure 2(a)) from the severe edema group was typified ipsilaterally by infarct and forebrain tissue loss and metabolic failure in residual hippocampus and dorsal thalamus, whereas the mild edema group showed general preservation of the metabolic map ipsilaterally, which was evident by laminar COX activity in cerebral cortex and the high activity in CA1 hippocampus and ventral thalamus. GFAP immunostaining of sections from the mildly injured mouse brains revealed reactive astrocytes within the EC and CA1 at the dorsal hippocampal level (Figure 2(b)), confirming these regions were affected by HI.
(a) COX-stained sections of mouse brains with severe and mild edema. (b) GFAP-stained sections of a mouse brain with mild edema show reactive astrocytes in the ipsilateral external capsule and neighboring hippocampal CA1 and cortical regions, compared to the contralateral side. In the enlarged GFAP stained sections, scale bar = 50 µm.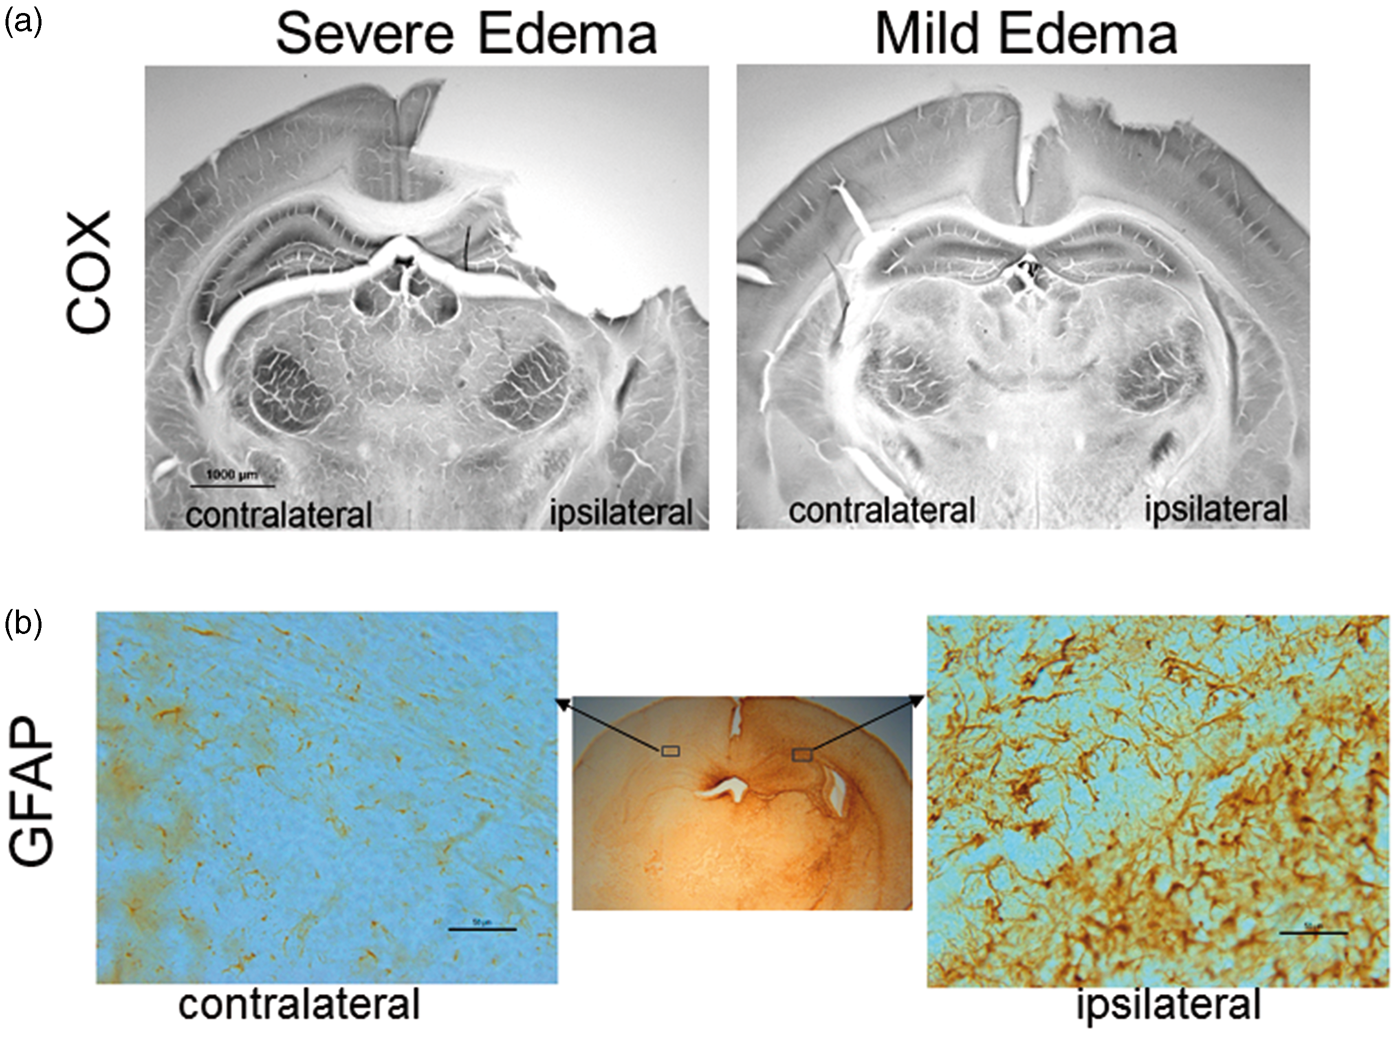
In the mice with severe edema, the PGSE-ADC maps showed drastically reduced ADCs in the edema regions (indicated by the red arrow in Figure 1(a)) compared to the contralateral hemisphere and sham controls. In these regions, the ADC values increased rapidly as the oscillating frequency increased (e.g. hippocampal CA1 region in Figure 3(a)), as reported by us in a separate study.
36
Accordingly, the Δ
f
ADC, which estimates the rate of ADC increase with increasing oscillating frequency, showed significantly higher values in the edema region than the contralateral side (Figure 3(a)). Pseudo-normalization of PGSE-ADC signals similar to those reported in stroke patients44,45 was observed in the hippocampal CA1 regions (indicated by the yellow arrow in Figure 1(a)), as the initial drop in PGSE-ADC values at 3–6 h mostly recovered at 24 h (Figure 3(a)). In comparison, the Δ
f
ADC values in the hippocampal CA1, EC, and cortical regions remained significantly higher than the contralateral region and the shams (p < 0.01) (Figure 3(a) and Table 1). The ratios of ipsilateral and contralateral intensity values in the T2-weighted images showed increased T2 signals in the hippocampal CA1 and cortical regions, but not in the EC (Supplemental Table S1).
dMRI measurements in the CA1 hippocampus of mouse brains with severe and mild edema at 3–6 and 24 h post-injury. (a–b) ADC and Δ
f
ADC measurements in CA1 hippocampus in severe (a) and mild (b) edema cases at the 3–6 and 24-h time points. PG-dMRI measurements are denoted as 0 Hz. * and ** denote significant differences with p-values less than 0.05 and 0.005, respectively. Black and red asterisks denote the statistical differences between ipsilateral and contralateral hippocampus of the HI-injured mice and between ipsilateral and sham groups, respectively, using pairwise t-tests with Bonferroni correction following two-way ANOVA analysis. There was no significant difference between sham and contralateral values. Numerical values of PGSE-ADC and Δ
f
ADC can be found in Tables 1 and 2. (c) Maps of 30-direction PGSE DTI FA, PGSE-ADC, OGSE-ADC at 100 and 200 Hz, and Δ
f
ADC images of a mouse brain with mild edema. The ipsilateral brain regions are enlarged to show elevated OGSE-ADC and Δ
f
ADC values in the EC (yellow arrows) and CA1 hippocampus (red arrows). Representative definitions of EC and CA1 ROIs are overlaid on the 30-direction PGSE DTI FA map. Measurements from the EC will be shown in Figure 5(c). Estimated Δ
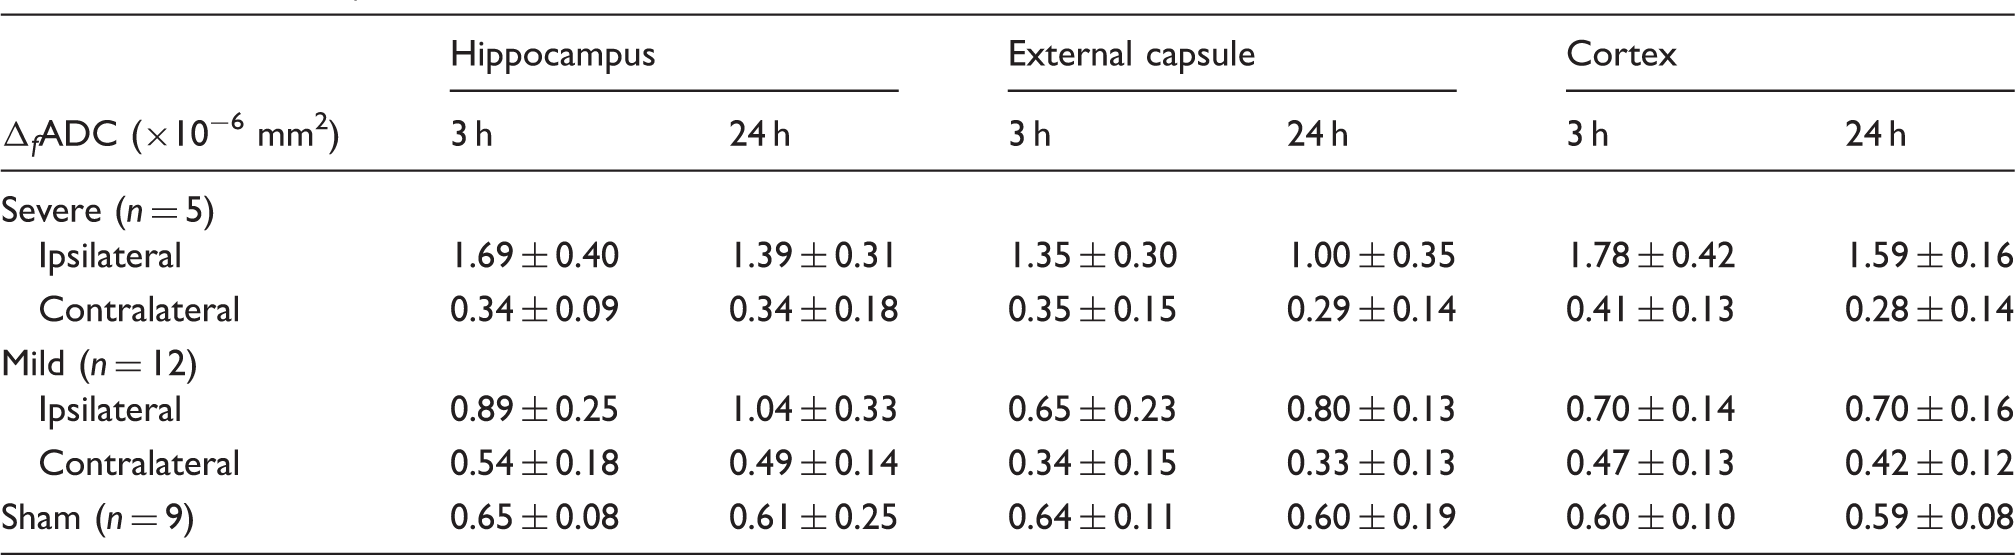
f
ADC values of the hippocampal CA1 region, external capsule, and cortex in injured and sham mice. Note: Data are presented as group mean ± inter-subject standard deviation. ADC: apparent diffusion coefficient.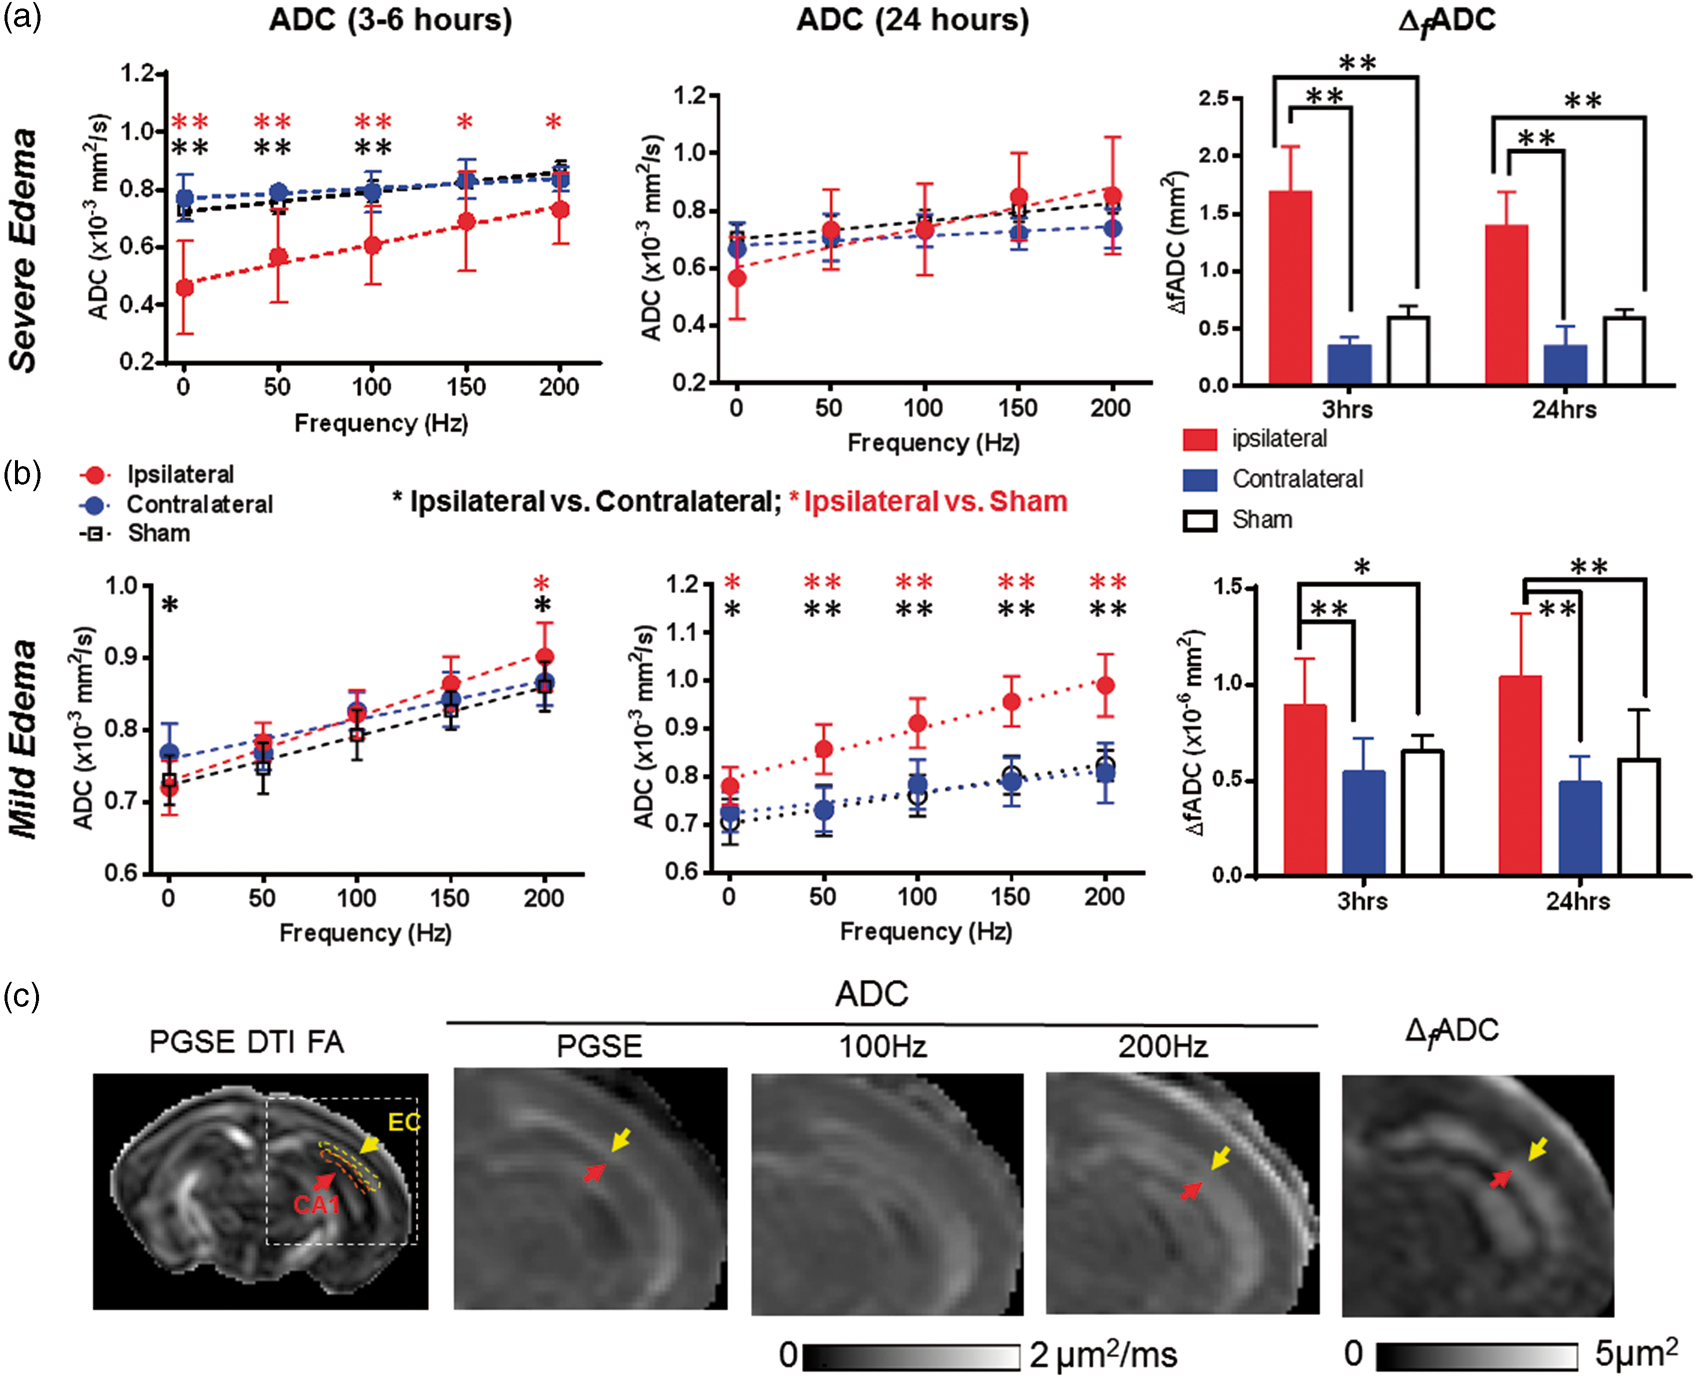
The mice with mild edema showed slightly reduced PGSE-ADCs in the hippocampus (indicated by the orange arrows in Figure 1(b)) and slightly increased ADCs in the EC (indicated by the white arrows in Figure 1(b)), with increased Δ f ADC in the ipsilateral hippocampal CA1 also evident. Quantitatively, the PGSE-ADC values of the ipsilateral CA1 region at 3–6 h were slightly reduced compared to the contralateral side (p < 0.05), whereas the OGSE-ADC values at 200 Hz were higher than the contralateral side (p < 0.05) (Figure 3(b)). Pseudo-normalization of PGSE-ADC signals was also observed in the CA1 region after mild edema. At 24 h after HI, the ipsilateral PGSE-ADCs in the CA1 became higher than the contralateral side and shams (p < 0.05), and the differences enlarged as the oscillating frequency increased (Figure 3(b)). Δ f ADC values in the ipsilateral CA1 region remained significantly higher than the contralateral side and the shams at 3–6 and 24 h by almost two folds (Figure 3(b), p < 0.005). At 24 h after injury, the OGSE-ADC maps at 200 Hz showed an enlarged region with elevated ADCs than the PGSE-ADC map, and the highlighted region at 200 Hz included part of the adjacent hippocampal CA1 region (indicated by the red arrows in Figure 3(c)). At both time points, no significant increase in T2 signals was detected in the ipsilateral hippocampal CA1 region in the mild edema group (Supplemental Table S1).
We studied closely the cellular and subcellular pathology in the ipsilateral CA1 region of the mouse brains with mild edema. Histological data demonstrated a number of subcellular structural changes in the hippocampal CA1 neurons with no apparent overall swelling of these cells. In Nissl-stained sections, the ipsilateral pyramidal neuron nuclear diameters were significantly increased (8.5 ± 0.9 µm) compared to contralateral neurons (6.1 ± 0.5 µm) at 3 h after HI (Figure 4(a)). At 24 h after HI, the nucleus of ipsilateral CA1 pyramidal neurons was attritional as evidenced by the significant decrease in nuclear diameters (3.1 ± 0.4 µm) compared to contralateral neurons (5.9 ± 0.3 µm). Mitochondrial markers within the CA1 hippocampus showed some unexpected cellular distributions that have not been reported on previously. While both CypD and SOD2 are mitochondrial matrix proteins,40,41 CypD immunoreactivity was localized primarily within the hippocampal neuropil in the contralateral CA1, such as within the dendritic regions of stratum radiatum and stratum oriens (Figure 4(b)). In contrast, SOD2 immunoreactivity had a broader distribution within the neuropil and CA1 neuronal cell bodies. At 3 h after HI, both CypD- and SOD2-positive mitochondria accumulated markedly within ipsilateral CA1 neuron cell bodies (Figure 4(b)). Accumulated mitochondria showed evidence for acute swelling as indicated by the significantly increased perikaryal mitochondrial diameters in ipsilateral neurons (0.9 ± 0.5 µm) compared to mitochondria in contralateral neurons (0.4 ± 0.2 µm). The swelling was sustained in ipsilateral neurons (0.9 ± 0.2 µm) compared to contralateral neurons (0.2 ± 0.1 µm) at 24 h after HI (Figure 4(b)). The neuropathological changes are illustrated diagrammatically (Figure 4(c)). In the severe edema type, very aggressive cytotoxic edema prevails and neurons may undergo whole-cell swelling with a large extent of nuclear and mitochondrial enlargement and disintegration. In the mild edema type, while regional vulnerability still persists, individual neurons appear to better manage acute cell volume control and the nucleus and mitochondria swelling may occur at a relatively small extent, but without detectable changes at whole-neuron level at 3 h after injury.
Hippocampal CA1 neuron nuclear (a) and mitochondrial (b) pathology occurred early after HI in neonatal mouse brains with mild edema. (a) Nissl staining of CA1 at 3 h after HI showed that the nuclei (arrows) of ipsilateral CA1 neurons were swollen compared contralateral side and there was ipsilateral parenchymal edema. At 24 h, the nuclei (arrows) of ipsilateral CA1 neurons were shrunken compared contralateral CA1 neurons, while parenchymal edema persisted. The graph at the bottom illustrates CA1 neuron nuclear diameters at 3 h (n = 5) and 24 h (n = 6) after HI (mean ± SD, *p < 0.001; **p < 0.0001). (b) Top row: low magnification images showing that CypD immunoreactivity selectively accumulated in the ipsilateral CA1 pyramidal neuron cell layer at 3 h after HI. In the contralateral CA1, there was diffuse neuropil CypD immunoreactivity. Second row: ipsilateral CA1 pyramidal neuronal cell bodies markedly accumulated large CypD positive mitochondria (arrows), in contrast to the very fine particles of CypD staining (arrows) in the contralateral neurons. sr: stratum radiatum, sp: stratum pyramidal, so: stratum oriens. Third row: SOD2 immunoreactivity showed a different pattern of mitochondrial staining that was more generally localized to mitochondria throughout the sp (arrows), so, and sr. In the ipsilateral CA1 neurons, a subset of mitochondria showed swelling (arrows). The graph at the bottom illustrates CA1 neuron cell body mitochondrial diameters at 3 h (n = 5) and 24 h (n = 6) after HI in mice with mild edema (3 h, *p < 0.05; 24 h *p < 0.001). (c) A diagram illustrating representative cellular and sub-cellular structural changes in the hippocampal neurons at 3 h after HI.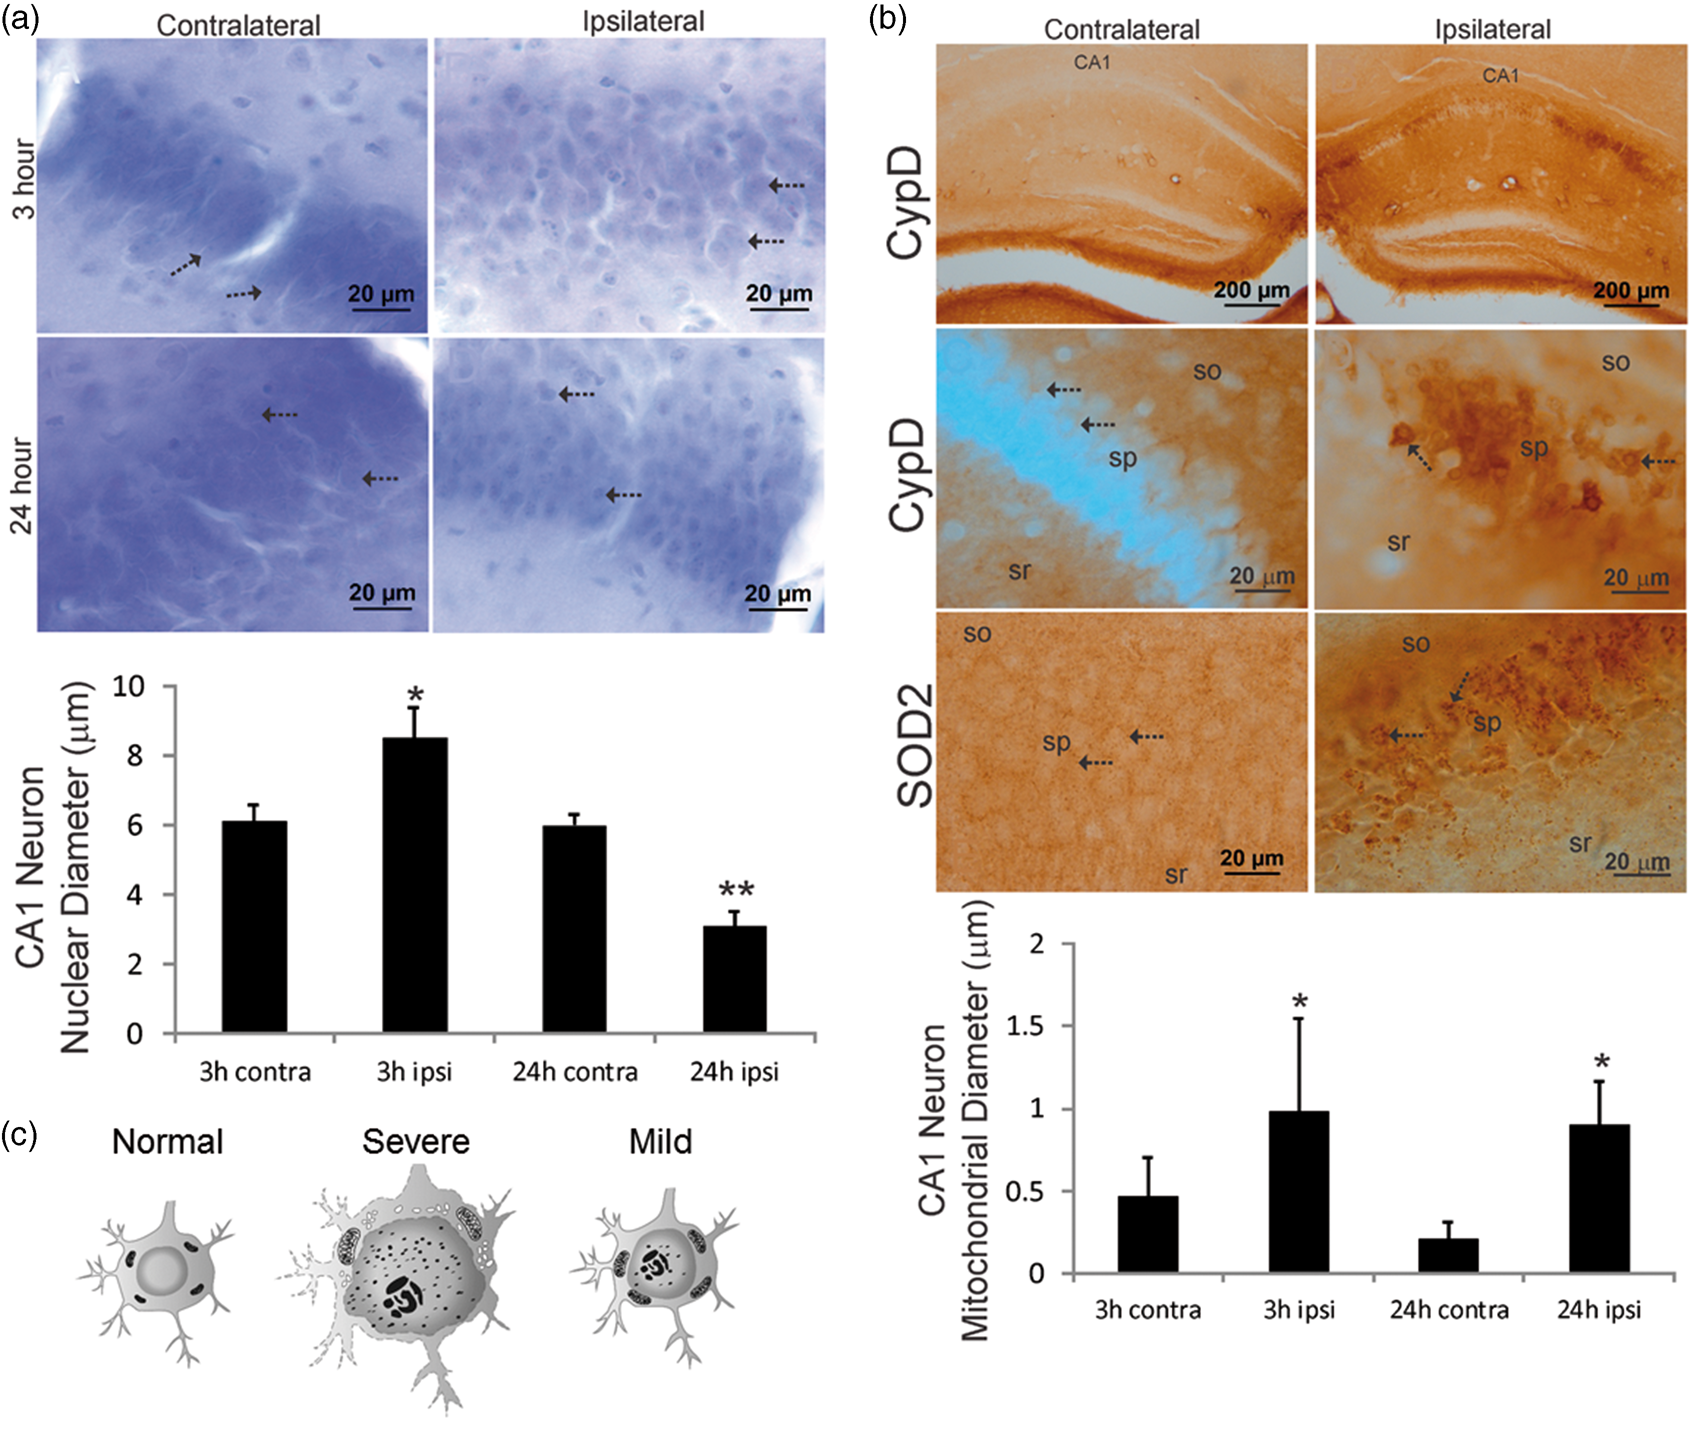
The dMRI signals in the cerebral cortex and EC of mice with mild edema were different from those in the CA1 region. In the EC, the PGSE-ADC values at 3–6 h showed no significant difference between the ipsilateral and contralateral sides, but OGSE-ADCs were already higher than the contralateral side (p < 0.01, Figure 5(a)). At 24 h, the ipsilateral ADC values were significantly higher than the contralateral and sham EC values at all oscillating frequencies (Figure 5(a)). The Δ
f
ADC values in the contralateral EC were significantly lower than the ipsilateral and sham values at both time points; at 24 h after HI, the Δ
f
ADC values in the ipsilateral EC were significantly higher than the contralateral and sham values. In the cortex, PGSE-ADC showed no apparent abnormality at both time points (Figure 5(b)), but the ipsilateral ADC values became significantly higher than the contralateral side at 150 (p < 0.05) and 200 Hz (p < 0.01). At both time points, the ipsilateral Δ
f
ADC values were significantly higher than the contralateral side, but no significant difference was detected between the ipsilateral cortex and sham cortex (Figure 5(b)). Significant increases in T2 signals were detected in the ipsilateral cortex and EC at 24 h after HI, but not at 3 h (Supplemental Table S1).
dMRI measurements of external capsule (EC) and cortex of mouse brains with mild edema at 3–6 and 24 h post-injury and MAP2 immunostaining that revealed early neocortical structural pathology at 3 h after HI. (a–b) ADC and Δ
f
ADC measurements in the EC and cortex in mild edema cases at the 3–6 and 24-h time points. PG-dMRI measurements are denoted as 0 Hz. * and ** denote significant differences with p-values less than 0.05 and 0.005, respectively. Black, red, and blue asterisks denote the statistical differences between ipsilateral and contralateral ROIs of the HI-injured mice, between ipsilateral and sham groups, and between contralateral and sham groups, respectively, using pairwise t-tests with Bonferroni correction following two-way ANOVA analysis. Numerical values of PGSE-ADC and Δ
f
ADC can be found in Tables 1 and 2. (c) MAP2-stained images of ipsilateral (injured) and contralateral (non-HI) parasagittal parietal cortex showing large MAP2-positive dendritic bundles of radially oriented neocortical dendrites. In the ipsilateral cortex, the dendrites were bundled (brackets) and some dendrites appeared tortuous and swollen (arrows). The neuropil was interspersed with pale zones (asterisks). The contralateral cortex had less apparent dendritic bundling (arrows). (d) Ipsilateral neocortical dendrites were thicker than contralateral neocortical dendrites (arrows) as indicated by their width relative to the scale bars.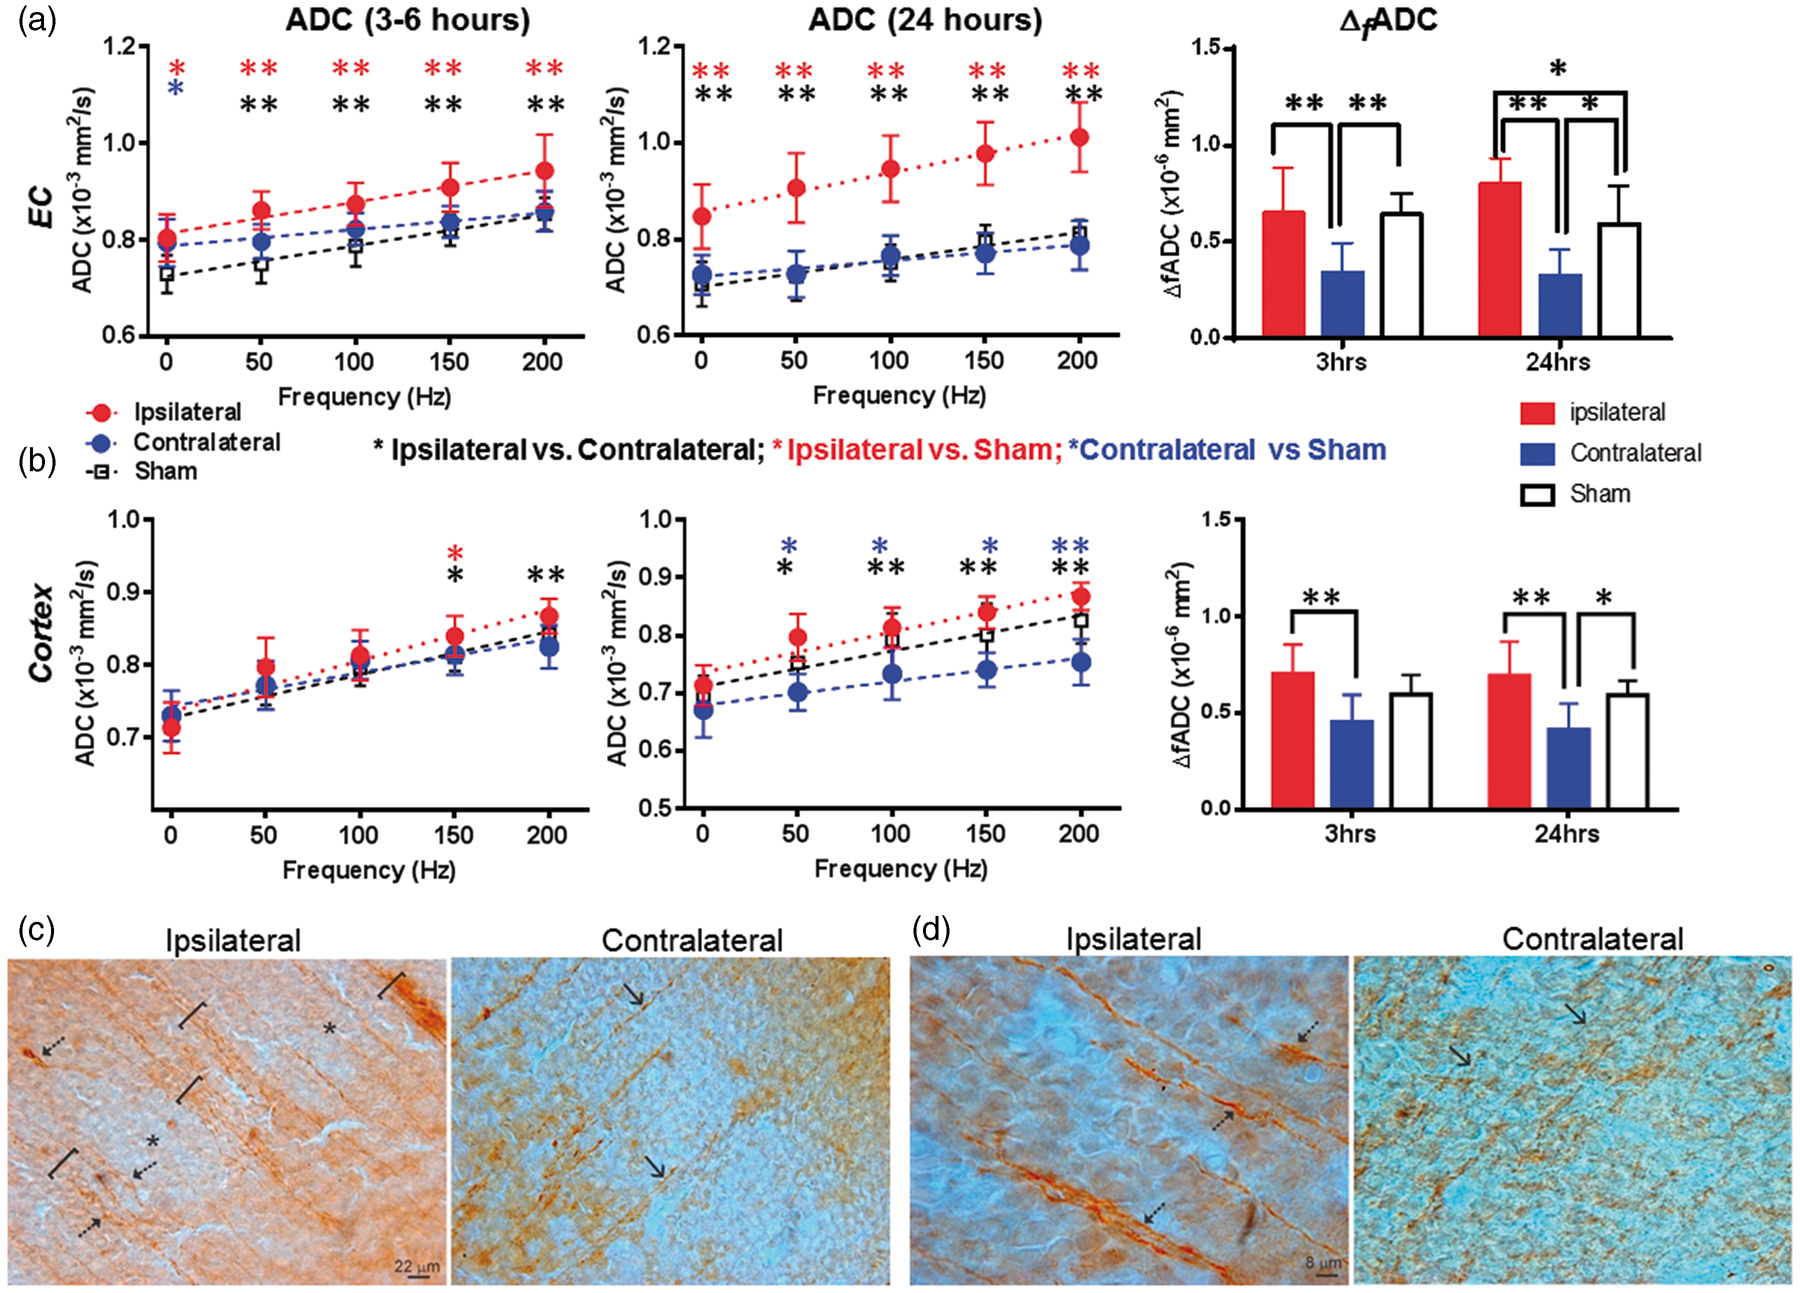
The histology in the neocortex of the mice with mild edema showed swollen and bundled dendrites throughout the ipsilateral cortex in the MAP2 staining (Figure 5(c) and (d)). In layer V of the sensorimotor cortex, significant evidence of nuclear swelling was found at 3 h after HI, with nuclear diameter of 11.1 ± 1.2 µm in the ipsilateral side versus 7.6 ± 0.8 µm in the contralateral side. These layer V cortical neurons located above the dorsal hippocampus and are the likely source of the swollen dendrites.
Discussion
The major finding of this study is that OG-dMRI was able to identify subtle HI brain tissue damages that were difficult to detect using conventional PG-dMRI (as in the mild edema group). Furthermore, the estimated Δ f ADC consistently highlighted damaged brain regions, even after pseudo-normalization of PG-dMRI measurements. Histopathological evidence suggested that the OG-dMRI measurements reflected sub-cellular structural changes. This imaging technique can potentially enhance our ability to non-invasively examine brain tissue damage early after HI and track its regional and subcellular progression.
As the structural changes associated with neonatal HI range from cellular to subcellular levels, OG-dMRI can potentially distinguish these events based on their spatial scales and provide higher sensitivity to subcellular structural changes than PG-dMRI. The root-mean-square displacement, or diffusion length scale, of water molecules are approximately 5–10 µm for OG-dMRI (200 to 50 Hz) and 20 µm for PG-dMRI in this study. When the diffusion length scale is comparable to a group of structures that restrict water diffusion, dMRI signals reflect changes in the sizes of these structures.34,46 The shortened diffusion length scale of OG-dMRI is comparable to the sizes of several subcellular structures, including the dendritic bundles in cerebral cortex (10–20 µm), swollen astrocytes (5–10 µm), the nucleus (5–10 µm in diameter), and mitochondrial in certain pathological conditions (2–5 µm in diameter).40,41 Using a digital phantom, Xu et al. 28 demonstrated that OG-dMRI at 100 Hz can detect changes in the nuclei-to-cell volume ratio, whereas PG-dMRI signals show no apparent change. This and several recent reports47,48 comparing the resolution limits of PG-dMRI and OG-dMRI support the assumption that OG-dMRI can provide higher sensitivity to subcellular level structural changes than PG-dMRI.
PGSE-ADC measurements of the hippocampal CA1 region, external capsule, and cortex in injured and sham mice.
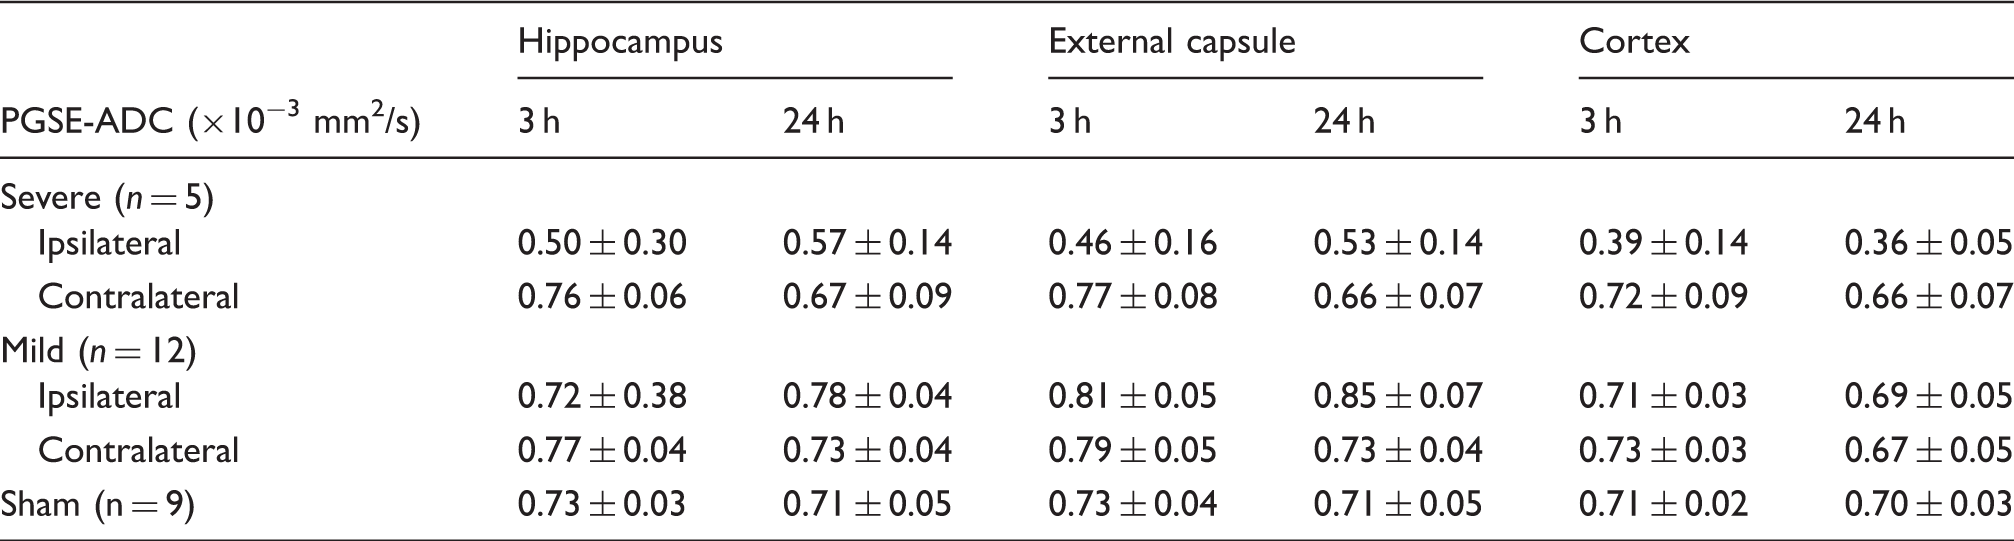
Note: Data are presented as group mean ± inter-subject standard deviation.
PGSE-ADC: pulsed-gradient spin echo-apparent diffusion coefficient.
Neuropathology in the mouse brains with mild edema suggests that the observed changes in OG-dMRI signals reflected sub-cellular structural changes in the brain after HI. In mice with mild edema, the ipsilateral cortex and hippocampal CA1 region did not show apparent whole cellular-level structural changes (e.g. cell swelling), but several sub-cellular level changes were evident by 3 h after HI (Figures 4 and 5(c) and (d)). Given no apparent cellular-level change, the elevated Δ f ADC values in the ipsilateral CA1 hippocampus may reflect astrocyte activation, swelling of the nucleus and other organelles (e.g. the mitochondria), and possibly vacuolation of other cytoplasmic organelles such as the endoplasmic reticulum and Golgi complex.10,11 Sustained elevation of Δ f ADC values at 24 h in CA1 hippocampus in the presence of pyramidal neurons nuclear shrinkage indicates likely contributions from other sub-cellular organelles than the nucleus at this later time point. Because the neuropathology after neonatal HI is manifold and varies with intensity of insult and injury progression, additional work is needed to resolve the difficult problem of pinning down the exact microstructural pathologies that are specific to dMRI measurements.
Instead of comparing ipsilateral and contralateral OGSE-ADC values at each frequencies, we used Δ f ADC to characterize diffusion time-dependent changes in OG-dMRI measurements, which is not available from ADC values at a single frequency. It has been demonstrated that the frequency-dependent changes in ADCs are not necessarily linear.14,49 However, the linear approximation for the relative narrow range of frequencies here is appropriate as shown in Figures 3 and 5. The fitted Δ f ADC is also potentially more robust to subject motion or noise than individual ADC measurement. In practice, it is possible to examine only PG-dMRI and OG-dMRI measurements at one or two frequencies to detect brain damages after HI, once the frequencies that maximize the sensitivity of OG-dMRI to target subcellular structural changes are identified.
Another finding of the current study is that the sensitivity of OG-dMRI to HI related structural change is less susceptible to the processes that cause pseudo-normalization of the PGSE-ADC signals, as this may allow us to better diagnose ischemic brain injuries in sub-acute cases. Pseudo-normalization of PGSE-ADC after the initial insult44,45 makes it challenging to consistently delineate tissue at risk or monitor injury progression.50,51 It is assumed that pseudo-normalization after stroke is associated with the development of vaso-genic edema and increased extra-cellular water content. 52 One possible explanation is that the increased extra-cellular water content, as indicated by hyper-intense T2-weighted signals (Figures 1 and 3), does not play a major role in the diffusion-time dependency as measured by Δ f ADC. Further investigation in this area will likely lead to additional insights. It is also necessary to note that the Δ f ADC values of contralateral hippocampus and cortex, which underwent hypoxia but not ischemia, tended to be lower than the sham controls. Previous studies showed that hypoxia or asphyxia induces neurodegeneration in the neonatal rat brain,53,54 but detailed characterization of structural changes is still lacking.
One limitation of the study is the relative narrow range of oscillating frequencies (up to 200 Hz) of oscillating-gradient dMRI data and the moderate diffusion-weighting (b = 600 mm2/s). A wider range of oscillating frequency and stronger diffusion-weighting may reveal additional structural changes with more sophisticated model than the linear approximation used here. 49 However, the available oscillating frequency and diffusion weighting are dictated by the capability of the gradient system. This is a major obstacle to perform comparable studies on clinical MRI systems, whose gradient systems are often limited (e.g. 40–80 mT/m on clinical MRI systems vs. 600 mT/m or higher on preclinical MR systems). As a result, previous human brain studies typically used b-values up to 200–300 s/mm2 with oscillating frequencies up to 50–60 Hz,38,55 which will reduce the sensitivity of OG-dMRI to subcellular structures, as suggested by several simulation studies.47,48 Recent advances in high performance gradient systems, e.g. the introduction of the human connectome gradient (with gradient amplitude up to 300 mT/m), 56 in combination with improved imaging methods 57 that suppress artifacts due to blood flow at low b-values may allow us to acquire oscillating-gradient dMRI measurements over a wider range of frequency on clinical MRI systems. However, the slew rate of oscillating gradient waveforms used by OG-dMRI needs to be kept within the safety limit to avoid peripheral and cardiac stimulations. In addition, potential biases from hardware limitations (e.g. gradient heating and instrument instability) and prolonged anesthesia need to be carefully considered when comparing OG-dMRI measurements acquired over a relatively long period of time and may be mitigated by employing fast single shot image acquisition and randomizing the order of acquisition.
It is also important to note that HI injuries in human neonatal brain are more complex than in the mouse model, which will likely result in differences in the temporal changes in MRI signals. Yet, these differences are unlikely to affect the relationships between cellular and subcellular structural changes in neonatal HI and changes in dMRI signatures due to the similar cellular and subcellular organization and common pathways of pathogenesis in the injured brain.
Conclusion
We have demonstrated that OG-dMRI can sensitively detect brain tissue damages in a mouse model of neonatal HI injury even when conventional PG-dMRI shows no apparent change or undergoes pseudo-normalization. Specifically, our results suggest that OG-dMRI is sensitive to early sub-cellular structural changes in brain associated with HI injury.
Footnotes
Funding
The author(s) disclosed receipt of the following financial support for the research, authorship, and/or publication of this article: This study is supported by NIH grants R01 HD074593, R01 HD070996, and R21 NS098018
Acknowledgements
We thank Debbie Flock and Oliver Avaritt for their helps with the animal model and histologic sample processing.
Declaration of conflicting interests
The author(s) declared no potential conflicts of interest with respect to the research, authorship, and/or publication of this article.
Authors’ contributions
All the authors were involved in the study design, interpretation of the results, and manuscript preparation. DW and JZ performed the MRI experiments and data analysis. FJN and LJM performed animal surgery, tissue preparation, and neuropathology.
References
Supplementary Material
Please find the following supplemental material available below.
For Open Access articles published under a Creative Commons License, all supplemental material carries the same license as the article it is associated with.
For non-Open Access articles published, all supplemental material carries a non-exclusive license, and permission requests for re-use of supplemental material or any part of supplemental material shall be sent directly to the copyright owner as specified in the copyright notice associated with the article.