
Abstract
In a situation with normal CBF and without increased energy utilization, increased glucose utilization (CMRglc) can be a sign of impaired mitochondrial metabolism, which may be an early step in the injury cascade during reperfusion after hypoxia–ischemia (HI). Seven-day-old rats underwent unilateral carotid artery ligation and 70 minutes of HI. At 3, 6, 12, 24, and 48 or 72 hours after the insult, the CMRglc was measured by the 2-deoxyglucose method, and CBF by the iodoantipyrine method. These were compared with hematoxylin-eosin staining and microtubule-associated protein 2 (MAP 2) immunostaining in adjacent sections. In the ipsilateral hemisphere, there appeared regions with increased CMRglc compared with the contralateral hemisphere 3 to 12 hours after HI that also showed partial loss of MAP 2 immunostaining and early ischemic changes. These areas receded, leaving central glucose hypoutilizing areas with complete loss of MAP 2 immunostaining and histologic infarction, surrounded by only a rim of tissue with increased CMRglc. At 24 and 72 hours after the insult, no regions with increased CMRglc remained. Despite loss of MAP 2 immunostaining and histologic signs of infarction at 24 hours, cortical CBF was not reduced until 48 hours after HI, whereas the CBF in the caudate-putamen already was decreased compared with the contralateral side at 3 hours after HI. In conclusion, early reperfusion is characterized by glucose hyperutilizing areas in the cerebral cortex, followed by a secondary phase with low CMRglc and infarction.
Severe hypoxic–ischemic encephalopathy in asphyxiated newborns is characterized by regionally increased cerebral metabolic rate of glucose (CMRglc) (Blennow et al., 1995), which is associated with later neurologic deficits. A similar pattern of increased CMRglc relative to the rate of energy utilization, or compared with the contralateral side, is found 1 to 5 hours after hypoxia–ischemia (HI) in the cerebral cortex of the immature rat, being most pronounced in histologically intact regions in proximity to areas with lowered CMRglc and early pan-necrosis (Vannucci et al., 1994; Gilland and Hagberg, 1996).
Data indicate that the increased CMRglc reflects impaired mitochondrial function, and that this is an early event in the cascade leading to brain injury after HI. The first hours after HI are characterized by incomplete restitution of ATP and phosphocreatine levels and a persistent increase in lactate concentrations (Palmer et al., 1990; Yager et al., 1992; Gilland and Hagberg, 1996). The energy utilization is low or normal (Vannucci et al., 1994; Gilland et al., 1997), which precludes that the increased CMRglc is secondary to epileptiform activity. In addition, the CBF, evaluated regionally at 2 to 3 hours (Gilland and Hagberg, 1996) and in tissue pieces up to 72 hours after HI (Mujsce et al., 1990), is normal to 24 hours, which rules out anaerobic metabolism caused by reduced oxygen delivery as cause of the high CMRglc. Furthermore, this metabolic impairment is not caused by acidosis, since intracellular pH during the first hour after HI becomes normal or alkalotic (Yager et al., 1991). The activity of cytochrome aa3 (cytochrome c oxidase), the final component of the electron transport chain, is reduced in the hippocampus 1 hour after HI in the immature rat (Nelson and Silverstein, 1994), and there is a reduction of state 3 mitochondrial respiration and whole-brain oxygen consumption after asphyxia in newborn lambs (Rosenberg, 1986; Rosenberg et al., 1989). Finally, we have found a 40% reduction of the mitochondrial respiratory capacity in the 7-day-old rat after HI that precedes neuronal necrosis as seen by a secondary deterioration of the energy metabolites in the tissue (Gilland et al., 1997).
Complete loss of the dendrosomatic neuronal marker microtubule-associated protein 2 (MAP 2) immunostaining is an early and sensitive marker of neuronal damage after an HI insult (McRae et al., 1995; Dawson and Hallenbeck, 1996), but it is not known if a partial loss of MAP 2 immunostaining reflects irreversible neuronal injury (Johnson and Jope, 1992).
This study evaluates regionally the temporal changes in CMRglc, CBF, and MAP 2 immunostaining during the first hours and days after HI in the immature rat to elucidate the extent and time course of tissue with high CMRglc during reperfusion, and whether this tissue is at a risk of developing infarction.
MATERIALS AND METHODS
Animals and chemicals
Inbred Wistar F rat pups of either sex were purchased from Møllegaard Breeding & Research Centre A/S (Skensved, Denmark) and fed by their dams until the start of the experiments at 7 days of age. 2-Deoxy-
Protocol
During 6 to 8 minutes of halothane in oxygen–nitrous oxide anesthesia on snout mask, the left common carotid artery was cut between ligatures of proline suture (Rice et al., 1981). Animals were allowed to recover from anesthesia for 1 to 2 hours. The HI was induced by exposure to 7.7 ± 0.01% oxygen in nitrogen for 70 minutes in a humidified chamber at 36°C, which in our hands results in a final infarction affecting 40% of the ipsilateral hemisphere (Gilland and Hagberg, 1997). Thirty minutes before and after HI, the pups were kept in humidified room air at 36°C. After the insult, the pups were returned to their dams. Rats were decapitated for measurement of CMRglc 3, 6, 12, 24, or 72 hours after HI, and in separate litters for measurement of CBF 3, 6, 12, 24, or 48 hours after HI. Forty-eight hours instead of 72 hours was chosen as the final time for measurement of CBF to avoid weight gain of the pups and allow quantifying the CBF after subcutaneous injection of the isotope, whereas CMRglc was not calculated in the rats decapitated at 72 hours.
The rectal temperature was measured with a thermistor probe (BAT-12, Physitemp Instruments, Clifton, NJ, U.S.A.). All brains and specimens were stored at −80°C.
Measurement of regional cerebral glucose utilization
The CMRglc was assessed by the 2-DG method (Sokoloff et al., 1977) modified for the 7-day-old rat. Because of the small size of the pups (≈10 g), intravenous injections are difficult. Subcutaneous injections give similar results but require longer circulation times before decapitation to minimize the amount of unphosphorylated 2-DG in the tissue (Vannucci et al., 1989; Gilland and Hagberg, 1996). A dose of 2.5 μCi 2-DG in 0.2 mL of saline was injected subcutaneously in fully awake rats, which were kept in a temperature-controlled chamber. Blood was collected at decapitation 90 minutes after injection. A portion of the blood was used to determine glucose concentration with enzymatic-fluorometric technique (Lowry and Passonneau, 1972) whereas the rest was centrifuged at 5000 g for 15 minutes, after which 25 μL of plasma was added to 9 mL of scintillation fluid (0.75 L xylene, 6 g Permablend III, and 0.25 L Triton per L). Samples were counted in a calibrated liquid scintillation counter (1215 Rackbeta, Wallac OY, Turku, Finland). A mean arterial 2-DG plasma concentration curve, made from separate animals decapitated at various intervals after injection, was fitted to the individual pup, depending on amount injected and plasma radioactivity at decapitation (Gilland and Hagberg, 1996).
The brains were removed after decapitation and frozen in isopentane chilled by dry ice. Coronal sections were cut at −20°C, mounted on glass slides, dried, and autoradiographed on Hyperfilm βMax together with [14C]methacrylate standards. Autoradiographs were calibrated and analyzed by quantitative densitometry with a CCD72 video camera and digitizing unit (Dage MTI, MI, U.S.A.) and a Macintosh Quadra 900 computer with NIH Image 1.52 (National Institutes of Health, Bethesda, MD, U.S.A.). Regional CMRglc was calculated by Sokoloff's equation with values of the rate constants from measurements on adult rats (Sokoloff et al., 1977) and the lumped constant from estimations in the 7-day-old rat (0.49) (Gilland and Hagberg, 1996). Since the rats decapitated at 72 hours after HI were substantially larger than the 7-day-old rats used for estimating mean arterial 2-deoxyglucose plasma concentration curves, they were not included in the quantitative analysis and only included in Fig. 1E to give a qualitative description of the relation between the ipsilateral and contralateral hemispheres.
Hematoxylin-eosin staining (H & E), microtubule-associated protein 2 (MAP 2) immunostaining, and 2-deoxy-
Measurement of local cerebral blood flow
The CBF was measured by the autoradiographic IAP method (Sakurada et al., 1978) and adapted to the neonatal rat (Lyons et al., 1987; Gilland and Hagberg, 1996). A dose of 8 μCi of IAP (800 μCi/kg) in 0.2 mL of saline was injected subcutaneously. The rats were decapitated 60 seconds after injection. Ten microliters of blood was solubilized in 1 mL of soluene-350 overnight, added to 9 mL of scintillation fluid, and counted. The brain was removed in less than 35 seconds to minimize postmortem diffusion (Jay et al., 1988), frozen in isopentane cooled by dry ice, and processed for autoradiography, as outlined earlier. The mean arterial blood concentration curve of IAP, calculated from rats decapitated at 20 to 90 seconds after injection, was fitted to the pups decapitated at 60 seconds, which were used for autoradiography and calculation of CBF. The brain–blood partition coefficient was set as 0.944 mL/g (Lyons et al., 1987).
Immunohistochemical and hematoxylin-eosin staining
Adjacent to the sections used for autoradiography, 10-μm sections were cut at −20°C. The sections were fixed during 10 minutes' immersion in 4% paraformaldehyde in phosphate-buffered saline (PBS). After rinsing in PBS, nonspecific binding was blocked for 30 minutes with 2% horse serum in PBS followed by incubation with MAP 2 antibody diluted 1:2000 in PBS with 1% horse serum for 60 minutes. The sections were rinsed in PBS and incubated with a biotinylated horse–anti-mouse antibody for 60 minutes. Endogenous peroxidase activity was blocked by incubation in 0.6% H2O2 in methanol for 5 minutes, followed by the avidin–biotin complex kit for 60 minutes and rinsing in PBS. The slides were placed in sodium acetate buffer (pH 6.0, 0.1 mol/L) for 10 minutes, and the immunoreactivity was visualized with 50 mg of 3,3-diaminobenzidine enhanced with 1.5 g ammonium nickel sulphate, 200 mg β-
Negative controls were made using the same procedure as outlined earlier but excluding the primary antibody. These sections were devoid of immunoreactivity.
Nearby 10-μm freeze-cut sections were stained with hematoxylin-eosin for routine histologic study.
Statistics
Kruskal-Wallis and Mann-Whitney U test with Bonferroni correction for multiple comparisons were used for comparisons with the control group. Wilcoxon paired test was used for comparisons between hemispheres.
RESULTS
Physical parameters
There were no significant differences in rectal temperature or plasma glucose between the different time points (Table 1).
Cerebral glucose utilization (CMRglc; μmol/100g/min) and physiologic parameters in rats decapitated at different times after hypoxia-ischemia
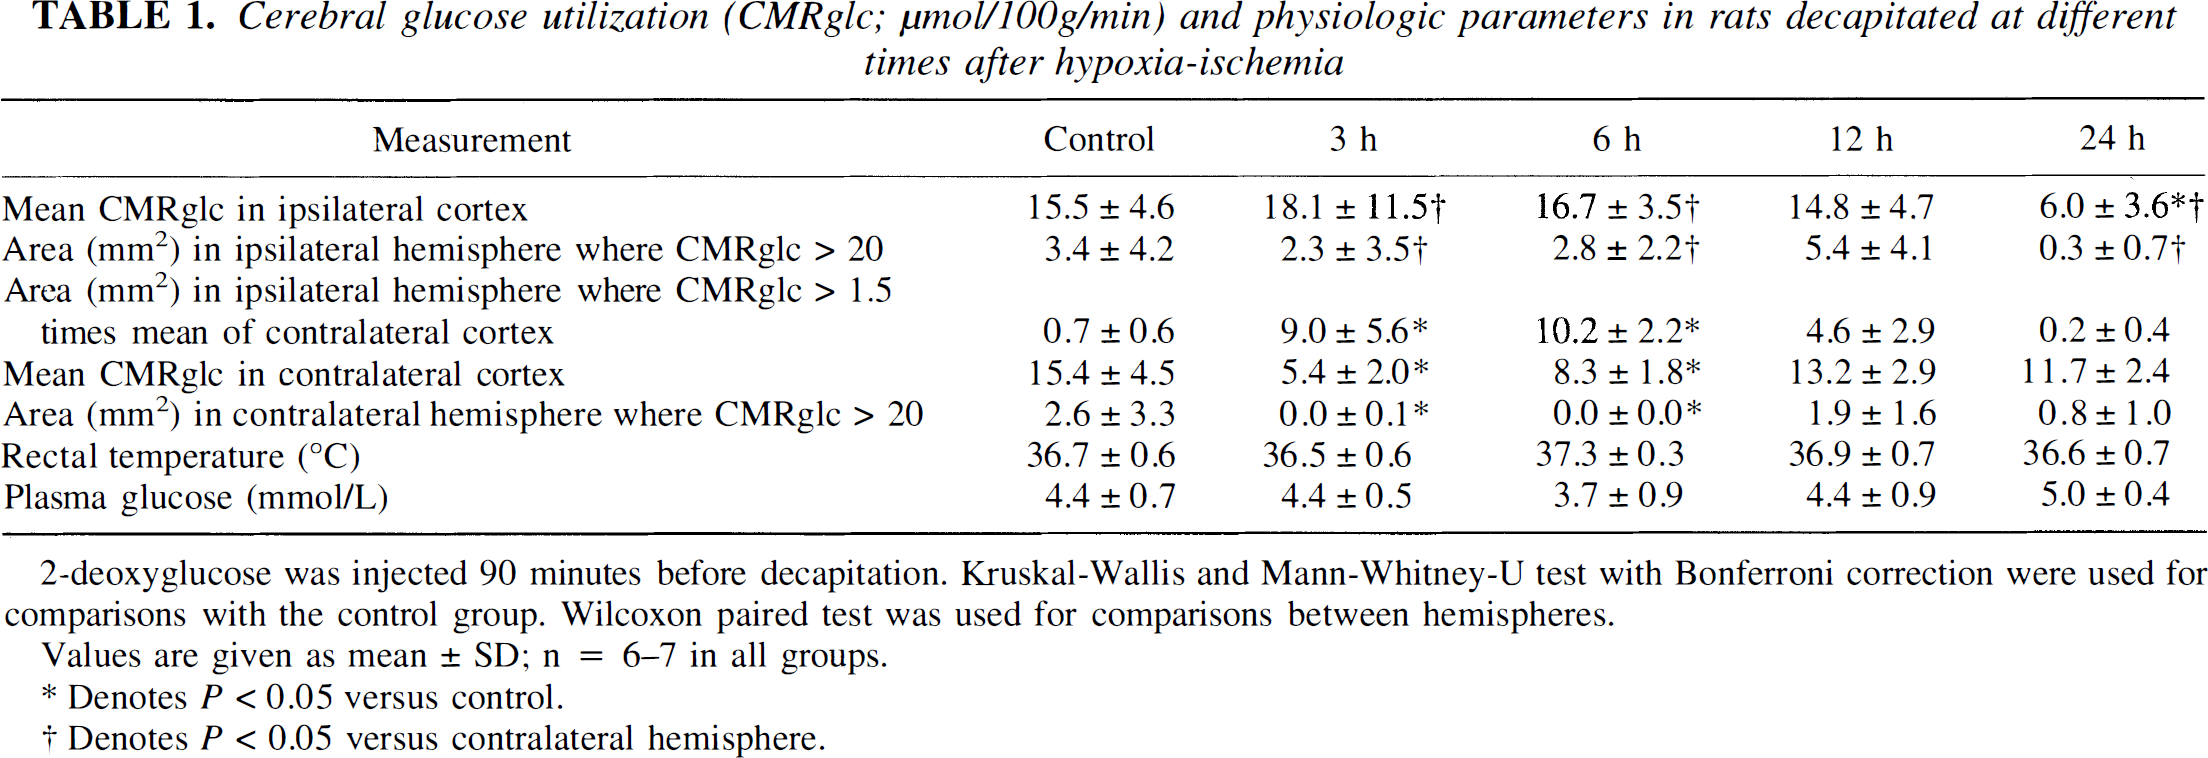
2-deoxyglucose was injected 90 minutes before decapitation. Kruskal-Wallis and Mann-Whitney-U test with Bonferroni correction were used for comparisons with the control group. Wilcoxon paired test was used for comparisons between hemispheres.
Values are given as mean ± SD; n = 6–7 in all groups.
Denotes P > 0.05 versus control.
Denotes P < 0.05 versus contralateral hemisphere.
Glucose utilization
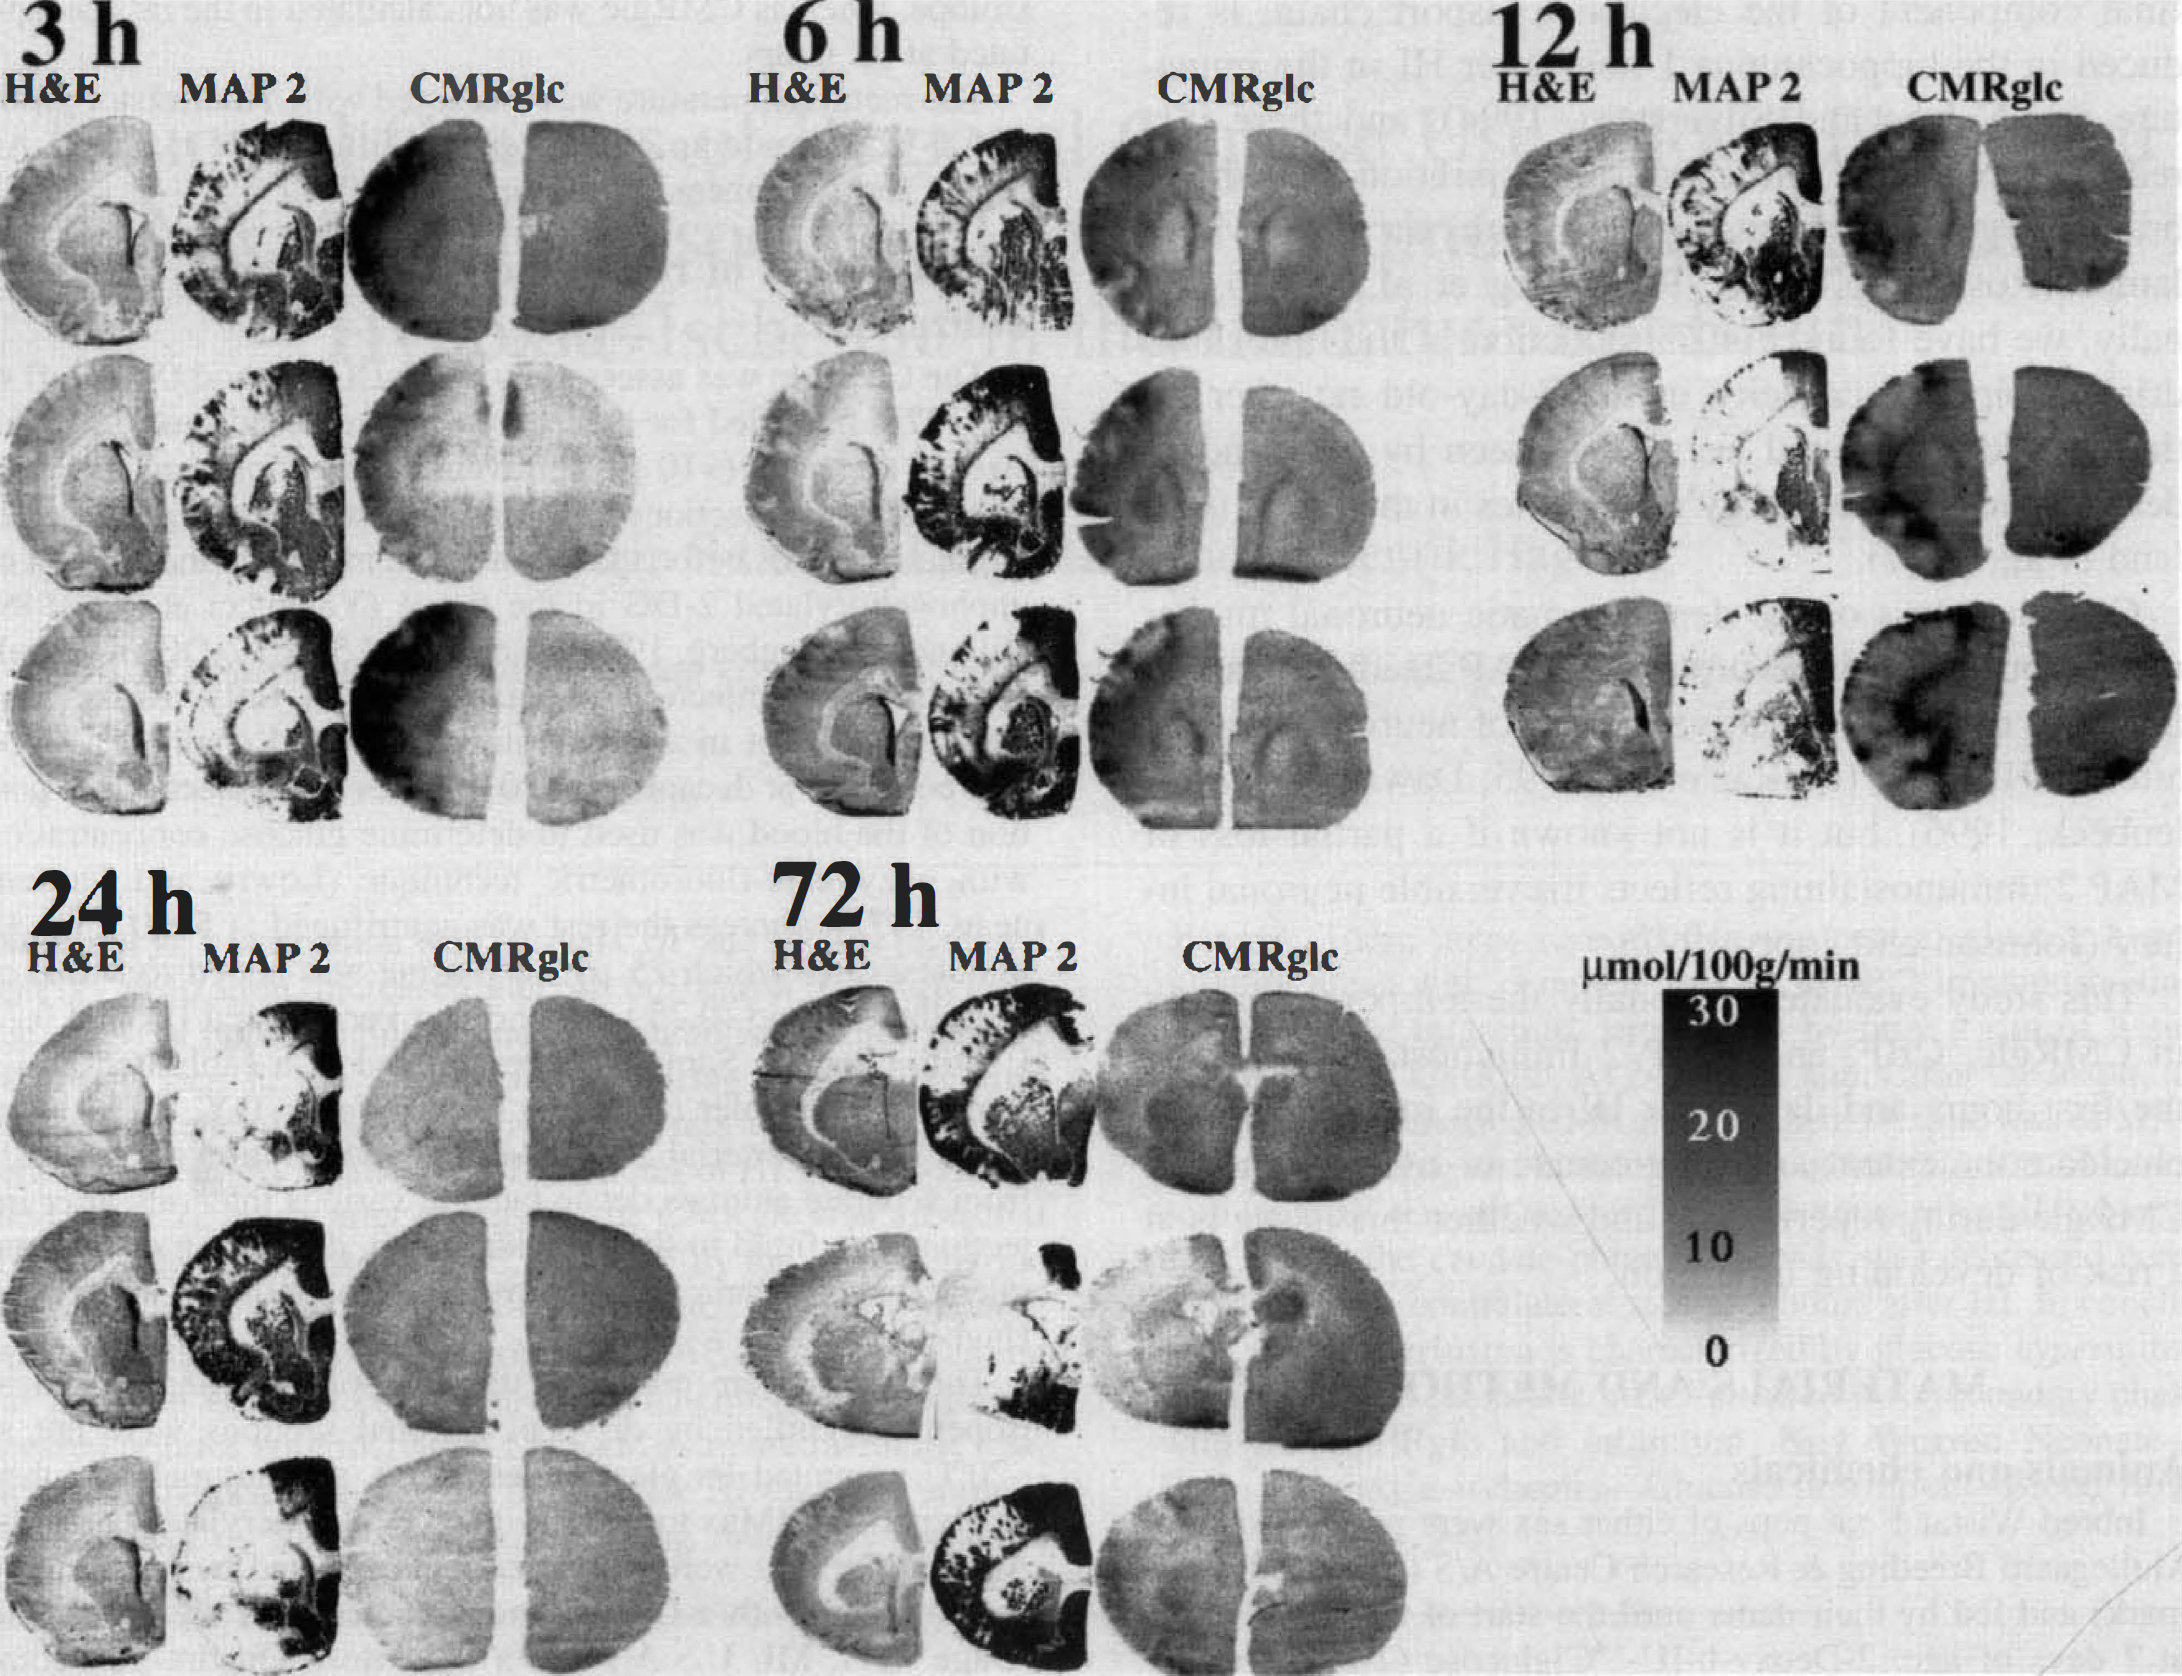
In rats decapitated at 3 and 6 hours after HI, the CMRglc in the contralateral cortex was decreased compared with controls (P = 0.01 and P = 0.03, respectively; Table 1). In contrast, at these times areas corresponding to one third of the ipsilateral hemisphere had a CMRglc exceeding by a factor of 1.5, the mean contralateral CMRglc (P = 0.01 and 0.02, respectively compared with controls; Fig. 1; Table 1), and the mean CMRglc in the cortex was triple or double the rate in the contralateral hemisphere (Table 1). Compared with controls, there was no significant increase in the CMRglc at any time, although values tended to be higher at 3 and 6 hours after HI. At 24 hours after HI, the CMRglc in the ipsilateral hemisphere was decreased both compared with controls (P = 0.03) and with the contralateral hemisphere (P = 0.03; Table 1). Analysis of the regional distribution demonstrated patches of increased CMRglc at 3 hours, which were being replaced by increasingly larger areas with low CMRglc at 6 and 12 hours of reperfusion (Fig. 1). Areas with decreased CMRglc corresponded with areas with complete loss of MAP 2 immunostaining at 3, 6, and 12 hours. Histologically, these areas showed signs of infarction, that is, marked loss of acidophilia and swollen cells with only large pale nuclei. The areas with increased CMRglc had partial loss of MAP 2 immunostaining. Histologically, most cells in areas with high CMRglc appeared to be normal, but some cells showed early ischemic changes such as increased eosinophilia and nuclear changes, and there appeared to be fewer large neurons.
Cerebral blood flow
The CBF in the contralateral hemisphere did not change during the interval (Table 2). In contrast, at 12 hours after HI, the CBF in the ipsilateral cortex was higher than in the contralateral hemisphere (P = 0.04; Table 2) and showed a tendency toward being higher than in controls. At 48 hours after HI, there was a stark reduction of the CBF in the ipsilateral cortex (P = 0.04 compared with controls and P = 0.04 compared with the contralateral side; Table 2). The CBF in the ipsilateral caudate-putamen was reduced compared with the contralateral side at 3 and 6 hours after HI, and again at 24 and 48 hours (Table 2). There was a good correlation between areas with reduced CBF and loss of MAP 2 at 48 hours after HI in the cortex and at all times in the caudate-putamen (Fig. 2). After HI, there was a larger regional variation in CBF than in controls, which was caused partly by areas with slightly reduced CBF and complete loss of MAP 2 immunostaining (e.g., in one brain at 6 hours, there was a localized reduction in the cortex; Fig. 2B). However, in only one brain (at 3 hours after HI) did we find cortical areas with CBF below 30 mL/100 g/min, that is, just below half of the flow in the controls.
Cerebral blood flow (CBF; mL/100g/min) and physiologic parameters in rats at different times after hypoxia-ischemia
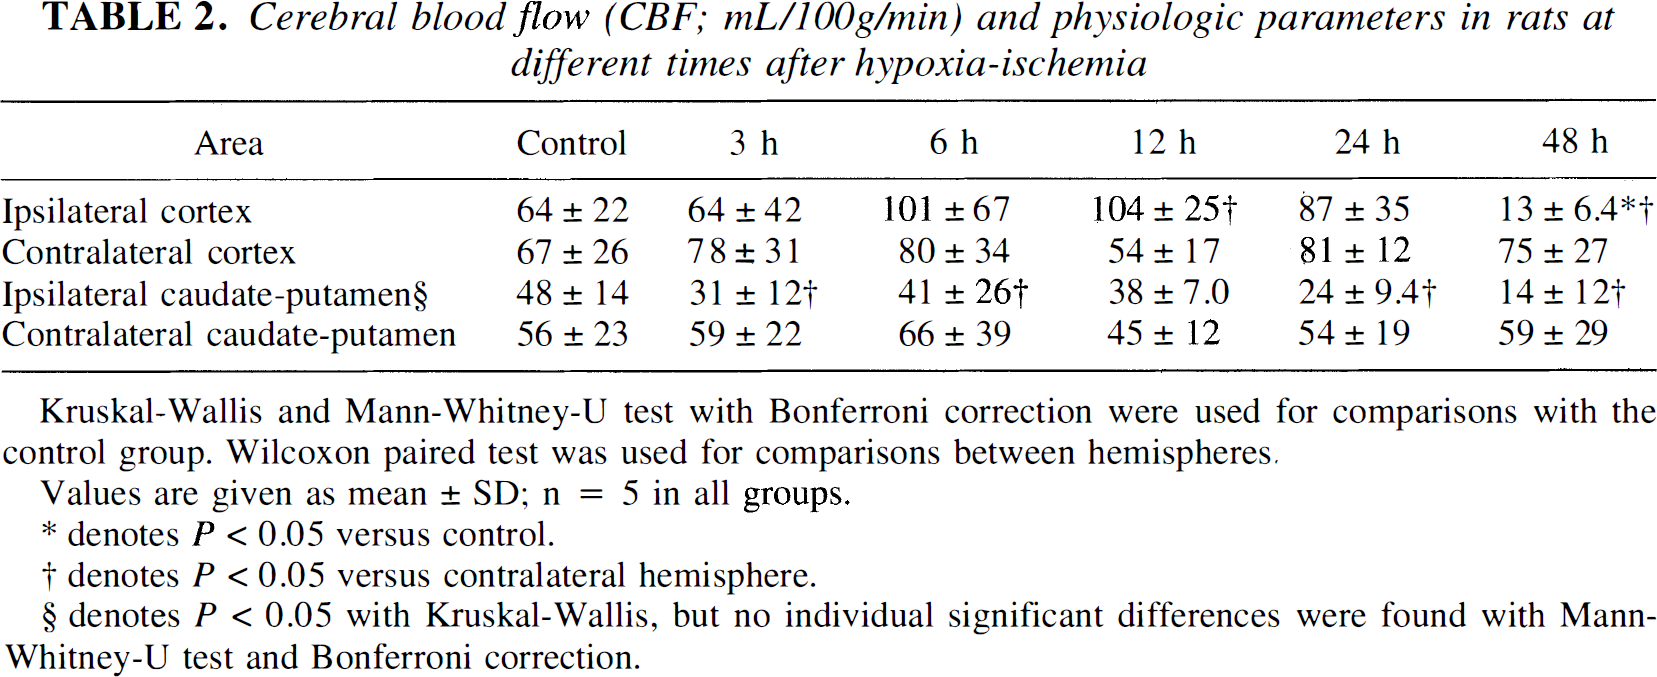
Values are given as mean ± SD; n = 5 in all groups.
denotes P < 0.05 versus control.
denotes P < 0.05 versus contralateral hemisphere.
denotes P < 0.05 with Kruskal-Wallis, but no individual significant differences were found with Mann-Whitney-U test and Bonferroni correction.
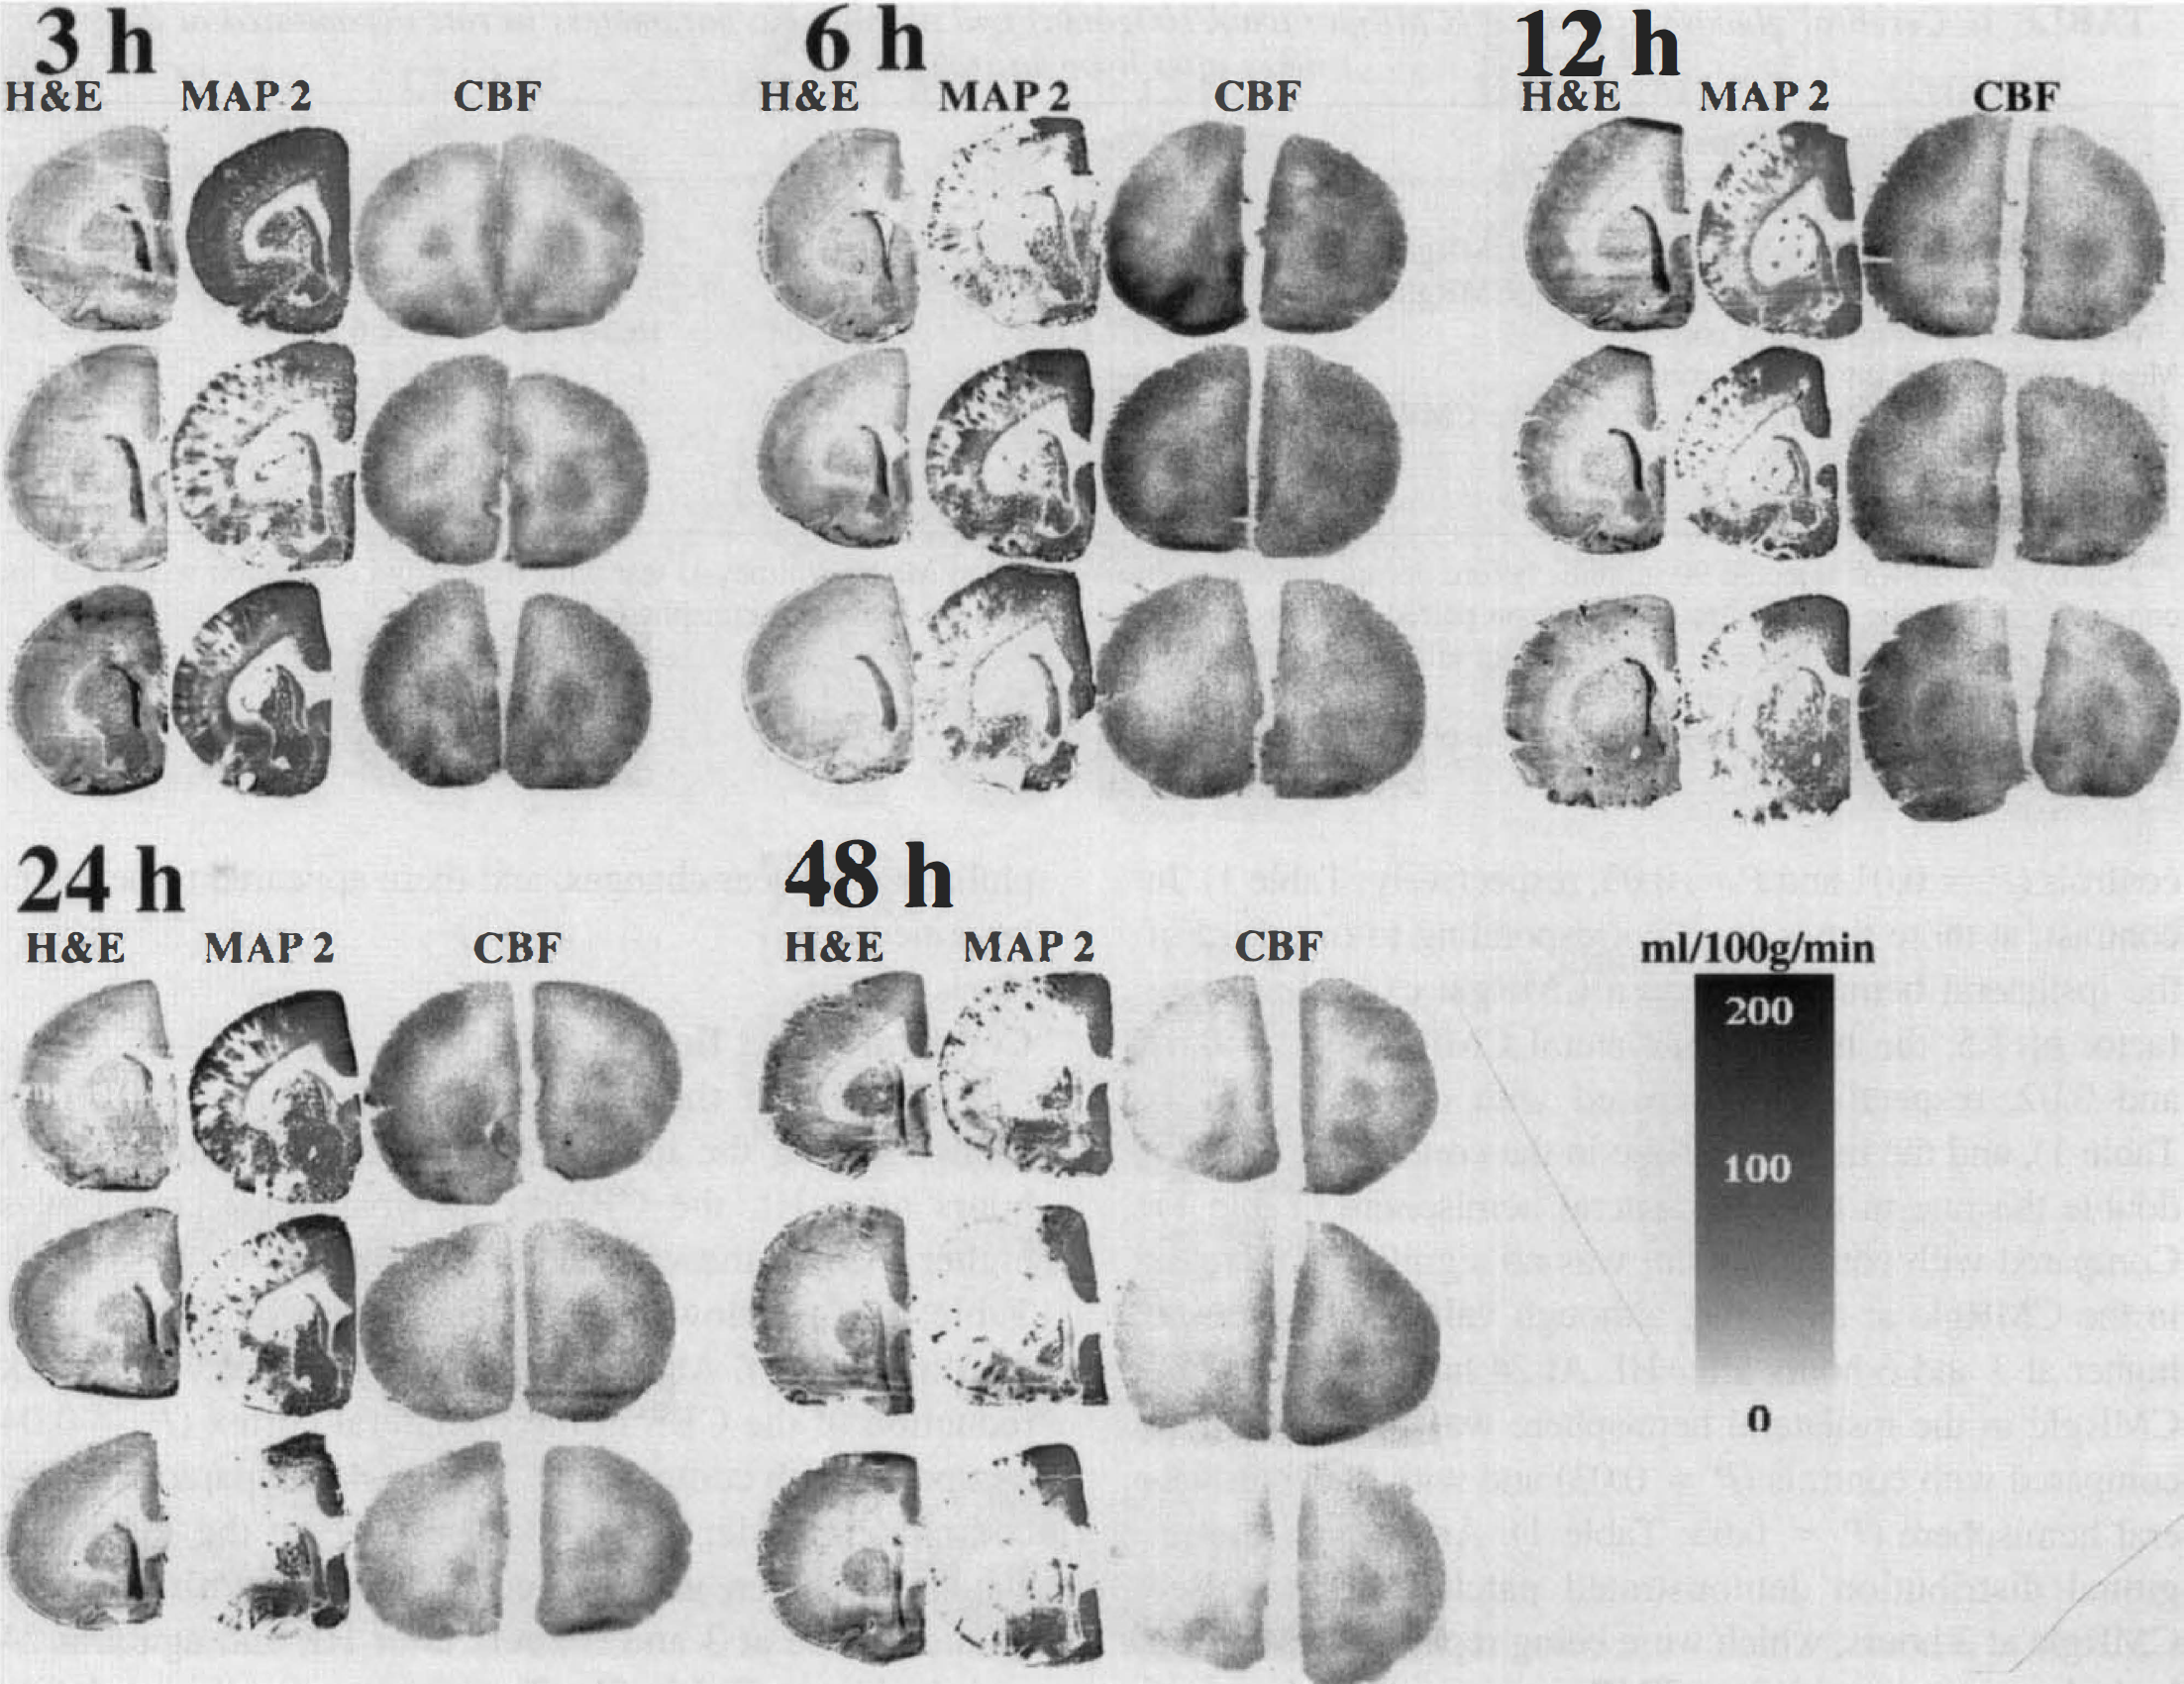
Hematoxylin-eosin staining (H & E), microtubule-associated protein 2 (MAP 2) immunostaining (ipsilateral hemisphere only), and [14C]iodoantipyrine autoradiographs (CBF; mL/100 g/min) from pups that underwent 70 minutes of hypoxia–ischemia at 7 days of age and were decapitated at 3, 6, 12, 24, or 48 hours after hypoxia–ischemia. The brains from three different pups are shown for each point of time. Only the left (hypoxic–ischemic) hemisphere is shown for the H & E and MAP 2 sections. There was no reduction of cortical blood flow until 48 hours after the insult, whereas blood flow in the caudate-putamen already was reduced at 3 hours.
DISCUSSION
The main finding in this study is that there were regions with increased CMRglc in the ipsilateral hemisphere after HI compared with the contralateral hemisphere (Fig. 1; Table 1), which, over the first 24 hours, were replaced by areas with low CMRglc. The CMRglc in the ipsilateral cortex during reperfusion was not significantly increased compared with controls. In the contralateral hemisphere, the CMRglc was decreased compared with controls, which is in agreement with earlier studies (Vannucci et al., 1994; Gilland and Hagberg, 1996) and which has been suggested to be an effect of increased utilization of lactate and ketone bodies after HI, since the cerebral energy utilization is not decreased in the contralateral hemisphere (Nehlig and Pereira de Vasconcelos, 1993; Vannucci et al., 1994; Gilland et al., 1997). The fact that areas in the ipsilateral hemisphere during reperfusion showed markedly increased CMRglc compared with tissue under similar general conditions that would not develop infarction (i.e., the contralateral cortex, which had underwent hypoxia and was exposed to the same circulating levels of lactate and ketone bodies) and that the CMRglc in the ipsilateral hemisphere is increased compared with controls relative to a low to normal energy utilization (Vannucci et al., 1994) indicates that the high CMRglc signals a different metabolic situation compared with tissue that will survive after HI.
When comparing with MAP 2 immunostaining and hematoxylin-eosin staining (Fig. 1), the CMRglc was increased in areas with partial or near complete loss of MAP 2 immunostaining in which few cells showed early ischemic changes in hematoxylin-eosin–stained sections, and most cells appeared to be histologically normal. Areas with preserved MAP 2 immunostaining did not exhibit increased CMRglc. In contrast, areas with low CMRglc surrounded by tissue with increased CMRglc corresponded to areas with a complete loss of MAP 2 immunostaining and histologic infarction. When comparing the CMRglc to MAP 2 immunostaining and histologic findings, however, remember that the plasma levels of 2-deoxyglucose decrease after injection (Gilland and Hagberg, 1996), and the autoradiographs mainly show the CMRglc during the first 30 minutes after injection (i.e., between 90 and 60 minutes before the MAP 2 immunostaining). A progression of infarction is possible during this time, which would lead to larger areas with loss of MAP 2 immunostaining. At 6 and 12 hours after HI, the areas with low CMRglc were larger than at 3 hours, and at 12 hours these hypometabolic areas were surrounded only by a narrow brim of glucose-hyper-utilizing tissue (Fig. 1C). At 24 hours after HI, there was no tissue left with increased CMRglc. The progression from regionally increased CMRglc to decreased CMRglc during 24 hours after HI indicates that the tissue with increased CMRglc is at risk of developing infarction. However, the high CMRglc need not be interpreted as a sign of irreversible cellular injury. Treatment after HI with the N-methyl-
After permanent occlusion of the middle cerebral artery in the mature rat brain, loss of MAP 2 immunostaining 1 to 4 hours after the occlusion agrees with histologic evidence of ischemic injury (Dawson and Hallenbeck, 1996). After transient global ischemia in the gerbil, however, loss of MAP 2 immunostaining precedes the development of overt neuronal loss (Kitgawa et al., 1989; Yanagihara et al., 1990). In this immature rat model of HI and reperfusion, partial loss of MAP 2 immunostaining during the first 12 hours after the insult corresponded to areas with neurons of both normal appearance and with early ischemic changes. Since areas with partial loss of MAP 2 immunostaining also showed increased CMRglc, which might be a sign of reversible metabolic alterations (see earlier), the current data suggest that partial loss of MAP 2 immunostaining does not show irreversible neuronal injury.
The other main finding is that there was no reduction of cortical CBF until 48 hours after HI, despite marked MAP 2 loss and histologic infarction at 24 hours, whereas the CBF in the caudate-putamen already was reduced at 3 hours after HI (Fig. 2; Table 2).
The method of measuring CBF by the Fick principle of diffusible tracers, measures only plasma flow (Sakurada et al., 1978), and small perfusion defects might be masked by postmortem diffusion (Jay et al., 1988; Hatakeyma et al., 1992). That is, the results do not preclude an impairment of the flow of red blood cells and oxygen delivery. However, a major impairment of corpuscular flow seems unlikely in a situation with increased plasma flow. Moreover, these results agree with results from focal ischemia models with reperfusion in adult rats or cats, where CBF measured by microspheres or iodoantipyrine recovers in the cortex but not completely in the caudate-putamen (Takagi et al., 1995; Gartshore et al., 1996; Miyabe et al., 1996). The iodoantipyrine method for measuring CBF also detects secondary hypoperfusion and localized areas with no-reflow after global ischemia in the adult rat (Shirane and Weinstein, 1992; Patel and McCulloch, 1996). The fact that the CBF was intact, even after the tissue had developed overt neural necrosis (Fig. 2), indicates that secondary impairment of the CBF does not play a major role in the damaging process after HI in the immature.
In conclusion, the cortical CBF was not reduced up to 24 hours after HI, despite marked loss of MAP 2 immunostaining, whereas the CBF in the caudate-putamen was reduced already at 3 hours after HI. Between 3 to 6 hours after HI, the cerebral cortex exhibited a pattern of increased CMRglc and partial loss of MAP 2 immunostaining. At 12 hours of reflow, regions with low CMRglc and MAP 2 loss predominated and were surrounded by only a rim of tissue with increased CMRglc. During late reperfusion, 24 to 72 hours after the insult, areas with low CMRglc showed complete loss of MAP 2 immunostaining and overt tissue infarction, and no areas with increased CMRglc remained. This shows that tissue with impaired mitochondrial function, as indicated by increased glucose utilization, is at risk of developing overt infarction.