
Abstract
Cerebral autoregulation (CA) maintains cerebral blood flow (CBF) in the presence of systemic blood pressure changes. Brain injury can cause loss of CA and resulting dysregulation of CBF, and the degree of CA impairment is a functional indicator of cerebral tissue health. Here, we demonstrate a new approach to noninvasively estimate cerebral autoregulation in healthy adult volunteers. The approach employs pulsatile CBF measurements obtained using high-speed diffuse correlation spectroscopy (DCS). Rapid thigh-cuff deflation initiates a chain of responses that permits estimation of rates of dynamic autoregulation in the cerebral microvasculature. The regulation rate estimated with DCS in the microvasculature (median: 0.26 s−1, inter quartile range: 0.19 s−1) agrees well (R = 0.81, slope = 0.9) with regulation rates measured by transcranial Doppler ultrasound (TCD) in the proximal vasculature (median: 0.28 s−1, inter quartile range: 0.10 s−1). We also obtained an index of systemic autoregulation in concurrently measured scalp microvasculature. Systemic autoregulation begins later than cerebral autoregulation and exhibited a different rate (0.55 s−1, inter quartile range: 0.72 s−1). Our work demonstrates the potential of diffuse correlation spectroscopy for bedside monitoring of cerebral autoregulation in the microvasculature of patients with brain injury.
Keywords
Introduction
Cerebral autoregulation (CA) is a homeostatic feedback mechanism that maintains cerebral blood flow despite fluctuations in arterial blood pressure, 1 and is thought to protect the brain from hypo- and hyper-tension. Brain injuries, such as acute ischemic stroke, traumatic brain injury, intracerebral hemorrhage, subarachnoid hemorrhage, and diffuse hypoxic-ischemic injury may disrupt autoregulation for days to weeks. Impaired autoregulation places the brain at risk for further injury,1–8 and the degree of CA impairment may be a predictor of functional recovery.9–12 Further, the potential benefit of hemodynamic interventions that are frequently used to augment cerebral perfusion after acute brain injury6,13,14 may vary widely across patients due to individual differences in the degree of CA impairment. 15 Disturbances in cerebral perfusion can have adverse consequences, including cerebral infarction if there is hypoperfusion and cerebral edema or intraparenchymal hemorrhage, if there is hyperperfusion.16,17 Direct measurement of CA impairment would permit personalization of therapies for acute brain injury based on individualized measurements of cerebral hemodynamic status.
Optimal clinical characterization of CA requires accurate, bedside measurements of both cerebral blood flow and systemic blood pressure suitable for serial measurements. Conventional imaging modalities, such as oxygen-15 positron emission tomography/PET, single-photon emission computer tomography/SPECT, perfusion magnetic resonance imaging/MRI, and xenon-computer tomography/CT, can all measure cerebral blood flow (CBF) accurately, but are ill-suited for CBF monitoring because they involve major instrumentation, in some cases exposure to ionizing radiation, and are costly. Accordingly, these methods are used only rarely in clinical practice.
An alternative to these techniques utilizes the correlation between intracranial pressure (ICP) and systemic blood pressure18–21 as a continuously measured proxy for CA at the bedside. However, the resultant indices do not directly measure CA, and these measurements require invasive ICP monitors. Another technique, transcranial Doppler ultrasound (TCD), can record temporal changes in cerebral blood velocity (CBV) due to induced 9 or spontaneous2,22 fluctuations in arterial blood pressure (ABP). TCD, however, is limited to measurements in single, large, proximal cerebral arteries such as the middle cerebral artery (MCA), and it cannot account for microvascular flow heterogeneities. This limitation may be especially important under ischemic conditions, since microvascular CBF depends on supply from multiple vessels rather than a single large artery. Furthermore, TCD measurement accuracy can be operator dependent, and TCD cannot be performed in up to 15% of patients due to inadequate ultrasound transmission windows. 23 Finally, although TCD is non-invasive, TCD measurements are uncomfortable for long-term monitoring due to pressure at the probe site.
In the present work, CBF is measured with the optical technique of diffuse correlation spectroscopy (DCS). DCS is noninvasive, continuous, and inherently sensitive to local microvascular blood flow. DCS derives CBF from intensity fluctuations of coherent light that has traveled through tissue and been scattered by red blood cells moving in the microvasculature. The characteristic time scale of these fluctuations, computed from a temporal autocorrelation function of the detected light intensity, provides a direct and quantitative measure of microvascular blood flow.24,25 CBF measured with DCS has been clinically validated in humans against other medical technologies including Xenon-CT, 26 TCD,27,28 MRI29–31 and others.32–34 Further, several studies have successfully used DCS as a bedside CBF monitor in ischemic stroke and other acute brain injuries,15,24,26,27,31,35,36 thus suggesting that DCS measurements are well tolerated across a wide spectrum of patients.
In this study, we investigated the use of DCS to directly monitor microvascular CBF, and we characterized the rate of dynamic cerebral (and extra-cerebral) autoregulation during transient blood pressure changes. The pressure changes were induced by rapid deflation of a blood pressure cuff applied to the thigh. Thigh cuff deflation is a well-established method for producing transient changes in blood pressure and CBF; it has been used in multiple studies of CA.9,22,37,38 The DCS-based autoregulation estimates were validated by comparison with concurrent TCD measurements of blood flow velocity in proximal cerebral arteries. We also measured concurrent blood flow responses in the superficial extra-cerebral tissues of the scalp in order to characterize blood flow regulation in the systemic microcirculation. Two technological advances were critical for these measurements. First, the CBF measurement rate was increased to 20 Hz by utilizing a new software approach to measure the DCS correlation functions. 39 Second, an optical-probe pressure-modulation algorithm40,41 was employed to distinguish CBF changes from blood flow changes in superficial extra-cerebral tissues (e.g. scalp). Together, these improvements facilitated independent monitoring of blood flow and autoregulation in both cerebral and systemic circulations simultaneously.
Methods
Participants
The study protocol was approved by the University of Pennsylvania’s Institutional Review Board, which adheres to the guidelines of the Common Rule and the United States Food and Drug Administration’s Institutional Review Board and human subject regulations; 21 healthy adult volunteers, 18 years or older, with no history of prior brain ischemia were recruited for the study. All participants provided written consent to participate in the study. We excluded subjects who were pregnant, who had a prior history of vascular risk factors (hypertension, diabetes, hyperlipidemia, coronary artery disease, atrial fibrillation, prior myocardial infarct or stroke, transient ischemic attack, or history of smoking), or who had a prior neurosurgical procedure or traumatic brain injury or lower extremity amputation.
Hemodynamic monitoring
Optical CBF measurements were carried out using a custom DCS instrument. 39 Briefly, coherent laser light (785 nm, 80 mW, CrystaLaser Inc., Reno NV) of constant intensity was coupled out of the source using custom fiber-optic probes (Fiberoptic systems, CA), and was then directed to illuminate the subject’s forehead, bilaterally, at the temporal margin. Light transmitted through tissue was detected using the probe at 1.0 cm and 2.5 cm ‘source-detector’ separations. The detected light was directed to single photon counting detectors (SPCM-4AQC, Excelitas). Note, light detected at the 1.0 cm source-detector separation is primarily sensitive to superficial, extra-cerebral tissues (i.e. scalp), while light detected at the 2.5 cm source-detector separation probes both cerebral and extra-cerebral tissues. The detected intensity autocorrelation functions were computed using custom software 39 at 20 Hz measurement rates. CBF was estimated by fitting the recorded autocorrelation functions to a two-layer solution of the correlation diffusion equation. 41
CBF velocity was monitored bilaterally using TCD. The TCD probes (Compumedics Ltd, Singen, Germany) were placed at the temporal bone windows to insonate the MCA and/or the anterior cerebral artery (ACA) in each hemisphere. Analog outputs of the TCD waveforms were digitized at 20 Hz, and simultaneously recorded with optically measured CBF. Both TCD and fiber-optic probes were held in place using a commercial headband (Diamon adjustable headframe). Blood pressure was monitored non-invasively using a finger plethysmograph device (Finometer Pro, Finapres Medical Systems, Netherlands). The ABP waveforms permitted computation of estimates for mean ABP, and heart rate; these data were digitized at 20 Hz and were recorded simultaneously with optically measured CBF and TCD blood flow velocity.
Measurement protocols
After obtaining informed consent, all subjects were placed supine with the head-of-bed flat, with DCS, TCD and Finapres probes attached. Large blood pressure cuffs (Zimmer Inc., Warsaw, IN) were then placed around each thigh, 10 cm above the knee (Figure 1(a)). After 5 min of baseline monitoring, both thigh cuffs were inflated to approximately 25–30 mmHg9,22,42 above the subject’s average systolic blood pressure (estimated using the Finapres). The thigh cuffs included a custom-mounted sensor (Amphenol Nova NPA-300B-015 G) to record cuff pressures at 20 Hz. Occlusion was maintained for 4 min, followed by simultaneous deflation of bilateral cuffs, and concurrent recording of blood pressure and CBF for an additional 4 min after the start of cuff deflation. This cycle was repeated for a total of three trials. At the end of the measurements, a mild, finite pressure was manually applied on the optical probes, once for approximately 30 s (pressure modulation protocol) to facilitate segregation of cerebral and extra-cerebral blood flow.
41
(a) Schematic of dynamic autoregulation measurements using DCS. Optical blood flow measurements are realized with two fiber optic probes attached to the frontal regions of the head (blue lines), while TCD blood flow velocity measurements are realized using transducers placed over the temporal bone (green lines). Arterial blood pressure is measured using a commercial Finapres Blood pressure monitor attached to the subject’s finger. (b) Schematic that describes data and analysis of hemodynamic waveforms to estimate rate of dynamic autoregulation. Solid blue and red lines denote the measured mean arterial pressure and cerebral blood flow (either DCS or TCD). Black vertical dotted line denotes the time of cuff deflation. The bottom curve denotes the relative change in cerebrovascular resistance derived from relative changes in pressure and flow. The shaded green region depicts the ‘autoregulation region’, i.e. the time at which cerebral resistance decreases and cerebral blood flow increases. Black dashed line within the autoregulation zone represents a linear fit to the change in resistance, the slope of which is used to estimate the rate of dynamic autoregulation.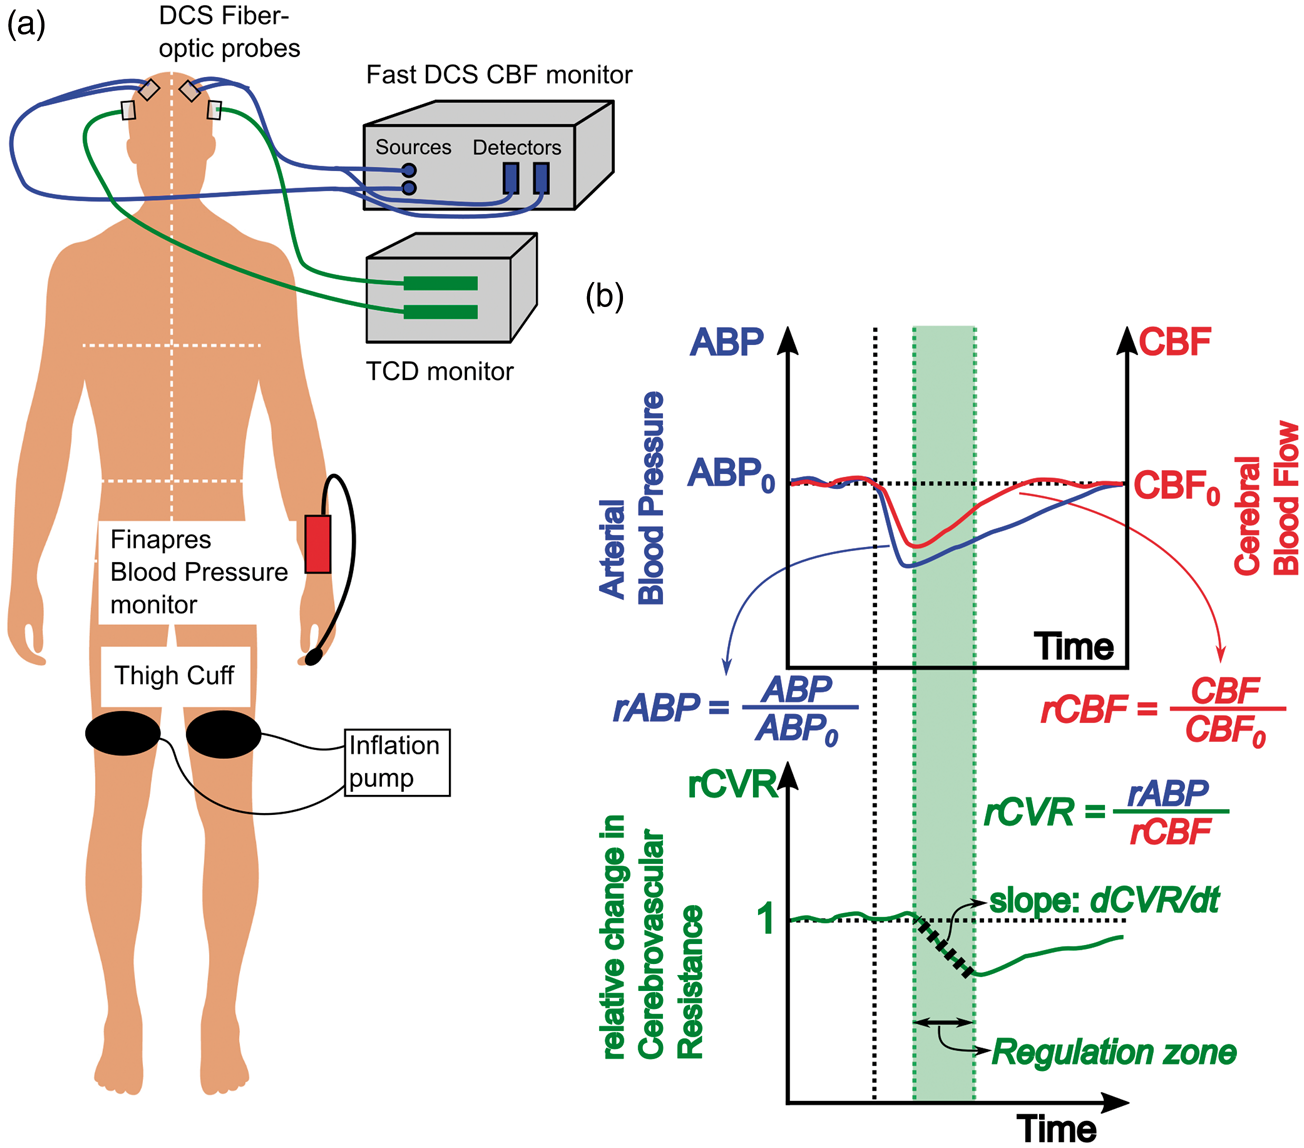
Analysis of CBF data
The algorithms and methods to estimate CBF changes without the confounding influence of scalp blood flow are described in detail elsewhere.
41
Very briefly, DCS intensity autocorrelation functions were computed and recorded at source-detector separations of 1.0 cm (‘short’, sampling only extra-cerebral tissues), and 2.5 cm (‘long’, sampling both cerebral and extra-cerebral tissues). The aforementioned pressure modulation protocol
41
perturbs (reduces) blood flow in only the extra-cerebral tissues (i.e. scalp). This constraint was then combined with a two-layer analysis of the intensity autocorrelation functions from both source-detector separations to derive calibration constants (which depend parametrically on tissue optical absorption and reduced scattering coefficients for the top and bottom layers which were assumed to be 0.1 and 8 cm−1). These calibration constants, which include estimates for extra-cerebral layer thickness and weighting/correction factors for differential light pathlengths through the two layers, were subsequently utilized in a two-layer modified Beer–Lambert model for blood flow40,41 to derive estimates of cerebral (
Estimation of rate of dynamic autoregulation
The CBF (
First, relative changes in blood pressure and CBF were calculated for each trial, by normalizing to the pre-deflation baseline (see Figure 1(b), top). The relative changes of these variables are:
Second, the relative change in cerebrovascular resistance (
Finally, a rate of regulation (
Results
Of the 21 subjects who participated in the study, multi-modal hemodynamic monitoring was only possible in 18. One subject did not tolerate thigh cuff inflation, and data acquisition was unsuccessful in two subjects due to a faulty optics and/or TCD probe. Further, in three subjects, the application of the pressure algorithm to isolate the CBF was unsuccessful; the applied pressure in these cases was insufficient to reduce extra-cerebral blood flow and resulted in a two-layer fitting that did not converge. Finally, in four subjects, the blood pressure did not decrease immediately following cuff deflation due to technical issues with the blood pressure cuff deflation apparatus. Therefore, data from these cases were excluded, leaving 11 subjects for the final analysis.
In three of the 11 subjects, the cuff-deflation induced blood pressure and/or blood flow change was insufficient (<5%) to reliably estimate and compare rates of dynamic autoregulation. These three cases were included for cumulative analysis (Figure 2, Table 1), but they were considered outliers in statistical analyses (Figures 3 and 4, see also Supplemental Figure 1).
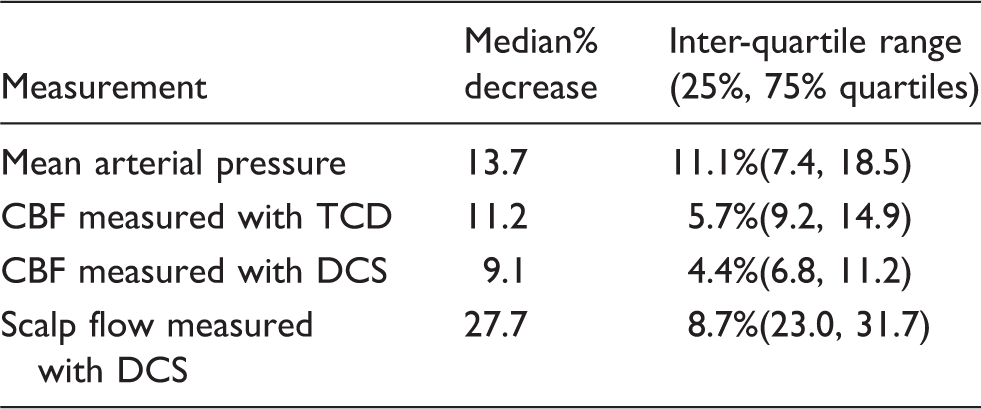
Dynamic cerebral autoregulation estimated from 11 healthy subjects with the thigh cuff method, using relative blood flows measured with transcranial Doppler ultrasound (left), cerebral blood flow with optics (middle), and extra-cerebral/scalp blood flow with optics (right). Panel in the first row shows the corresponding changes in mean arterial blood pressure. In all panels, black dashed lines at time t = 0, represents the instant of cuff deflation, while solid gray lines depict the individual measurements. Solid blue, red, and green lines are the averaged relative changes in blood pressure, blood flow and cerebrovascular resistance, respectively; 95% confidence intervals of these averages are marked by the shaded region in the corresponding color. ‘Autoregulation times’ are denoted by the red dashed vertical lines; measurements during these times were used to estimate the rate of regulation. Median % decreases in measured hemodynamic parameters immediately after thigh cuff deflation (n = 11). TCD: transcranial Doppler ultrasound; DCS: diffuse correlation spectroscopy; CBF: cerebral blood flow Box plots depicting rate of regulation (a) and autoregulation start times (b), as estimated using TCD, DCS cerebral blood flow, and DCS extra-cerebral/scalp blood flow. Individual data points are depicted using a filled blue circle ( Comparison of the rates of regulation measured using TCD and DCS (cerebral), excluding outliers. A scatter plot on the left panel, shows a linear relationship (R = 0.81) between RORTCD and RORDCS. Individual data points are shown with a blue circle (horizontal and vertical error bars indicate uncertainties in the estimate of ROR as measured by TCD and DCS), with a linear fit line (solid red), the 95% confidence interval of linear fit (shaded red region) and a 1:1 line (dashed black). The slope of the regression line was estimated to be 0.9 ± 0.18. A Bland–Altman plot in right panel shows the distribution of individual measurements between 95% confidence intervals for agreement (top, and bottom dashed horizontal lines), as well as a small error (0.01) between the measurements (middle dashed horizontal line), that is not significantly different from zero (see also, Supplemental Figure 2).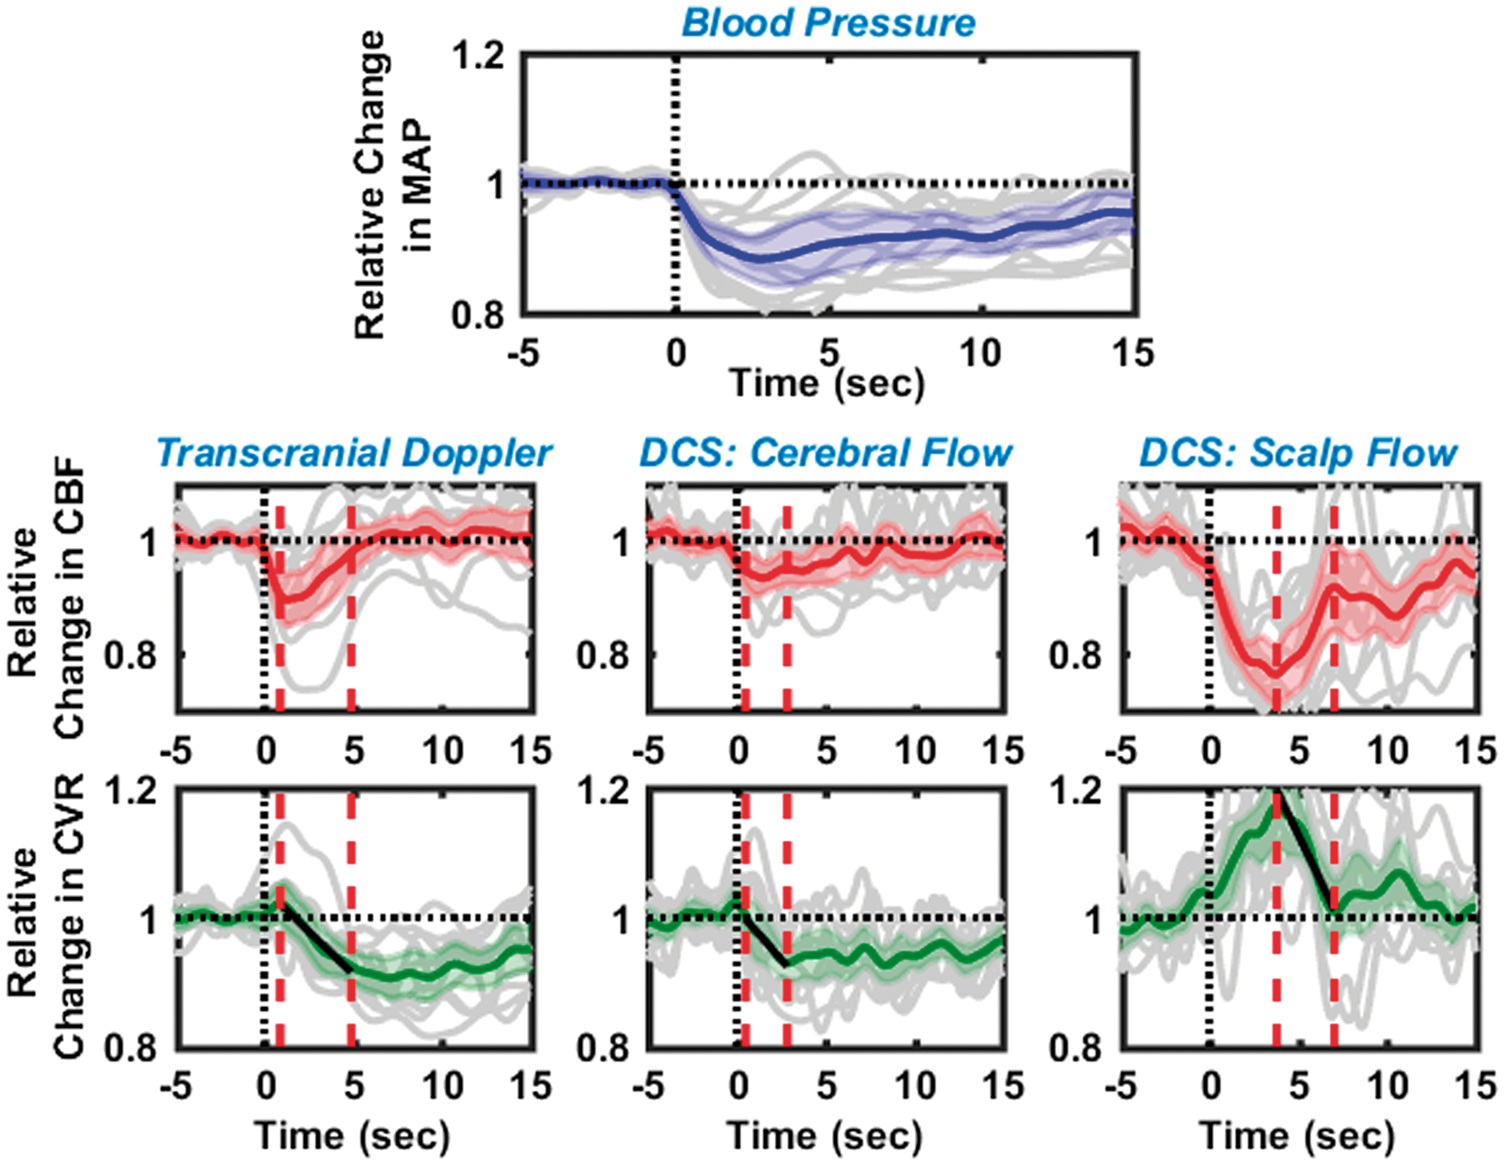
 , n = 8). Outliers (not included in the analysis, see text) are marked with red asterisk (
 ). Horizontal red line in each box represents the median of measurements, while horizontal blue lines represent the 75th and 25th quartile.
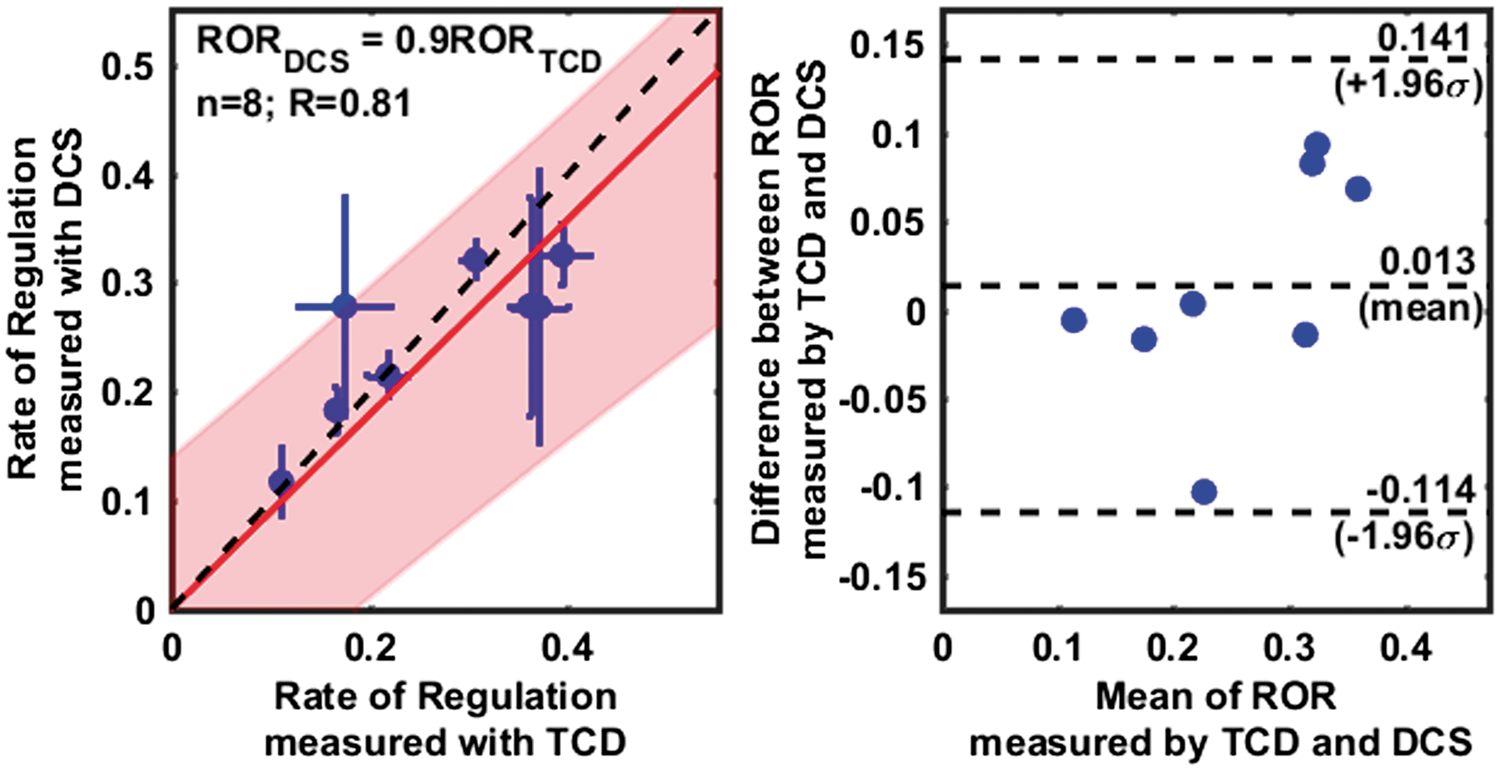
The median reduction in mean ABP was 13.7% after thigh-cuff deflation. The corresponding median reduction in CBF was measured to be 9.1% with DCS and 11.2% with TCD. Median reduction in scalp blood flow was 27.7%, as measured with DCS. These results along with the inter-quartile ranges are summarized in Table 1.
Non-parametric Wilcoxon signed rank test confirmed that the decrease in CBF measured with both TCD and DCS was greater than zero (statistically significant; p < 0.01, with large effect size;43–45 r > 0.8). Furthermore, the reduction in CBF measured with TCD and DCS was not statistically different from one another (Wilcoxon signed rank test, p = 0.16, small to medium effect size43–45 with r = 0.35). On average, the percent reduction in cerebral flows (for both TCD and DCS) was found to be lower than the percent reduction in scalp flow (p < 0.001, Wilcoxon rank sum test). In addition, on a paired/subject-to-subject basis, a Wilcoxon signed rank test revealed that the percent reduction in scalp flow was greater than that measured in the brain (p < 0.005); percentage reduction in scalp flow was 15% and 18% greater than the cerebral flow change measured with TCD and DCS, respectively.
Figure 2 displays a summary of dynamic CA measurements from 11 healthy subjects (including outliers). Black vertical dashed lines at time t = 0 denote the instant of thigh cuff deflation, and red vertical dashed lines denote the ‘autoregulation zone’. In each panel, the solid gray lines represent trial-averaged data from each individual subject, while the solid-color lines and the shaded-color region represent the average response from all subjects and the 95% confidence intervals, respectively, of changes in blood pressure (blue, top row), blood flow (red, middle row), and cerebrovascular resistance (green, bottom row). The left column displays changes in CBF, and corresponding changes in cerebrovascular resistance, as measured using TCD. The middle/right columns display changes in cerebral/extra-cerebral blood flow, respectively, and corresponding changes in cerebrovascular resistance, as measured by optics (DCS). The relative changes in resistance during the autoregulation period were fit to a linear equation (black solid lines in the bottom row); the slope of this fitted line was used to estimate the ROR.
Observed changes in CBF, shown in the averaged TCD and DCS-cerebral curves, are similar. CBF decreased immediately after cuff deflation, thereby triggering a near-instantaneous but small increase in cerebrovascular resistance, followed by a gradual decrease (at ∼1 s), as well as a corresponding increase in CBF. The rates of regulation measured from the median TCD and DCS responses (i.e. from the subject averaged responses, solid green lines in Figure 2) are similar (RORTCD = 0.229 ± 0.008 s−1, RORDCS = 0.271 ± 0.007 s−1), and the character of the changes in cerebrovascular resistance is consistent with that reported in previous experiments. 9 By contrast, the average change in extra-cerebral scalp blood flow was greater than that in brain. Further, the resistance in the scalp blood vessels increased significantly after thigh cuff deflation and reached a peak of approximately 1.2 at ∼4 s after thigh cuff deflation, and then it recovered back to baseline. A corresponding ROR for scalp can be estimated from the data obtained during the period where blood flow recovered to baseline; the computed ROR for the scalp, RORscalp = 0.492 ± 0.029 s−1, was higher than that measured in the brain.
Figure 3 displays the cumulative results of ROR estimation (Figure 3(a)) and autoregulation start times (Figure 3(b)) for each subject, estimated from the averaged individual autoregulation responses. A median ROR for CBF was 0.262 (0.170, 0.366) s−1 with TCD and 0.278 (0.199, 0.300) s−1 with DCS; here the numbers in the parentheses refer to the lower and upper quartiles. The median RORs estimated with TCD and DCS exhibit no statistically significant difference (Wilcoxon Rank Sum test). In contrast, the median ROR estimated for extra-cerebral (i.e. scalp) blood flow using DCS was 0.553 (0.314,1.035) s−1; ROR for the extra-cerebral tissue was greater than the rates of regulation for cerebral flow, estimated by both TCD and DCS (Wilcoxon Rank Sum test, p < 0.05).
Figure 3(b) similarly depicts box plots of the “autoregulation start-times” of CBF measurements with TCD and DCS, and of scalp flow measurements with DCS. With CBF derived from TCD, the median start time for autoregulation was 1.40 (1.175, 1.9) s, while the median start time was 0.95 (0.2, 2.3) s for CBF derived from DCS; here the numbers in the parentheses refer to the lower and upper quartiles. Note, the “autoregulation start-time” refers to the time of maximum cerebrovascular resistance, after which the resistance decreases to drive CBF to return to baseline. On a subject-to-subject/paired basis, the median autoregulation start times measured with DCS and TCD were found to be equivalent to each other (Wilcoxon Signed Rank test, p > 0.4). With scalp flow, the median autoregulation start time was 4.2 (3.7, 4.7) s – significantly later than CA times measured by either TCD or DCS (Wilcoxon Rank Sum test, p < 0.05).
Figure 4 shows the concordance between paired ROR measurements using TCD and DCS across subjects. The scatter plot (Figure 4 left) reveals a linear relationship between the ROR measured with TCD and DCS (R = 0.812). A linear fit (solid red line, with shaded red region indicating 95% confidence intervals) of the individual data points (blue circles, with horizontal and vertical blue lines indicating the uncertainties in the ROR estimated with TCD and DCS, respectively) confirms this relationship. A slope of 0.9 ± 0.18 shows that the measurements are in close agreement. Here, to improve the robustness of the regression analysis, especially given the small sample size, we have forced the regression line to have zero intercept. When the regression line is not forced through the origin (see Supplemental Figure 2), the slope and intercept were estimated to be 0.54 ± 0.38 and 0.1 ± 0.1 s−1, respectively. Note, however, the regression slopes, estimated with and without the zero intercept approximation, overlap, and the estimated intercept includes the origin.
The data points in the scatter plot include measurements of error in the estimates of ROR obtained from each subject; horizontal error bars depict the uncertainty in estimates of ROR measured with TCD (
A Bland–Altman analysis (Figure 4, right) shows that the mean difference between ROR estimates from TCD and DCS-cerebral is small (absolute mean difference = 0.013 s−1), and that all measurements fall within the 95% confidence intervals. We note that the width of the confidence interval in the Bland–Altman analysis is large compared to the mean, but less than the differences that might be expected to arise between intact and impaired autoregulation.9,46 These results confirm that cerebral rates of regulation estimated with DCS and TCD are in agreement.
Discussion
Several prior studies have utilized non-invasive optics and DCS to measure CBF in a variety of clinical applications.15,24,26,27,31,33,35,36,47 These experiments, however, for the most part measure relative changes in CBF . The present work is the first study to employ DCS to estimate changes in cerebrovascular resistance after thigh cuff deflation, and thereby measure rates of dynamic cerebral (and extra-cerebral) autoregulation at the microvascular level. The technical approach utilizes a ‘fast DCS’ blood flow monitor that permits blood flow measurements at sufficiently high measurement rates to fully resolve the blood flow pulse wave. With speeds of the DCS measurements comparable to that of TCD, it was possible to capture rapid decreases in CBF (and changes in cerebrovascular resistance) induced by sudden blood pressure changes, 39 and thus to measure rates of CA. A second innovation is the application of a pressure modulation protocol/algorithm that helps isolate and simultaneously estimate blood flow changes in both the cerebral and extra-cerebral (e.g. scalp) microcirculation. Measurements of changes in extra-cerebral blood flow (and changes in extra-cerebral resistance) permit the novel characterization of extra-cerebral (systemic) autoregulation processes – a feature unique to transcranial DCS.
CA curves (Figure 2) estimated using both TCD and DCS were similar to each other and are consistent with the classic dynamic CA response. The measured average rates of regulation (0.229 s−1 with TCD, 0.271 s−1 with DCS) fall within the range of other reports in the literature. 9 The rates of cerebral regulation measured with TCD and DCS were also highly correlated (R = 0.81), and a Bland–Altman analysis revealed good agreement (slope of linear relationship = 0.9) and minimal bias between the techniques. The equivalence of RORs measured by TCD and DCS in healthy subjects is a significant result of this study, and offers validation for DCS-derived autoregulation indices. Notably, DCS shows promise as a convenient monitoring modality suitable for noninvasive bedside quantification of CA in the microvasculature.
The pressure modulation algorithm and the transcranial, multi-distance DCS measurements further enabled us to simultaneously measure blood flow and the rate of autoregulation in both the brain and scalp. Interestingly, the thigh cuff deflations induced a greater relative blood flow change in the superficial circulation compared to the cerebral circulation. We note that since baseline scalp blood flow is approximately 10 times lower than CBF, 41 smaller absolute changes can still manifest as a greater proportional flow change. More importantly, the character of the thigh-cuff deflation induced blood flow changes differ in scalp compared to brain. We found that autoregulatory responses occurred earlier in the brain, and that blood flow returned to baseline faster in the brain. Further, autoregulatory vessel dilation occurred much later in the superficial circulation and was of greater amplitude. Finally, the extra-cerebral vessels appeared to vasoconstrict, as evidenced by a marked increase in vascular resistance, in response to reductions in systemic blood pressure. The mechanism(s) associated with this response are uncertain, but they could include either passive collapse, or active mechanisms to divert blood flow into the brain and other vital organs in the setting of systemic hypotension.
The characterization of systemic peripheral autoregulation and its divergence from CA is the second significant result from this study. The ability to simultaneously measure both cerebral and systemic autoregulation could have significant clinical implications, given that patients with severe neurologic injury are at high risk for confounding non-cerebral complications which may impact both systemic and cerebral perfusion (e.g. sepsis, arrhythmia, hypotension, severe hypertension). While additional studies will be required to investigate/validate the link between systemic and CA, including for example, independent measurements of systemic blood flow in the limbs, our approach has the potential to be a valuable bedside tool for managing critically ill patients with neurological injuries.
A few recent studies have utilized near infrared spectroscopy (NIRS), an alternative optical technique, to measure CA.19,48–54 These devices provide a measure of cerebral oxygenation in the form of a tissue oxygenation index; changes in tissue oxygenation index are then used as a surrogate for CBF changes. However, NIRS-based measurements do not directly measure CBF, and instead require several assumptions to convert changes in tissue oxygenation index to blood flow changes. First, these methods assume that oxygen extraction fractions are constant, an assumption that may breakdown in cases of cerebral pathology or task/event-related changes. Second, NIRS techniques often use blood volume changes to measure blood flow Unfortunately, this approach can be inaccurate because oxygenation/blood volume measurements place higher weights on venous circulation. Finally, NIRS measurements of cerebral oxygenation are sometimes susceptible to contamination from superficial tissues. Two recent studies42,55 have addressed some of the limitations of previous NIRS measurements, and have quantified CA with estimates of CBF derived from measurements of tissue oxygenation and a coherent hemodynamics model. 56 The present study is qualitatively different from this previous work in that it utilized a custom optical instrument to directly measure microvascular CBF.
Some limitations of this study and potential technical improvements must be acknowledged. Autoregulation measurements were only completed in about half of the subjects; this problem, however, was mostly due to experimental difficulties unrelated to the optical technique. In a small fraction of cases, the cuff deflation was not instantaneous, suggesting that further optimization, either in the form of automated cuff deflation, or standardization of procedures may be needed. For example, we have anecdotally noticed that the standard practice of inflating the thigh cuff to 20–25 mmHg above systolic pressure9,22,42,46 may be insufficient to ensure transient cessation of blood flow to the lower extremities. Future optimizations may need to include approaches that confirm absence of arterial pulses in the legs. In a few subjects, the pressure modulation algorithm was unable to separate cerebral from scalp blood flow. This effect could be due to insufficient optical signal at the long source-detector separation, but is more likely a result of insufficient application of pressure during calibration. The two-layer DCS modified Beer–Lambert law analysis is more sensitive to measurement noise than conventional semi-infinite homogeneous methods 41 ; therefore, poor signal-to-noise of measured DCS autocorrelation functions, especially in fast blood flow measurements, could affect the fidelity of the pressure calibration method.39,41
Both DCS and TCD provided estimates of the rates of regulation with good SNR. Nevertheless, several strategies can be employed to reduce the uncertainty in ROR and thereby improve the overall SNR of the DCS measurements. These strategies include better fiber optic probe interfaces, optimization to reduce motion artifacts, careful application and processing of the pressure calibration method, and use of hybrid diffuse optics instruments which directly measure tissue optical properties to better constrain CBF indices measured with DCS. Technical improvements that facilitate improved detection of the optical signal (i.e. increase measured optical power/signal) could arguably have the biggest impact on the SNR of DCS ROR estimates. Higher detected intensities permit DCS CBF to be recorded at higher measurement speeds,
39
thereby improving the frequency resolution of pulsatile CBF. In this case, smaller and faster changes in cerebral blood flow (and cerebrovascular resistance) induced by the thigh cuff can be recorded, permitting better characterization of the dynamic autoregulation response curves, and reducing errors in estimates of
In summary, our results demonstrate proof-of-concept that DCS offers a feasible approach to directly measure and monitor dynamic CBF changes noninvasively, and that CBF measured with DCS can directly characterize autoregulation in the cerebral and scalp microvasculature. A natural extension of this study would be to explore alternative methods of characterizing CA such as using spontaneous blood pressure fluctuations. Although spontaneous blood pressure changes are generally much smaller than the response to thigh cuff deflation, they can be monitored over extended periods to signal-average the data. Such an approach will be particularly useful for critically ill patients, since they may not tolerate repeated thigh cuff inflations. Future studies will also apply these methods to study CA in patients with brain injury, including stroke, where they may ultimately be used to devise more individualized care plans for blood pressure management.
Conclusions
Dynamic autoregulation, as induced by acute blood pressure changes, can be measured non-invasively using optical measurements of CBF with DCS. Optically measured autoregulation indices are in good agreement with TCD, while providing a method with the potential for greater spatial specificity.
Footnotes
Funding
The author(s) disclosed receipt of the following financial support for the research, authorship, and/or publication of this article: We gratefully acknowledge support from the American Heart Association (14POST20460161), and the National Institutes of Health (R25-NS065745, R01-NS060653, P41-EB015893).
Acknowledgements
We thank Dr. Joel Greenberg, Dr. Daniel Licht, Dr. Venki Kavuri, Dr. David Busch, and Dr. Ali Zandieh for valuable discussions.
Declaration of conflicting interests
The author(s) declared the following potential conflicts of interest with respect to the research, authorship, and/or publication of this article: AB Parthasarathy, WB Baker, and AG Yodh have two pending patent applications, and AG Yodh and J Detre have other patents relevant to this work (United States patents 8,082,015 and 6,076,010) but do not currently generate income.
Authors’ contributions
AP, KG, RB, SK, MM, JD and AY designed the study. AP, KG and CF did the subject measurements. AP designed and built the optical instrumentation. AP, with assistance from WB, carried out the data analysis. AP and KG wrote the manuscript with input from all authors. Important editorial input, data analysis suggestions, and manuscript revisions were made by AY, WB, RB, JD, SK and MM.
References
Supplementary Material
Please find the following supplemental material available below.
For Open Access articles published under a Creative Commons License, all supplemental material carries the same license as the article it is associated with.
For non-Open Access articles published, all supplemental material carries a non-exclusive license, and permission requests for re-use of supplemental material or any part of supplemental material shall be sent directly to the copyright owner as specified in the copyright notice associated with the article.