
Abstract
The critical closing pressure (CrCP) of the cerebral circulation depends on both tissue intracranial pressure and vasomotor tone. CrCP defines the arterial blood pressure (ABP) at which cerebral blood flow approaches zero, and their difference (ABP − CrCP) is an accurate estimate of cerebral perfusion pressure. Here we demonstrate a novel non-invasive technique for continuous monitoring of CrCP at the bedside. The methodology combines optical diffuse correlation spectroscopy (DCS) measurements of pulsatile cerebral blood flow in arterioles with concurrent ABP data during the cardiac cycle. Together, the two waveforms permit calculation of CrCP via the two-compartment Windkessel model for flow in the cerebral arterioles. Measurements of CrCP by optics (DCS) and transcranial Doppler ultrasound (TCD) were carried out in 18 healthy adults; they demonstrated good agreement (R = 0.66, slope = 1.14 ± 0.23) with means of 11.1 ± 5.0 and 13.0 ± 7.5 mmHg, respectively. Additionally, a potentially useful and rarely measured arteriole compliance parameter was derived from the phase difference between ABP and DCS arteriole blood flow waveforms. The measurements provide evidence that DCS signals originate predominantly from arteriole blood flow and are well suited for long-term continuous monitoring of CrCP and assessment of arteriole compliance in the clinic.
Keywords
Introduction
A key management strategy for acute brain injury is to maintain cerebral blood flow (CBF), so that oxygen and glucose delivery match metabolic demands.1–3 While insufficient CBF leads to ischemic cell damage, excessive CBF can lead to parenchymal damage via vasogenic edema and/or intracranial hemorrhage. 4 Accordingly, a major therapeutic goal is to maintain the pressure gradient across the cerebral vascular bed—termed the cerebral perfusion pressure (CPP)—at target levels that ensure adequate blood flow for metabolism.5–7
Clearly, optimal management of CPP would benefit from accurate and continuous measurement of this parameter. CPP is often clinically defined as the difference between two measurable quantities: the arterial blood pressure (ABP) and the intracranial pressure (ICP), i.e. ABP − ICP. ABP is typically measured by an arterial cannula connected to a pressure transducer, and ICP is typically measured invasively with a ventricular catheter or an intraparenchymal monitor.2,8 While this definition of CPP is useful, it neglects the effects of active wall tension or vasomotor tone.9–12 As a result, the true pressure gradient driving cerebral blood flow is not ABP − ICP; rather, it is a parameter called “actual” CPP, i.e. aCPP = ABP − CrCP.9,12–14 CrCP is the critical closing pressure of the cerebral circulation. Cerebral blood flow ceases when ABP drops below CrCP, which in turn depends on both ICP and active wall tension in the small arterioles and pre-capillary sphincters.9,12,15
Noninvasive assessment of aCPP using CrCP has been proposed by several investigators16–23 as a more appropriate measure of the cerebral bed pressure gradient. Unlike other factors, CrCP provides access to the vasomotor tone, which may be helpful for assessment of cerebral vascular reserve, i.e. the capacity to increase flow.24–27 In addition, noninvasive determination of CrCP is valuable in its own right. Invasive ICP monitors carry risks, including intracranial hemorrhage and infection, and these risks may be too great in some brain injured patients; these at-risk populations include patients with coagulopathies, as well as infants and children.
To date, one method, transcranial Doppler (TCD) ultrasound, has been employed as a means to estimate CrCP and to noninvasively assess cerebral perfusion pressure.16–19,28–30 TCD measures blood velocity in major feeder arteries such as the middle cerebral artery (MCA), which is an accurate measure of CBF if the artery diameter remains constant. CrCP measured with TCD has been validated in patients with induced ventricular fibrillation. 13 However, while TCD is a powerful technique, it has limitations. Stable fixation of TCD probes is challenging, and consequently, continuous long-term monitoring with TCD is difficult.18,31 Some patients (∼8%) do not have adequate acoustic bone windows for measurement of satisfactory TCD waveforms. 30 Further, because TCD interrogates large proximal arteries, TCD measurements may be relatively insensitive to localized/heterogeneous brain diseases/injuries. Finally, high MCA blood flow velocities, for example, during cerebral vasospasm, can produce turbulent flow. In this case, the assumed linear relationship between pressure and flow velocity is suspect and could result in an underestimation of CrCP. 32
Here we demonstrate a novel method for continuous noninvasive monitoring of CrCP using near-infrared light.21–23 The method leverages the diffuse correlation spectroscopy (DCS) technique to noninvasively measure microvascular cerebral blood flow through the arterioles with high temporal resolution (20 Hz).33–36 The DCS instrumentation is well-suited for continuous long-term monitoring of CrCP at the bedside.31,37–39 In addition, since DCS probes microvessels rather than major arteries, it has the potential to be more sensitive to vascular compliance and vasomotor tone than TCD. We utilize a Windkessel model 40 of the arteriole microvasculature to calculate CrCP from steady-state DCS waveforms of pulsatile cerebral blood flow and concurrent pulsatile ABP waveforms during the cardiac cycle.
We hypothesized that the combination of DCS-flow and ABP waveform analysis can provide accurate estimates of CrCP in humans, and we validated the approach via comparison to TCD-flow/ABP measurements in 18 healthy adults. The DCS data also provide means to estimate a capacitive parameter of the microvasculature, which is rarely measured, the arteriole compliance, C; this compliance parameter is a potentially useful biomarker for brain diseases such as ischemic stroke. Finally, the results provide evidence that the origin of the DCS signal derives primarily from shear-induced diffusive red blood cell movement in cerebral arterioles.
Methods
DCS measurement of blood flow
DCS estimates blood flow by quantifying rapid speckle intensity fluctuations of multiply scattered light that has traversed the tissue. These fluctuations are induced by red blood cell motion (Figure 1).41,42 Specifically, DCS measures the normalized temporal intensity autocorrelation function, (a) Schematic of the homogeneous, semi-infinite model of the head with blood flow index of F. Blood cell position variation, e.g. represented by red disks at time, t, and light-red disks at a later time, t + τd, induce rapid temporal fluctuations in the detected speckle intensity (shown schematically in panel (b)), typically on microsecond time scales. These fluctuations are captured quantitatively by the normalized intensity autocorrelation function (g2(τd)). (c) The decay of the intensity autocorrelation function curves depends on tissue blood flow.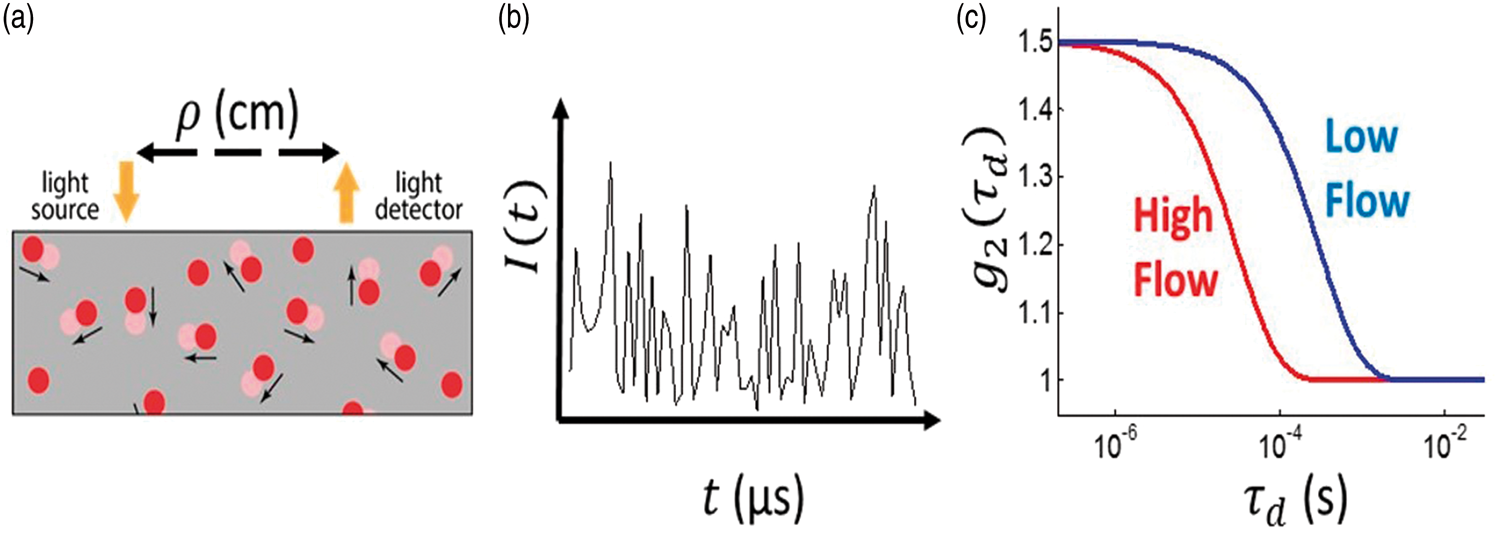
The DCS blood flow index, F, is directly proportional to tissue blood flow and has been compared to various independent methods.43–45 Recently, DCS measurements resolving the pulsatile heart-beat fluctuations of cerebral blood flow in arterioles have been demonstrated.21,22,34,46 Note that DCS is thought to be much more sensitive to arterioles than to large arteries because near-infrared light passing through large arteries is strongly absorbed, and hence not detected.
Vascular model of arterioles
We modeled the cerebral arteriolar compartment between the large arteries and capillaries (Figure 2) as a two-compartment Windkessel model.40,47,48 The arteriole vascular compartment was defined as a tube with resistance R and compliance C. Additionally, we placed a narrow cylindrical tube (pre-capillary sphincter) with cross sectional area A and resistance Rs between the arterioles and the capillaries. The pre-capillary sphincter resistance varies as needed under normal conditions to maintain a pressure of CrCP at the distal end of the arteriole compartment.
(a) Model schematic for the vasculature between arteries and capillaries. A Windkessel model is employed for the cerebral arteriole vasculature compartment (shaded pink) with resistance R and compliance C. The approach also introduces a pre-capillary sphincter, i.e. a narrow cylindrical tube between the arterioles and capillaries (shaded blue). The in-flow blood pressure at the entrance to the arteriole compartment is PA; the blood pressure at the distal ends of arteriole compartment and entrance to the pre-capillary sphincter is Pa. The external pressure (CrCP) on the pre-capillary sphincter is set by ICP and active wall tension. The sphincter adjusts to maintain Pa = CrCP under normal conditions. In normal conditions, PA > Pa = CrCP > Pc. The pressure gradient driving the arteriole blood flow, F, is PA − CrCP. (b) Electrical analogue of the vascular model consists of a parallel resistor, R, and capacitor, C; pressure (flow) is analogous to voltage (current). The variable resistor, Rs, represents the impedance of the pre-capillary sphincter and adjusts as needed to maintain the relation: 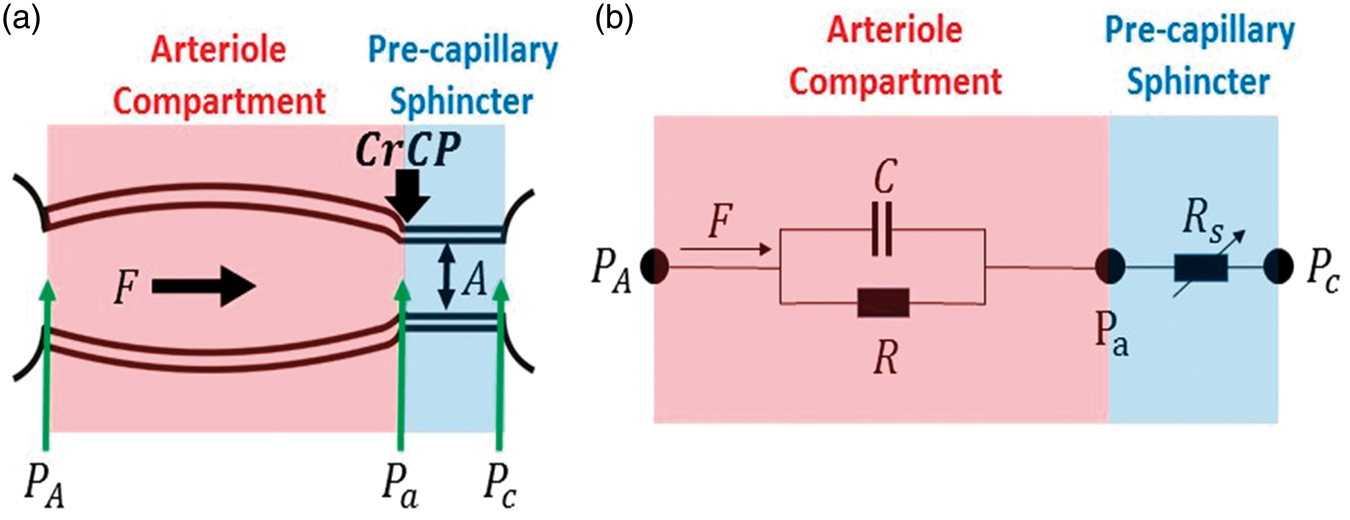
Within this model, PA is the in-flow blood pressure at the entrance to the arteriole compartment, and Pa is the blood pressure at the distal end of the arteriole compartment (i.e. at the entrance to the pre-capillary sphincter). Pc is the out-flow pressure at the entrance to the capillaries (i.e. at the exit of the pre-capillary sphincter). The isotropic pressure compressing the pre-capillary sphincter at its entrance in normal operation is CrCP; the factors responsible for this external pressure are ICP and active wall tension.9,10 During normal operation, Pa =CrCP > Pc. Note, Pa is not affected by Pc, an effect that is known as the vascular waterfall.9,12–15 Generally, PA tracks ABP and is substantially larger than CrCP, but if PA drops below CrCP, then the sphincter collapses and flow through the arteriole compartment ceases.
The model suggests that healthy microvasculature can be characterized by normative values of R, C, and CrCP. Variations in wall tension can modulate blood flow in two ways; via changes in R (by vessel dilation), and via changes in CrCP (by changing actual cerebral perfusion pressure).
Due to flow through the arteries, we expect the blood pressure, PA, at the entrance of the arteriole compartment to be lower than the systemic blood pressure, ABP. In a rat model, PA was directly measured and found to be proportional to ABP, i.e.
49

In this animal study,
49
the proportionality coefficient was
Measurement of CrCP with DCS
Blood flow and blood pressure in arteries and arterioles is pulsatile, and for computing CrCP, we made the approximation that the arterial system is in steady-state oscillation, e.g. the heart beat is regular; the pressure and flow waveforms are repetitive periodic oscillations, as opposed to episodic transients. We can therefore represent these waveforms by a Fourier series whose frequencies are integral multiples of the frequency of repetition.
50
In the arterial system, the fundamental frequency of repetition is the heart rate (
We computed CrCP using measurements of the mean and the fundamental harmonic of the blood pressure and blood flow waveforms. The fundamental harmonic waveforms for the blood pressure and the blood flow are
In standard linear response theory (including Ohms’ Law), the ratio

Here,

The combination of DCS measurements of F(t) and separate/simultaneous measurements of ABP(t) thus permitted calculation of CrCP via equation (2). The values reported in the present article are based on our measurements and this calculation, which assumed

Measurement of CrCP with TCD
The TCD-based approach to measuring CrCP combines Doppler ultrasound measurements of middle cerebral artery blood velocity (Fv) and concurrent ABP waveforms. (Note: blood velocity can be converted to blood flow with knowledge of the artery diameter.) This procedure, which utilizes arterial rather than arteriole signals, was applied to our TCD data. The resultant computation of CrCP gave10,51

As with equation (2), the angular brackets
Equation (5), which has been used and validated in patients with induced ventricular fibrillation, 13 is derived from a “resistive only” approximation to the model of the arterial bed that neglects the effects of arterial compliance (i.e. an electrical network model similar to Figure 2(b) but with C = 0). For TCD measurements, the error due to this “resistive only” approximation is expected to be small. 13
The use of first harmonic Fourier filtering to calculate CrCP with equation (5) is theoretically equivalent to linear regression of Fv versus ABP to find the (extrapolated) blood pressure at which Fv is zero. 10 This extrapolated pressure is typically taken to be the CrCP. In practice, however, Fourier filtering is preferable to the linear regression approach because it is less affected by measurement noise. 13
Experimental procedures
We simultaneously determined CrCP from measurements with DCS and with TCD in 20 healthy adult volunteers. Since two subjects had poor signal quality (discussed further below), we report results from 18 of the 20 subjects measured. All subjects provided written consent, and all protocols/procedures were approved by the institutional review board at the University of Pennsylvania, which adheres to the guidelines of the Common Rule and the Food and Drug Administration’s Institutional Review Board and human subject regulations. Throughout the measurement, all subjects lay supine at rest. DCS optical probes were placed bilaterally on the forehead superior to the frontal sinuses to measure blood flow downstream in the anterior middle cerebral artery distribution (Figure 3). The arteriole blood flow (F) was measured continuously at 20 Hz using a custom-built DCS instrument with a software correlator that is described in detail elsewhere.
34
Specifically, arteriole blood flow was obtained from a semi-infinite fit to the DCS measurement using an assumed tissue optical absorption coefficient of 0.1 cm−1 and reduced scattering coefficient of 8 cm−1 (e.g. Figure 3(b)). Fractional blood flow changes obtained with DCS are robust to errors in these assumed tissue optical properties.
52
(a) Bilateral measurements of F, Fv, and noninvasive ABP were simultaneously recorded for 5 min in 20 healthy adult volunteers laying supine at rest. DCS probes were first secured with a neoprene elastic strap, and a headframe securing the TCD probes (red band) was then placed over the DCS probes; in side view, only one probe, laser, and light detector array (i.e. “Detector” in frontal view inset) are shown; in frontal view inset, the head frame and elastic strap are not shown. (b) Exemplar DCS g2(τd) measurement was averaged across three detection channels with mean photon count rate of 77 kHz and a source-detector separation of 2.5 cm, and was acquired on the left forehead of a healthy adult subject at a sampling rate of 20 Hz. The solid red line is the semi-infinite fit to the measurement. A DCS blood flow index of F = 1.4 × 10⁻⁸ cm2/s was extracted from the fit. Note, a tissue optical absorption coefficient of 0.1 cm−1 and tissue reduced scattering coefficient of 8 cm−1 were assumed for the fit.
88
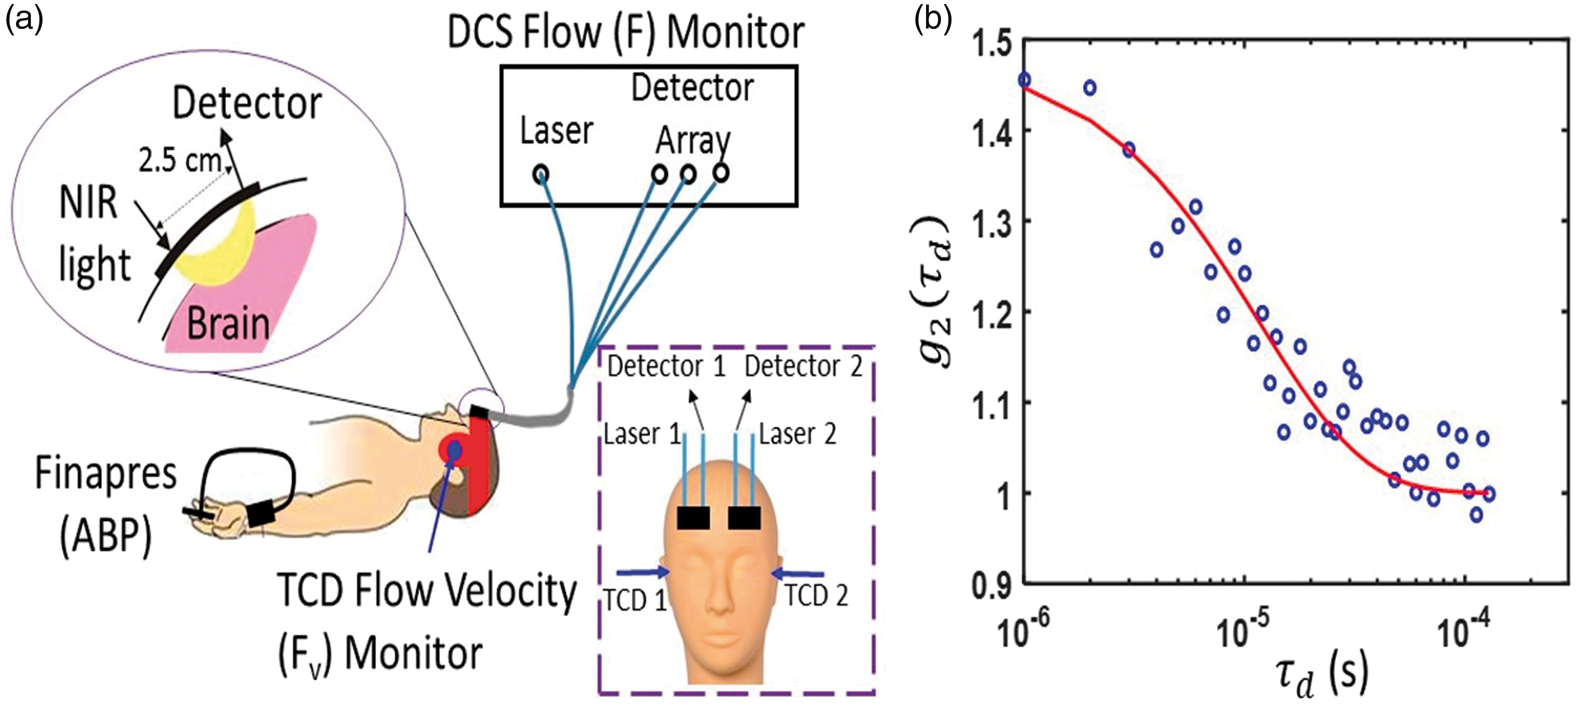
Concurrently, two TCD probes were secured using a Diamon Headframe for bilateral monitoring of middle cerebral artery blood velocity (Fv) with a commercial Compumetics DWL TCD system (Seigen, Germany), and continuous noninvasive arterial blood pressure (ABP) was measured on the middle finger with a finger plethysmograph system (Finometer Pro, Finapres Medical Systems, Arnhem, Netherlands).
The ABP and Fv signals were streamed continuously (in real time) to the DCS computer via output channels on the Finapres and Compumetics systems. Time synchronization of F, Fv, and ABP was achieved using software written in Labview (National Instruments, Austin, TX, USA). In all subjects, ABP, bilateral F, and bilateral Fv were measured in parallel at a sampling rate of 20 Hz for 5 min. (Note: any systemic time difference between the correlator and Finapres signals were measured and accounted for as needed.)
Pressure pulse waves propagate rapidly through the vasculature. In a rigid tube with fixed diameter, the pressure wave velocity is the speed of sound in blood, which is roughly 1500 m/s.
50
In the elastic ascending aorta, the wave velocity is substantially lower, but it is still fast, i.e. between 5 and 10 m/s,
53
and there is a progressive increase in wave velocity with increasing distance from the heart.53–55 We therefore assumed that the ABP waveform measured on the finger with the Finapres is in-phase with the ABP waveform immediately proximal to the cerebral arterioles (i.e. PA in Figure 2). Note, our observation of no significant phase difference between the ABP and TCD Fv (e.g. Figure 4) waveforms at the heart rate frequency also suggests that ABP immediately proximal to the MCA is in phase with ABP measured on the finger. We further expect ABP and TCD Fv waveforms to be approximately in phase, because equation (5), which makes the assumption of phase-locked ABP and Fv waveforms for calculating CrCP, has been successfully validated in humans.
13
A conservative estimate of the time delay between the ABP waveform at the MCA and the PA waveform at the arterioles is provided by previous measurement of the mean time delay between the carotid artery and MCA waveforms, i.e. 7.8 ± 0.5 ms.
56
The actual synchronization error between ABP and PA is likely less because we expect the pressure wave velocity to be even higher in the stiff cerebral arterial bed.13,57
Temporal measurements of noninvasive ABP, 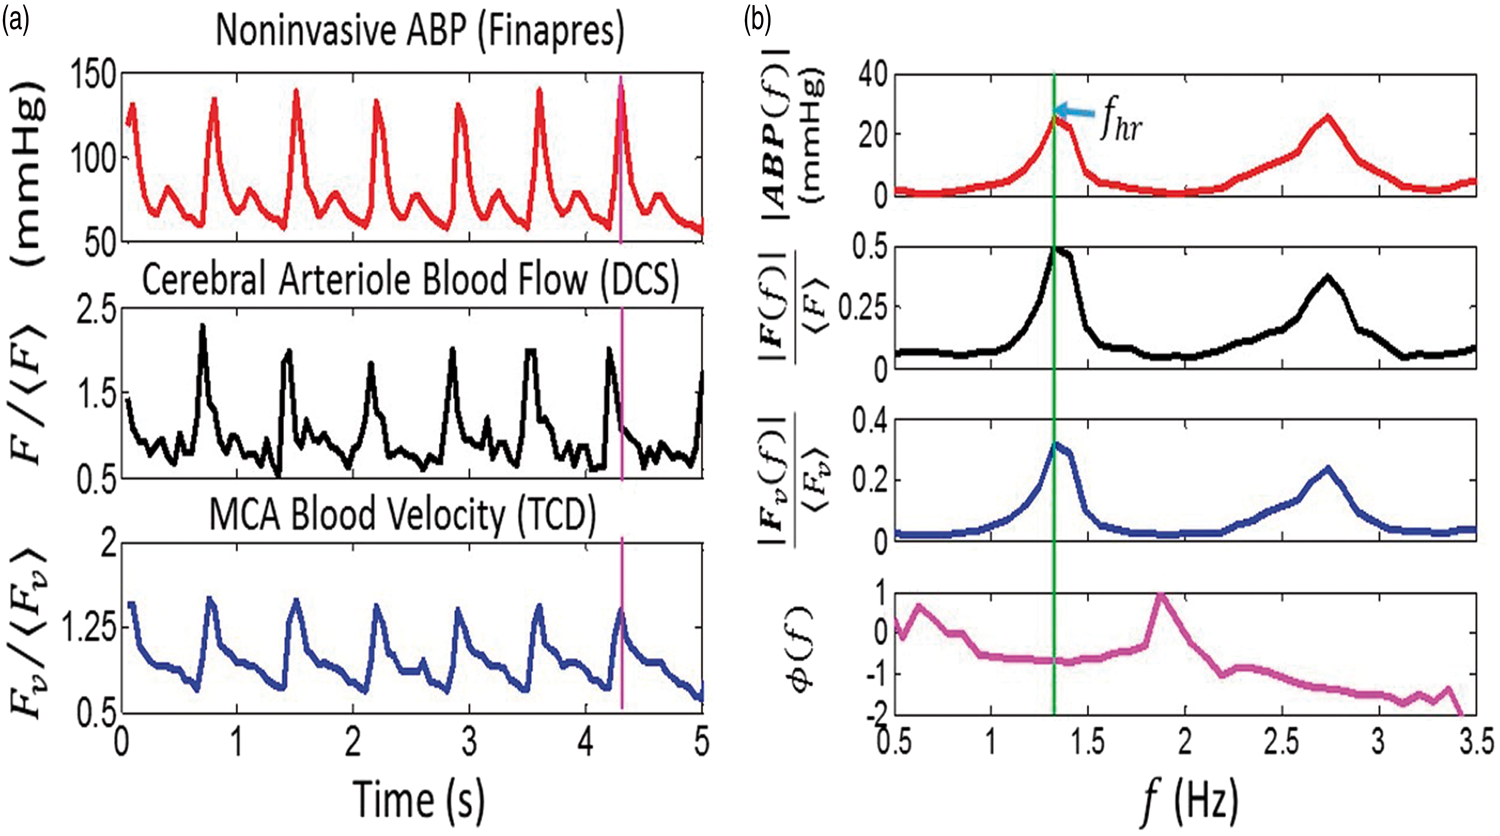
Data processing for CrCP calculation
In equations (2) and (5),
The phase difference between F and ABP at the heart rate frequency, i.e.
Since the pressure and flow waveforms can be represented as Fourier series whose frequencies are integral multiples of the heart rate frequency, one could consider analyzing the data at higher frequency harmonics (e.g. 2fhr, 3fhr). Indeed, in Figure 4(b), the amplitudes at twice the heart rate frequency are clearly visible. However, the higher harmonics are generally weaker signals and are more susceptible than the fundamental harmonic to be distorted by measurement noise. 13 Therefore, higher harmonic data were not used to calculate CrCP. These noise distortions are the reason why Fourier filtering at the fundamental harmonic is preferable for CrCP calculation compared to the more traditional, linear regression approach.
It is perhaps counterintuitive for the F waveform to lead the ABP waveform driving blood flow. In fact, this observation is clearly apparent for a stationary sinusoidal ABP waveform in equilibrium. The observation is directly analogous to the well-established fact that, in steady-state, the electric current leads a stationary sinusoidal voltage signal applied to a RC circuit (Figure 2(b)). 61
Data cleaning
Data analysis using equations (2) and (5) gave non-physiologic negative values for CrCP a small fraction of the time. Of the 40 CrCP measurements in the present study (i.e. 20 adults × 2 hemispheres), six were negative when computed using the DCS method (equation (2)), and three were negative when computed using the TCD method (equation (5)). We believe these negative CrCP measurements were due to poor signal quality in the DCS and TCD flow measurements.
Specifically, negative CrCP values arose whenever the measured blood flow pulsatility was smaller than the blood pressure pulsatility (i.e. when
Statistical analysis
We carried out both linear regression and Bland–Altman analyses to assess agreement between the DCS and TCD measures of CrCP in the sample of healthy adults. To ensure independent measurements in these analyses, the average CrCP across both hemispheres was used. If CrCP assessed with either DCS or TCD was negative in one hemisphere, then the measurement in the other hemisphere wherein CrCP was positive was used in place of the average. Two of the 20 subjects were not considered because CrCP was negative for both hemispheres.
Results
For the 18 subjects investigated (11 male, 7 female), the average (mean ± SD) of arterial blood pressure, heart rate, DCS blood flow index (uncalibrated), and TCD blood velocity were 80 ± 12 mmHg, 61 ± 11 bpm (9.2 ± 3.5) × 10−9 cm2/s, and 49 ± 12 cm/s, respectively. Further, the systemic blood pressure, and the DCS and TCD blood flow pulsatility ratios were
With these data, we concurrently derived CrCP in healthy adults (N = 18) with the optical DCS technique (equation (2)) and with the TCD technique (equation (5)). A linear regression analysis (Figure 5(a)) and Bland–Altman analysis (Figure 5(b)) of the data show a significant relationship between the two techniques. The slope (±95 CI) between CrCP measured by TCD and DCS is 1.14 (±0.23); the Pearson’s correlation coefficient is R = 0.66 (p = 0.003). Their mean difference (±95 CI) of −2 (±11) mmHg is not significantly different from zero (p = 0.2), and the average CrCP (mean ± SD) among these 18 subjects is CrCPTCD =13.0 ± 7.5 mmHg and CrCPDCS = 11.1 ± 5.0 mmHg, respectively.
(a) CrCP measured by TCD (vertical axis) plotted against CrCP measured by DCS (horizontal axis) in 18 healthy adults. Solid red line is the linear best-fit with intercept forced to be zero (R = 0.66; slope ± 95 CI = 1.14 ± 0.23). (b) Bland–Altman plot of the difference between CrCPDCS and CrCPTCD versus the mean of these two parameters. The solid horizontal line indicates the mean difference (bias) computed across the study population (i.e. −2 mmHg), which is not significantly different from zero (p = 0.2); dashed lines indicate the 95% CI limits for the mean (i.e. −13 to 9 mmHg). The root mean square difference between DCS and TCD measurements is 4.4 mmHg.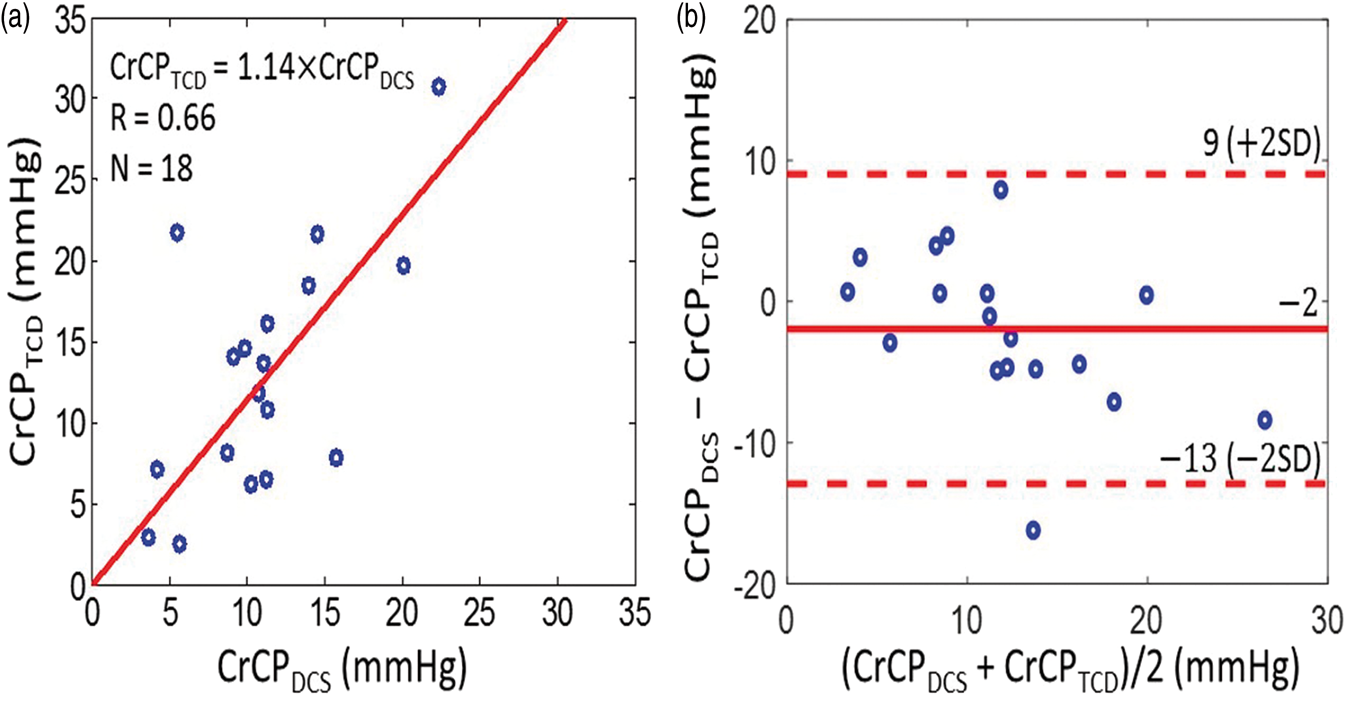
Along similar lines, we found good agreement between the CrCP-based estimates of actual cerebral perfusion pressure with TCD and DCS, i.e. (a) CrCP-based estimates of actual cerebral perfusion pressure measured by TCD (i.e. 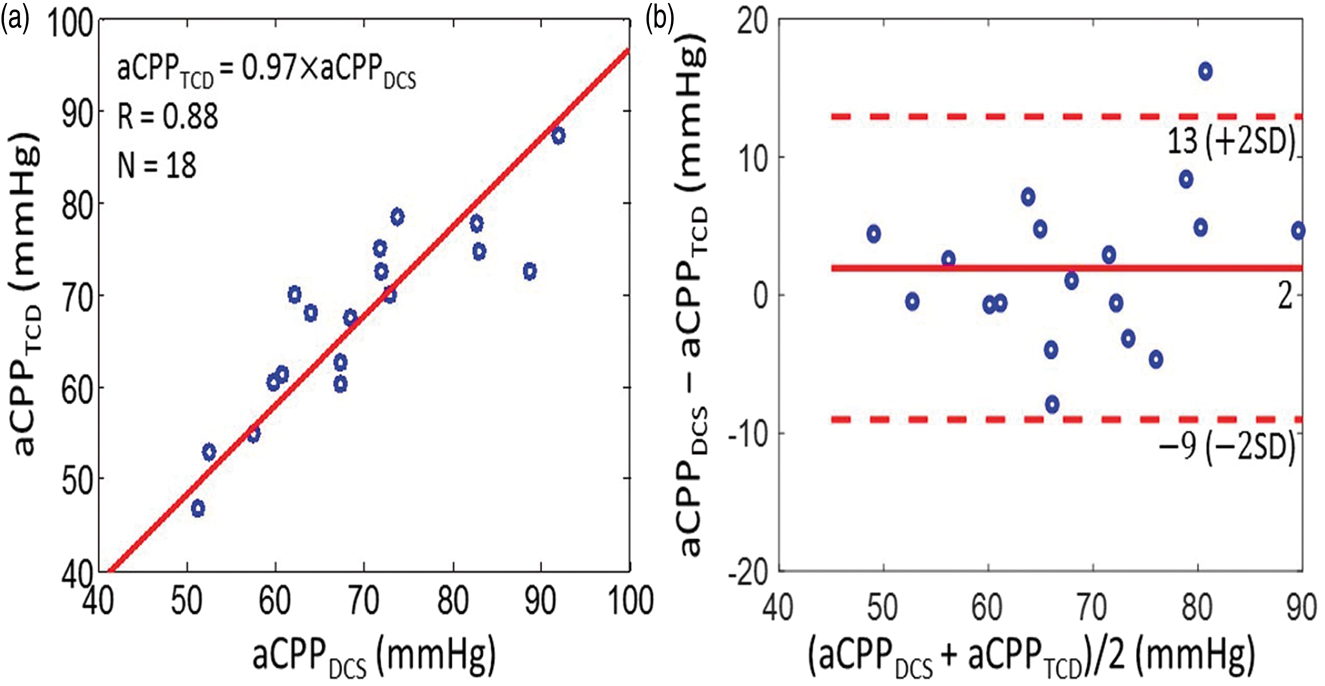
We next considered arteriole compartment compliance effects, which are only apparent in the DCS data. The average transit time through the arteriole bed across the 18 subjects (mean ± SD) was obtained using the measured phase shift between ABP and F (equation (3)) and found to be τ = 84 ± 32 ms, giving an average arteriole compliance (equation (4)) of C = (2.2 ± 1.3)
To convert the arteriole compliance measurement to traditional units, we introduce a “DCS calibration factor” of 1.3
To assess the influence of the arteriole compliance on the CrCP calculation with DCS, we introduced a “resistive only” calculation of CrCP with DCS that neglects compliance and is denoted by CrCPDCS,R. This calculation employs the τ = 0 limit of equation (2). Interestingly, we see by comparison that cerebral compliance introduces a small but non-negligible effect on the full CrCP calculation with DCS (Figure 7). Indeed, while CrCPDCS and CrCPDCS,R are strongly correlated across the 18 subjects (R = 0.78), the slope between CrCPDCS,R and CrCPDCS of 1.39 ± 0.21 is different from unity, indicating that inclusion of compliance effects for the arteriole compartment is important. The data suggest that the resistive-only model overestimates CrCP. Note, we did not observe a significant phase shift between the ABP and artery flow velocity waveforms from TCD (e.g. see Figure 4(a)); thus the resistive model is probably sufficient for TCD analysis.
DCS estimates of CrCP computed with the resistive only vascular model (i.e. τ = 0 limit of equation (2), vertical axis) and using the full Windkessel model (i.e. equation (2), horizontal axis) in 18 healthy adults. Solid red line is the linear best-fit with intercept forced to be zero (R = 0.78; slope ± 95 CI = 1.39 ± 0.21).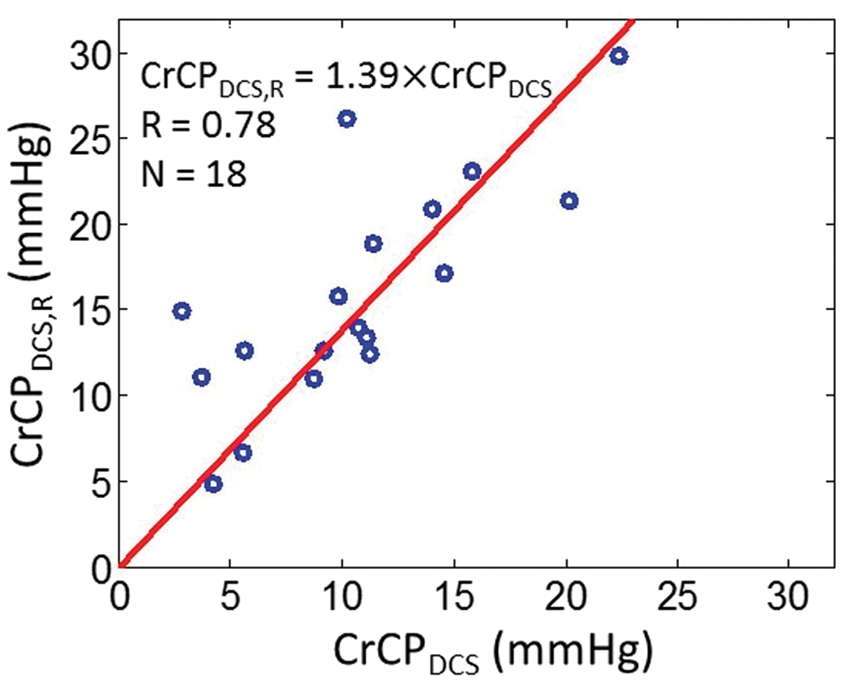
Discussion
The present article introduced and demonstrated a diffuse optical technology and scheme for measurement of critical closing pressure (CrCP), actual cerebral perfusion pressure (aCPP), arteriole bed transit time (τ), and arteriole bed compliance (C) in healthy adults, which can readily be translated to patients in both inpatient and outpatient settings. The key element of the approach is to measure and compare the pulsatile ABP and flow waveforms. The CrCP and aCPP generated from the optical flow waveforms compared well with similar measurements using TCD waveforms; i.e. their mean values were the same within experimental error, and the variations measured by both techniques were significantly correlated. The work demonstrates non-invasive diffuse optical measurements of CrCP and aCPP, and suggests the optical technology as a possible alternative to TCD for use in the clinic, which also holds potential to replace invasive monitors in patients with acute brain injury. Trend monitoring and spot measurements of CrCP, for example, may be able to noninvasively identify elevated ICP episodes during acute neurocritical care. Additionally, measurements of CrCP in combination with measurements of ICP enables estimation of vasomotor tone (i.e. vascular wall tension), 65 which may provide important information about autoregulation and vascular reactivity. Future work is needed to establish longitudinal reproducibility of the optical CrCP measurements in controls and in patients with brain injury and elevated ICP.
CrCP and aCPP
The DCS technique probes blood flow in the arteriole bed rather than in the major arteries. By contrast, TCD typically probes macrovascular flow in major arteries such as the MCA, which are upstream in the tissue vasculature. Thus, DCS should be more sensitive to physiological factors such as vascular compliance and vasomotor tone that contribute substantially to the responses of the downstream microvasculature. In healthy subjects, we expect that the different measurement techniques should be strongly correlated, but for patients with heterogeneous brain diseases/injuries, the DCS probe-pads can be positioned over a region of interest to directly measure localized arteriole blood flow at the disease site and thereby provide information about the cerebral vascular responses that is complementary to TCD. The DCS technique is also very well-suited for continuous, non-invasive, long-term monitoring of CrCP in all patient populations including patients on anticoagulant medications and pediatric patients.31,37–39 Lastly, the Reynolds number of flow in arterioles is substantially lower than the Reynolds number in large arteries, 66 and therefore the DCS measurement is less susceptible to the consequences of turbulent flow in the vasculature, which can invalidate simple flow models.
The measured variability in CrCP and arteriole compliance across the healthy subject population was considerable (about 50% of the mean). This variability may reflect inter-subject variability in ICP and vasomotor tone. Although little data on ICP in healthy adults have been reported, some evidence of inter-subject ICP variability in healthy controls exists. In one study of 197 normal children, the average (mean ± SD) ICP measured from a lumbar puncture was 14.6 ± 5.0 mmHg and ranged from 4.4 to 35 mmHg. 67 In another study, measurements of ICP in four normal adult patients ranged from −3 to 6.5 mmHg. 68 It is also plausible for vasomotor tone to vary across healthy adults, since vasomotor tone changes with varying blood pressure, calmness/neural activation, hematocrit, lower limit of autoregulation, etc. Comparable variability to our measurements of CrCP and arterial compliance measured with TCD and with arterial tonometry, respectively, has been reported for healthy controls in the literature.69,70
The DCS technique has some limitations. When measurements of absolute flow are desired, some form of calibration must be utilized. In addition, CrCP analysis using DCS data requires an estimate of the ratio between systemic ABP and blood pressure at the entrance to the arteriole bed, i.e. γ in equations (1) and (2). The calculation of CrCP is directly proportional to γ (equation (2)), and therefore a 10% error in γ corresponds to a 10% error in CrCP. Arteriole compliance (equation (4)) is inversely proportional to γ. Inter-subject variations in γ likely contributed significantly to the large width of the 95% CI (in comparison to the mean) for the Bland–Altman analysis comparing CrCPDCS to CrCPTCD (Figure 5(b)). In practice, γ can be assumed from published literature measurements,
49
or it can be calibrated with an “initial” measurement/estimate of CrCP on a patient by patient basis. Another source of error in the DCS measurements is signal contamination from scalp blood flow. The pulsatility (i.e.
Finally, the accuracy of CrCP and compliance scales inversely with the number of samples (i.e. signal length) used in the transfer function analysis for their computation (see Data Processing for CrCP Calculation). A conservative estimate of measurement error for individual subjects was obtained by dividing the 5-min intervals of blood pressure and blood flow waveform measurements into two 2.5-min subintervals, from which two estimates of CrCP and compliance were obtained for each subject. The percent deviation between these two measurements (i.e. magnitude of the difference divided by their mean) for the CrCP and compliance are 17 ± 10% and 17 ± 7%, respectively (median ± IQR/2). Note that these two estimates wherein the signal length is half that of the original estimate are expected to be less accurate than the original estimate from the full signal.
Arteriole compliance and flow transit time
As noted above, the DCS blood flow readily exhibits a phase shift from the ABP waveform. This phase shift, which is not evident in the TCD waveforms, enables calculation of the transit time and compliance of the arteriole bed (equation (4)). These parameters require further study, but they may prove to be useful biomarkers for brain disease, and they also provide information complementary to that obtained by techniques developed for measurement of the compliance in large arteries.57,70,74–77
Comparison of DCS arteriole bed compliance to other compliance measurements reported in the literature is challenging. Here, we define compliance as the absolute mean arteriole blood volume, V, divided by the pressure difference across the arteriole bed,
On the other hand, the arteriole bed transit time (τ) is less susceptible to differences in measurement units and calibration issues, and it may be a useful biomarker for brain disease. 79 In Wistar rats, measurements of 14 mm/s and 1.2 mm were reported for cerebral pial arteriole blood velocity and length, respectively.80,81 This corresponds to a transit time of ∼86 ms, which is consistent with our arteriole transit time measurement of ∼84 ms. Previously, CHS NIRS was employed to measure a capillary transit time of 0.92 ± 0.18 s across 11 adult humans. 82 This number is an upper bound on the arteriole transit time, which is expected to be considerably less than the capillary transit time where most of the oxygen exchange takes place. ASL MRI was used in 22 healthy adults to measure an arterial transit time of 0.48 ± 0.09 s, 83 which is the duration for blood in the labeling region below the brain to flow into the vascular compartment imaged in the brain. This number also provides an upper bound on the arteriole transit time, since the path includes cerebral arteries and arterioles. Exploring the particular significance of arteriolar transit time measurements is an exciting avenue for future research.
In the present work, we did not observe a significant phase shift between the arterial blood pressure (ABP) and TCD flow velocity waveforms obtained from the middle cerebral artery. The larger phase shift measured with DCS is due at least in part to the fact that DCS probes local arteriole tissue (compliance) with greater sensitivity, which may in turn provide more sensitivity to vasomotor tone since variations in vasomotor tone likely give rise to variations in compliance. The origin of the observed timing difference between the DCS F and TCD Fv waveforms is an open question. Recall that DCS measures flow in the microvasculature under the probe; we modeled this microvasculature as a two-compartment Windkessel consisting of a resistor (R) and capacitor (C) in parallel (Figure 2), and thus the phase between ABP and F is given by
Finally, we note that the influence of compliance on the CrCP calculation was small but not negligible (Figure 7). It is therefore preferable to measure the phase shift between F and ABP and include it in the CrCP calculation, though the τ = 0 limit of equation (2) still gave a fairly good estimate of CrCP.
DCS measures arteriole blood flow
Our results provide supporting evidence for the suggestion that DCS signals are predominantly sensitive to arteriole blood flow. A priori, one would expect that the light detected by DCS interacts with blood in a mixture of arteriole, capillary, and venule compartments (recall, contributions from large arteries will be small due to their large light absorption). Consequently, the DCS blood flow index can be sub-divided to contain three contributions:


Here,
This observation and assignment of DCS signal origin are consistent with a recent investigation using Monte Carlo simulations to demonstrate that the decay of the intensity autocorrelation function measured by DCS (Figure 1(c)) is primarily due to the diffusive movement of red blood cells induced by shear flow. 43 The shear-induced diffusion coefficient of red blood cells is proportional to the shear rate, 85 which in turn scales linearly with blood flow.43,86 Consequently, it is reasonable to expect that among the three vascular compartments considered, the one with the highest shear rate would contribute most to the decay of the DCS intensity autocorrelation function. Shear rate is proportional to the maximum speed of red blood cells at the center of the vessel and inversely proportional to the square of the vessel radius.43,87 The combination of a steeper pressure gradient and lower compliance leads to an expectation of a much higher shear rate in arterioles compared to capillaries and venules.
Conclusion
We have introduced and demonstrated a novel optical technique for continuous, noninvasive monitoring of CrCP with near-infrared light intensity correlations. The optical measurements of CrCP were consistent with Doppler ultrasound (TCD) measurements in healthy adults. We further measured the arteriole compliance with the optical technique, a parameter which is rarely measured and which may be a useful biomarker for brain disease in the future. Our experimental measurements also support the notion that the origin of the DCS signal is primarily from shear-induced diffusive red blood cell movement in cerebral arterioles.
Footnotes
Funding
The author(s) disclosed receipt of the following financial support for the research, authorship, and/or publication of this article: National Institutes of Health (grant numbers R01-NS082309-01A1, R01-NS060653, P41-EB015893, R01-NS072338, T32-HL007915), the American Heart Association (grant number 14POST20460161), and philanthropic support from the June and Steve Wolfson Family Foundation.
Acknowledgements
We gratefully acknowledge Turgut Durduran, Tiffany Ko, Rodrigo Forti, Jeff Cochran, and Sanghoon Chong for valuable discussions.
Declaration of conflicting interests
The author(s) declared the following potential conflicts of interest with respect to the research, authorship, and/or publication of this article: D.R. Busch, W.B. Baker, A.B. Parthasarathy, and A.G. Yodh have two pending patent applications, and A.G. Yodh has two other patents relevant to this work (United States patents 8,082,015 and 6,076,010) but do not currently generate income.
Authors’ contributions
WB, AP, KG, MM, AY, and WK designed the study. AP, KG, and MM did the subject measurements. KA, DB, AP, and VK designed and built the optical instrumentation. WB and AP carried out primary data analysis. WB, with input from AP and AY, developed the theoretical modeling. WB wrote the manuscript with input from all other authors. Important editorial input, data analysis suggestions, and manuscript revisions were made by AY, RM, RB, AP, JD, JG, DL, DB, LH, and WK.
References
Supplementary Material
Please find the following supplemental material available below.
For Open Access articles published under a Creative Commons License, all supplemental material carries the same license as the article it is associated with.
For non-Open Access articles published, all supplemental material carries a non-exclusive license, and permission requests for re-use of supplemental material or any part of supplemental material shall be sent directly to the copyright owner as specified in the copyright notice associated with the article.