
Abstract
Rapid detection of ischemic conditions at the bedside can improve treatment of acute brain injury. In this observational study of 11 critically ill brain-injured adults, we employed a monitoring approach that interleaves time-resolved near-infrared spectroscopy (TR-NIRS) measurements of cerebral oxygen saturation and oxygen extraction fraction (OEF) with diffuse correlation spectroscopy (DCS) measurement of cerebral blood flow (CBF). Using this approach, we demonstrate the clinical promise of non-invasive, continuous optical monitoring of changes in CBF and cerebral metabolic rate of oxygen (CMRO2). In addition, the optical CBF and CMRO2 measures were compared to invasive brain tissue oxygen tension (PbtO2), thermal diffusion flowmetry CBF, and cerebral microdialysis measures obtained concurrently. The optical CBF and CMRO2 information successfully distinguished between ischemic, hypermetabolic, and hyperemic conditions that arose spontaneously during patient care. Moreover, CBF monitoring during pressor-induced changes of mean arterial blood pressure enabled assessment of cerebral autoregulation. In total, the findings suggest that this hybrid non-invasive neurometabolic optical monitor (NNOM) can facilitate clinical detection of adverse physiological changes in brain injured patients that are otherwise difficult to measure with conventional bedside monitoring techniques.
Keywords
Introduction
After acute brain injuries, disruptions in cerebral autoregulation (CA) and metabolism can lead to secondary brain damage that markedly worsens outcome. 1 – 4 Accordingly, a key treatment strategy is to maintain cerebral blood flow (CBF) such that oxygen and glucose delivery match metabolic demands. 5 – 7 Reduced CBF relative to metabolic needs can induce secondary ischemic damage, whereas excess CBF can cause blood–brain barrier (BBB) disruption, edema formation, and hemorrhage. Ideally, bedside monitors will detect conditions that increase the likelihood of secondary injury. 6 – 11 Unfortunately, however, bedside monitoring techniques (including serial neurologic examinations) in current use are unable to provide real-time, continuous, non-invasive measurements of CBF and brain metabolism. 6 – 9 This leads to a situation wherein mismatches between perfusion and metabolism that commonly arise in the hospital are often not detected until after irreversible brain damage has developed.
Invasive monitors placed directly into brain tissue can serially measure intracranial pressure (ICP), brain interstitial oxygen tension (PbtO2), CBF, and tissue biochemistry (using cerebral microdialysis to serially measure lactate, pyruvate, glucose, glycerol and glutamate) at a single spatial location in the white matter. While these monitors can provide real-time information about the adequacy of cerebral perfusion, only a small fraction of patients with acute brain injury receive invasive probes. Furthermore, data from a single white matter location may not always be indicative of cortical tissue, and invasive monitors do not directly measure mismatches between perfusion and metabolism. Invasive ICP probes do permit calculation of cerebral perfusion pressure (CPP) from mean arterial pressure (MAP) and ICP measurements, i.e., as the difference between MAP and ICP, but quite often, population-based CPP targets 12 – 14 are not applicable for individual patients. Indeed, hypoxic/ischemic secondary damage can occur even when target CPP levels are maintained. 15 – 17 In principle, thermal diffusion flowmetry (TDF) provides absolute CBF measurements with high temporal resolution; however, decreased CBF may not indicate ischemia since CBF reductions could be secondary to decreased cerebral metabolism. Moreover, TDF measurements are local, prone to measurement drift, and are less accurate/reliable when the probe is close to large vessels or if brain temperature is elevated.18,19 Comparable tradeoffs exist for brain tissue oxygen monitoring and microdialysis, since PbtO2 measurements may not always reflect the balance between oxygen delivery and consumption,20,21 and since cerebral lactate elevations may reflect both ischemic and non-ischemic alterations in brain metabolic pathways. 22 – 24 Combining different invasive monitoring modalities could provide a more nuanced picture of the balance between metabolic supply and demand. However, treatment targets based on multi-modality intracranial monitoring are not standardized, and measurement variability makes unambiguous identification of cerebral ischemia difficult in real-time.
For the majority of patients, in whom invasive neuromonitoring is not feasible, clinicians are forced to rely on global, non-neurologic indicators of the adequacy of systemic perfusion coupled with serial neurological examinations. Unfortunately, global targets, e.g., MAP, PaCO2, systemic oxygen saturation, and serum pH, may be within normal limits during periods of cerebral physiological distress, and the sensitivity of the neurologic exam can be significantly depressed by both the acute insult and sedative medications. Electroencephalography (EEG)25,26 and transcranial Doppler (TCD) 27 can provide non-invasive proxies of CBF; however, EEG signals are markedly altered by sedation, and TCD measurements are operator dependent, not amenable to prolonged continuous monitoring, and do not discriminate to changes in regional microvascular blood flow. Thus, a pressing clinical need for direct non-invasive CBF/metabolic monitors exists.
To this end, we tested the ability of a custom-built non-invasive neurometabolic optical monitor (NNOM) to continuously and concurrently measure cortical CBF, oxygenation, and cerebral metabolism in patients with severe acute brain injury. The NNOM combines time-resolved near-infrared spectroscopy28,29 (TR-NIRS) to measure regional cerebral microvascular oxygen saturation (StO2) with diffuse correlation spectroscopy 30 – 32 (DCS) to measure an index of cortical CBF (Fc). Changes in StO2 (combined with arterial oxygen saturation, SaO2) can be used to estimate changes in the cerebral oxygen extraction fraction (OEF), 33 and in combination with measurements of Fc, enable calculation of cerebral metabolic rate of oxygen (CMRO2). 33 – 35 In this way, deleterious mismatches between perfusion and metabolism can be identified. The prolonged ICU bedside monitoring of CBF, OEF, and CMRO2 demonstrated herein augments and complements a recent report of CBF monitoring with DCS alone in the ICU setting. 36
Previously, we utilized area under the curve (AUC) receiver-operator characteristic analysis to assess the ability of the individual components of NNOM (i.e., either DCS or TR-NIRS) to detect brain hypoxia (i.e., PbtO2 < 19 mmHg) in a subset of the patients reported here. 37 We found that NNOM CBF could detect brain hypoxia with fairly good predictive power (AUC = 0.76), but that NNOM StO2 could not (AUC = 0.46). 37 A recent investigation of frequency-domain NIRS StO2 monitoring for detection of brain hypoxia also showed variable predictive ability and was not robust across patients. 38 Of course, as mentioned above, brain hypoxia is not always equivalent to brain ischemia. Thus, we evaluated the capabilities of NNOM for detection of ischemia based on CBF and CMRO2 data in combination. We further compared NNOM CBF and CMRO2 to concurrent invasive PbtO2, ICP, TDF, and cerebral microdialysis measurements obtained during standard clinical care,6,11,39 and we used NNOM to assess CA state.
Methods
Patient selection and clinical monitoring
Written consent for all subjects was provided by legally authorized representatives, and all protocols/procedures were approved by the institutional review board at the University of Pennsylvania, which adheres to the guidelines of the Common Rule and the Food and Drug Administration’s Institutional Review Board and human subject regulations. Adult patients admitted to the University of Pennsylvania Neurocritical Care Unit (NCCU) with severe traumatic brain injury (TBI), intracerebral hemorrhage (ICH), subarachnoid hemorrhage, or diffuse hypoxic–ischemic brain injury (HIBI) requiring invasive multi-modality neuromonitoring for clinical care were eligible for this observational study. Five TBI patients, three ICH patients, and three HIBI patients were enrolled (N = 11 total). The standard neuromonitoring bundle included placement of an ICP monitor (Camino, Natus Neuro, Middleton, WI), a Clark electrode (Licox, Integra LifeSciences, Plainsboro, NJ), a thermodilution CBF monitor (Bowman Perfusion Monitor, Hemedex, Cambridge, MA), and a cerebral microdialysis catheter (MDialysis, North Chelmsford, MA). Microdialysis allows for serial measurements of analytes that can diffuse from brain interstitial fluid across a dialysis membrane into artificial cerebrospinal fluid flowing continuously through the dialysis chamber. Hourly levels of cerebral lactate, pyruvate, glucose, glutamate, and glycerol are routinely measured for clinical care. Elevated lactate and lactate:pyruvate ratio (LPR) are both markers of anaerobic ischemia, while reduced cerebral glucose is a marker of metabolic distress from either excess consumption or reduced delivery.
40
–
42
Glutamate and glycerol are markers of excitotoxicity and cell membrane turnover, respectively. Invasive probes were inserted through a quad lumen bolt (Hemedex, Cambridge, MA) placed above Kocher’s point
11
(Figure 1(a), (c)). Data from the invasive monitors, as well as other physiological variables (e.g., MAP, end-tidal CO2), were continuously recorded and time-synchronized using a bedside recording unit (CNS Monitor, Moberg Research Inc, Ambler, PA).
11
(a) Picture of quad lumen bolt with invasive probes. (b) Schematic of NNOM sensor that probes the head with: (1) TR-NIRS measurements at long (ρl = 3.2 cm) and short (ρs = 0.7 cm) source-detector separations to derive cerebral StO2 and OEF; and (2) DCS measurements at long (ρl,f = 2.5 cm) and short (ρs = 0.7 cm) source-detector separations to derive a CBF index (see text). (c) Configuration of concurrent non-invasive and invasive intracranial monitoring probes. (d) Anatomical CT scan showing position of NNOM sensor on the scalp (encompassed by yellow rectangle) and the tip of an invasive probe (yellow arrow). The patient’s skull was surgically removed from the left side to treat cerebral edema and intracranial hypertension. Arrowhead points to subdural drain, and open circles mark positions of EEG electrodes.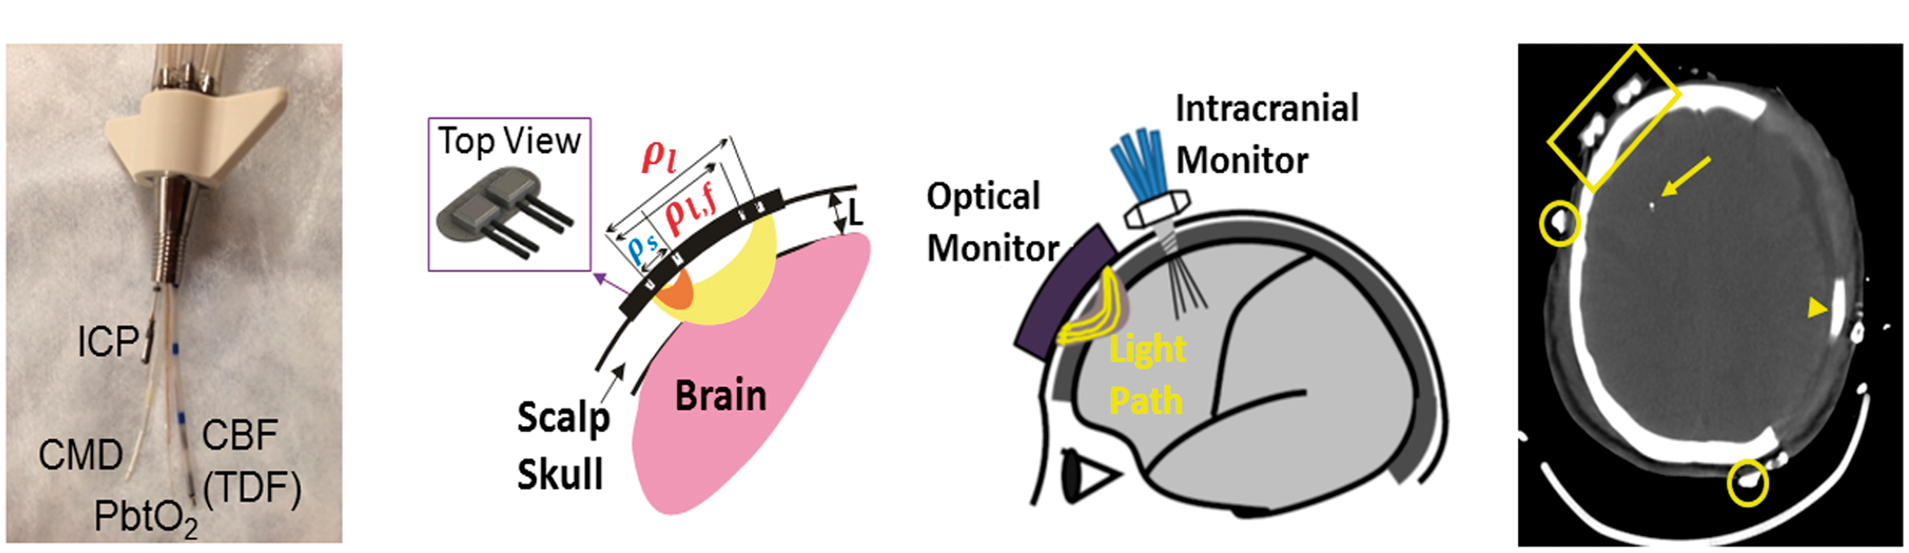
Summary of clinical events.
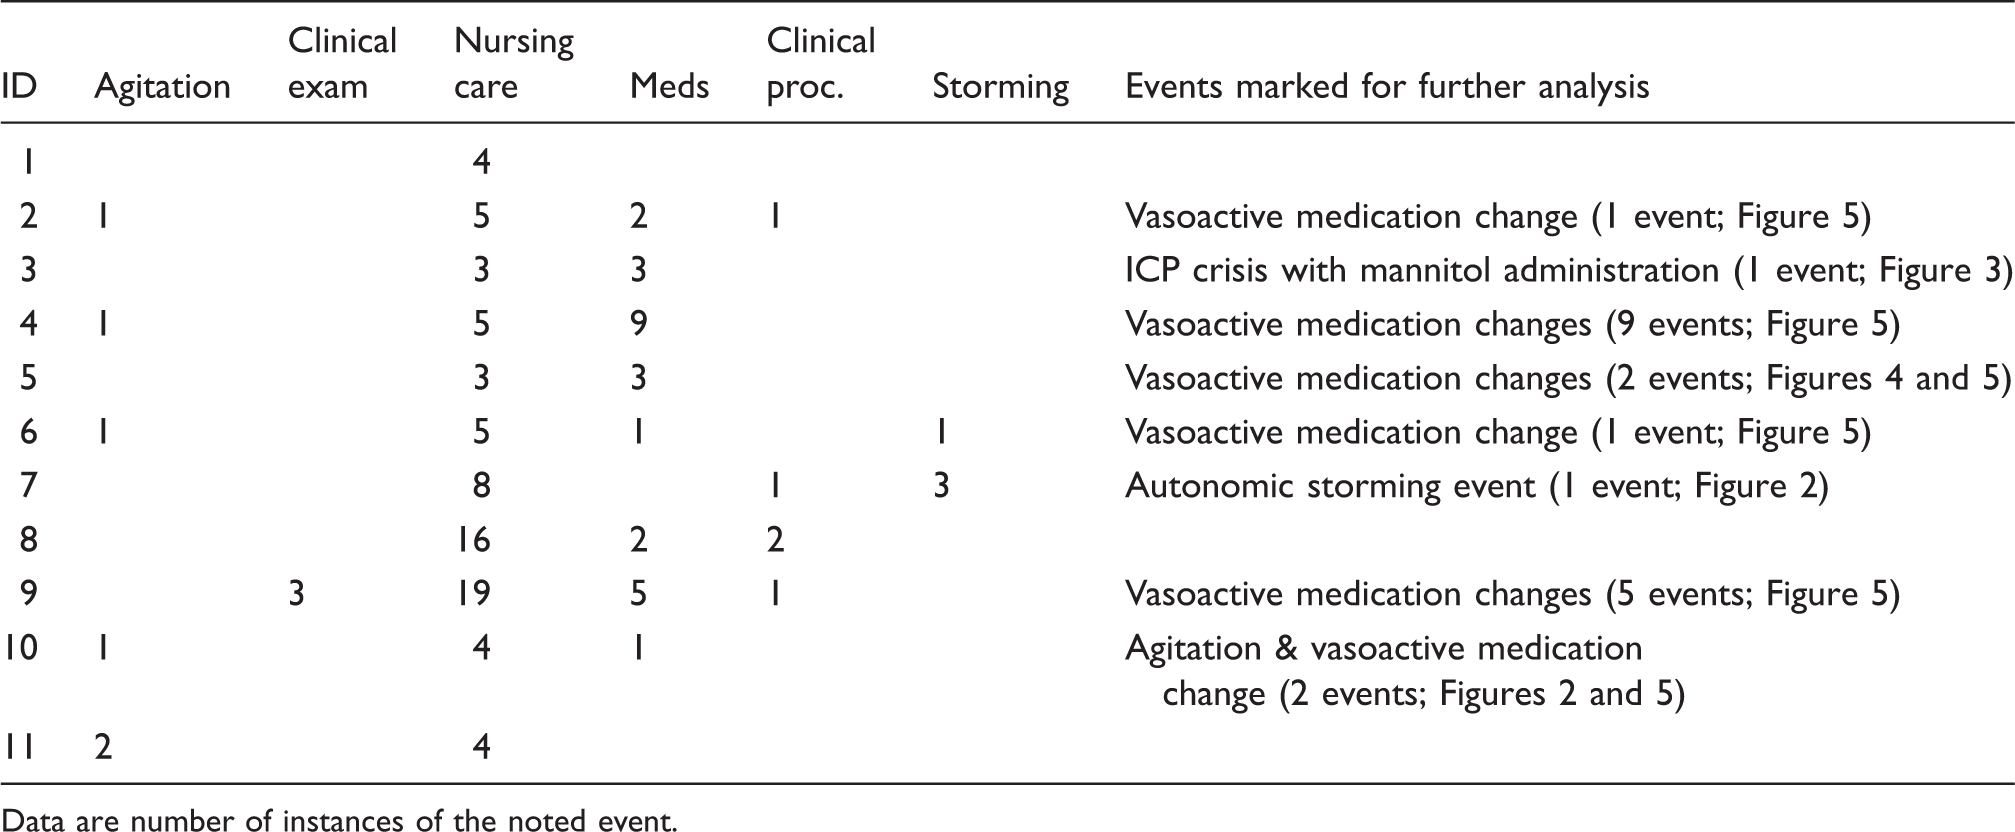
Data are number of instances of the noted event.
NNOM monitoring
The custom-built NNOM instrument consisted of a TR-NIRS module and a DCS module to enable interleaved measurements of StO2 and CBF index (Fc). The instrument and fiberoptic sensor are described in detail elsewhere. 45 Briefly, the NNOM sensor was placed on the forehead (Figure 1(b)), and secured with sweat-resistant double-sided tape (#1522 in contact with skin, #9917 in contact with sensor, 3 M Health Care, St. Paul, MN) reinforced with medical tape (Medipore Dress-It, #2954, 3 M) along the top edges. A black cloth spanning ∼2–3 cm from the sensor edges was further employed to block stray room light. During patient monitoring, NNOM cyclically interleaved TR-NIRS measurements of temporal point spread functions at short (0.7 cm) and long (3.2 cm) separations at six wavelengths (730, 770, 786, 810, 830, 850 nm; 800 ms exposure per wavelength) with DCS measurements of normalized intensity autocorrelation functions (10 s exposure, short separation 0.7 cm, long separation 2.5 cm) to derive StO2 and Fc every 20 s. From these data, indices of OEF and CMRO2 were computed.
TR-NIRS analysis for cerebral OEF changes
For each TR-NIRS wavelength, we utilized a two-layer model of the head to estimate differential changes in cerebral tissue absorption; this analysis utilized the moments of the TR-NIRS temporal point spread functions measured at short and long separations (for details see Appendix in Supplementary material). Note, this analysis, which is a variation of a method described elsewhere,46,47 assumes constant tissue reduced scattering to compute differential tissue absorption changes. The extra-cerebral layer thickness, L, was estimated for each patient from anatomical CT scans (e.g., Figure 1(d)). Concurrent tissue absorption measurements at the six TR-NIRS wavelengths were readily converted to concentration changes in cerebral oxy-hemoglobin (HbO) and deoxy-hemoglobin (Hb) via standard linear absorption spectroscopy theory.
48
The cerebral tissue oxygen saturation (StO2) at any time is given by
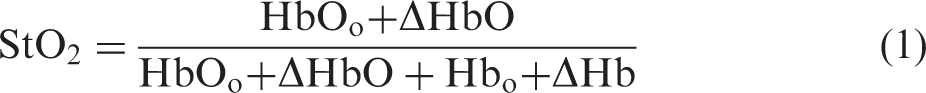

Here, SaO2 is the arterial oxygen saturation obtained from a clinical pulse oximeter, and γ is a vascular partition weighting constant defined by the relation StO2 = (1 − γ)SaO2 + γSvO2. SvO2 is the cerebral venous oxygen saturation. Note, throughout the manuscript, the subscript “o” indicates the baseline values. We assumed that γo = γ in equation (2), which is valid if the distribution of cerebral blood volume across the arterial, capillary, and venous compartments is similar for the baseline and “perturbed” time points.
DCS analysis for CBF changes
Utilizing a previously described probe pressure measurement paradigm,
51
we employed a two-layer model of the head to derive a CBF index (Fc) from the temporal autocorrelation functions measured at short and long separations. Constant tissue reduced scattering was assumed for this computation, and the TR-NIRS-derived tissue absorption measurements (at the 786 nm wavelength) were used as inputs in the pressure measurement paradigm for computing Fc. Changes in CBF relative to baseline were estimated from changes in Fc52,53

TR-NIRS/DCS measurement of CMRO2
We used a steady-state tissue compartment model to estimate changes in the CMRO2 from TR-NIRS and DCS measurement of OEF and CBF changes, respectively33,54

Assessment of CA from NNOM measurements
Correlation-based autoregulation indices were calculated from 19 different time-periods where MAP varied by >10 mmHg in response to changes in vasoactive medication infusion rates. We calculated Pearson’s correlation coefficient (DCSx) between the NNOM Fc index and MAP across the temporal interval spanning from 10 min prior to 40 min after the infusion rate adjustment. Note, to prevent the same data from being used for multiple CA assessments in cases where multiple infusion rate adjustments were administered less than an hour apart, only the first adjustment in the series was considered. The pressure reactivity index (PRx; Pearson’s correlation coefficient between ICP and MAP), 55 brain tissue oxygen pressure reactivity index (ORx; Pearson’s correlation between PbtO2 and CPP), 56 cerebral oximetry index (COx; Pearson’s correlation between StO2 and MAP), 57 and TDF CBF index (TDFx; Pearson’s correlation between TDF CBF and CPP) were also computed across the same temporal intervals. Positive values for these correlation indices indicate impaired autoregulation, whereas a lack of correlation indicates preserved autoregulation. Note, negative PRx values also suggest intact CA, since vasoconstriction triggered by MAP increases will decrease cerebral blood volume, which ultimately causes a decrease in ICP. The COx, which is computed from NNOM StO2 data, employs StO2 changes as a surrogate for CBF changes. 57
Results
Patient clinical and study data.
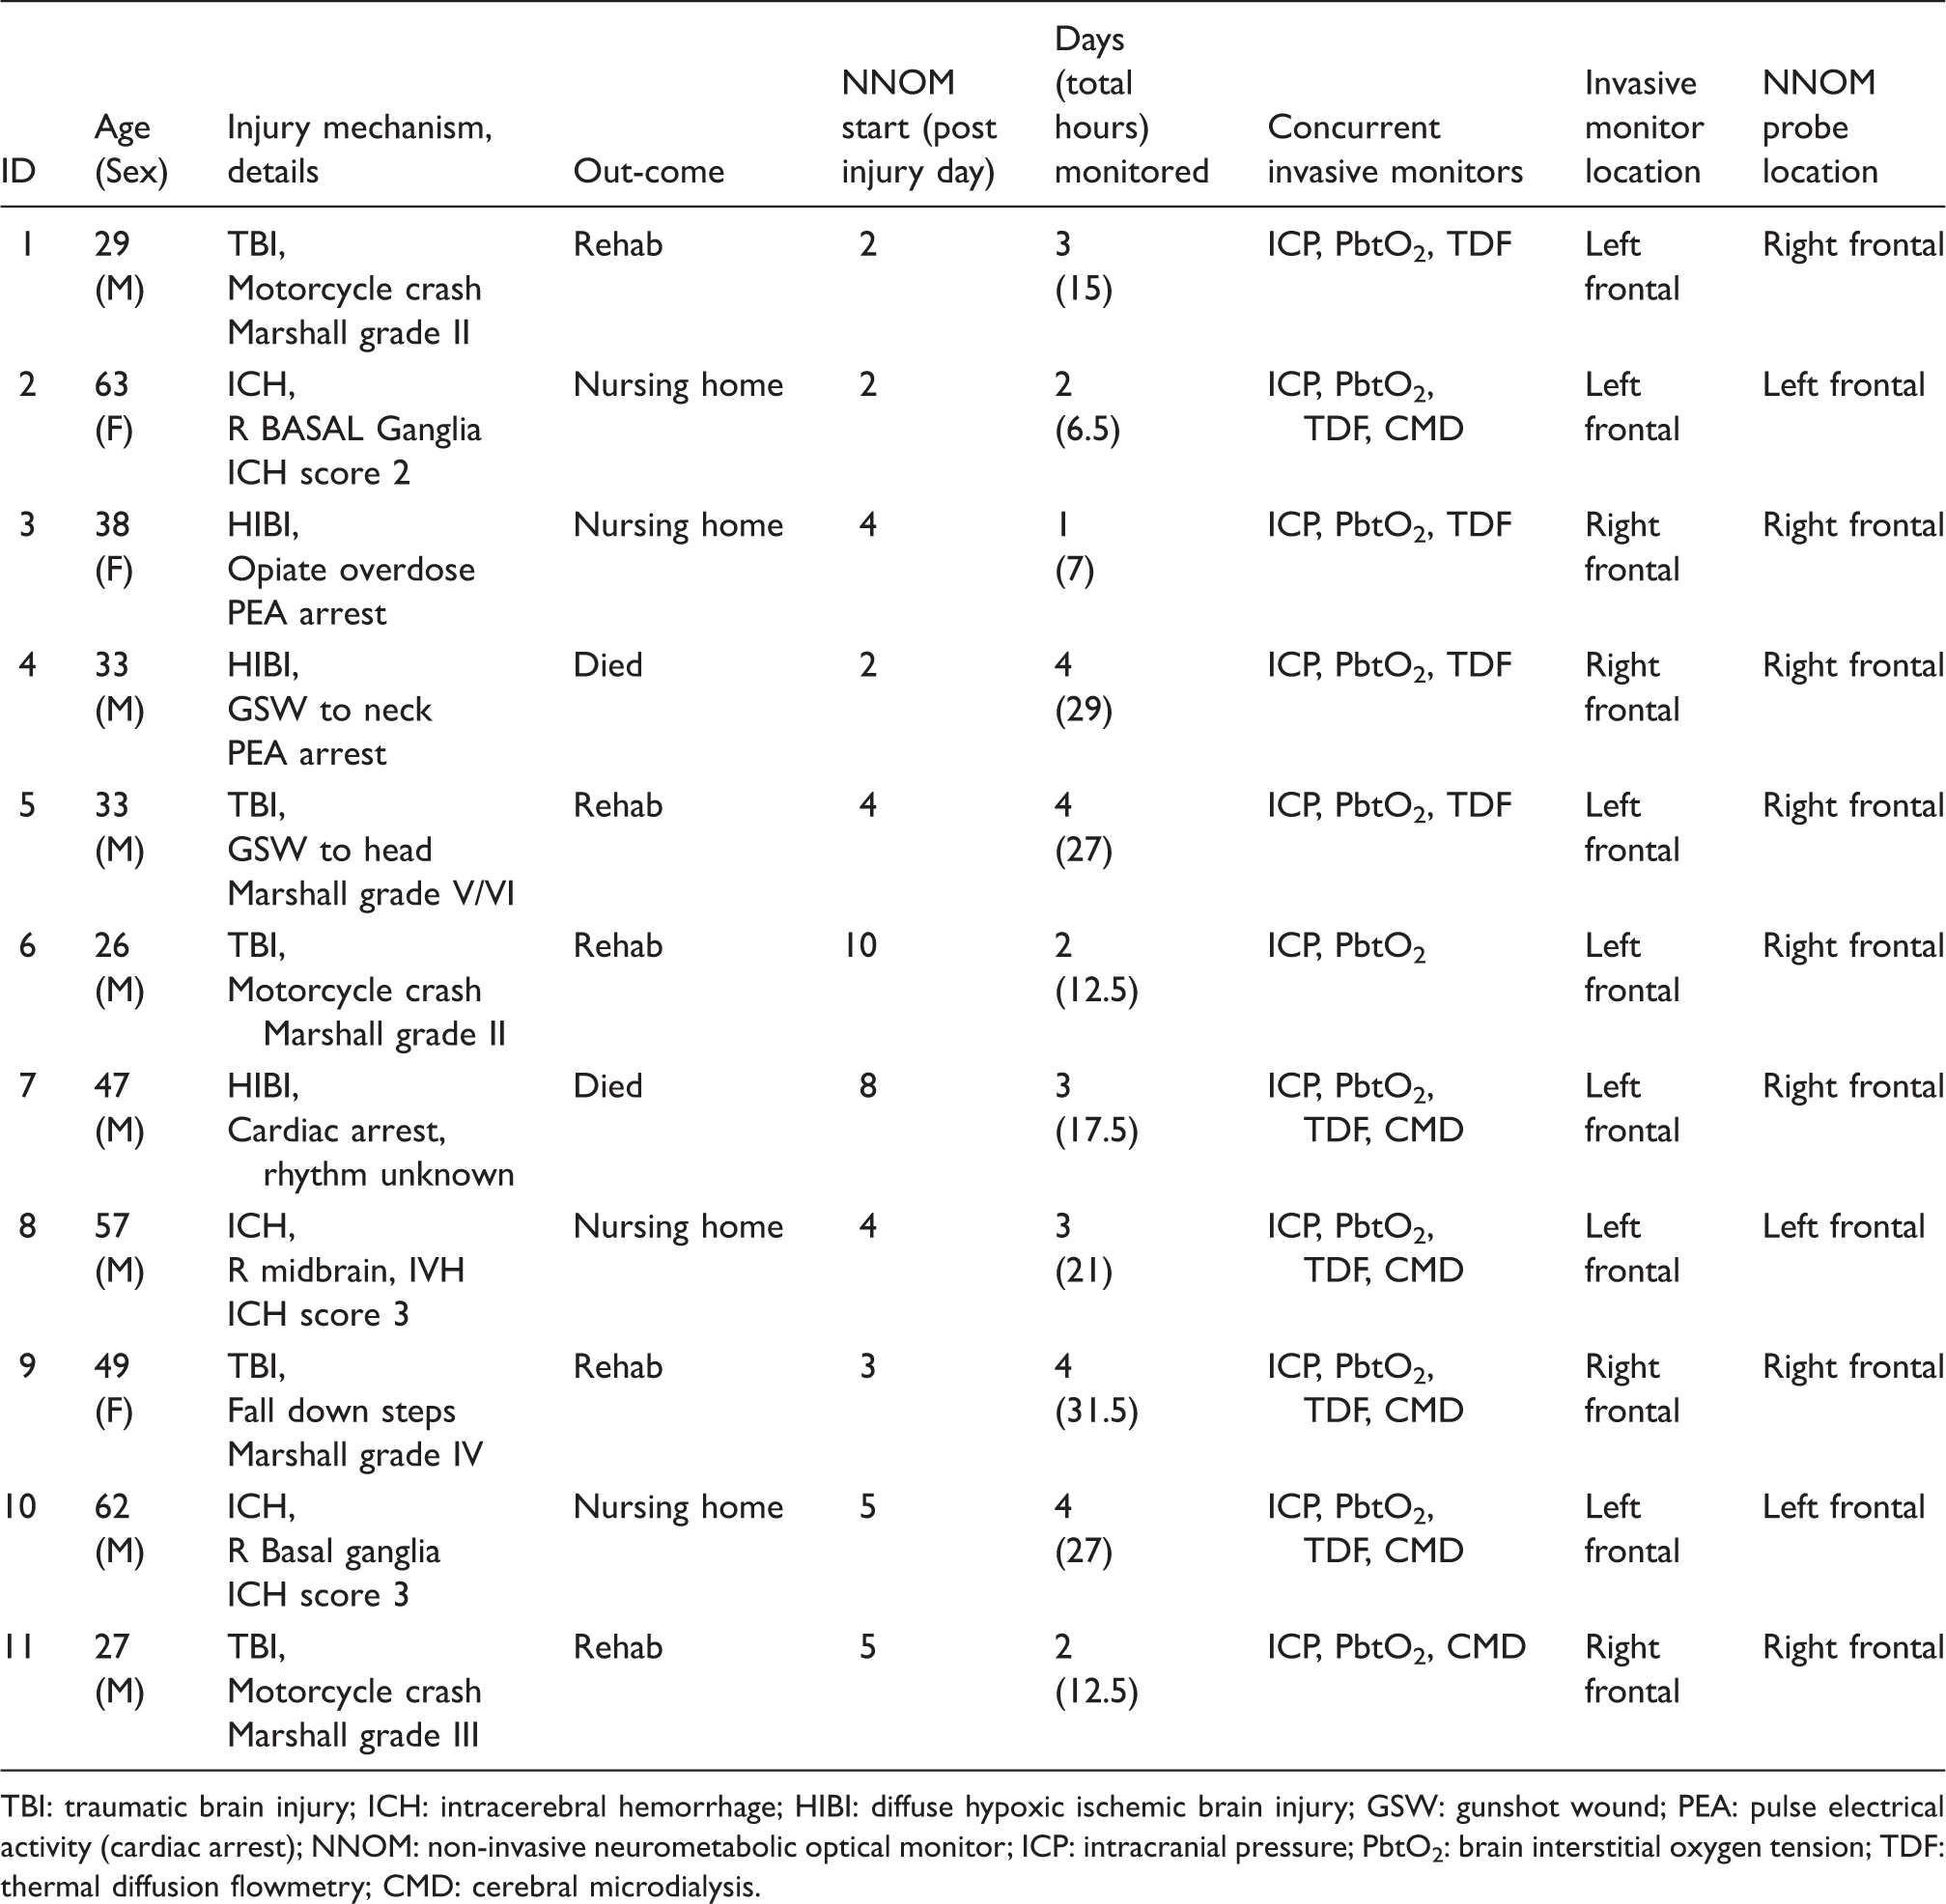
TBI: traumatic brain injury; ICH: intracerebral hemorrhage; HIBI: diffuse hypoxic ischemic brain injury; GSW: gunshot wound; PEA: pulse electrical activity (cardiac arrest); NNOM: non-invasive neurometabolic optical monitor; ICP: intracranial pressure; PbtO2: brain interstitial oxygen tension; TDF: thermal diffusion flowmetry; CMD: cerebral microdialysis.
Correlation between absolute invasive and non-invasive measurements
We initially compared the absolute properties determined by invasive and non-invasive methods using all patient data wherein TDF/DCS and PbtO2/StO2/DCS results were obtained concurrently. The absolute cortical CBF index (i.e., Fc) measured optically with DCS exhibited an overall poor correlation with absolute CBF measured with invasive TDF. Specifically, across the nine patients who had invasive blood flow monitoring, the mean Pearson correlation coefficient between invasive and optical CBF measurements was 0.15 (range: −0.35 to 0.60). There was a similar poor overall correlation between Fc and PbtO2 (mean 0.25; range: −0.29 to 0.73), as well as between StO2 and PbtO2 (mean 0.25; range: −0.49 to 0.67), across all 11 patients. Despite the poor overall correspondence between the absolute optical and the absolute invasive measurements of CBF and oxygenation, however, we found that physiologically concordant changes between optically measured CBF, StO2 and invasive monitors could clearly be identified during many of the clinical events of interest that were annotated during data collection (see Table 1). This set of events includes deleterious mismatches between cerebral perfusion and metabolism, and impaired CA.
Identification of metabolic supply/demand mismatches
In addition to providing information on CBF fluctuations, NNOM identified mismatches between cerebral metabolic demand and supply. By simultaneously monitoring CBF and StO2, we were able to calculate the changes in OEF and CMRO2 over time using a modified form of the Fick equation (equations (2) and (4)). Tracking these parameters permitted unambiguous identification of ischemia/misery perfusion episodes (defined by increased OEF and excess CMRO2 compared to CBF) and hyperemia/luxury perfusion (defined by decreased OEF and excess CBF relative to CMRO2). Ischemic episodes could further be categorized as being caused primarily by reductions in CBF (i.e., inadequate cerebral perfusion) or by elevations in CMRO2 (i.e., excess cerebral metabolic demand). The following sections describe the examples of supply/demand mismatch in detail.
Ischemia from inadequate cerebral perfusion
During the course of care for an ICH patient undergoing NNOM monitoring (Subject 10), patient agitation triggered an abrupt increase in MAP from 98 to 120 mmHg (Figure 2(a)). In this setting, the phenylephrine infusion rate was rapidly titrated down to limit the risk of hematoma expansion. During the agitation event, there was a five-fold increase in CMRO2 that was matched by an equivalent five-fold increase in CBF (Figure 2(b)). In addition, end-tidal CO2 increased from 32 to 38 mmHg and invasive brain temperature slightly increased from 38.7℃ to 39.2℃, consistent with abrupt increases in cerebral metabolism and perfusion, respectively. During the ensuing decrease in phenylephrine infusion rate (from 150 to 100 mcg/min), MAP decreased to 80 mmHg.
Cerebral ischemic events triggered by a decrease in mean arterial pressure (MAP) in subject 10 (a, b, c), and excess cerebral metabolic demand during paroxysmal sympathetic hyperactivity (PSH) in subject 7 (d, e, f). Temporal traces of multimodal data acquired before/during/after an episode of patient agitation (a) and before/during/after an episode of PSH (d). Relative cerebral oxygen extraction fraction (rOEF ≡ OEF/OEFo) and blood flow (rCBF ≡ CBF/CBFo) measurements obtained with the NNOM are given by equations (2) and (3), respectively. Baseline values, CBFo and OEFo, are computed to be the means of the data between the two vertical red lines. Panel (a) contains NNOM measurements of cortical CBF (red circles) and thermal diffusion flowmetry (TDF) measurements of white matter CBF (brown squares). The vertical green lines in panels (a) and (d) indicate a decrease in phenylephrine infusion rate (from 150 to 100 mcg/min) and the start of PSH, respectively. In panels (b) and (e), steady-state 6-min averages of NNOM rCBF, rOEF, and relative cerebral metabolic rate of oxygen (rCMRO2) data for the same temporal intervals as panels (a) and (d), respectively, are shown (rCMRO2 given by equation (4)). Cerebral microdialysis lactate:pyruvate ratio (LPR; blue circles) and glycerol concentration (red squares) measurements are plotted before/during/after the patient agitation episode (c) and the PSH episode (f) over wider time intervals. The gray-shaded regions in panels (c) and (f) indicate the time intervals of panels (a) and (d), respectively. PbtO2, ICP, and HR denote, respectively, brain interstitial oxygen tension, intracranial pressure, and heart rate. Note, the gap in NNOM data in panel (a) was caused by a regrettable crash in the instrument control software.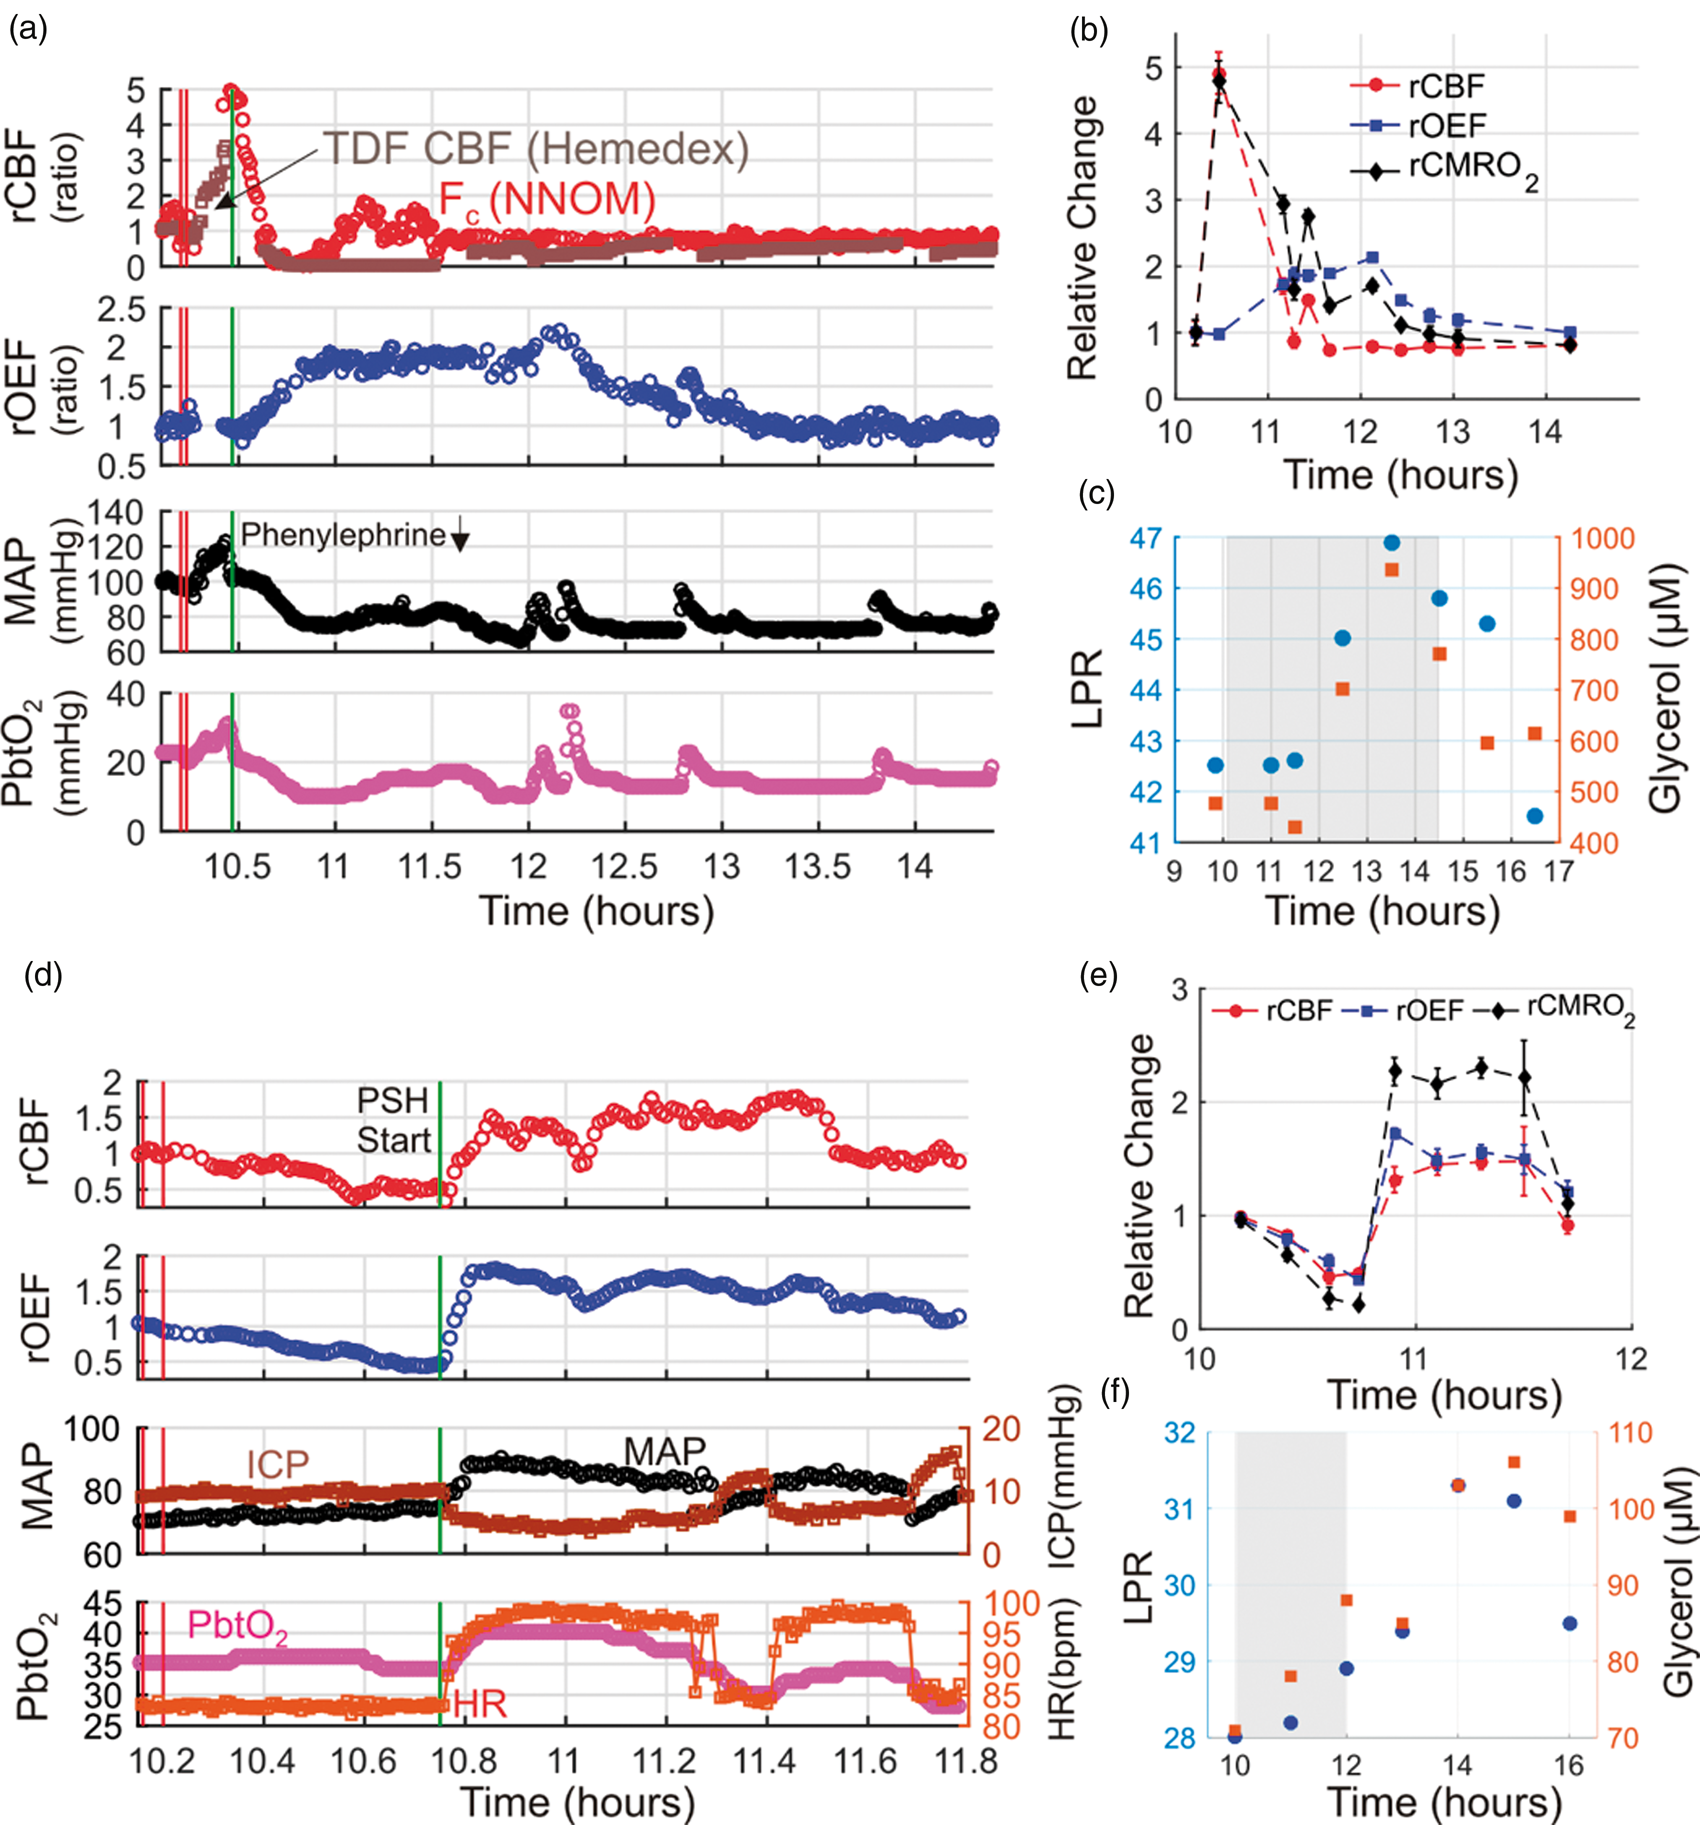
Although this blood pressure was within appropriate population-based goals for clinical care, NNOM and TDF measurements of CBF plummeted transiently to nearly zero, PbtO2 dropped from 20 to 10 mmHg, and OEF increased two-fold (Figure 2(a)). After ∼13 min, NNOM measurements of cortical CBF recovered, but OEF remained elevated, indicating an uncoupling between CBF and CMRO2. CBF was depressed relative to CMRO2 for the next 3.5 h (Figure 2(b)). The sustained mismatch between CMRO2 and CBF triggered delayed increases in cerebral tissue LPR and glycerol measured using microdialysis, suggesting anaerobic metabolism and lipid membrane turnover from cell death, respectively (Figure 2(c)).22,58,59 Recall, computation of CMRO2 via equation (4) is valid for tissue states experiencing steady state conditions, which is not the case when cerebral oxygen concentration in the blood and tissue experience rapid transient changes (see “Methods” section). Accordingly, we computed 6-min average CMRO2 changes over hemodynamically stable intervals, rather than for every time point where Fc and OEF values were obtained.
Relative ischemia from excess cerebral metabolic demand
Figure 2(d) shows monitoring trends during an episode of paroxysmal sympathetic hyperactivity (PSH) in a patient with HIBI (subject 7). The event is marked by an abrupt increase in MAP and HR; note, no evidence of seizure activity was found in concurrent EEG monitoring. NNOM CBF increased abruptly during the event; however, the increase in CMRO2 far exceeded the CBF change (reflected by a doubling of OEF, Figure 2(e)). The hypermetabolic-driven mismatch between CMRO2 and CBF was accompanied by subtle increases in LPR and glycerol (Figure 2(f)), suggesting increased rates of anaerobic metabolism and cellular membrane turnover despite an overall increase in PbtO2 during the PSH event (Figure 2(d)). The CMRO2 increase likely reflects excess activity in hypothalamic and subcortical brain areas that mediate autonomic nervous system output to the periphery.
Cerebral hyperemia/luxury perfusion
Figure 3 shows an episode of intracranial hypertension in a patient with HIBI (subject 3) treated with mannitol. During the ICP spike, both MAP and ICP increased by ∼ 20 mmHg, such that CPP remained relatively constant, and cortical CBF and CMRO2 both decreased by ∼ 25%. The matched reduction in CBF and CMRO2 may reflect metabolic coupling to changes in CBF. Indeed, OEF and PbtO2 remained relatively constant, suggesting that this episode of intracranial hypertension did not produce ischemic conditions. After mannitol administration, ICP decreased, but MAP remained relatively constant, resulting in a marked increase in CPP, a sustained increase in CBF relative to CMRO2, and a decrease in OEF. This hyperemic mismatch between CBF and CMRO2 was associated with an abrupt increase in PbtO2.
Hyperemia/Luxury perfusion after an episode of intracranial hypertension. Temporal traces of relative cerebral blood flow (rCBF ≡ CBF/CBFo), and oxygen extraction fraction (rOEF ≡ OEF/OEFo), mean arterial pressure (MAP), brain interstitial oxygen tension (PbtO2), and intracranial pressure (ICP) data acquired during an episode of elevated ICP in a patient with diffuse hypoxic ischemic brain injury (cerebral microdialysis and thermal diffusion flowmetry CBF not available). Steady-state 6-min averages of rCBF and relative cerebral metabolic rate of oxygen (rCMRO2 ≡ CMRO2/CMRO2,o) data measured with the NNOM are also plotted versus time (bottom panel). CBFo, OEFo, and CMRO2,o denote the (baseline) mean values of the NNOM data between the two vertical red lines. The intracranial hypertension was treated with a 70 g bolus of 25% mannitol, administered between the two vertical green lines. Note: the initial transient increase in PbtO2 at the beginning of the episode is due to a 100% O2 challenge (performed periodically to test monitor function), and the gaps in the NNOM data were caused by regrettable crashes in the instrument control software.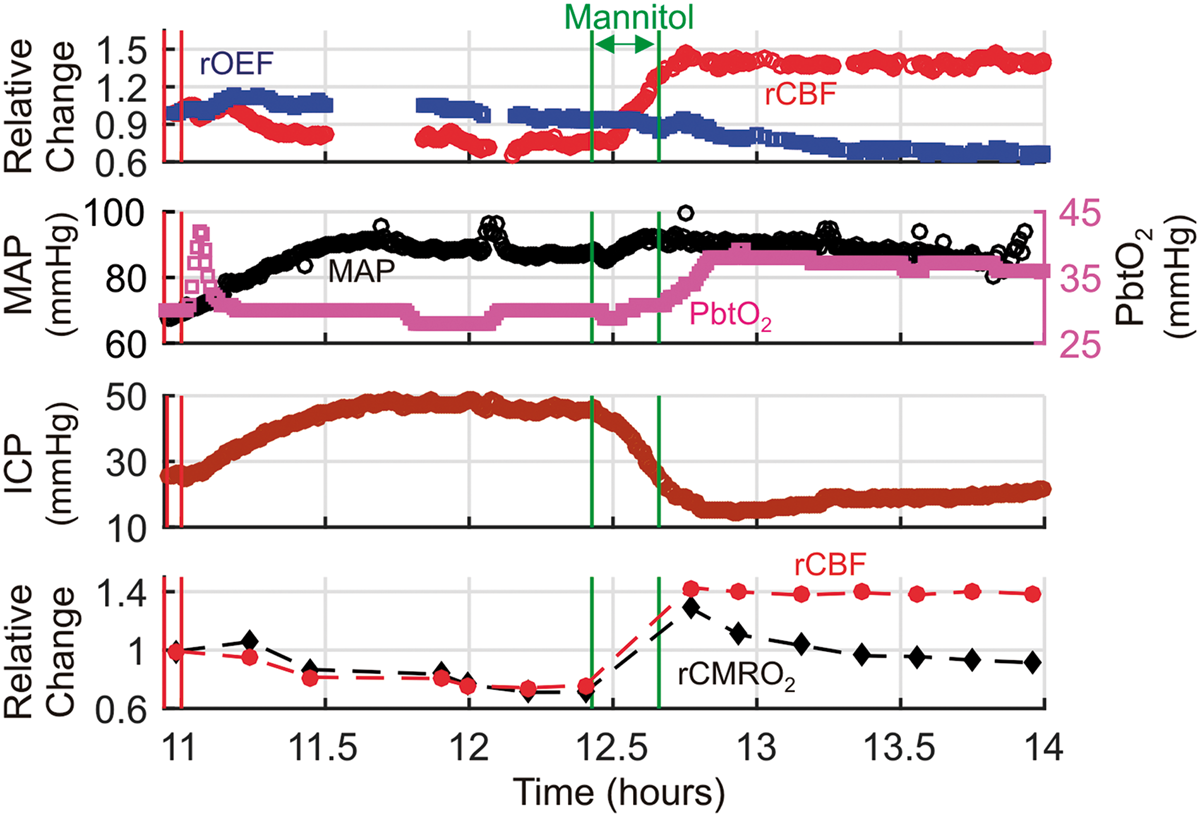
CA assessment
For CA, we analyzed 19 instances across six patients (4 with TBI, 2 with ICH) in whom MAP changed by > 10 mmHg as a result of adjusting the infusion rates of vasoactive medications (nicardipine, n = 4; norepinephrine, n = 14; phenylephrine, n = 1). CA was characterized by the Pearson’s correlation (DCSx) between concurrent NNOM CBF and MAP data across the temporal interval spanning from 10-min-prior to 40-min-after the infusion rate adjustment. TDF data were available for nine of the 19 identified “MAP challenges”, and PbtO2 data were available for 15 of the 19 challenges.
Two exemplar measurements of DCSx made in the same subject (subject 5) one day apart are shown in Figure 4. Interestingly, the first assessment in this subject indicated impaired CA (DCSx = 0.92, p < 0.0001; Figure 4(c)), but the second assessment performed 26.3 h later indicated intact CA (DCSx = − 0.07, p = 0.5; Figure 4(d)). The shift from high to low DCSx values suggests a progressive improvement in CA over time. Indeed, the patient ultimately had a return of consciousness and was discharged to an acute rehabilitation facility.
Temporal non-invasive neurometabolic optical monitor (NNOM) measurements of relative cerebral blood flow (rCBF ≡ CBF/CBFo) with concurrent mean arterial pressure (MAP, mmHg), intracranial pressure (ICP, mmHg), and brain interstitial oxygen tension (PbtO2, mmHg) data acquired during MAP manipulations performed on “measurement day 1” (a) and “measurement day 2” (b) in subject #5 (diagnosed with traumatic brain injury, see Table 1). CBFo is the (baseline) mean value of the data between the two vertical red lines. MAP was significantly altered via adjustment of norepinephrine infusion (vertical green lines: the increase from 2 to 4 mcg/kg/min in panel (a); the decrease from 4 to 2 mcg/kg/min, followed by the increase from 2 to 4 mcg/kg/min in panel (b)). The vertical dashed black lines indicate the 6-min intervals used to compute the steady-state changes relative to baseline that are shown in panels (d) and (e) of Figure 5. (c) rCBF plotted against concurrent MAP data for the entire temporal interval shown in panel (a). The high Pearson’s correlation coefficient (i.e., DCSx = 0.92, p < 0.0001) indicates impaired cerebral autoregulation (CA). (d) rCBF plotted against concurrent MAP data for the entire temporal interval shown in panel (b). The lack of correlation (i.e., DCSx = −0.07, p = 0.5) indicates intact CA. The analogous pressure reactivity autoregulation indices (PRx) for the data in panels (a) and (b) are −0.10 (p = 0.34) and −0.92 (p < 0.0001), respectively (note, although the PRx value for panel (a) is negative, the p value indicates the correlation is not significant). The analogous brain tissue oxygen pressure reactivity autoregulation indices (ORx) are 0.80 (p < 0.0001) and 0.69 (p < 0.0001), respectively. Thermal diffusion flowmetry data were not available during these CA assessments.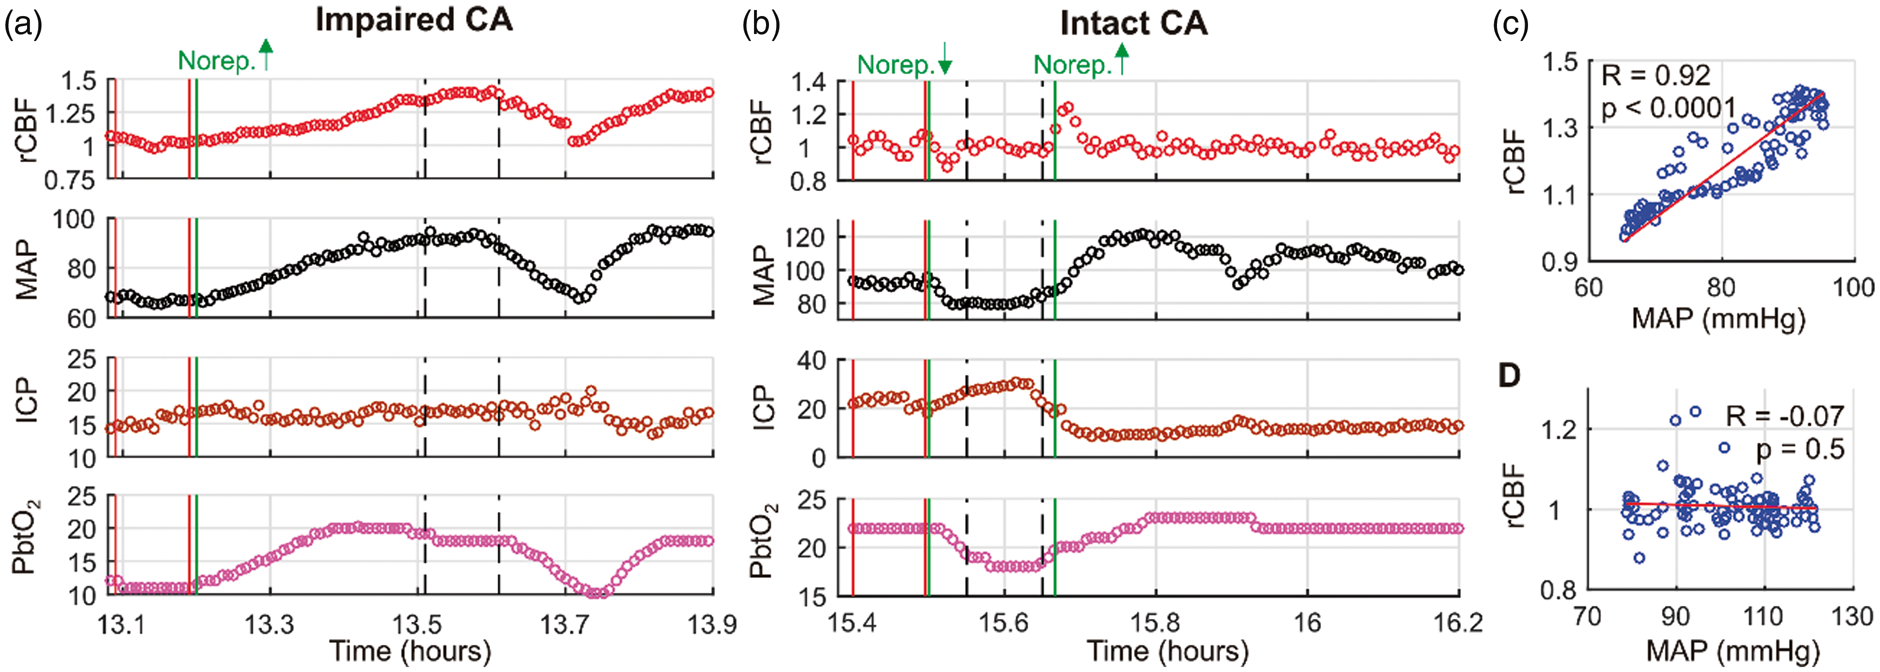
As discussed above, other indices of CA include the ORx (correlation between PbtO2 and CPP), TDFx (correlation between TDF CBF and CPP), COx (correlation between NNOM StO2 and MAP), and PRx index (correlation between ICP and MAP). For the two serial assessments in subject 5, the ORx values were 0.80 (p < 0.0001) and 0.69 (p < 0.0001); the COx values were 0.72 (p < 0.0001) and 0.19 (p = 0.01), and the PRx values were − 0.10 (p = 0.34) and −0.92 (p < 0.0001). TDF data were not available during these CA assessments.
Across all of the MAP challenges, indices using CBF or CBF proxies (i.e. PbtO2, StO2) showed overall impaired CA (Figure 5(a),(b)). The median (25th percentile, 75th percentile) DCSx index across the MAP challenges was 0.69 (0.51, 0.79). Similarly, the median ORx, TDFx, and COx indices were 0.84 (0.67, 0.90), 0.63 (−0.28, 0.74), and 0.53 (0.21, 0.73), respectively. In contrast, the median PRx index of 0.12 (−0.45, 0.61) was lower, and PRx was frequently discordant with DCSx (Figure 5(c)). The Pearson’s correlations between DCSx and ORx (R = 0.35, p = 0.2), DCSx and TDFx (R = −0.04, p = 0.9), DCSx and COx (R = 0.32, p = 0.2), and DCSx and PRx (R = 0.18, p = 0.5) were all not significant (Fisher transformation applied to CA indices prior to computing Pearson’s correlations
60
).
During non-invasive neurometabolic optical monitoring, significant mean arterial pressure (MAP) changes were induced 19 times by standard-of-care adjustment in vasoactive medication infusion rates. DCSx, COx, ORx, TDFx, and PRx cerebral autoregulation (CA) indices were computed across the 50-min intervals encompassing the infusion changes (see text). These five indices are, respectively, the Pearson correlation coefficients between: (1) optical diffuse correlation spectroscopy (DCS) cerebral blood flow (CBF) index and mean arterial pressure (MAP); (2) optical time-resolved near-infrared spectroscopy (TR-NIRS) measurement of cerebral tissue oxygen saturation and MAP; (3) brain interstitial oxygen tension (PbtO2) and cerebral perfusion pressure (CPP); (4) thermal diffusion flowmetry (TDF) CBF and CPP; and (5) MAP and intracranial pressure. (a) COx plotted against DCSx; (b) ORx (blue circles) and TDFx (red squares) plotted against DCSx; and (c) PRx plotted against DCSx. In most cases, the DCSx, COx, ORx, and TDFx indicate impaired CA. The PRx, however, is more variable. Steady-state PbtO2 changes resulting from the infusion changes were correlated with DCS measured CBF changes (equation (3)) (d), but not with TR-NIRS measured OEF changes (equation (2)) (e). Steady-state DCS measured CBF changes were not correlated with TDF CBF changes (f). In panels (d) through (f), the baseline and perturbed data are 6 min averages across stable data acquired shortly before and shortly after the pressor infusion rate changes (e.g., see Figure 4). The red line in panel (d) is the linear best-fit line. One event of cerebral ischemia (i.e., PbtO2 < 20 mmHg, TDF CBF < 15 ml/100 g/min, cerebral microdialysis lactate:pyruvate ratio > 40) accompanied a drop in phenylephrine infusion (labeled in panels (d), (e), (f); temporal data in Figure 2). For subject #5, DCSx indicated impaired CA day 1 (DCSx = 0.92), and intact CA day 2 (DCSx = −0.07; MAP challenges labeled in panels (d), (e); temporal data in Figure 4).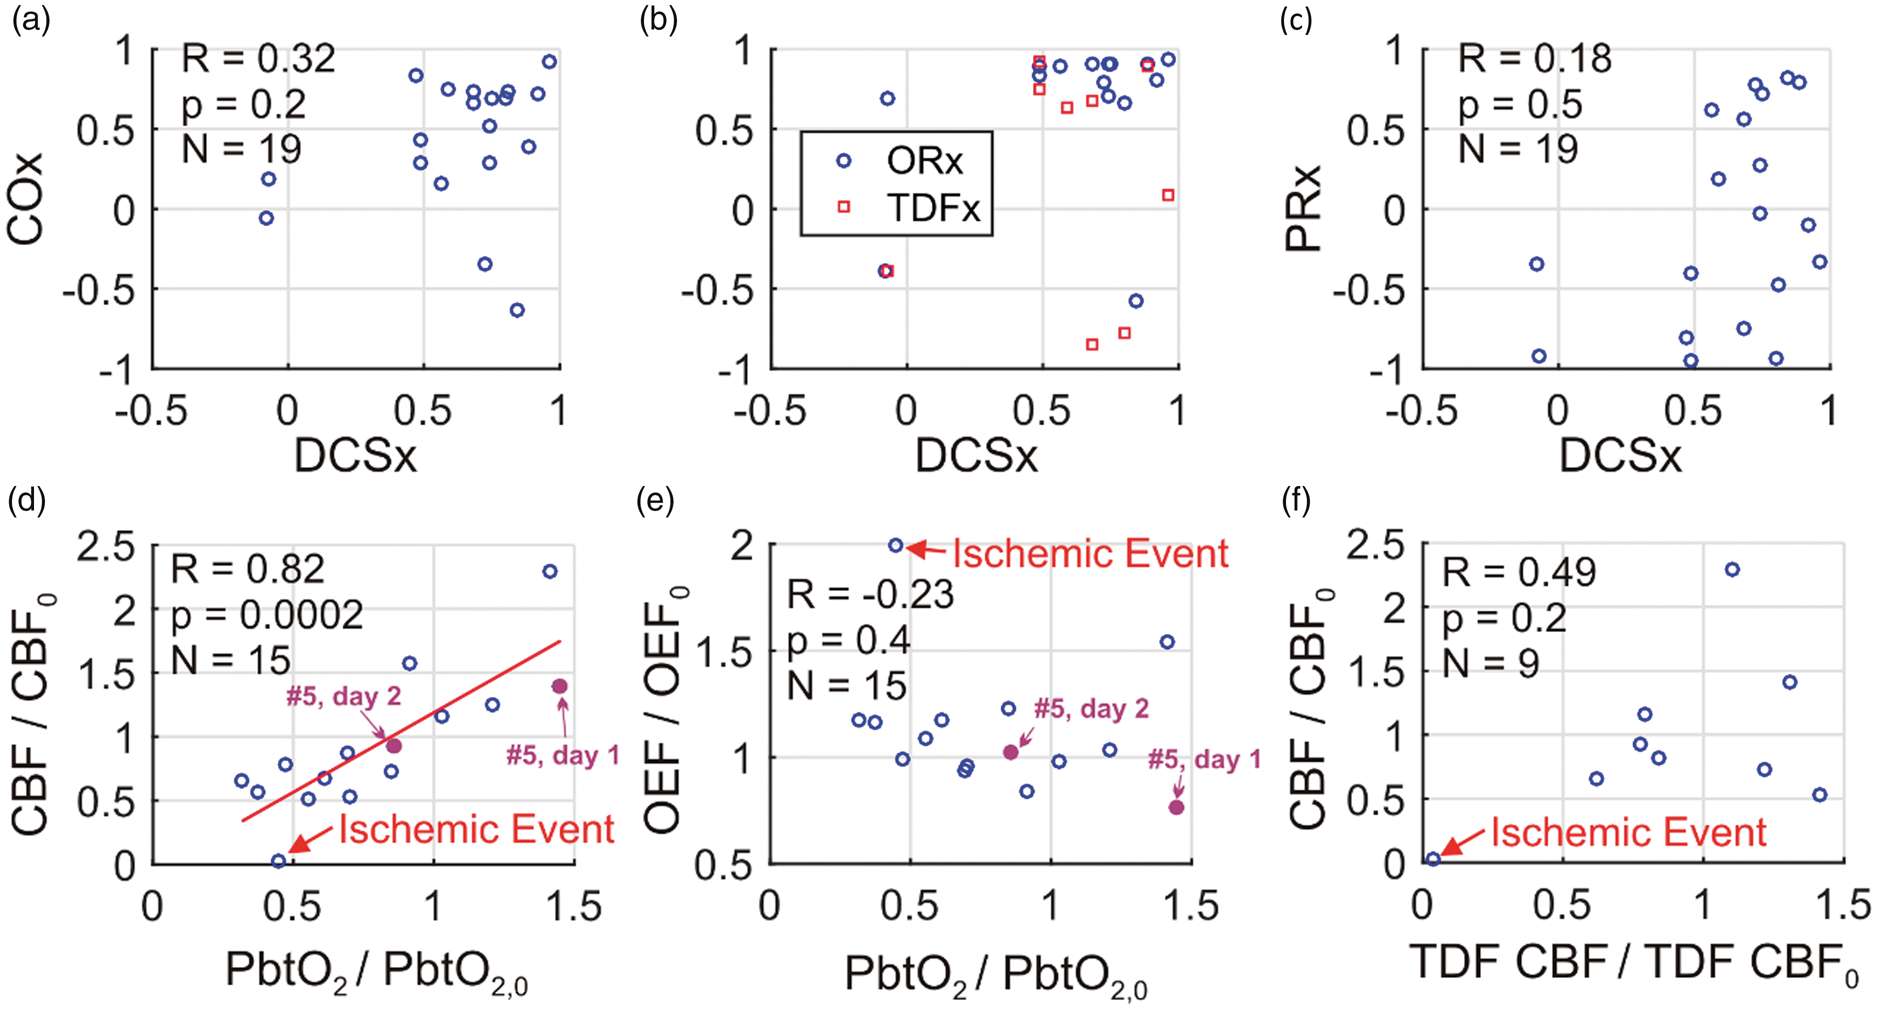
Steady-state changes in CBF (measured by both NNOM and invasive TDF), OEF (measured by NNOM), and PbtO2 were also calculated between 6-min averages (mean) of temporally stable data acquired shortly after (e.g., vertical dashed lines in Figure 4(a),(b)) and shortly before (e.g., solid red lines in Figure 4(a),(b)) medication rate adjustments. The steady-state NNOM CBF changes were strongly correlated with PbtO2 changes (R = 0.82, p = 0.0002; Figure 5(d)), which is consistent with prior work. 20 However, NNOM CBF changes were not significantly correlated with invasive TDF CBF changes (R = 0.49, p = 0.2; Figure 5(f)). In regards to brain oxygenation, steady-state changes in OEF measured with NNOM during the MAP challenges were not significantly correlated with PbtO2 changes (R = −0.23, p = 0.4; Figure 5(e)), which is also consistent with prior work. 20
Changes in CBF triggered by vasoactive medications were often, but not always, associated with perfusion-metabolism mismatches as well. OEF and CMRO2 increased significantly in five of the 12 cases in Figure 5 where NNOM CBF decreased; these observations suggest that ischemia is triggered by cerebral hypoperfusion. OEF and CMRO2 similarly increased for two of the remaining seven episodes where NNOM CBF increased; these observations suggest that relative ischemia arises from cerebral hypermetabolism. These CMRO2 increases are associated with increasing norepinephrine infusion rates and may be indicative of drug-mediated neuroactivation facilitated by a disrupted BBB. 61
Discussion
In this study, we demonstrate the clinical promise of continuously and concurrently measuring changes in CBF, StO2, and CMRO2 in critically ill brain injured patients by combining DCS with TR-NIRS into a single NNOM. Along with combining DCS and TR-NIRS, we utilized a two-layer head model to filter superficial tissue contamination in relative StO2 and CBF data. NNOM enabled combined measurements of CA (e.g., Figures 4 and 5) with the unambiguous identification of mismatches between cerebral perfusion and metabolism (e.g., Figures 2 and 3). NNOM further uniquely revealed the type of processes triggering the mismatch (e.g., low oxygen delivery, high oxygen demand), which is relevant for optimal clinical decision-making. Importantly, the identified episodes of metabolism/perfusion mismatch were not detected by any of the other methods of monitoring used clinically in our patient cohort.
Identification of cerebral perfusion/metabolism mismatches
Prevention of delayed secondary brain injury, which is caused in large part by mismatches between CBF and metabolic demand, remains a fundamental goal of neurocritical care. Metabolism/perfusion mismatches occur both when demand exceeds perfusion (ischemia) and when perfusion exceeds demand (hyperemia), and these effects are magnified by impairments in CA and neurovascular coupling that occur as a consequence of the initial insult. The deleterious consequences of both ischemia and hyperemia are underscored by population-based studies showing that mortality increases when blood pressure is maintained below the autoregulatory limit, while rates of severe disability and clinically significant hemorrhage increase if blood pressure exceeds the limits of autoregulation. 62 – 64
Individualized titration of cerebral perfusion to the metabolic needs of the injured brain could therefore markedly improve outcome after brain injury. The complementary information provided by NNOM reduces ambiguities that arise from isolated CBF and cerebral oxygenation measurements alone.33,35 For example, low StO2 measured by commercial NIRS oximeters could correspond to abnormally low oxygen delivery (e.g., ischemia) or abnormally high oxygen demand (e.g., seizure). In addition, a tissue volume with normal StO2 could be healthy, or it could also reflect decreased metabolic activity arising from impaired oxygen delivery or pathologic changes in the venous admixture. Changes in CBF can be similarly confounded by sedation (such that CBF is reduced to compensate for decreased metabolic activity) or high metabolic demand (where increased CBF may not match increases in cerebral metabolism).
By measuring CBF and StO2 simultaneously, we successfully distinguished between ischemic conditions that arose from decreases in oxygen delivery and from increases in oxygen demand (Figure 2). We further detected potentially deleterious hyperemia that occurred in the setting of a rapid reduction in ICP (Figure 3). Importantly, these conditions would not have been identified without the combined information about CBF and StO2 provided by the NNOM. Although invasive neuromonitoring did identify physiological distress during these episodes (e.g., reduced PbtO2, increasing LPR), the invasive data were unable to categorize the type of process that triggered these abnormalities. Obtaining such information will be crucial to inform appropriate treatment choices, and we envision the NNOM will become a useful clinical tool in neurocritical care for rapid, non-invasive identification of ischemia.
We note that the two-layer head model utilized herein was important for quantitative accuracy of the magnitude of the NNOM changes. The NNOM trends derived from applying the homogeneous semi-infinite model to the long separation data were consistent with the two-layer results, but the magnitudes of the changes were substantially different (see Supplementary material).
Utility of relative NNOM data
Our observations are based on relative changes in NNOM parameters, which can be valuable for detecting abrupt changes in patient status. We noted several situations in Table S1 of the Supplementary material wherein relative NNOM data may be clinically helpful. Moreover, current research suggests that a single indocyanine green (ICG) bolus injection may enable calibration of the NNOM system and thereafter facilitate continuous monitoring of absolute CBF and CMRO2.45,65,66
Non-invasive CA measurements
We also measured CA by calculating the correlation between changes in CBF and MAP. Measurement of cerebral autoregulatory state may help clinicians titrate hemodynamic targets after brain injury (so that blood pressures are kept in a range where CA is optimally preserved 67 ), and also may aid in neuroprognostication (since the degree of autoregulation failure is a robust predictor of outcome after severe brain injury).10,55,68– 70 In our study, we assessed autoregulation during episodes where blood pressure changed in the setting of vasoactive medication dosage titrations. The ability to continuously measure changes in CBF should also allow longitudinal assessments of CA changes over time by computing correlations between CBF and spontaneous blood pressure fluctuations. Similar continuously updated indices of autoregulation have been constructed by measuring correlations between ICP, PbtO2, StO2, and TCD based measurements of flow velocity,10,55,57,68– 70 and a very recent paper demonstrated the potential utility of DCS to continuously measure CA in the ICU. 36
Our results are consistent with this latter paper’s findings of impaired CA in most patients (Figure 5). In an interesting case example, we further used DCS to show longitudinal improvement in CA (Figure 4) in a patient who ultimately recovered consciousness. Since DCS directly measures CBF, the DCSx index has potential to be a more sensitive and accurate non-invasive assessment of CA than other proposed CA assessments relying on CBF proxies (e.g., PbtO2, StO2, TCD). In aggregate, the conclusions about CA assessed by DCSx, ORx, COx, and TDFx were consistent (Figure 5), but substantial variability between the DCSx index and other indices of CA across subjects was observed (Figure 5). We also observed discrepancies between CBF-based CA indices and the PRx. Future work is needed to more fully compare these indices, and relate them to neurological outcome.
Agreement with invasive absolute CBF and oxygenation measurements
Across all patient data wherein TDF/DCS and PbtO2/StO2/DCS results were concurrently obtained, our non-invasive absolute CBF and StO2 measurements correlated poorly with absolute invasive CBF and brain oxygenation measures, respectively. While initially surprising, multiple explanations for this finding are readily evident.
First, because invasive and non-invasive CBF measurements interrogate different vascular beds (white matter for invasive TDF, and cortex for DCS), fluctuations in blood flow measured by these two probes need not closely track one another. In a similar vein, the spatiotemporal patterns of CBF can vary markedly across hemispheres; this issue is especially relevant for the subgroup of patients for whom it was necessary to place the NNOM probe on the hemisphere opposite to that of the bolt (see Table 2).
Second, TDF measurements have been reported to drift significantly over time, requiring frequent recalibration.18,19 This pronounced drift, which we also observed in the present investigation, can significantly degrade the overall correlation between TDF CBF and other measurements of CBF.
Third, in general the DCS measurements are sensitive to confounding factors such as scalp blood flow contamination, errors in tissue optical property measurements, motion artifacts, and changes in scalp/skull thickness due to differences in probe pressure and probe location that arise during prolonged monitoring.36,45,51,71,72 We ameliorated the first confounder by using a two-layer head model to filter extra-cerebral artifacts, but our analysis is still sensitive to the other confounders that need to be addressed in future work. For example, to reduce cross talk between unknown fitting parameters, the present analysis assumed constant tissue scattering to compute differential changes. Although this assumption is often reasonable, 73 it can lead to errors if tissue structure substantially changes (e.g., edema). For the case examples reported in this work, however, the temporal variations of tissue reduced scattering, obtained by fitting TR-NIRS measurements with the long-separation source-detector data with the homogeneous semi-infinite tissue model, were less than 5%. Another confounder is heterogeneous tissue optical properties. The present analysis uses tissue optical properties obtained from nonlinear fit of the baseline TR-NIRS signal to the semi-infinite homogeneous solution of the photon diffusion equation in order to estimate cerebral and extra-cerebral tissue sensitivity factors (see Supplementary material). Errors in these estimated sensitivity factors that arise from heterogeneous tissue optical properties will translate to smaller errors in hemodynamic changes that do not change the conclusions of the case examples (see Supplementary material). 73
Finally, because PbtO2 measurements exhibit a complex dependence on both cerebral perfusion and the arteriovenous gradient in free oxygen tension,20,74 both CBF and StO2 measurements would be expected to correlate poorly with PbtO2 over long measurement periods. Indeed, prior work from our group and from others show weak, if any, correlation between brain oxygen saturation and PbtO2 measurements.37,75,76
Despite the poor correlations between absolute non-invasive and invasive measurements over long time scales, we nevertheless demonstrated the ability of NNOM to provide physiologically meaningful data during blood pressure manipulations and other clinical events that were concordant with invasive monitoring. These data provide pilot validation of NNOM’s ability to detect ischemic conditions and ischemic risk factors (i.e., impaired CA), and further builds upon our initial analysis suggesting that DCS CBF measurements can detect brain hypoxia identified by PbtO2. 37 Moreover, some of our observations suggest that decisions based on systemic variables alone may produce deleterious intracranial results (e.g., blood pressure lowering example in Figure 2(a)).
Prolonged monitoring in the ICU
Physiological monitoring in the intensive care unit (ICU) presents unique challenges due to the presence of numerous other monitors that can interfere with measurement fidelity, as well as artifacts caused by patient agitation, nursing care, bedside procedures, and transport to and from other diagnostic/imaging studies. As demonstrated by our group and others,36,38,45,77,78,79– 87 diffuse optics is well-suited for continuous, long-term monitoring of patients. Accordingly, we were able to perform continuous stretches of optical monitoring for several hours/day in all our patients. The length of these monitoring sessions was not limited by technical issues, but rather only by the need to have research staff present. Thus, we foresee straightforward translation to monitoring that can be performed continuously for days.
Limitations and future directions
Our study has several limitations. Because of the small sample number and study design, we were constrained in our analysis to retrospectively focus on specific episodes of clinical interest that were marked for further review during the monitoring sessions. Future work investigating pre-specified outcome-measures in larger cohorts with specific types of brain injury (e.g., accurate detection of delayed cerebral ischemia after aneurysm rupture, or detection of hyperemic states after endovascular thrombectomy for ischemic stroke) will be required before translation to routine clinical use. Nevertheless, we identified clear instances of impaired autoregulation and perfusion/metabolism failure that have immediate clinical implications. Moreover, we have recently reported the capability of NNOM DCS monitoring to detect brain hypoxia based on PbtO2. 37
The poor overall correlation between our absolute optical and invasive CBF and oxygenation measures may be due in to the challenges of absolute CBF monitoring with DCS. Although assessment of relative changes in cerebrovascular physiology with diffuse optics is robust, reliable absolute CBF measurements with DCS are needed for comparisons of optical CBF and CMRO2 indices across multiple patients, between hemispheres in a single patient, and across multiple monitoring sessions. A potential solution is to calibrate DCS with an absolute CBF measurement obtained from a dynamic contrast enhanced NIRS approach that tracks the passage of an intravenously injected NIR absorbable dye (indocyanine green) through cerebral tissue.45,65,66,72,79 Combining this approach with TR-NIRS-based oxygen saturation measurements may allow continuous non-invasive absolute CMRO2 measurements in the future. Further work will be required, however, to validate these methods with existing gold standards such as positron emission tomography. Once validated, absolute thresholds for both ischemia (defined by excess CMRO2 relative to CBF) and hyperemia (defined by excess CBF relative to CMRO2) can be defined for clinical use.
Conclusion
We utilized simultaneous, continuous optical measurements of CBF and CMRO2 changes to non-invasively detect deleterious mismatches between cerebral perfusion and oxygen metabolism (3 events) that spontaneously arose in patients with severe acute brain injury. These mismatches were concordant with physiological distress indicated by invasive neuromonitoring. In addition, the optical CBF and CMRO2 data, in combination, uniquely revealed the type of process triggering the mismatch (e.g., abnormally low oxygen delivery, abnormally high oxygen demand). Less severe mismatches between perfusion and metabolism were further detected in events (6 events) associated with vasoactive medication changes. Finally, we demonstrated the ability to perform non-invasive, longitudinal assessments of CA (19 events) based on optical CBF measurements.
Supplemental Material
Supplemental material for Continuous non-invasive optical monitoring of cerebral blood flow and oxidative metabolism after acute brain injury
Supplemental Material for Continuous non-invasive optical monitoring of cerebral blood flow and oxidative metabolism after acute brain injury by Wesley B Baker, Ramani Balu, Lian He, Venkaiah C Kavuri, David R Busch, Olivia Amendolia, Francis Quattrone, Suzanne Frangos, Eileen Maloney-Wilensky, Kenneth Abramson, Elizabeth Mahanna Gabrielli, Arjun G Yodh and W Andrew Kofke in Journal of Cerebral Blood Flow & Metabolism
Footnotes
Acknowledgments
We gratefully acknowledge Andre Liemert, who provided computer code in the MATLAB environment for numerically calculating the time-domain solution of the photon diffusion equation in two-layer turbid media. We also gratefully acknowledge Keith St Lawrence, Mamadou Diop, Daniel Milej, Turgut Durduran, Lin Wang, Tiffany Ko, Daniel Licht, Ashwin Parthasarathy, Rodrigo Forti, Rickson Mesquita, Diane Ayubcha, Michael Mullen, Christopher Favilla, Jeff Cochran, Karla Bergonzi, Joshua Levine, Monisha Kumar, and John Detre for valuable discussions.
Authors’ contributions
WB, RB, AY, and WK designed the study. WB, VK, and LH did the subject measurements, with assistance from OA, FQ, SF, and EMW. OA, FQ, SF, EMW, RB, and WK enrolled subjects and annotated their medications and clinical procedures during optical monitoring. VK, with input from WB and DB, designed and built the optical instrumentation. KA, with input from WB, VK, and DB, constructed the optical tissue probe. WB, with input from LH, VK, and RB, carried out the primary data analysis. RB and WB reviewed annotated clinical events to identify episodes for further analysis. RB reviewed clinical head CTs for patients for radiologic grading. RB, with input from EMG, and WK interpreted the clinical relevance and physiological meaning of the optical measurements. WB and RB wrote the manuscript with input from all other authors. Important editorial input, data analysis suggestions, instrument suggestions, and manuscript revisions were made by AY, WK, EMG, LH, and DB.
Funding
The author(s) disclosed receipt of the following financial support for the research, authorship, and/or publication of this article: This work is supported by the National Institutes of Health (grant numbers R01-NS082309-01A1, R01-NS060653, P41-EB015893).
Declaration of conflicting interests
The author(s) declared the following potential conflicts of interest with respect to the research, authorship, and/or publication of this article: DR Busch, WB Baker, and AG Yodh have two pending patent applications, and AG Yodh has two other patents relevant to this work (United States patents 8,082,015 and 6,076,010) but do not currently generate income.
Supplemental Material
Supplemental material for this article is available online.
References
Supplementary Material
Please find the following supplemental material available below.
For Open Access articles published under a Creative Commons License, all supplemental material carries the same license as the article it is associated with.
For non-Open Access articles published, all supplemental material carries a non-exclusive license, and permission requests for re-use of supplemental material or any part of supplemental material shall be sent directly to the copyright owner as specified in the copyright notice associated with the article.