
Abstract
Cerebral hyperperfusion syndrome (CHS) is a serious complication following carotid artery stenting (CAS), but definitive early prediction of CHS has not been established. Here, we evaluated whether indocyanine green kinetics and near-infrared spectroscopy (ICG-NIRS) with hyperventilation (HV) and the breath-holding (BH) test can predict hyperperfusion phenomenon after CAS. The blood flow index (BFI) ratio during HV and BH was prospectively monitored using ICG-NIRS in 66 patients scheduled to undergo CAS. Preoperative cerebrovascular reactivity (CVR) and the postoperative asymmetry index (AI) were also assessed with single-photon emission computed tomography before and after CAS and the correlation with the BFI HV/rest ratio, BFI BH/rest ratio was evaluated. Twelve cases (18%) showed hyperperfusion phenomenon, and one (1.5%) showed CHS after CAS. A significant linear correlation was observed between the BFI HV/rest ratio, BFI BH/rest ratio, and preoperative CVR. A significant linear correlation was observed between the BFI HV/rest ratio and postoperative AI (r = 0.674, P < 0.0001). A BFI HV/rest ratio of 0.88 or more was the optimal cut-off point to predict hyperperfusion phenomenon according to receiver operating characteristic curve analyses. HV and BH test under ICG-NIRS is a useful tool for detection of hyperperfusion phenomenon in patients who underwent CAS.
Keywords
Introduction
Cerebral hyperperfusion phenomenon is defined as a major increase in ipsilateral cerebral blood flow (CBF) following revascularization to treat carotid artery stenosis using carotid artery stenting (CAS) and carotid endoarterectomy (CEA). Cerebral hyperperfusion phenomenon is thought to involve chronically vasodilated intracranial vessels that lose their capacity to constrict in the presence of chronic cerebral ischemia; this phenomenon has been proposed to be the main mechanism of intracerebral hemorrhage after carotid revascularization.
Regional CBF (rCBF) can be measured with positron emission computed tomography (PET) and single-photon emission computed tomography (SPECT). CBF measurement is useful for predicting hyperperfusion phenomenon following CAS and CEA. 1 However, PET and SPECT are expensive, complicated, and time-consuming procedures. Magnetic resonance perfusion and CT perfusion represent an alternative to non-invasive CBF measurement, but these evaluations cannot be performed during CAS.2,3 Near-infrared spectroscopy (NIRS) is currently used to monitor frontal lobe regional cerebral O2 saturation following CAS and CEA. NIRS provides continuous measurement, including assessment of changes in the hemoglobin concentration and the tissue oxygen index. Moreover, NIRS has a high degree of sensitivity and specificity during carotid surgery.4,5
Animal studies measuring CBF with an intravenous bolus of indocyanine green (ICG) and NIRS have shown a high correlation between absolute blood flow measurements obtained with the radioactive microsphere technique and the cerebral blood flow index (BFI) and time to peak (TTP). Thus, BFI and TTP can be obtained noninvasively with ICG kinetics and NIRS (ICG-NIRS).6,7 Clinical studies have reported that ICG-NIRS detects perfusion reductions in acute ischemic stroke.8,9 Although a previous study demonstrated that ICG kinetics at rest by NIRS is useful for detection of hyperperfusion phenomenon, the correlation is lower than preoperative CVR of SPECT. 7
Some stimulus methods can be used to assess the vasoreactivity response of the cerebral circulation. Acetazolamide (ACZ), breath-holding (BH), and hyperventilation (HV) evoke a hemodynamic response that is related to the altered stimulus (metabolic regulation). Alterations in blood flow secondary to a vasodilatory stimulus can be used to estimate cerebrovascular reserve. ACZ is a cerebral vasodilator agent, and the ACZ challenge test is a useful and common clinical tool and a reliable predictor of clinically reduced perfusion. This test is thought to be useful for predicting cerebral hyperperfusion syndrome (CHS) following carotid revascularization. However, ACZ testing may lead to lightheadedness, and some patients are allergic to sulfonamide, leading to rare, life-threatening adverse reactions such as anaphylactic shock and pulmonary edema.10,11 HV and BH tests are easy to perform to assess cerebrovascular reactivity (CVR), and investigators have recently begun to use more physiologically relevant stimuli to assess cerebral vasoreactivity responses.
The aim of the present study was to evaluate whether the BFI changes calculated from a time-intensity curve from ICG-NIRS with the HV and BH test can predict hyperperfusion phenomenon and can be comparable to preoperative CVR by SPECT after CAS in patients with carotid artery stenosis.
Patients and methods
Inclusion criteria of patients
Between October 2014 and December 2016, all patients who underwent CAS for carotid artery stenosis at Nara Medical University were prospectively enrolled in the present study. The criteria used to select CAS included stenosis >80% for asymptomatic lesions or stenosis >50% for symptomatic lesions, as well as patients with a high risk of CEA in accordance with the Stenting and Angioplasty with Protection in Patients at High Risk for Endarterectomy (SAPPHIRE) criteria. 12 Patients who could not perform the HV and BH test before CAS treatment and patients with chronic pulmonary diseases, known significant coronary artery stenosis, BH-induced syncope, HV-induced seizures, tetania, and uncooperative patients for HV and BH were excluded. All patients underwent preoperative angiography to evaluate the degree of stenosis.
All procedures were performed under local anesthesia using a filter protection device. Dual-channel NIRS (NIRO-200NX, Hamamatsu Photonics, Japan) was used to measure cerebral oxygen saturation during and after the CAS procedure. The correlation between the BFI HV/rest ratio, BFI BH/rest ratio, TTP HV/rest ratio, or TTP BH/rest ratio and CVR before CAS and the asymmetry index (AI) after CAS was analyzed in all patients. These data were obtained from continuous NIRS monitoring and SPECT that was performed before and after the CAS procedure. All patients signed a written authorization allowing access to their medical records for research purposes, and the research protocols were approved by the institutional review board of Nara Medical University (No. 950), in accordance with the Helsinki Declaration of 1975. All patients were provided with an informed consent document that explained all of the CAS procedures.
HV and BH test protocol
The HV and BH protocol is illustrated in Figure 1. One day before the test, the procedure was explained to the subjects in detail to facilitate cooperation during the procedure. After 5 minutes of normal breathing, end-tidal CO2 (EtCO2) and blood gas CO2 (PaCO2) were determined, and ICG was injected. After a 10-minute interval in the resting state, voluntary HV was started with a frequency of 50 to 60 breaths per minute for 60 seconds. Immediately after stopping the HV procedure, EtCO2 and PaCO2 were determined, and ICG was injected. After a 10-minute rest after stopping the HV, BH was started and maintained for 40 to 50 seconds. Immediately after stopping the BH procedure, EtCO2 and PaCO2 were determined, and ICG was injected. BFI and TTP were calculated from the ICG time-intensity curve using N200NX ICG Analyze software after each procedure. Blood was taken from the Arterial catheter for determination of blood gas parameters (pH, PaCO2, PaO2, and SaO2). The measurements were performed using ABL800 FLEX (Radiometer, Tokyo, Japan) blood gas analyzer. EtCO2 was measured using CO2 analyzer (BSM-2303, Nihon Kohden, Tokyo, Japan) attached to a face mask.
Schematic drawing of the hyperventilation and breath-holding protocol. After 10 minutes of normal breathing at rest, the patient performed voluntary hyperventilation or breath-holding, EtCO2 and PaCO2 were determined, and ICG was injected. BFI and TTP were calculated from the ICG time-intensity curve with N200NX ICG Analyze software after each procedure.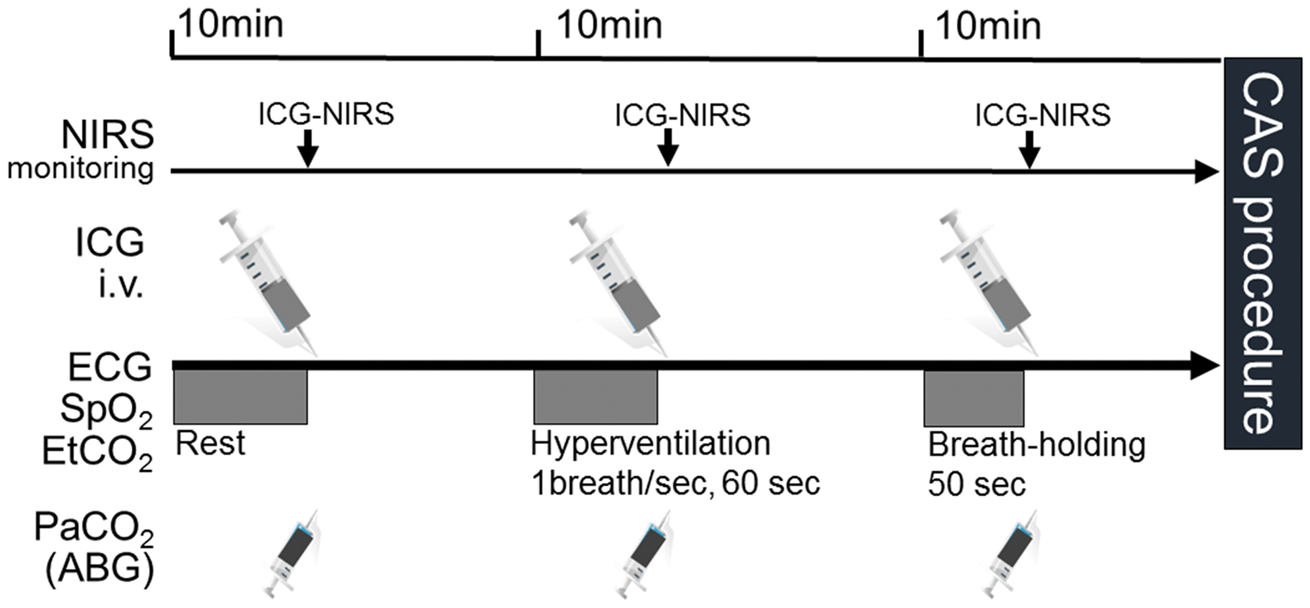
NIRS
A transcranial cerebral oximeter, NIRO-200NX, was used to monitor the oxygen parameters. After thorough cleaning of the patient’s skin, the sensors were bilaterally and symmetrically placed over the forehead according to the manufacturer’s instructions. The oximeter uses a method that combines the multi-distance measurements of optical attenuation. The underlying mathematical model is based on spatially resolved spectroscopy and the modified Beer-Lambert law. The NIRO-200NX generates three wavelengths (735, 810, 850 nm) of infrared light that are produced by a light-emitting diode. We used one laser diode for emission and two photodiodes for detection.
ICG-NIRS
ICG was injected rapidly into the central venous line at a mean dosage of 0.2 mg/kg body weight. Absolute concentration changes of ICG were calculated from light attenuation according to the modified Beer-Lambert law using specific software (Hamamatsu Photonics, Hamamatsu, Japan). We assessed the TTP (the time interval between 0% and 100% of the maximum signal), the maximum ICG concentration (µmol/l), the rise time (defined as the time between 10% and 90% of the ICG maximum), and BFI (maximum ΔICG/rise time). The intraindividual difference in ICG kinetics between the two hemispheres was also calculated. These parameters were semi-automatically calculated from the ICG time-intensity curve using N200NX ICG Analyze software (Hamamatsu Photonics). A typical measurement has been described previously. 7 We measured ICG kinetics before and after CAS. As BFI is a semiquantitative measure of CBF, BFI ratios were evaluated to detect intraindividual differences.8,9 The BFI HV/rest ratio was defined as BFI just after the HV test/BFI at rest before CAS, and the BFI BH/rest ratio was defined as BFI just after the BH test/BFI at rest before CAS. The TTP HV/rest ratio was defined as TTP just after the HV test/TTP at rest before CAS, and the TTP BH/rest ratio was defined as TTP just after the BH test/TTP at rest before CAS.
SPECT
All patients underwent SPECT using a rotating three-head gamma camera (GCA-9300A; Toshiba Medical Systems, Tochigi, Japan) before and after the procedure as perioperative management for CHS. CBF in the cerebral hemisphere was quantified using N-isopropyl-p-[123I]iodoamphetamine (IMP) SPECT within 2 weeks before and the day after the procedure. Details of the IMP SPECT study with ACZ challenge have been reported.13,14 The absolute CBF values were quantified with the microsphere method. An irregular, mirror-shaped region of interest was placed bilaterally in the entire cerebral cortex at the level of the parietal lobe, excluding any infarcts, and in the corresponding contralateral region.
Resting rCBF, CVR to ACZ challenge, and AI were quantitatively measured for the hemodynamic reserve. The resting rCBF control value obtained from 20 healthy volunteers (18 men and 2 women; aged 65 to 85 years old; mean age, 76.3 years old) was 30.6 ± 2.9 ml/100 g/min. A resting rCBF value lower than the mean + 2 SD (i.e. 24.8 ml/100 g/min) was defined as a decrease in resting rCBF. The CVR (%) was calculated as follows: (ACZ challenged rCBF in the affected cerebral hemisphere – resting rCBF in the affected territory)/resting rCBF in the affected territory ×100%. The control CVR value obtained from the same 20 healthy volunteers mentioned above was 50.4 ± 13.3%. A CVR value lower than the mean + 2 SD (i.e. 23.8%) was defined as reduced CVR. The AI (%) was calculated as the blood flow between the two cortical hemispheres by taking the ratio of rCBF of the affected to the unaffected hemisphere, excluding any ischemic/infarcted areas (rCBF in the affected cerebral hemisphere/rCBF in the mirror territory) ×100. The control AI value obtained from 12 healthy volunteers (11 men and 1 woman; aged 65 to 85 years old; mean age, 76.7 years old) was 102.1 ± 0.85%. According to the previous study, an AI value higher than the mean + 3 SD (i.e. 104.6%) was defined as an increase in AI.7,15 In the present study, hyperperfusion after CAS was defined as a rCBF increase of >4.6% compared with that on the normal side.
Interventional procedure
During the CAS procedure, which was performed under local anesthesia, intravenous heparin was used to maintain an activated clotting time of >275 seconds. An 8-Fr guiding catheter was first placed in the common carotid artery. After crossing the stenotic lesion with a guidewire, a filter-type embolic protection device (FilterWire EZ; Stryker, Kalamazoo, MI) was inserted distal to the stenotic lesion. Following pre-dilation of the lesion with a 3- or 4-mm diameter balloon, the stent (Carotid Wallstent; Stryker, or Precise; Johnson & Johnson, New Brunswick, NJ) was deployed. Using angioplasty balloons with diameters no greater than approximately 80% of the normal luminal diameter distal to the stenosis, conservative post-dilation was then performed. The procedure was monitored with intravascular sonography (Eagle Eye Gold: Volcano Corporation, San Diego, CA). At the end of the procedure, the embolic protection device was removed. During patient follow-up, all symptomatic ischemic events, hemorrhagic events within 30 days, and any abnormalities on magnetic resonance imaging (MRI) and diffusion-weighted imaging that occurred were recorded.
Clinical diagnosis of CHS
A diagnosis of CHS required the following: (1) Occurrence of headache, seizure, confusion, deterioration of consciousness level, and/or development of focal neurological signs such as motor weakness, (2) absence of any additional ischemic lesion on MRI performed the first postoperative day, and (3) a postoperative increase in rCBF in the ipsilateral hemisphere exceeding the flow in the contralateral hemisphere as measured using SPECT.
Data analysis and statistics
Measurements for each group are expressed as means ± standard deviation. Comparisons between two groups were assessed using the Mann–Whitney U test, Fisher’s exact test, ANOVA test, and Pearson’s correlation test. Differences were deemed statistically significant if P < 0.05. The diagnostic value of the BFI HV ratio was assessed by calculating the area under the receiver operating characteristic (ROC) curves for plot sensitivity versus 1-specificity for a range of results to determine the cut-off values for hyperperfusion phenomenon (postoperative AI > 104.6%).
Results
Study population
We enrolled and evaluated a total of 66 patients (59 males and 7 females; mean age, 73.8 years old, age range; 41–91 years old). The lesion characteristics including the average degree of stenosis and the rate of symptomatic lesions were 82.7 ± 11.3% and 52%, respectively. For CAS treatment, 98% of cases were treated with a closed-cell type stent, and 11% of all patients demonstrated a bright lesion on diffusion-weighted imaging a day after CAS. Each patient’s systolic blood pressure was strictly controlled between 100 and 140 mmHg before, during, and after CAS. No patients developed ischemic or hemorrhagic complications after CAS. The mean preoperative CVR and postoperative AI measured by 123I-IMP SPECT were 42.9 ± 26.0% and 100.8 ± 7.1%, respectively. The relationship between preoperative CVR and postoperative AI is shown in Figure 2. A significant linear correlation was observed between preoperative CVR and postoperative AI (r = −0.456, P < 0.001). Twelve cases (18%) showed hyperperfusion phenomenon (postoperative AI > 104.6%) after CAS, and one case (1.5%) showed CHS after CAS.
Preoperative cerebrovascular reactivity (CVR) and postoperative asymmetry index (AI) the day after stent placement. A CVR value lower than the mean + 2 SD (i.e. 23.8%) was defined as reduced CVR (vertical line), and an AI value higher than the mean + 3 SD (i.e. 104.6%) was defined as an increase in AI (horizontal line). The black closed circle indicates the patient with hyperperfusion syndrome, and the gray closed circles indicate patients with hyperperfusion phenomenon after CAS.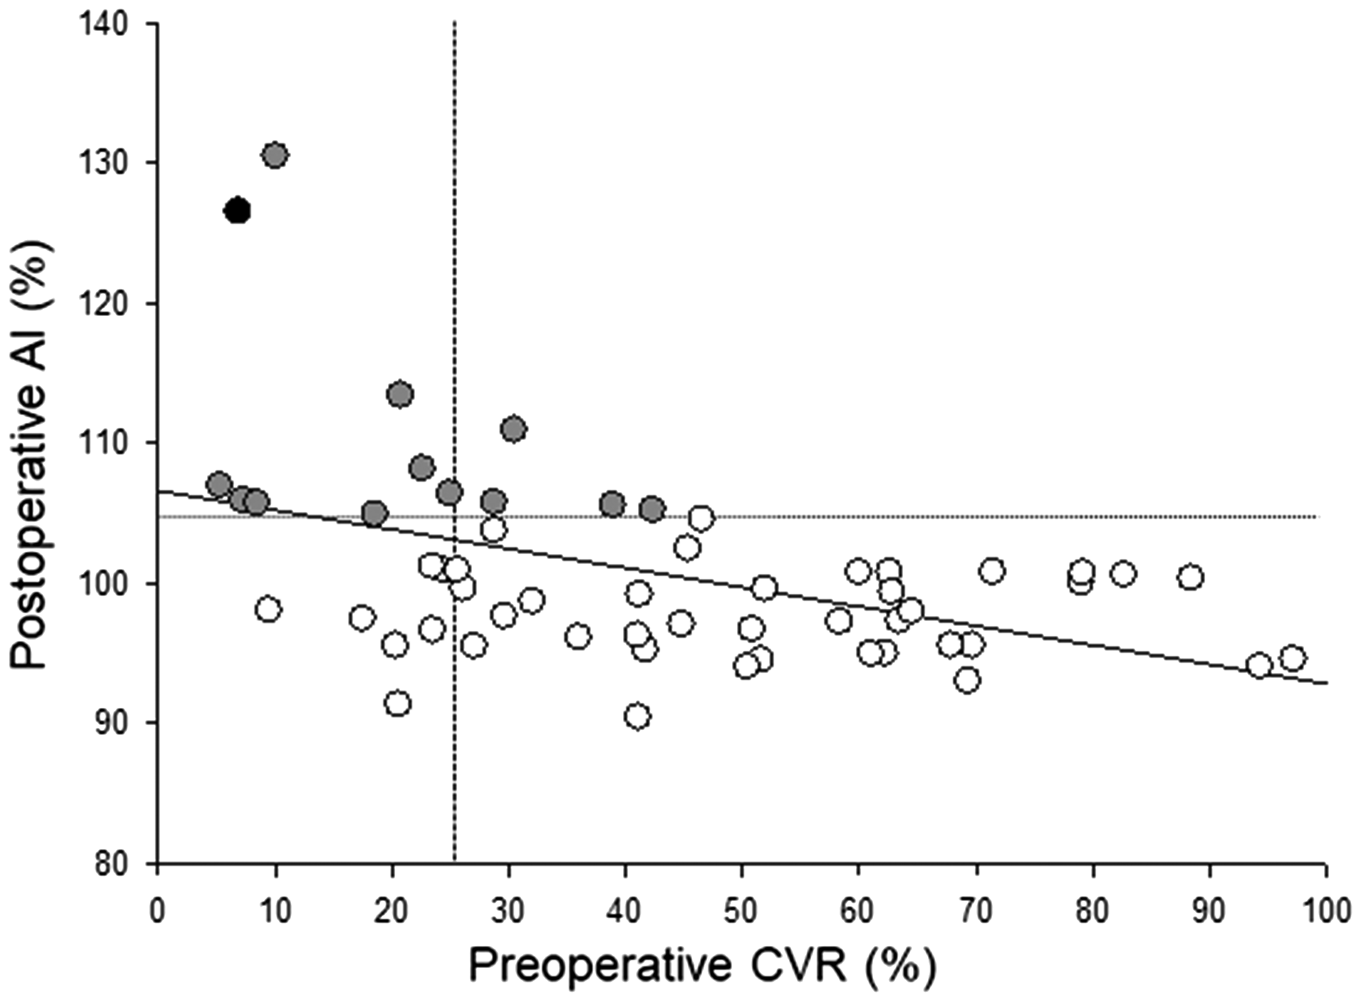
Changes in EtCO2 and PaCO2 at rest, after HV, and after BH
Hemodynamic and blood gas parameters at rest, after hyperventilation, and after breath-holding.
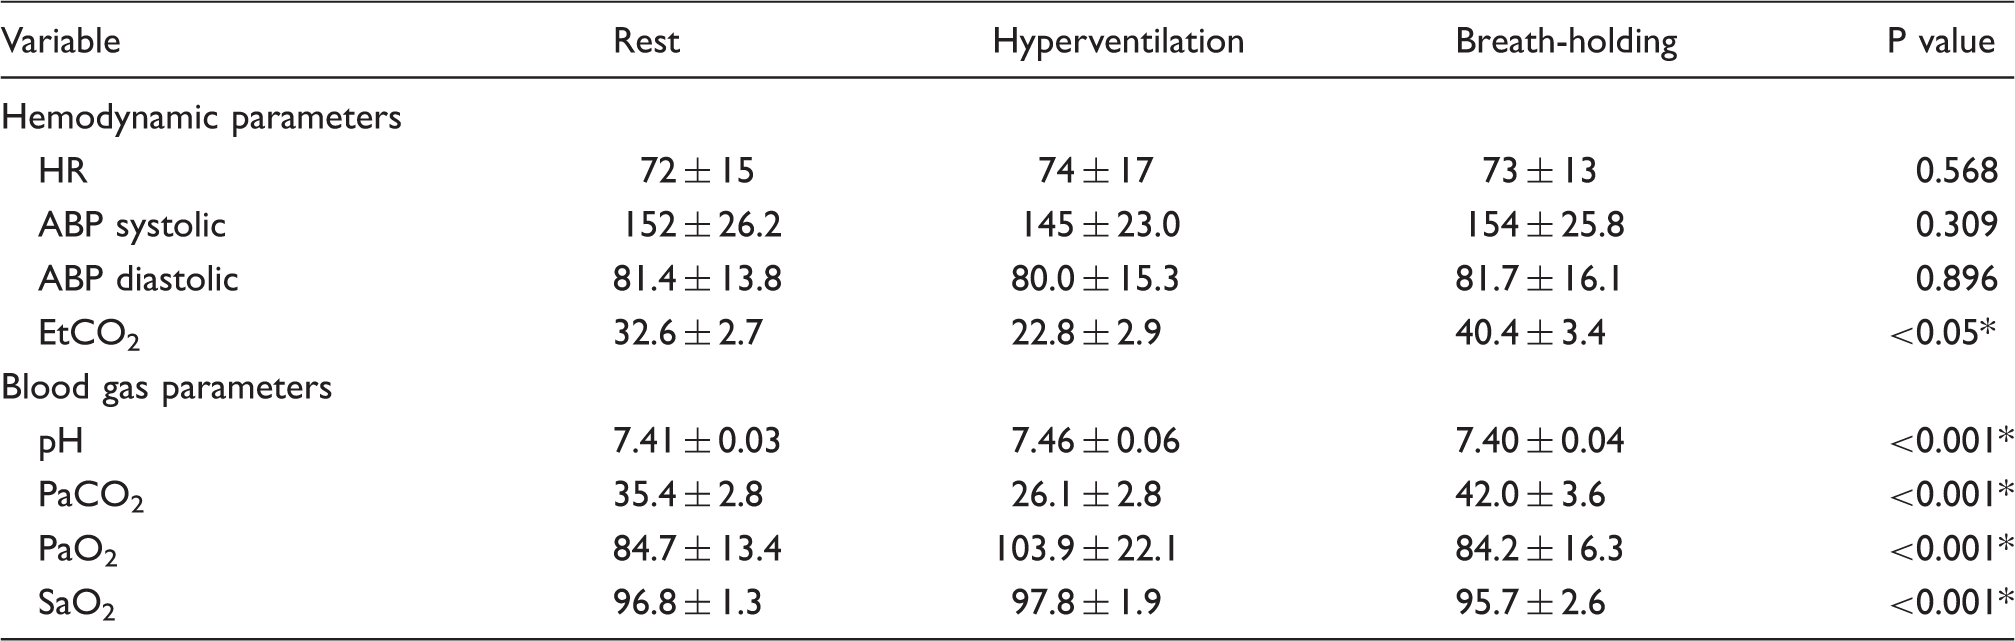
HR: heart rate; ABP: mean arterial blood pressure; EtCO2: end-tidal CO2.
p < 0.05.
Representative cases
Case 1 (non-CHS case): A 72-year-old male presented with asymptomatic left internal carotid artery stenosis. Preoperative digital subtraction angiography showed 80% stenosis with good cross flow via the anterior and posterior communicating arteries. Preoperative CVR was 69.3% in the ipsilateral hemisphere. The patient underwent left-side CAS under local anesthesia with NIRS monitoring. ICG-NIRS was performed according to the protocol. The BFI values were remarkably different at rest, HV, and BH (0.341, 0.282, and 0.394, respectively; Figure 3c–e). His postoperative course was uneventful, and 123I-IMP SPECT in the resting state 1 day after CAS demonstrated no hyperperfusion phenomenon (postoperative AI was 96.1%). MRI showed no additional ischemic lesions. He was discharged without any neurological deficits.
Typical changes in the ICG time-intensity curve and SPECT findings a patient with and a patient without CHS after the CAS procedure. In non-CHS case, preoperative 123I-IMP SPECT in the resting state showed no decrease in rCBF in the left hemisphere before (a) and one day after CAS (b). The time-intensity curve from ICG-NIRS monitoring at rest (c), just after hyperventilation (d), and just after breath-holding (e) in a patient without CHS. A remarkable change in the BFI calculated from the time-intensity curve just after hyperventilation and breath-holding was observed. In CHS case, preoperative 123I-IMP SPECT in the resting state showed a decrease in rCBF in the right hemisphere (f). One day after CAS, hyperperfusion was seen in the ipsilateral hemisphere (g). One week after CAS, hyperperfusion in the ipsilateral hemisphere had normalized (h). The time-intensity curve from ICG-NIRS monitoring at rest (i), just after hyperventilation (j), and just after breath-holding (k) in a patient with CHS. The BFI values were nearly unchanged during rest, hyperventilation, and breath-holding.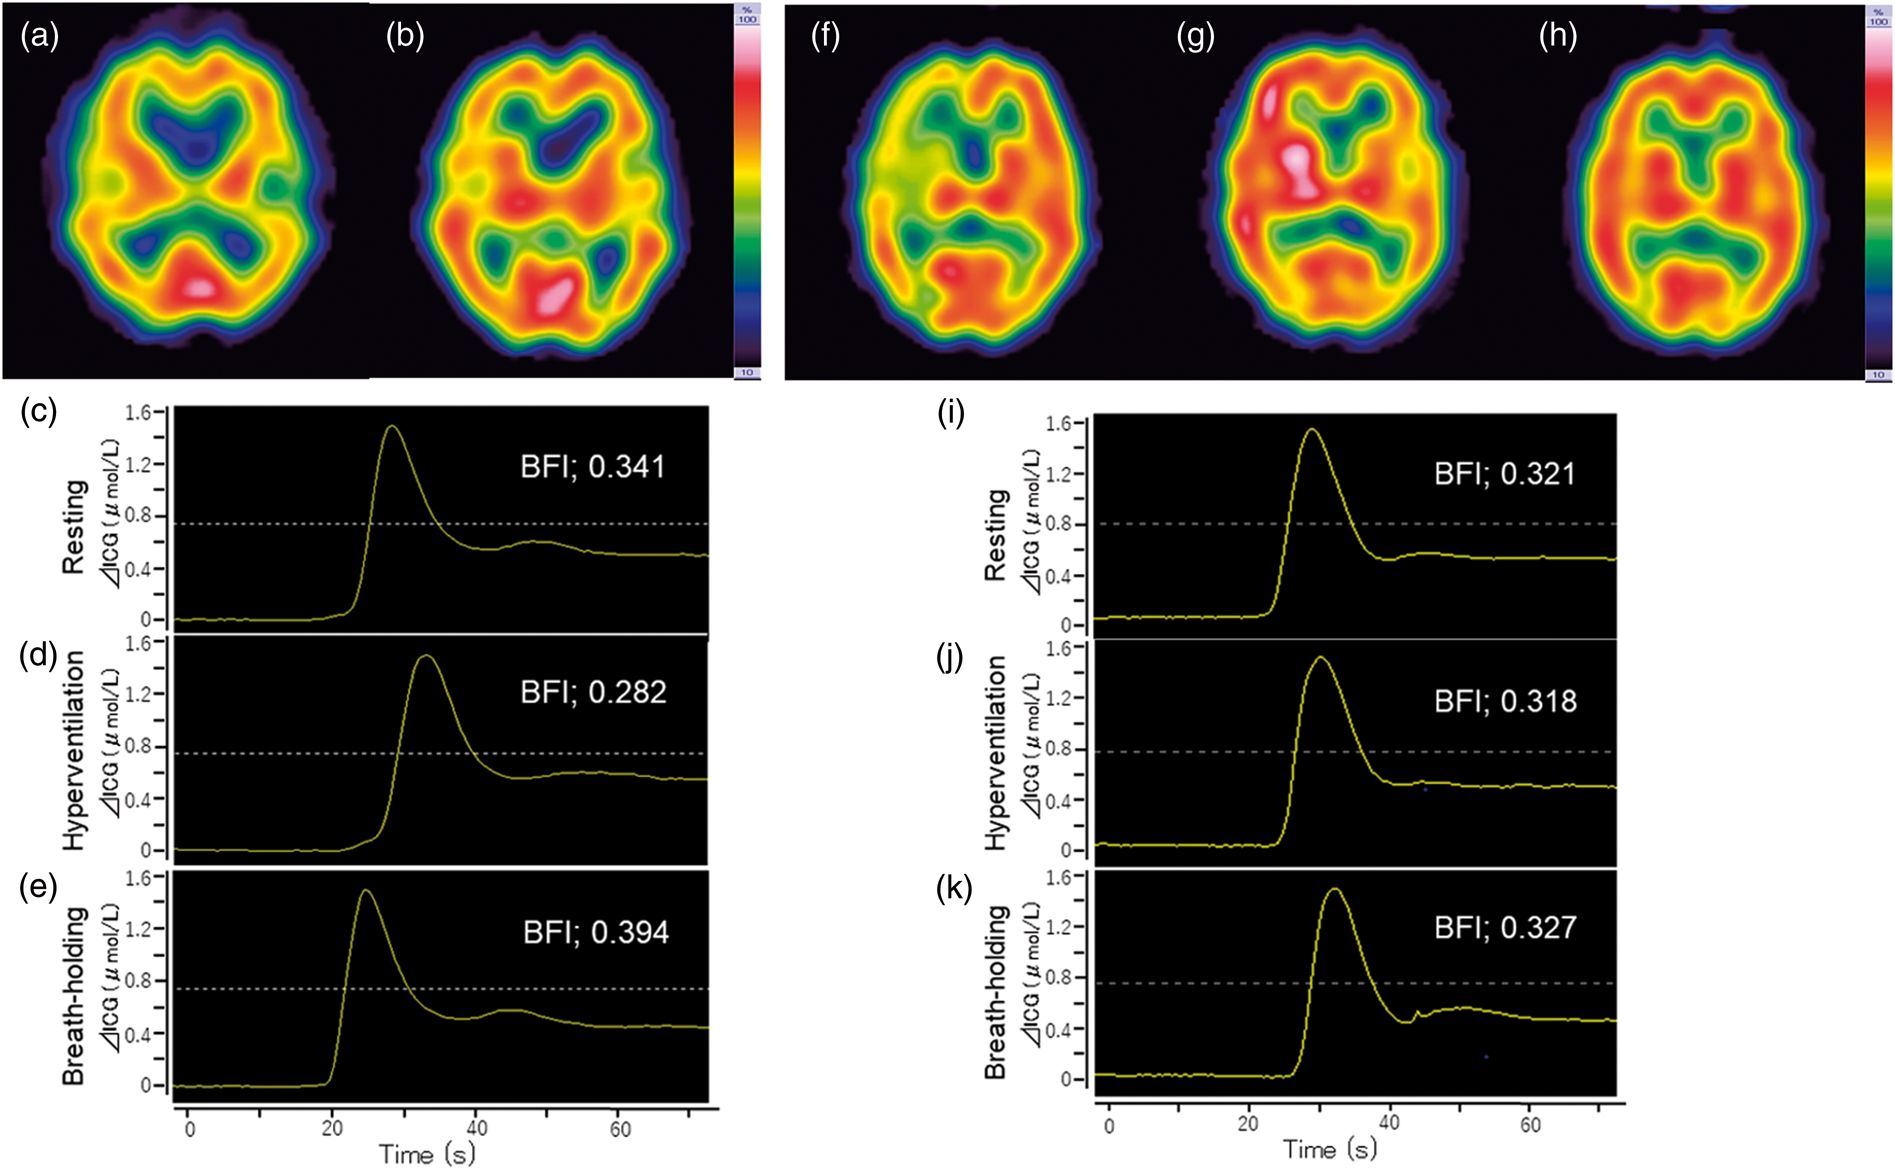
Case 2 (CHS case): A 72-year-old male presented with symptomatic right internal carotid artery stenosis. Preoperative digital subtraction angiography showed that the right internal carotid artery was nearly occluded, with no cross flow via the anterior and posterior communicating arteries. His preoperative CVR was 6.9% in the ipsilateral hemisphere. He underwent right-side CAS under local anesthesia with NIRS monitoring. ICG-NIRS was performed according to the protocol. The BFI values were nearly unchanged at rest, HV, and BH (0.321, 0.318, and 0.327, respectively; Figure 3i–k). One day after CAS, he suffered from a headache and confusion. 123I-IMP SPECT in the resting state demonstrated that the ipsilateral hemisphere rCBF was dramatically increased and exceeded the flow in the contralateral hemisphere (postoperative AI was 126.5%) (Figure 3g). MRI showed no additional ischemic lesions, and hence, he was diagnosed with postoperative CHS. The patient’s systolic blood pressure was strictly controlled between 100 and 120 mmHg, and sedation was induced with dexmedetomidine. Seven days after CAS, he recovered from the symptoms, and ipsilateral hemisphere rCBF in the resting state had normalized at the 1-week follow-up 123I-IMP SPECT (Figure 3h). He was discharged without any neurological deficits.
Relationship between CVR during HV/BH and the BFI ratio and TTP ratio
Comparison of ICG kinetics and SPECT parameters between Non-Hyperperfusion and Hyperperfusion group.
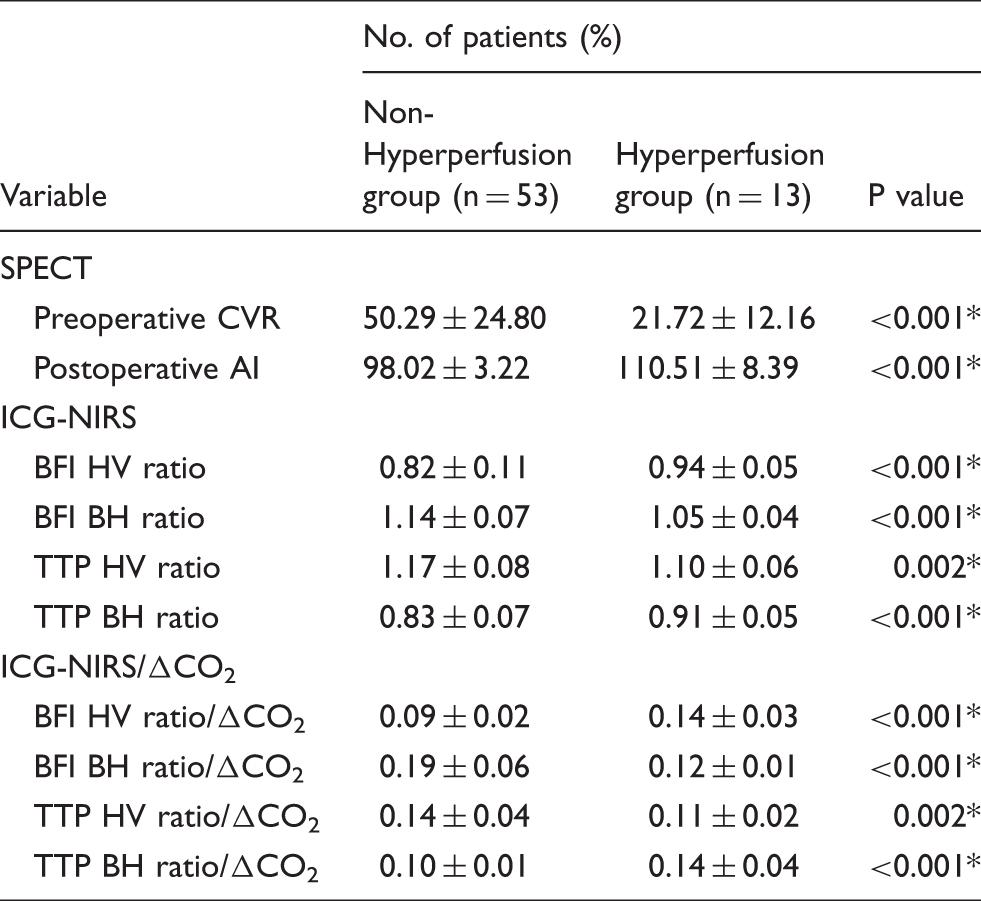
CVR: cerebrovascular reserve; AI: asymmetry index; BFI: blood flow index; HV: hyperventilation; BH: breath-holding; TTP: time to peak.
p < 0.05.
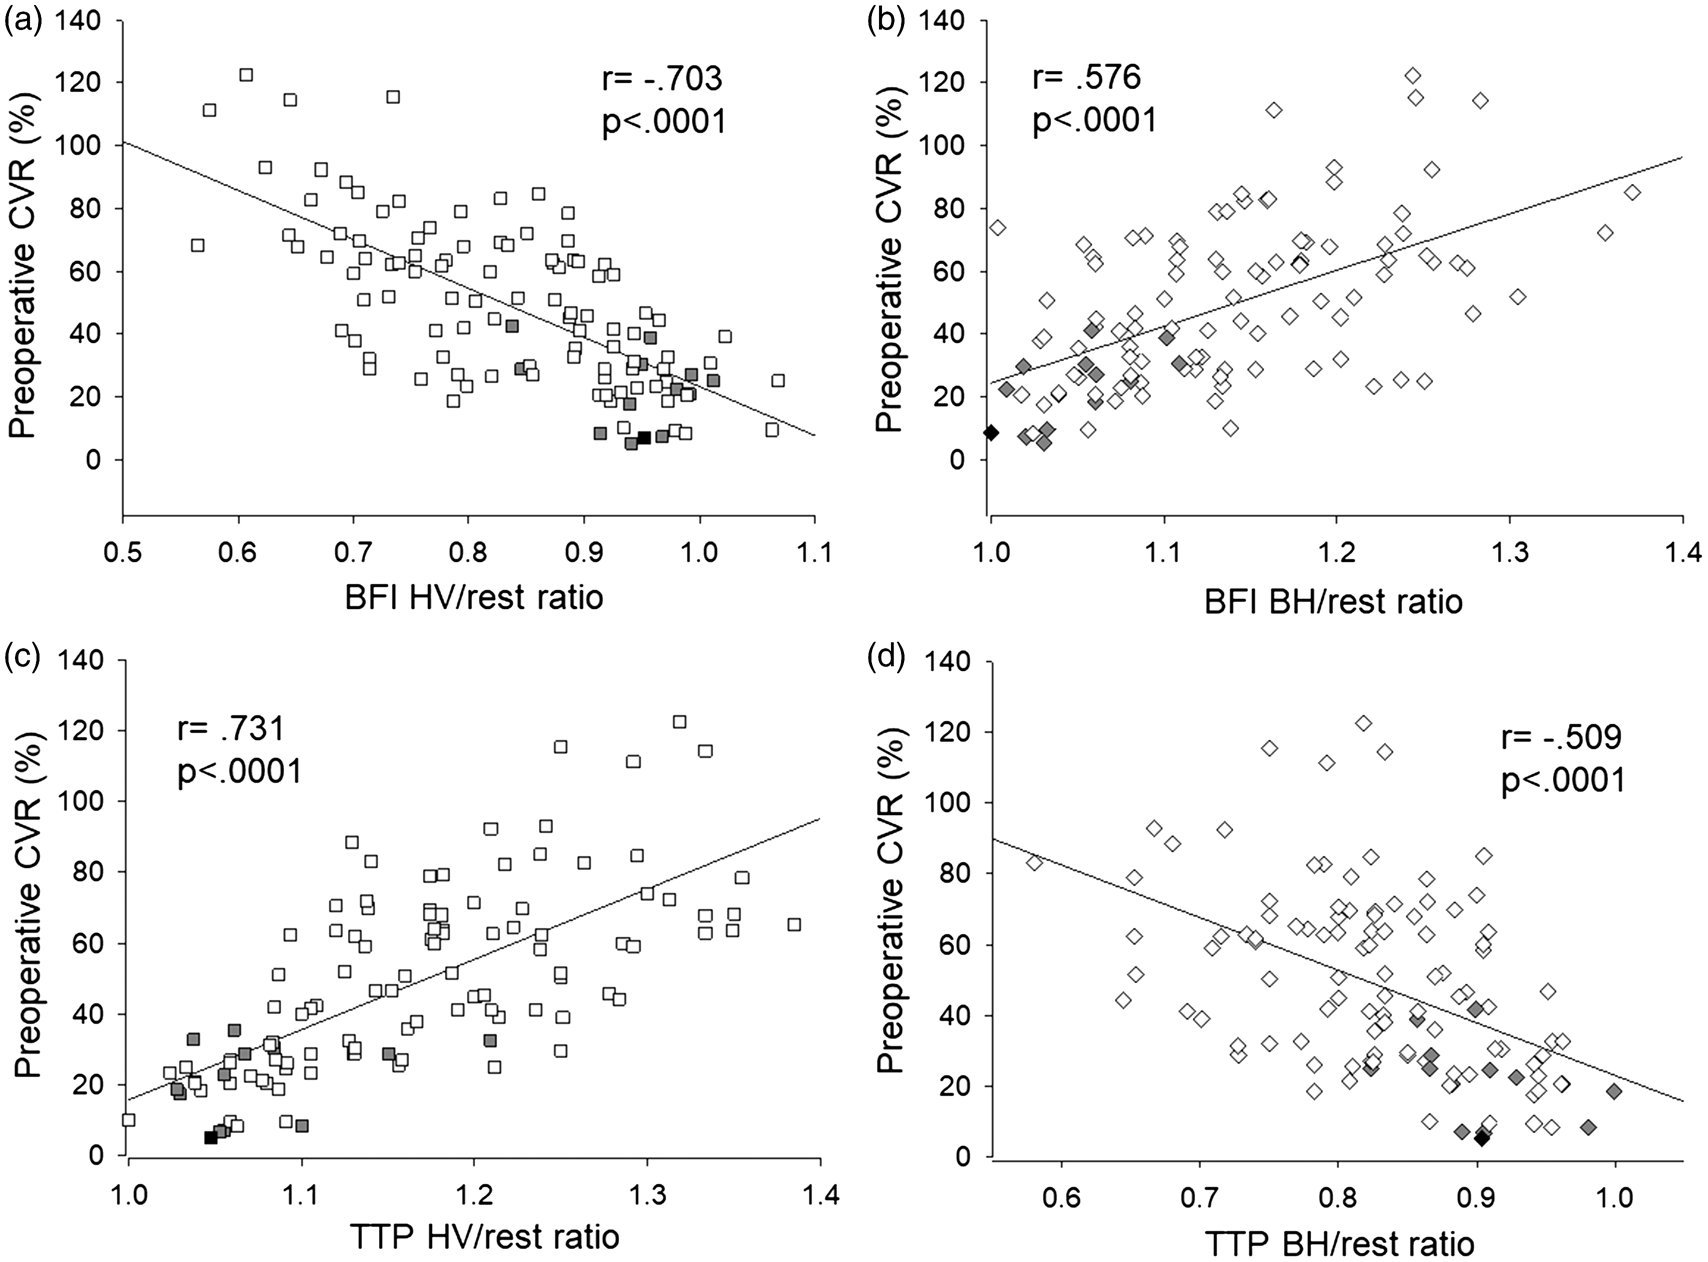
(a) The relationship between the BFI hyperventilation (HV)/rest ratio and preoperative cerebrovascular reactivity (CVR). (b) The relationship between the BFI breath-holding (BH)/rest ratio and preoperative CVR. A significant linear correlation was observed between the BFI HV/rest ratio and preoperative CVR, and between the BFI BH/rest ratio and preoperative CVR (r = −0.703 and 0.576, respectively P < 0.0001 for both). (c) The relationship between the TTP HV/rest ratio and preoperative CVR. (d) The relationship between the TTP BH/rest ratio and preoperative CVR. A significant linear correlation was observed between the TTP HV/rest ratio and preoperative CVR, and between the TTP BH/rest ratio and preoperative CVR (r = 0.731 and −0.509, respectively, P < 0.0001 for both). The black closed square indicates the patient with hyperperfusion syndrome, and the gray closed square indicates patients with the hyperperfusion phenomenon after CAS.
Relationship between the BFI HV/rest ratio and hyperperfusion phenomenon
Figure 5(a) shows the relationship between the BFI HV/rest ratio and postoperative AI. A significant linear correlation was observed between these parameters (r = 0.674, P < 0.0001). Figure 5(b) shows the relationship between the BFI BH/rest ratio and the postoperative AI. A significant linear correlation was observed between the BFI BH/rest ratio and postoperative AI (r = −0.413, P < 0.01). ROC curve analyses of the BFI HV/rest ratio, the BFI BH/rest ratio, and the preoperative CVR demonstrated that the BFI HV/rest ratio could be more useful to distinguish between patients with and without postoperative hyperperfusion phenomenon (area under the curve, 0.88, 0.85, 0.83; sensitivity, 0.83, 0.83, 0.83; specificity, 0.75, 0.73, 0.70; 95% confidence interval, 0.78–0.97, 0.74–0.96, 0.72–0.94; P < 0.0001, 0.0002, 0.0005, respectively) (Figure 5c). A BFI HV/rest ratio of 0.88 or more was the optimal cut-off point for predicting hyperperfusion phenomenon.
(a) The relationship between the BFI hyperventilation (HV)/rest ratio and the postoperative asymmetry index (AI). A significant linear correlation was observed between the BFI HV/rest ratio and postoperative AI (r = 0.674, P < 0.0001). (b) The relationship between the BFI breath-holding (BH)/rest ratio and the postoperative asymmetry index (AI). A significant linear correlation was observed between the BFI BH/rest ratio and postoperative AI (r = −0.413, P < 0.01). (c) Receiver operating characteristic (ROC) curves for the BFI HV/rest ratio, the BFI BH/rest ratio, and the preoperative CVR. The ROC curve suggested that a BFI HV/rest ratio of 0.88 or more was the optimal cut-off point for predicting hyperperfusion phenomenon (area under the curve, 0.88; sensitivity, 0.83; specificity, 0.75; 95% confidence interval, 0.78–0.97; P < 0.0001).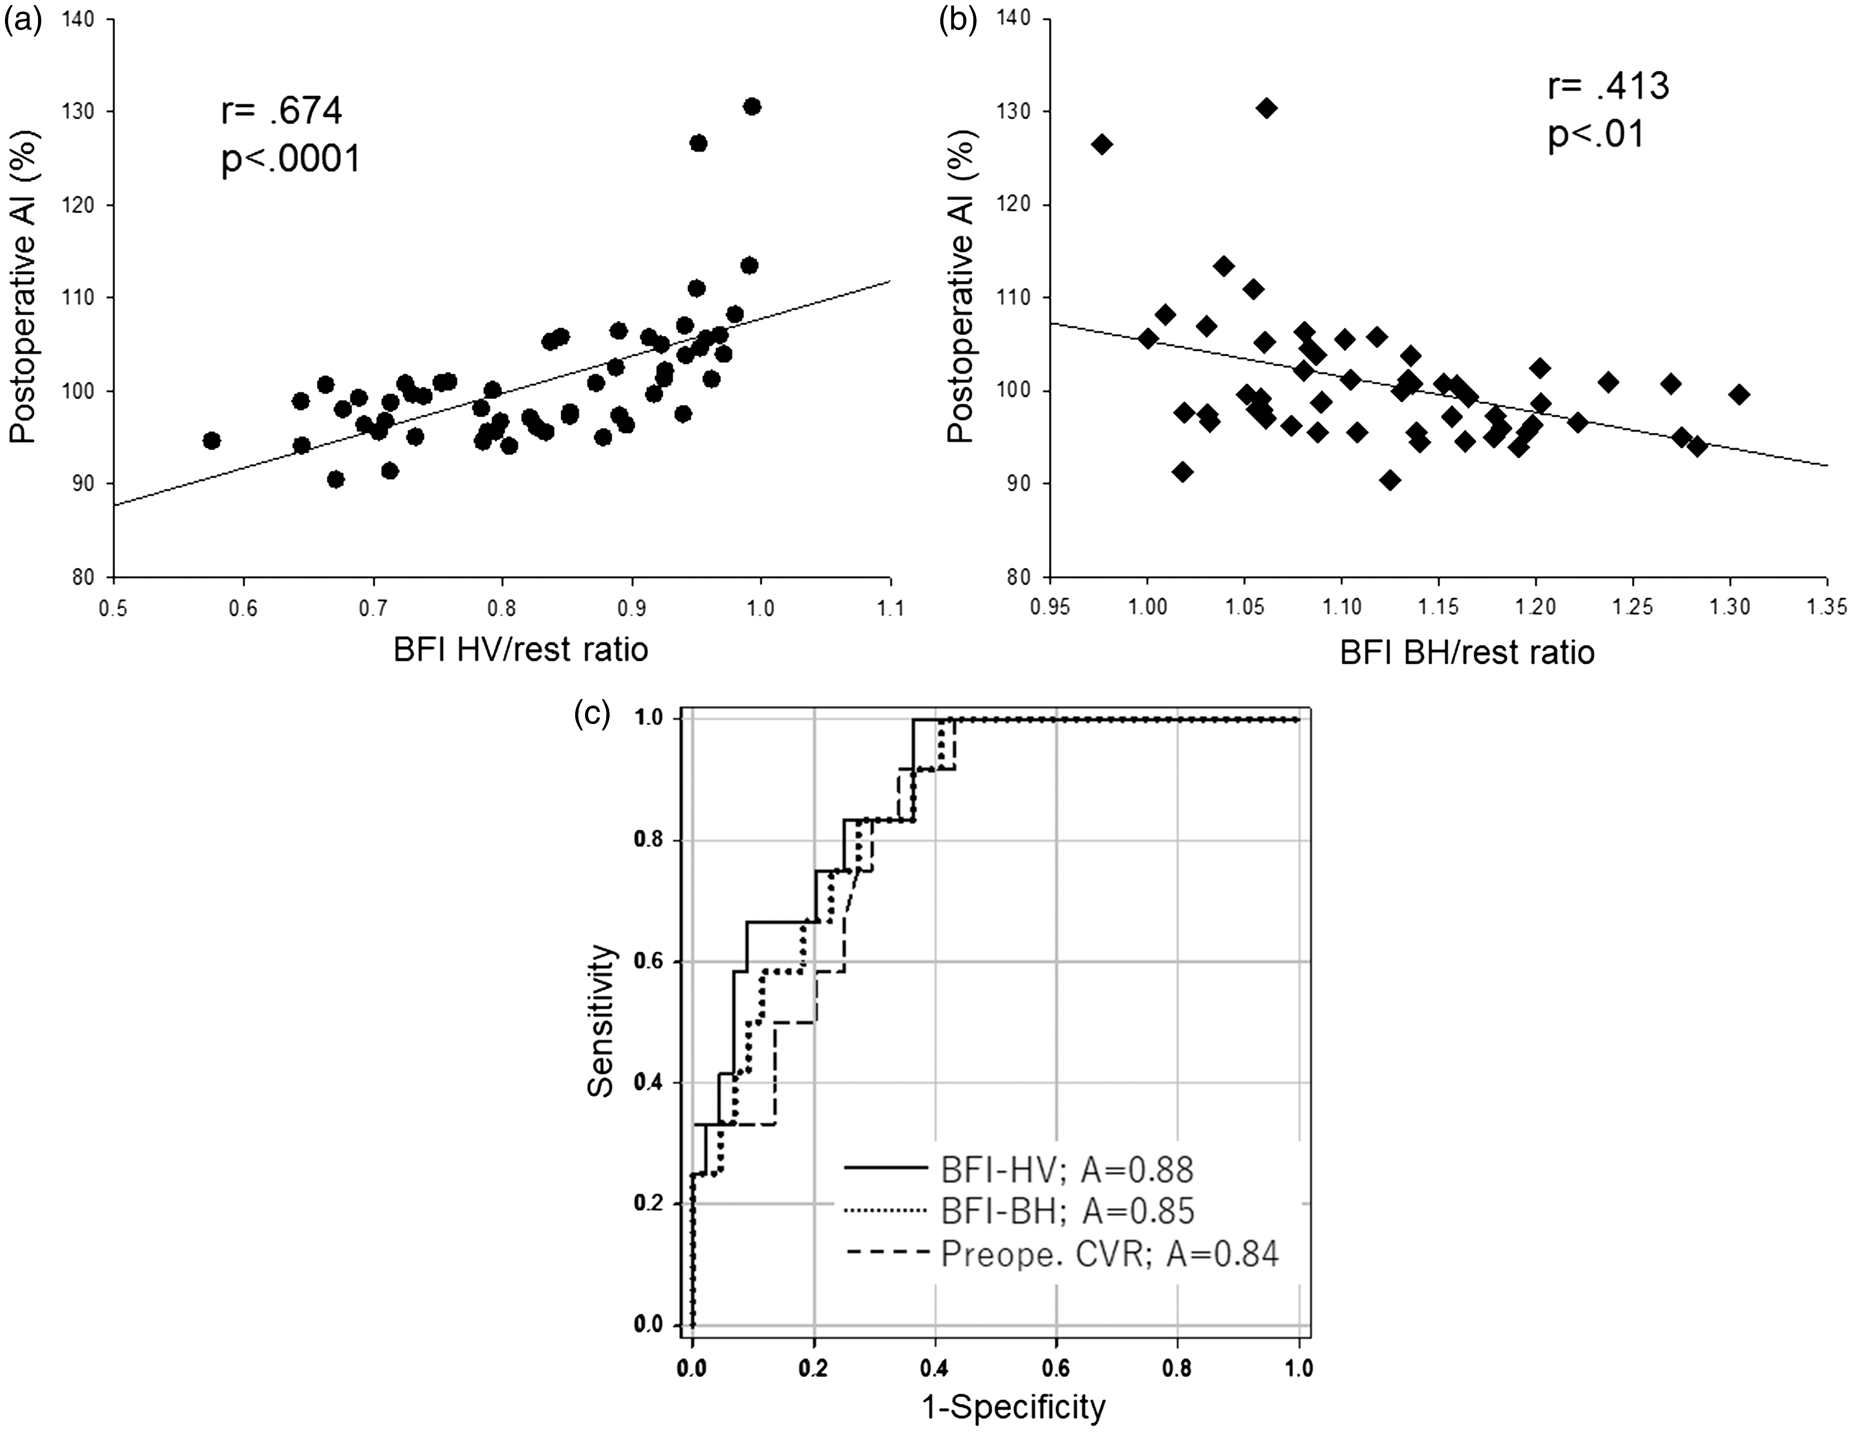
Discussion
In the present study, we demonstrated that the BFI, which was calculated from ICG-NIRS, changes during HV and showed significant linear relationships with not only preoperative CVR but also postoperative AI. Furthermore, a BFI HV/rest ratio of 0.88 or more was the optimal cut-off point for predicting hyperperfusion phenomenon. These results suggested that measurement of ICG kinetics with NIRS during HV is useful for detecting hyperperfusion phenomenon in patients who underwent CAS. The advantage of the evaluation of ICG kinetics with NIRS under HV or BH can be performed easily during CAS and can select appropriate treatment for preventing CHS such as more strict blood pressure control, sedation, and 2 staged CAS.
CHS after revascularization of carotid artery stenosis is rare, with the incidence reported to be 0.2% to 18.9%.16,17 CHS can lead to severe complications such as intracranial hemorrhage. Recent reports have demonstrated that CHS after CAS occurs earlier (within 12 hours) than CHS after CEA. Therefore, prediction and early treatment of patients at risk for CHS are essential, and assessment of the real-time situation with perioperative CAS is necessary. 18 PET and SPECT with ACZ challenge as the vasodilatory agent are the gold standard for evaluating cerebral hemodynamics.19,20 Several studies have shown that reduced preoperative CVR to ACZ is a significant predictor of hyperperfusion after CEA and CAS.1,20,21 Suga et al. observed post-CEA hyperperfusion in 12 (52%) of 23 patients with reduced preoperative CVR to ACZ, but in none of the patients with normal preoperative CVR (n = 67). 22 Buczek et al. reported that more patients with postoperative CHS had impaired CVR before the procedure compared with patients without postoperative CHS (63.6 vs. 26.5%); the sensitivity and specificity of CVR for CHS in this study were 63.6% and 73.5%, respectively. 21 Although SPECT and PET studies can accurately measure rCBF, they are expensive, complicated, and time-consuming. In contrast, NIRS is noninvasive, safe, and simple for measuring tissue oxygenation. NIRS is also advantageous because it can be used to continuously evaluate real-time changes in regional cerebral tissue oxygenation.4,23,24 However, NIRS can only be used to monitor the relative concentration of oxyhemoglobin and cannot be used to measure rCBF. Recently, ICG has been used with NIRS to measure rCBF,6,25 and several attempts to perform bedside monitoring to assess CBF by combining ICG and NIRS have been undertaken in neonates 26 and adults.8,27 BFI calculated from ICG-NIRS is significantly correlated with CBF in the cortex, 6 and ICG-NIRS monitoring will be suitable for detection of CHS in patients who underwent CAS. 7
Physiological stimuli for assessing CVR
In the present study, we evaluated the clinical applicability of CVR testing using HV and BH as vasodilatory and vasoconstriction stimuli, respectively, with ICG-NIRS monitoring. Doppler studies demonstrated that CBF velocity decreases after HV and increases after BH.28–31 Because these methods have not been completely standardized, we evaluated the changes in EtCO2 and PaCO2 during the protocol and confirmed significant changes in blood gas parameters (Table 1). ACZ and CO2 inhalation stimuli also evoke a hemodynamic response by the cerebral circulation.28,29,32 ACZ challenge is a reliable tool for assessment of the risk of CHS; however, it has a risk of complications such as anaphylactic shock, pulmonary edema, Stevens-Johnson syndrome, and even death.10,11,33 Therefore, limiting the use of ACZ for diagnostic purposes is necessary. CO2 inhalation as a stimulus may result in dyspnea and fear of death and should not be used in elderly patients with chronic lung disease. Indeed, physiological stimuli including voluntary HV and BH are also contraindicated in patients with chronic pulmonary disease, significant coronary artery stenosis, and HV-induced seizures. Therefore, in the present study, we excluded patients with these conditions, and we experienced no complications associated with HV or BH.
Hyperperfusion syndrome results from loss of normal vasoconstriction secondary to chronic cerebral ischemia and failure of normal autoregulatory mechanisms.34,35 Considering the pathophysiology of CHS, evaluation of HV-induced vasoconstriction compared with ACZ or BH-induced vasodilation may be more reasonable for assessing the risk of CHS after CAS.
The BFI HV/rest and BFI BH/rest ratios and postoperative hyperperfusion
The incidence of hyperperfusion phenomenon after CAS was 18% in the present study, and these results were consistent with previous reports.15,34 In addition, patients with elevated postoperative AI did not always show reduced CVR preoperatively in the present study (Figure 2). In addition to existing bilateral carotid steno-occlusive disease, an overestimation of elevated postoperative AI may occur because rCBF on the contralateral side would have been decreased before the ipsilateral revascularization. In contrast, a significant linear correlation was observed between the BFI HV/rest ratio and preoperative CVR (r = −0.703, P < 0.0001) in the present study (Figure 4a). Terborg et al. investigated cerebral perfusion values including BFI and TTP calculated from ICG-NIRS in patients with acute infarction in the territory of the middle cerebral artery and concluded that ICG-NIRS can detect a decrease in perfusion in patients with acute ischemic stroke.8,9 Furthermore, in our previous study, the BFI ratio showed a significant linear relationship with preoperative CVR (r = −0.568, P < 0.001). However, the BFI HV/rest ratio and the TTP HV/rest ratio showed higher linear relationships with preoperative CVR compared with the BFI BH/rest ratio and TTP BH/rest ratio. These results suggested that measurement of BFI and TTP changes during HV with ICG-NIRS will be suitable for detection of CHS in patients who underwent CAS.
Cut-off values for prediction of CHS
In the present study, ROC curve analyses demonstrated that the BFI HV/rest ratio could distinguish between patients with and without postoperative hyperperfusion phenomenon (area under the curve, 0.88; sensitivity, 0.83; specificity, 0.75; 95% confidence interval, 0.78–0.97; P < 0.0001). A BFI HV/rest ratio of 0.88 or more was the optimal cut-off point for predicting hyperperfusion phenomenon. Ohta et al. reported that a preoperative AI value ≤91.5% (sensitivity, 0.78; specificity, 0.80) and degree of stenosis ≥87% (sensitivity, 0.89; specificity, 0.89) were optimal cut-off values for predicting hyperperfusion phenomenon. 36 Yoshie et al. demonstrated that the absolute post-ACZ mean transit time value of ≥4.87 seconds for the CT perfusion parameter (sensitivity, 0.89; specificity, 0.84) was the optimal cut-off point for detecting CHS and hyperperfusion phenomenon. 37 The changes in BFI and TTP during HV with ICG-NIRS are comparable to these previous reports.
In contrast, assessment of cerebral hemodynamics with ICG-NIRS yields time-intensity curves for cerebral perfusion that are independent of oxyhemoglobin. However, absolute quantification of rCBF with ICG-NIRS has proven difficult due to the unknown optical path length of photons through biological tissues and the influence of extracerebral tissue. Skin blood flow contaminates cerebral NIRS measurement, especially if the sensors are placed in the temporal region. This may explain the lack of a correlation between ICG kinetics and rCBF measurement in a previous report. 38 In contrast, another report showed that the intravenous ICG bolus arrives early in cerebral tissue and is delayed in superficial layers. 39 The first part of the curve used for determining ICG kinetics mainly represents rCBF and is not as contaminated by extracerebral tissue, especially forehead skin blood flow as in our setting. Therefore, the BFI and TTP ratios during HV and BH calculated from ICG-NIRS were correlated with CVR and AI from SPECT in the present study.
Limitations
Our study has several limitations. The coverage area of NIRO-200NX was limited to the cortical region of the frontal lobe because of the placement of oximeter sensors over the forehead. Furthermore, extracranial contamination by factors such as extracranial blood flow, cerebral metabolism, arterial saturation, and hematocrit influences cerebral oxygen measured with NIRS. Moreover, because we could not measure each wavelength of infrared light, we performed comparisons with the mean light length. Some patients showed over 100% preoperative CVR values in the present study. A generation of these outliers may cause a difference of patients’ general condition and blood pressure, since SPECT under ACZ challenge test is supposed to perform a week after SPECT at rest. Finally, the study design was nonrandomized, and the small sample size may have introduced biases regarding patients and data collection. In addition, only one patient presented with CHS. Additional well-designed randomized controlled trials involving a large number of patients are required to confirm these results.
Conclusions
The change in BFI during HV calculated from ICG-NIRS indicated a significant linear relationship with not only preoperative CVR but also postoperative AI. Furthermore, a BFI HV/rest ratio of 0.88 or more was the optimal cut-off point for predicting hyperperfusion phenomenon. These results suggested that measurement of ICG kinetics with NIRS during HV is useful for detecting CHS in patients who underwent CAS.
Footnotes
Funding
The author(s) received no financial support for the research, authorship, and/or publication of this article.
Declaration of conflicting interests
The author(s) declared no potential conflicts of interest with respect to the research, authorship, and/or publication of this article.
Authors’ contributions
IN designed the study, analysed the data, and drafted the manuscript; SYO designed the study, acquired the data, and revised the manuscript critically for important intellectual content; DW acquired the data, and revised the manuscript critically for content; FN revised the manuscript critically for content; SYA revised the manuscript critically for content; HY revised the manuscript critically for content; YM revised the manuscript critically for important intellectual content; YSP revised the manuscript critically for important intellectual content; TW designed the study and acquired the data; KK supervised interpretation of data and revised the manuscript critically for important intellectual content; HN designed the study, supervised interpretation of data, and revised the manuscript critically for important intellectual content.