
Abstract
Changes in hemoglobin oxygenation and oxidation state of the CuA centre of cytochrome oxidase were measured with full spectral near infrared spectroscopy simultaneously with phosphorus metabolites using nuclear magnetic resonance 31P spectroscopy at high time resolution (10 seconds) during transient anoxia (FiO2 = 0.0 for 105 seconds) in the newborn piglet brain. During the onset of anoxia, there was no change in either phosphocreatine (PCr) concentration or the oxidation state of the CuA centre of cytochrome oxidase until there was a substantial fall in cerebral hemoglobin oxygenation, at which point the CuA centre reduced simultaneously with the decline in PCr. At a later time during the anoxia, intracellular pH decreased rapidly, consistent with a fall in cerebral metabolic rate for O2 and reduced flux through the tricarboxylic acid cycle. The simultaneous reduction of CuA and decline in PCr can be explained in terms of the effects of the falling mitochondrial electrochemical potential. From these observations, it is concluded that, at normoxia, oxidative phosphorylation and the oxidation state of the components of the electron transport chain are independent of cerebral oxygenation and that the reduction in the CuA signal occurs when oxygen tension limits the capacity of oxidative phosphorylation to maintain the phosphorylation potential.
In the adult rat brain, oxygen consumption is independent of arterial oxygen tension until arterial oxygen tension falls below ∼25 mm Hg (Siesjö, 1978). Although the fall in oxygen delivery is partly compensated during hypoxaemia by an increase in cerebral blood flow (CBF), many authors have suggested that the redox components of the electron transport chain become more reduced as part of a mechanism to maintain oxygen consumption and ATP synthesis. However, supporting evidence relies on the use of optical techniques, for example, NADH fluorescence techniques to measure mitochondrial NADH/NAD+ redox changes, visible spectroscopy to measure redox changes of the haem a centre of cytochrome oxidase, and near infrared spectroscopy (NIRS) to measure changes in the redox state of the CuA centre of cytochrome oxidase. In general, the signals from these techniques show a continuous redox reduction from hyperoxia to hypoxia [see, e.g., Gyulai et al. (1988; NADH fluorescence), Kreisman et al. (1981; visible spectroscopy), and Hampson et al. (1990; NIRS)], although there are exceptions (Hoshi et al., 1997; Cooper et al., 1994). However, all optical techniques are susceptible to interference by hemoglobin, which does show continuous changes in oxygenation and total concentration between hyperoxia and hypoxia.
Whether the redox state of the electron transport chain is dependent on cerebral oxygenation at normoxia is critical to the understanding of the coupling of blood flow and metabolism during functional activation. Based on the assumption that mitochondrial oxygen tension is either constant or very low, it has been predicted (Buxton and Frank, 1997) that large increases in CBF are necessary to accommodate small increases in cerebral metabolic rate for O2 (CMRO2), as observed in positron emission tomography functional activation studies (Fox et al., 1988). However, if the oxygen tension at the mitochondria is substantially above a critical level, then increased oxygen consumption by the mitochondria can drive the mitochondrial oxygen tension lower and increase the rate of oxygen diffusion from capillary to mitochondria without the need for large increases in CBF.
In vitro work on mitochondrial suspensions has shown that in coupled mitochondria, the electron transport chain from NADH to cytochrome c operates reversibly and at equilibrium (Erecinska et al., 1974; Forman and Wilson, 1982; Nishiki et al., 1978; Greenbaum and Wilson, 1991). Within the framework of the chemiosmotic theory of oxidative phosphorylation, this can be interpreted to mean that the free energy released when electrons are passed from NADH to cytochrome c is equal to the free energy required to pump protons against the electrochemical gradient, that is,
where np is the number of protons pumped by complex I and complex III per electron transferred, ΔμH+ is the electrochemical potential defined as the free energy change when protons are translocated across the mitochondrial membrane from cytosol to matrix, F is the Faraday constant, and ENADH and Ecytc are the redox potentials of NAD and cytochrome c. Furthermore, the mitochondrial electrochemical potential has been shown to be in equilibrium with the cytosolic phosphorylation potential via the mitochondrial F1F0-ATP synthase (Wang and Oster, 1998), the adenine nucleotide translocase, and phosphate translocase (Forman and Wilson, 1983), that is,
where ns is the number of protons translocated across the mitochondrial membrane per ATP synthesised and ΔGp is the cytosolic phosphorylation potential, defined as the free energy change on hydrolysis of ATP. Thus, changes in the phosphorylation potential can be used to infer changes in the redox state of the electron transport chain: As the phosphorylation potential becomes less negative, the electrochemical potential becomes less negative (Eq. 2) and cytochrome c becomes more reduced with respect to the NAD+/NADH redox couple (Eq. 1).
In vivo phosphorus (31P) nuclear magnetic resonance spectroscopy (NMRS) is an established noninvasive technique for measuring the intracellular concentrations of ATP, inorganic phosphate (Pi), and phosphocreatine (PCr). Although the concentration of free ADP is too low to be measured directly, the cytosolic phosphorylation potential can be calculated, assuming that the creatine kinase reaction remains in equilibrium (Siesjö, 1978). In addition, intracellular pH (pHi) can be calculated from the chemical shift between the PCr and Pi(Moon and Richards, 1973).
Near infrared spectroscopy is a noninvasive technique that has the potential to measure changes in the concentration of oxyhemoglobin (HbO2) and deoxyhemoglobin (Hb) and the oxidation state of the CuA centre of cytochrome oxidase (CuA). However, accurate measurement of the change in the CuA oxidation state is error-prone because it represents a small component of the signal compared with hemoglobin and the oxidised cytochrome spectrum is similar in shape to that of HbO2. For this study, a full spectral charge-coupled device (CCD) spectrometer system was used, which has been shown by modelling to be more precise in separating the CuA signal from the hemoglobin signals than two- or four-wavelength systems (Matcher et al., 1995). The robustness of the CuA signal from this system and in this model has been partially validated using cyanide (Cooper et al., 1999). Use of a full spectral system has the added advantage that the optical path length can also be measured from the second differential feature of water (Matcher et al., 1994) and so changes in the concentration of HbO2 and Hb and CuA oxidation state can be expressed in units of concentration (μmol/L).
The aim of this study was to determine whether, at normoxia, the redox state of the electron transport chain is dependent on cerebral oxygenation. This was achieved by simultaneously measuring phosphorus metabolites using NMRS and NIRS parameters with a high temporal resolution during brief anoxia (FiO2 = 0.0 for 105 seconds); brief anoxia leads to rapid cerebral desaturation, a reduction in the CuA centre of cytochrome oxidase, and a fall in the phosphorylation potential. By careful registration between the NIRS and NMRS signals, it was possible to determine the sequence of events that led to energy failure.
Previous comparisons between 31P metabolites and electron transport chain redox state (Gyulai et al., 1988; Tsuji et al., 1995; Matsumoto et al., 1996) have correlated NMRS parameters with redox state at different arterial PO2 values. However, maintaining PaO2 at low values for periods of many minutes necessary to obtain phosphorus spectra can lead to circulatory failure, resulting in partial cerebral ischaemia, a more profound cellular acidosis, and severe energy failure [cf. data of Tsuji et al. (1995) and Matsumoto et al. (1996) with the data presented here]. Such changes can lead to cellular oedema and a change in the tissue-scattering coefficient that are not accounted for by the NIRS algorithm used to separate attenuation changes into chromophore concentration changes and that may lead to spurious changes in the redox signal. This complicates the data analysis compared with the brief anoxia used here and, in particular, the use of a neonatal piglet model, in which the heart is more resistant to transient hypoxia and blood pressure and hence cerebral perfusion is maintained.
To obtain high-quality NMR spectra with the required time resolution, it was necessary to perform the brief anoxia six times in each piglet and to sum the NMR spectra for each time point of the six anoxias. For this process to be valid, it is necessary to show that the anoxia is highly reproducible.
METHODS
Six piglets, born at term but less than 24 hours old and weighing 1.72 ± 0.14 (SD) kg, were sedated with mid-azolam and anaesthetised with 2% isoflurane. A tracheotomy was performed, and the piglets were artificially ventilated with an intermittent positive pressure ventilator using an oxygen and nitrogen gas mixture. The inspired oxygen fraction was set to 0.4, and the inspiratory pressure and the respiration rate set to give an arterial CO2 level (PaCO2) of between 30 and 40 mm Hg.
Cannulae were sited in the umbilical vein and artery for infusion of fluids and for collecting blood samples to perform blood gas analysis (ABL505; Radiometer, Copenhagen, Denmark), respectively. To prevent hypoglycaemia, 10% glucose solution was infused intravenously at 2 mL/h and arterial blood glucose and lactate were measured periodically (2300 STAT Plus; YSI, Yellow Springs, OH, U.S.A.). Heart rate and mean arterial blood pressure were monitored from the umbilical arterial line using a strain gauge pressure transducer. Rectal temperature was maintained at 38.5°C using a heated water mattress.
The piglets were placed in a custom-made pod in the bore of a 7 T Bruker Avance spectrometer (Karlsruhe, Germany) with a 21-cm bore and a 31P frequency of 121 MHz. The head was fixed in a stereotaxic frame that also held a 25-mm-diameter double-tuned (31P and protons) inductively coupled surface coil against the intact scalp over the parietal lobes and two end-on optodes 35 mm apart symmetrically about the midline ∼1 cm posterior to the eyes. In this configuration, the NIR optodes and 31P surface coil were expected to probe approximately the same volume of tissue. The optodes were surrounded by NIR-opaque sponges (∼1 cm square), pressed firmly against the head, and NIR-opaque polyvinylchloride tape was used to shield the cranium between and around the optodes and beneath the surface coil. The use of the sponges and tape ensured that light emerging near the transmit optodes did not reenter the head near the receive optode and interfere with the attenuation measurement.
The homogeneity of the static magnetic field was optimised by monitoring the signal of brain water protons, and a half-height width of <30 Hz was normally obtained. The pulse sequence consisted of a Dante pulse train (Morris and Freeman, 1978) of 500 10-microsecond pulses with a 200-microsecond repetition time to reduce signals from bone and phospholipids, followed by a square acquisition pulse (180° flip angle at the centre of the coil). The repetition time was 2 seconds; 4,096 quadrature points were collected with a spectral width of 14 kHz; and four free induction decays (FIDs) were averaged, giving a spectrum with a temporal resolution of 10 seconds. Six 31P spectra (24 FIDs) from corresponding time points on the repeated brief anoxias were summed, exponentially weighted with an 8-Hz filter, Fourier transformed, and phase corrected. Relative concentrations of phosphorus metabolites were obtained by fitting Lorentzian peaks to the real component of the phosphorus spectra using a nonlinear iterative curve-fitting method and a quartic background; peak height and position were allowed to vary, whereas peak width was determined from baseline spectra and fixed during the fitting process because no changes were observed in the line width of the resonance peaks.
The high temporal resolution precluded the acquisition of fully relaxed 31P spectra so that relative concentrations of different metabolites could not be compared, although the relative concentration of each metabolite remained proportional to the peak area, assuming the relaxation time did not change over the period of anoxia (this assumption was supported by the stability of the ATP peak). Therefore, concentrations of ATP, PCr, and Pi were expressed as the peak height of the ATP-β, PCr, and Pi peaks relative to baseline PCr peak height; peak height is proportional to peak area at constant peak width.
Light from a stabilised tungsten halogen light source was filtered with a 610-nm long-pass filter and transmitted to the piglet head with a glass optic fibre bundle (3.3-mm diameter). Transmitted light was collected with a second fibre bundle and focused onto the slits of a 0.27-m spectrograph (270M; Instruments SA, Lonjumeau, France) equipped with a 300-g/mm grating blazed at 1,000 nm. The NIR spectra between 650 and 980 nm were collected contiguously every second on a charge-coupled device detector (Wright Instruments, Enfield, London, U.K.) with the shutter held open. The pixel bandwidth was 0.32 nm, and the slits set to give a signal of ∼100,000 electrons per digital conversion at 800 nm; spectral resolution was between 2.5 and 3.7 nm.
Changes in HbO2, Hb, and CuA were determined by fitting changes in the attenuation spectra between 780 and 900 nm to in vitro absorption spectra of HbO2, Hb, and CuA that had been corrected for the wavelength dependence of path length (Essenpreis et al., 1993). The optical path length at the 840-nm water absorption feature was obtained by fitting the second differential of the attenuation spectra to the second differential of water and Hb absorption spectra between 800 and 880 nm. The path length was converted to units of centimetres by assuming an average cerebral water content of 85%. Changes in HbO2, Hb, and CuA were converted to units of millimoles per litre using the 840-nm water path length derived from baseline spectra. Total hemoglobin (HbT) is the sum of HbO2 and Hb.
After surgery and once the piglet had been positioned in the magnet, the isoflurane was reduced to 1.5 to 1.8% and the piglet allowed to stabilise over a period of at least 1 hour, during which NIR spectra were recorded. The experimental protocol consisted of six transient anoxias in which the inspired oxygen fraction was reduced from 0.4 to 0.0 for 105 seconds. Transient anoxias were performed at intervals of 20 minutes. The NIRS and 31P data were collected continuously throughout, and blood samples for gas and glucose/lactate analysis were collected 2 minutes before each anoxia.
The NIR attenuation spectra were collected contiguously every second throughout the study, and heart rate, blood pressure, and rectal temperature were logged simultaneously by the NIRS software. The gas mixture fed to the piglets was controlled using a computerised gas blender (Elwell et al., 1994) and was switched synchronously with the NIRS data collection. The 31P spectra were collected contiguously every 10 seconds asynchronously with respect to the NIRS data collection, and the beginning of each spectrum was logged by the NIR software. At the end of the study, the attenuation spectra, NIRS parameters, and logged physiological parameters were averaged over the period of each 31P spectrum to give a complete data set of six anoxias with a temporal resolution of 10 seconds for each piglet. The mean and SD of the NIRS data and logged physical parameters were calculated over the six anoxias, and the NMR FID data were summed to provide sufficient signal-to-noise ratio. To time-normalise each anoxia for averaging, time zero was chosen as the first data point at which HbO2 fell below baseline during the onset of anoxia. Although gas switching was not synchronized to NMRS data collection, this method maintains temporal accuracy to ±5 seconds. The time-normalisation data point is marked as time zero in the figures.
Analysis of variance was used to compare repeated measurements, and all data are presented as mean ± SD (n = 6 animals). The significance of changes was determined using a paired Student t test; the criterion for significance was P < 0.05.
RESULTS
Before the first anoxia and calculated (mean ± SD) over the six piglets, mean arterial blood pressure was 49.7 ± 5.1 mm Hg, heart rate was 182 ± 16 beats/min, arterial pH was 7.54 ± 0.01, arterial PO2 was 145 ± 23 mm Hg, and arterial PCO2 was 35.6 ± 3.6 mm Hg. These values are all in the normal physiological range for the newborn piglet and did not change significantly between baseline periods before each anoxia. The baseline values of mean arterial blood pressure are shown in Table 1 to demonstrate the degree of cardiovascular stability. Rectal temperature remained in the range of 38.5 to 38.7°C, which is normal for a newborn piglet, but the precision of the temperature probe (0.1°C) precluded statistical analysis. Each anoxia increased arterial plasma lactate significantly from 1.5 mmol/L before the first anoxia to 2.5 mmol/L before the last and increased arterial plasma glucose significantly from 5.0 ± 0.9 mmol/L before the first anoxia to 5.6 ± 1.3 mmol/L before the last anoxia (see Table 1).
Physiologic, NIR, and 31P NMRS variables, expressed as mean ± SD (n = 6), measured 2 minutes before each anoxia
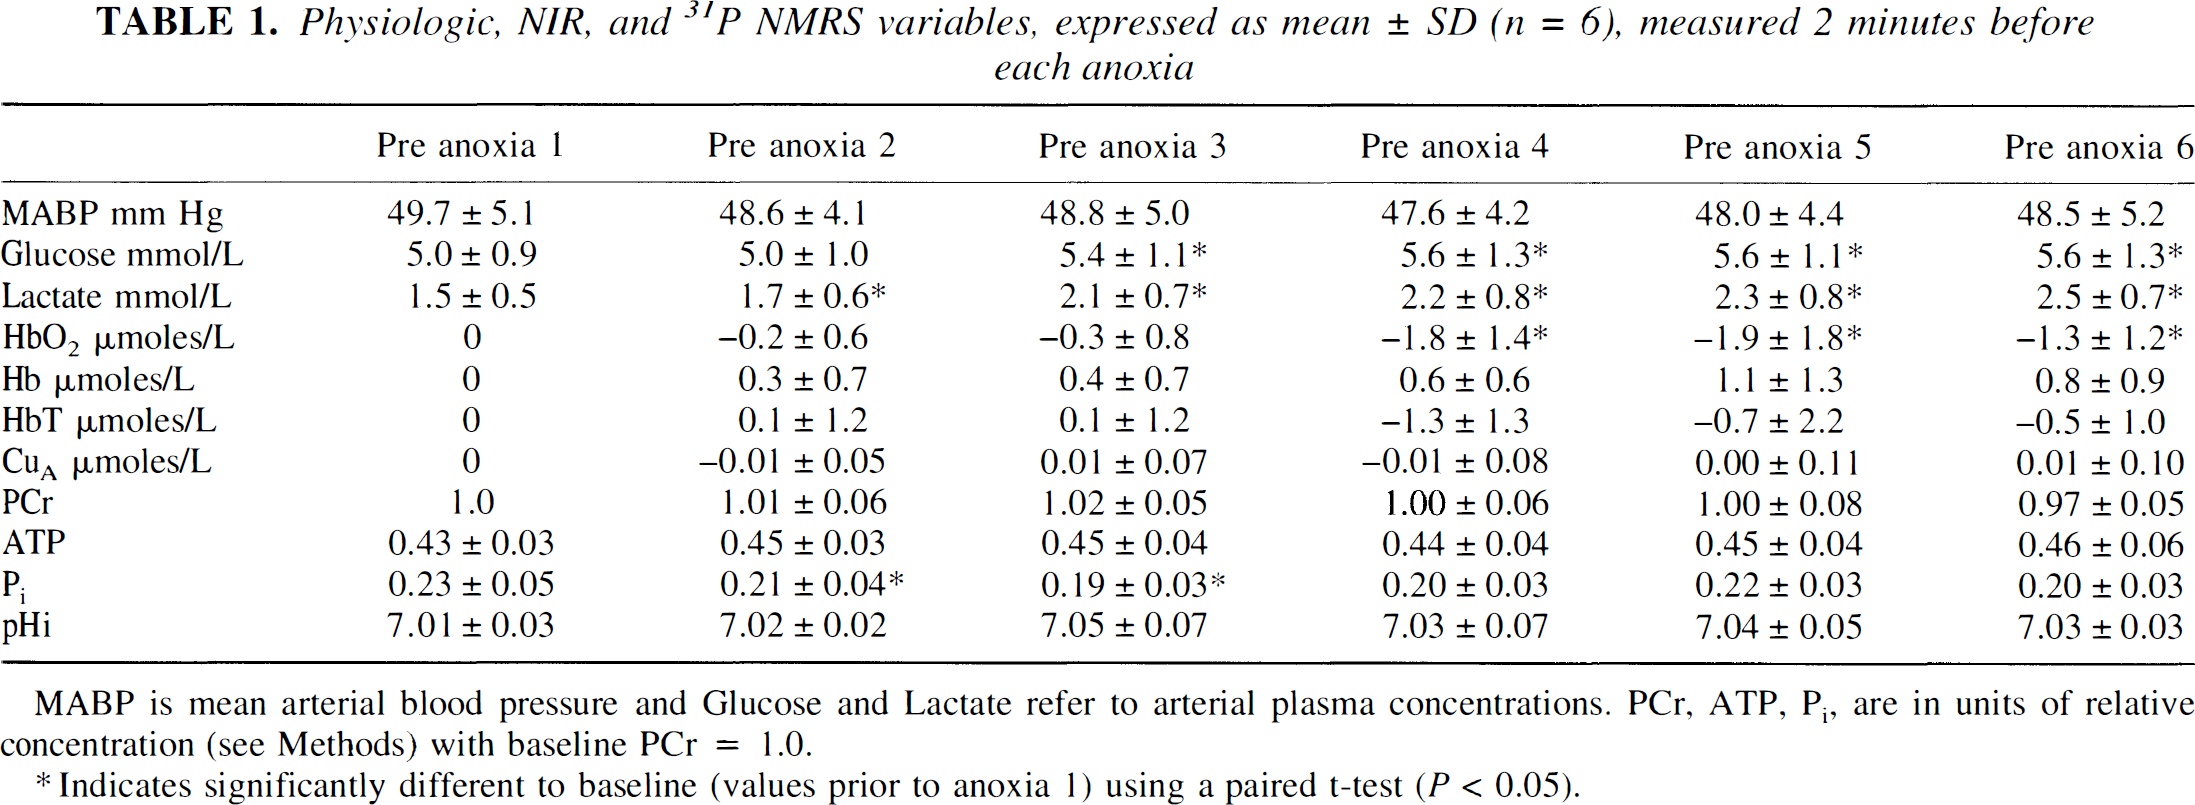
MABP is mean arterial blood pressure and Glucose and Lactate refer to arterial plasma concentrations. PCr, ATP, Pi are in units of relative concentration (see Methods) with baseline PCr = 1.0.
Indicates significantly different to baseline (values prior to anoxia 1) using a paired t-test (P < 0.05).
The baseline values for the NMRS and NIRS parameters before each anoxia are shown in Table 1. The NMR parameters were obtained by averaging six phosphorus spectra (24 FIDs) in the baseline period between 2.5 and 1.5 minutes before each anoxia. In general, there were no significant changes in these parameters before each anoxia except for HbO2, which showed a continuous small decrease that obtained significance before the fourth anoxia, and Pi, which showed small significant decreases before the second and third anoxias. None of these changes were significant at the P = 0.01 level.
Figure 1 shows changes in HbO2, Hb, HbT, CuA, mean arterial blood pressure, and heart rate of a typical piglet expressed as mean and SD averaged over the six anoxias (see Methods). The period of anoxia is marked as A on Fig. 1. The reduction in arterial saturation leads to a fall in HbO2 and rise in Hb starting at time zero in the figure. From the beginning of anoxia, oxygen tension at the cellular level would have been falling, but it was not until HbO2 had fallen substantially that there was a reduction in the CuA signal. The increase in HbT is consistent with an increase in CBF that had been triggered by the hypoxaemia. Reoxygenation, marked as R in Fig. 1, was first observed at 90 seconds, and there was simultaneous cerebral reoxygenation and oxidation of the CuA centre of cytochrome oxidase. Arterial saturation rapidly returned to normal levels, but there was an increase in HbO2 and a decrease in Hb compared with baseline values, consistent with an increase in CBF. The HbT reached a maximum at ∼120 seconds and HbO2 at ∼150 seconds, and then HbT, HbO2, and Hb returned to baseline values over the subsequent 8 minutes.
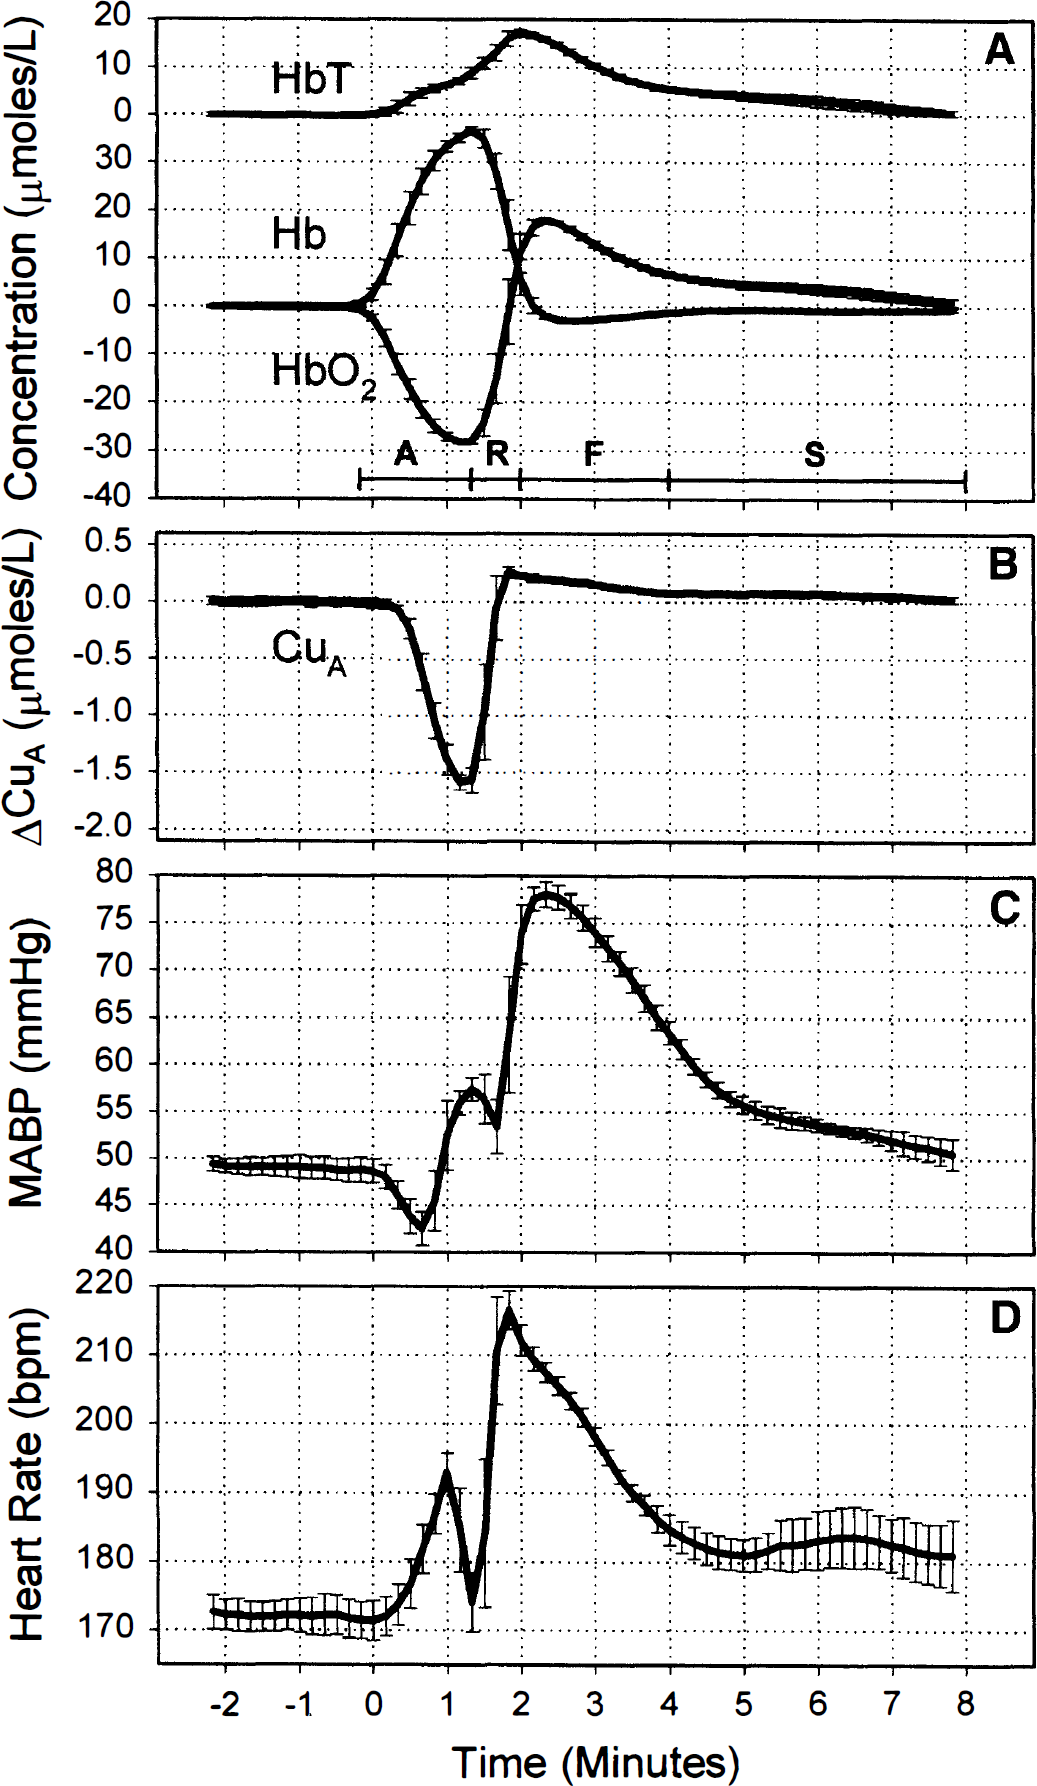
Changes in total hemoglobin (HbT), oxyhemoglobin (HbO2), and deoxyhemoglobin (Hb)
The apparent discrepancy between the period of FiO2 = 0.0 (105 seconds) and the period of the anoxia observed in the head (90 seconds) is the result of gas mixing and transit time in the ventilation tubing and not an artefact of the averaging procedure. The same period is observed in the data before averaging.
The hyperaemic period after reoxygenation can be loosely split into two phases: the fast phase (marked as F on Fig. 1), which lasted from 2 to ∼4 minutes after anoxia, in which the HbT and CuA signals rapidly returned towards baseline, and the slow phase (marked as S on Fig. 1), which covered the period 4 to 8 minutes, in which the HbT slowly returned to baseline.
The lower panels of Fig. 1 show mean arterial blood pressure and heart rate during the anoxia. The baseline heart rate in this piglet was 171 ± 3 beats/min and increased at the onset of anoxia to 193 ± 3 beats/min before falling at the depth of the anoxia to 174 ± 4 beats/min. At the onset of anoxia, mean arterial blood pressure fell from a baseline value of 48.7 ± 1.3 to 42.5 ± 1.8 mm Hg and then rose to 57.5 ± 1.2 mm Hg before falling to 53.4 ± 2.9 mm Hg during the period of bradycardia. On reoxygenation, there was a rapid rise in mean arterial blood pressure and heart rate, which returned to baseline with a similar biphasic pattern as the hemoglobin parameters but with a slightly longer time course.
The error bars in Fig. 1 are representative of the reproducibility of the transient anoxia in all the piglets studied. The larger error bars during desaturation and reoxygenation are probably the result of slight timing differences between NMRS data collection and gas mixture switching: Gas switching was not synchronised to the NMRS data collection. The slightly larger error bars observed between 4 and 7 minutes after onset of anoxia in the HbT, HbO2, mean arterial blood pressure, and heart rate traces are the result of small changes in the time course of the slow hyperaemic phase.
Figure 2 shows typical 31P spectra obtained by accumulating a total of six spectra (24 FIDs) from equivalent time points in the six anoxias from the same piglet as in Fig. 1. The top trace was collected in the baseline period and the middle trace at the depth of the anoxia; the latter shows a substantial decrease in PCr and increase in Pi. The lower trace shows a 31P spectrum during the early phase of the hyperaemic response before pHi has returned to baseline values. The vertical dotted line shows the chemical shift of the baseline Pi peak and is included to emphasise the acid shift of the Pi peak.
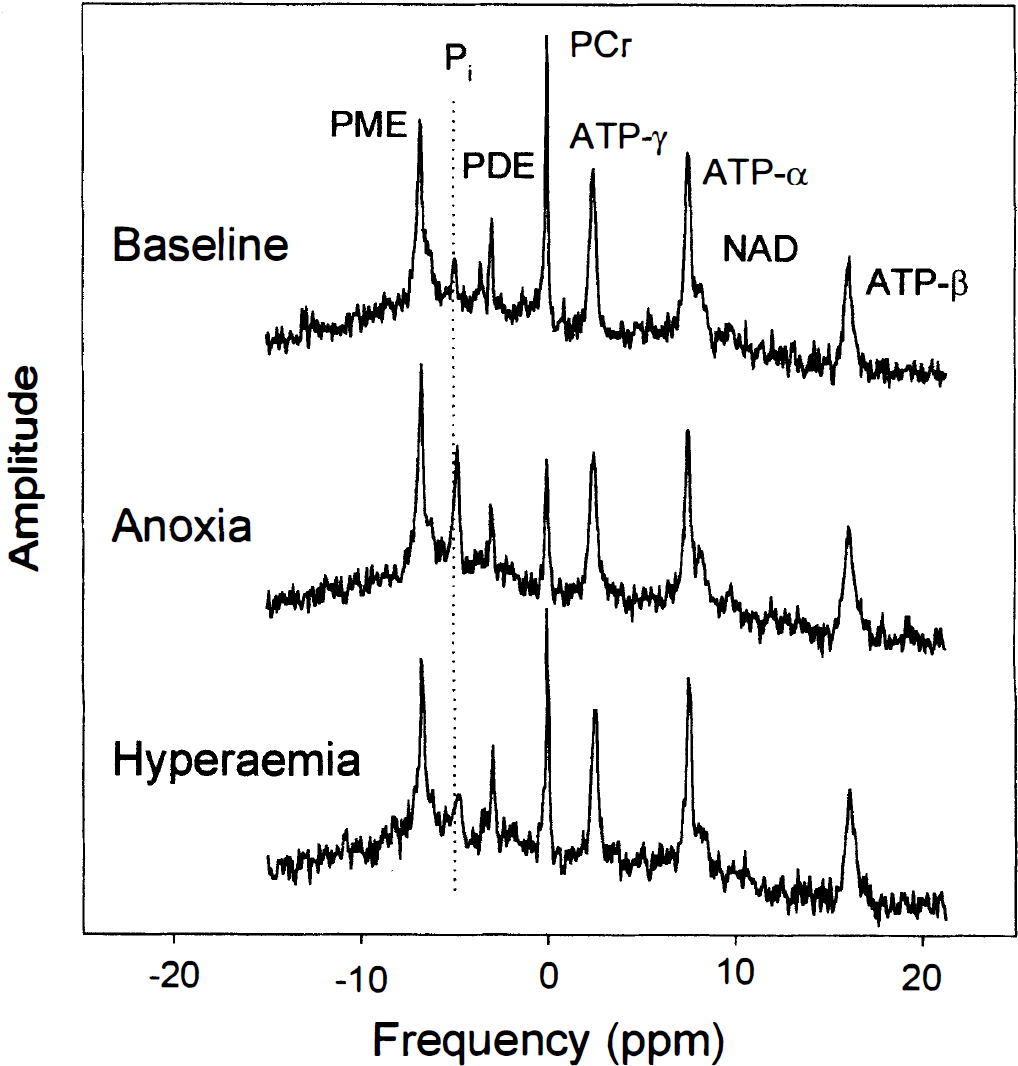
Typical 31P spectra from the baseline period, at the maximal depth of the anoxia, and during the postanoxia hyperaemic period from a typical piglet. PDE, phosphodiesters; Pi, inorganic phosphate; PME, phosphomonoesters; PCr, phosphocreatine.
Figure 3 compares the time courses of the hemoglobin signals (Fig. 3A), with HbT offset for clarity, the CuA signal (Fig. 3B), 31P signals (Fig. 3C), and pHi (Fig. 3D) expressed as the mean and SD over all six piglets. The mean and SD of the NIR parameters from the six piglets were calculated from the mean values averaged over the six anoxias in each piglet. The patterns of cerebral desaturation and reoxygenation were the same in all piglets studied, as shown by the similarity of the NIRS changes in the pooled data (Fig. 3) compared with those from an individual piglet (Fig. 1). The larger error bars in Fig. 3 compared with Fig. 1 show that interpiglet variation was much greater than the intrapiglet variation.
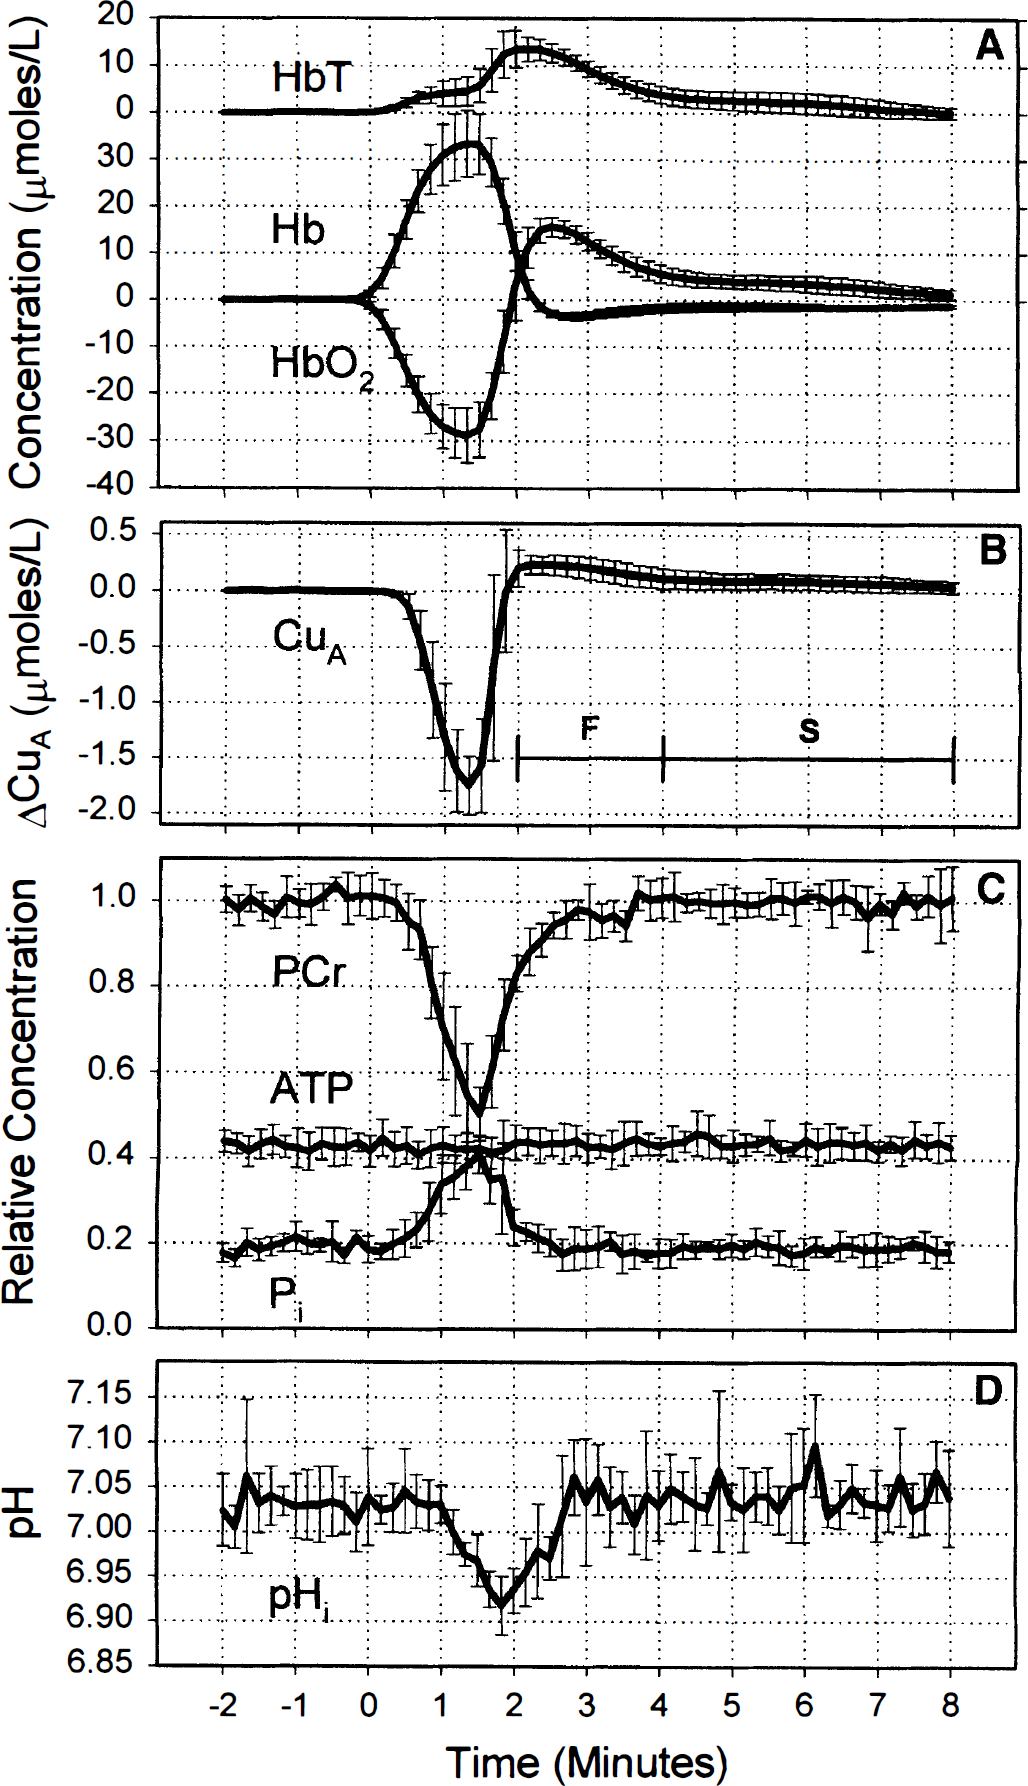
Changes in total hemoglobin (HbT), oxyhemoglobin (HbO2), and deoxyhemoglobin (Hb)
The onset of anoxia leads to a simultaneous fall in PCr and rise in Pi (Fig. 3C). However, there is a delay between the onset of anoxia and changes in PCr and Pi. After anoxia, PCr rapidly increased to ∼80% of baseline values, which corresponded to cerebral reoxygenation and the rapid reoxidation of the CuA centre of cytochrome oxidase. The PCr then slowly returned to baseline between 2 and 4 minutes after onset of anoxia, which corresponds to the fast phase of the hyperaemia marked as F in Fig. 3. Similar changes were observed in Pi, but the signal-to-noise ratio was lower than that of PCr. To within the error of the measurement, no change in ATP was observed. During the rapid phase of hyperaemia, the hyperoxidation of the CuA signal reached a maximum of 0.23 ± 0.08 μmol/L and was significantly different from 0.0 (P < 0.001).
Baseline pHi was ∼7.03 ± 0.03, and there was no significant change (P < 0.05) until 70 seconds after the onset of anoxia, at which point it rapidly decreased to a minimum of 6.92 ± 0.03 at 20 seconds after reoxygenation. It then rapidly returned to baseline by 3 minutes after onset of anoxia, that is, during the fast phase of hyperaemia.
The early fall in mean arterial blood pressure was observed only in two piglets (Fig. 1), and the mean value over the six piglets was observed to rise during this period. The bradycardia just before reoxygenation was observed in all piglets, with the heart rate falling to a minimum of 58 ± 6 beats/min in one piglet. The mean value over the six piglets fell from a baseline value of 182 ± 16 to 102 ± 47 beats/min and mean arterial blood pressure fell to only 48.3 ± 5.0 mm Hg, which was close to the baseline value (49.7 ± 5.1 mm Hg) during this period of bradycardia.
To emphasise the relative timings of changes in HbO2 and CuA with respect to PCr, the change in HbO2 (top) and change in CuA (bottom) are plotted against relative PCr concentration (baseline = 1.0) during the onset of the anoxia in Fig. 4. The line on the bottom panel of Fig. 4 is a linear regression and is included as a guide for the eye. Figure 4 clearly shows that there was a significant fall in HbO2 before any change in PCr and that the CuA signal changed coincidentally with the fall in PCr. Although the first significant (P < 0.05) reduction in the CuA centre of cytochrome oxidase occurred at 30 seconds, the change in PCr did not gain significance until 50 seconds after the onset of anoxia, probably due to the lower signal-to-noise ratio on the PCr signal compared with the CuA signal.
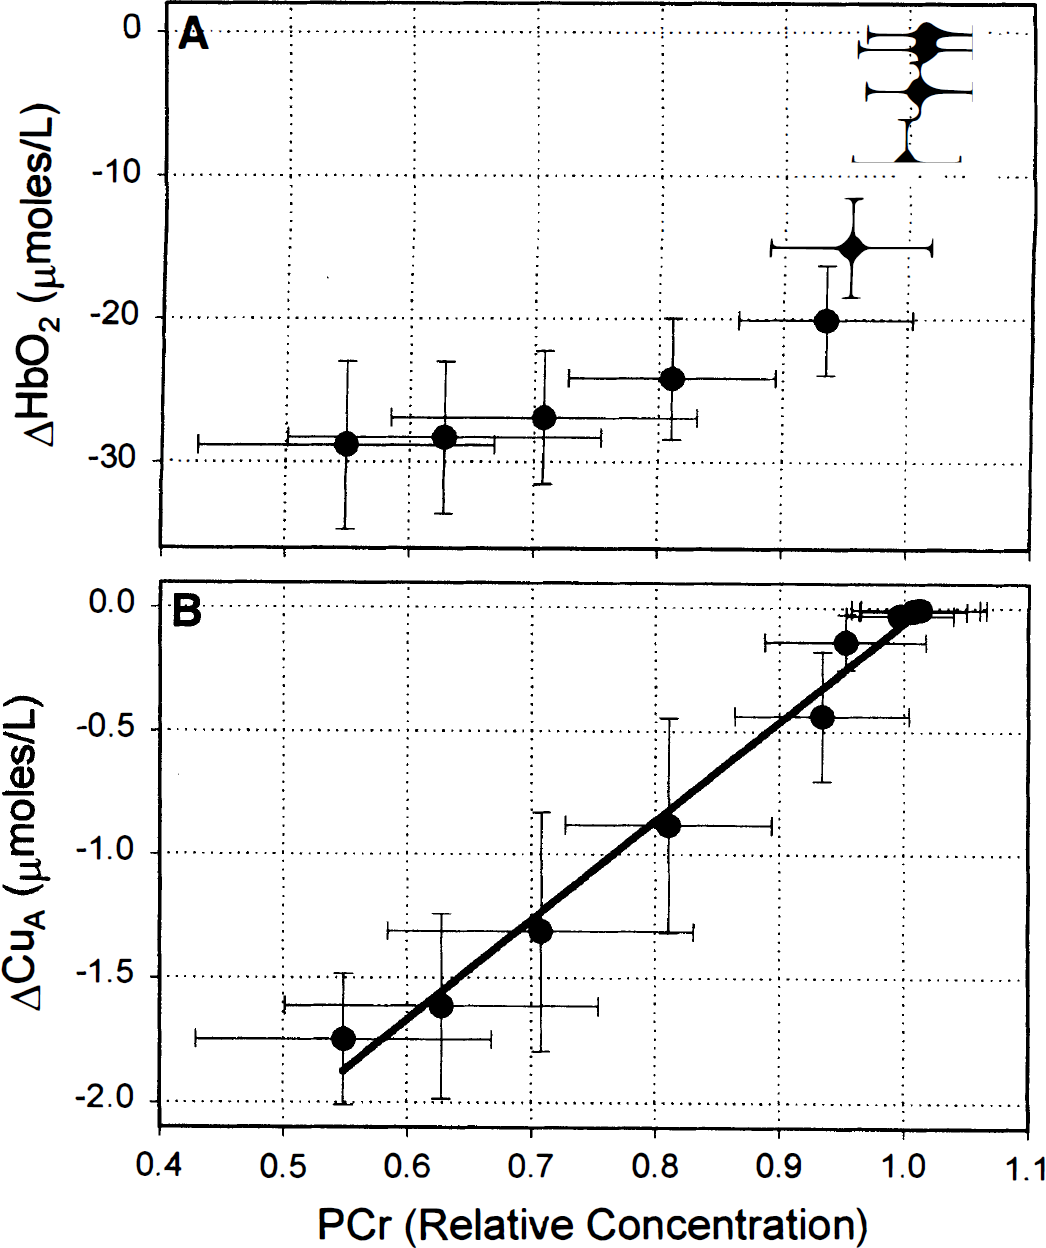
Change in oxyhemoglobin (HbO2)
Figure 5 plots the change in the oxidation state of the CuA centre of cytochrome oxidase against the change in HbO2 during the onset of anoxia. The first significant fall in CuA occurs when HbO2 has fallen by 15.0 ± 3.4 μmol/L. The figure shows that HbO2 can be decreased by small amounts from a baseline value without affecting the oxidation state of the CuA centre of cytochrome oxidase.
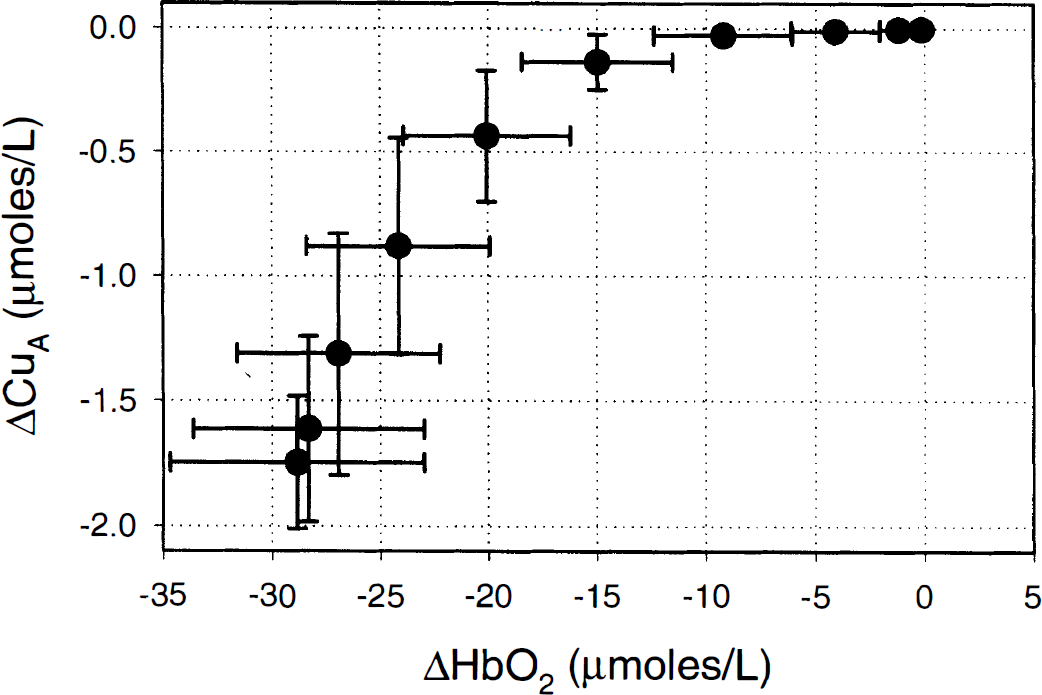
Change in the oxidation state of the CuA centre of cytochrome oxidase plotted against oxyhemoglobin (HbO2) during the onset of anoxia. Results are expressed as mean ± SD calculated over the averaged anoxias from all six piglets.
DISCUSSION
For the technique of summing NMRS spectra from corresponding time points in each anoxia to provide reliable data, it is necessary to show that the transient anoxias were highly repeatable. The results from Table 1 show that, except for small changes in plasma glucose and lactate concentrations, the systemic physiological parameters did not vary significantly between each anoxia. Plasma lactate was found to increase incrementally and significantly with each anoxia from a baseline figure of 1.5 to 2.5 mmol/L before the last anoxia, but these changes were probably systemic and not cerebral in origin and are relatively small. As the blood-brain barrier is only semipermeable to lactate (Pardridge, 1983) and intracellular pH remained constant, it is unlikely that cerebral metabolism was affected. In addition, Fig. 1 shows that the NIRS parameters, mean arterial blood pressure, and heart rate were highly reproducible over the course of the anoxias in each piglet, and therefore the method of summing 31P FIDs over six consecutive anoxias is a valid method to increase the signal-to-noise ratio of the 31P data.
The CuA centre of cytochrome oxidase is located on the cytosolic side of the enzyme, far from the binuclear centre where oxygen is reduced to water but close to the cytochrome c binding site (Rich et al., 1988; Iwata et al., 1995; Tsukihara et al., 1995). In vitro studies on mitochondria have shown that, in coupled turnover, the CuA centre of cytochrome oxidase is in redox equilibrium with cytochrome c (Morgan and Wikström, 1991), and therefore their redox potentials will be the same, albeit with the CuA centre slightly more reduced because its midpoint potential is slightly more positive than cytochrome c.
The results from Figs. 3 and 4 clearly show that there is a considerable delay between the onset of anoxia and a reduction in the cytosolic phosphorylation potential, as indicated by a fall and rise in PCr and Pi, respectively. During this period, oxygen tension at the cellular level will be falling, but the mitochondrial electrochemical potential remains constant (see Eq. 2). Therefore, either the redox states of NADH and cytochrome c do not change or their redox potentials change by equal amounts (Eq. 1). Although the 31P data alone cannot provide unequivocal evidence that the redox states are not changing during this period, in vitro studies suggest that they do not change in parallel: In isolated mitochondria, cytochrome c begins to reduce at higher oxygen tension than NADH (Sugano et al., 1974), and in cultured kidney cells, there is little change in the redox potential of NADH at oxygen tensions that reduce cytochrome c (Wilson et al., 1977).
If it is assumed that the redox potential of NADH is fixed by the reactions of the tricarboxylic acid cycle at nonlimiting oxygen tension, then cytochrome c and CuA should become more reduced as the phosphorylation potential decreases. This is exactly the behaviour observed in Figs. 3 and 4, in which the reduction of the CuA signal coincides with the fall in PCr concentration, and is exactly the behaviour observed in neuroblastoma cells (Wilson et al., 1979), in which cytochrome c redox state and 31P metabolites were measured simultaneously at low oxygen tension. This is convincing evidence that the delay between the onset of anoxia and the reduction of the CuA signal and the relationship between HbO2 and CuA, as shown in Fig. 5, are not artefactual in origin but that, as measured by this system and under these conditions, changes in the CuA signal accurately reflect changes in the oxidation state of the CuA centre of cytochrome oxidase.
Once the ATP generated by glycolysis has been hydrolysed, glycolysis is a proton-generating system. These protons can either be removed from the cytosol by conversion of pyruvate to lactic acid and then exported or be metabolised to water in the mitochondria. At normoxia, the producing and consuming reactions occur at equal rates and pH homeostasis is achieved. During anoxia, when oxygen consumption is inhibited and glycolysis is expected to be stimulated, the production of hydrogen ions will exceed consumption and will lead to the acidification of the intracellular space. However, the exact point at which oxygen consumption falls is difficult to determine from changes in intracellular pH because physicochemical pH buffering would tend to mask small changes in net hydrogen ion production and also hypoxia-induced increases in CBF, which would tend to wash out CO2 and lead to a compensatory alkalinisation of the intracellular space. In addition, even at constant CMRO2, a fall in the phosphorylation potential is expected to increase glycolysis above baseline values, leading to a slow accumulation of lactate because glycolysis is stimulated by ADP and inhibited by ATP.
However, examination of Fig. 3 shows that there is a very rapid acidification of the intracellular space, which is further delayed from the fall in PCr. This rapid acidification may well represent the point at which low oxygen tension inhibits CMRO2, resulting in the rapid intracellular accumulation of pyruvate and lactate. This is consistent with results from the adult rat showing that, during the onset of hypoxaemia, PCr concentration falls before there is a reduction in CMRO2(Norberg and Siesjö, 1975). Therefore, this study would suggest that the CuA centre reduces during hypoxaemia at oxygen tensions that affect the phosphorylation potential but do not limit oxygen consumption.
The sequence of events during the onset of anoxia can now be determined. As arterial oxygen tension falls, initially there are no changes in phosphorylation potential and redox state of the electron transport chain until oxygen tension at the mitochondria falls to a critical value. At this critical value, there is a coincidental reduction of the electron transport chain and fall in the phosphorylation potential, but flux through the electron transport chain and oxygen consumption are not affected substantially. As PaO2 continues to fall, there is a continuous reduction in the phosphorylation potential and reduction in the CuA centre of cytochrome oxidase until a second critical value is reached at which oxygen consumption is inhibited. These critical values refer to mitochondrial oxygen tension, and in vivo the actual mitochondrial response to hypoxaemia will be broadened by the presence of the considerable heterogeneity that has been observed in the microcirculation (Hudetz, 1997) and in tissue oxygen tension measured with microelectrodes (Lubbers et. al., 1994) and the heterogeneity in mitochondria themselves (Sonnewald et al., 1998).
In this study, ATP concentration did not change during the anoxia, although there is evidence that CMRO2 was inhibited. Similar results were observed in adult cats in which changes in ATP concentration were not observed with hypoxia (PaO2 ∼20 mm Hg) but only when hypoxia was combined with ischaemia (Gyulai et al., 1987). In the short term, the phosphorylation potential may be prevented from falling to very low values by the stimulation of glycolysis and residual oxygen consumption over the brief period of anoxia. Once oxygen tension has fallen to a level sufficient to inhibit oxygen consumption, it is expected that components of the electron transport chain, particularly cytochrome c and CuA, would become almost fully reduced. Experience with performing anoxias in the piglet has shown that extending the period of anoxia does not produce a substantial further reduction in the CuA centre of cytochrome oxidase (data not shown), which would suggest that the CuA centre is almost fully reduced immediately before reoxygenation in Fig. 1. During extended periods of hypoxia, when circulatory failure can occur, leading to relative ischaemia, the phosphorylation potential and PCr levels would be expected to fall to much lower levels without a further change in the CuA redox state. In this case, the response of the CuA oxidation state to PCr at low PCr concentration would become nonlinear, leading to a poorer correlation between CuA and PCr than shown in Fig. 4.
The period between a fall in the reduction of CuA and the fall in oxygen consumption represents an area in which adaptation of the electron transport chain maintains electron flux to oxygen, albeit at lower phosphorylation potential. Although the adaptation involves the reduction of the CuA centre of cytochrome oxidase, whether this is part of the mechanism of adaptation or secondary to this mechanism is more likely to be determined from in vitro mitochondrial models in which redox states and electrochemical potential can be accurately measured and controlled rather than an in vivo model.
During the hyperemic period after reoxygenation, there is an increase in cerebral hemoglobin oxygenation and a hyperoxidation of the CuA signal above baseline. As it has been shown that the CuA oxidation state is independent of oxygen tension at normoxia, this hyperoxidation of the CuA centre cannot be the result of increased oxygen tension at the mitochondrial level. However, during this period, there is expected to be an increase in ATP utilization and oxygen consumption to reestablish cellular ion gradients depleted by the anoxic insult. An increase in ATP utilization would lead to an increase in ADP concentration and a decrease in the phosphorylation potential, as is observed during the fast hyperaemic phase in Fig. 3, which corresponds to the period of hyperoxidation. Although the lower phosphorylation potential would reduce CuA with respect to NAD (Eq. 1), increasing the ADP concentration stimulates oxygen consumption and leads to an oxidation in NAD and cytochrome c in mitochondria (Chance and Williams, 1956). The same mechanism has been used to explain an oxidation in the CuA signal observed in human subjects after visual stimulation (Heekeren et al., 1999). An alternative cause of the hyperoxidation of NAD and CuA would be a decrease in substrate supply to the tricarboxylic acid cycle (Chance and Williams, 1956), but it is not clear why there should be a decrease in substrate supply after brief anoxia. It has been suggested that after hypoxia in hippocampal slices, glycolysis is inhibited at the hexose phosphorylation reactions due to low ATP concentration (Schurr et al., 1997), but in this study, ATP concentration remained constant. However, the two possible mechanisms of hyperoxidation could be distinguished by the measurement of tricarboxylic acid cycle rate (Mason et al., 1995) or oxygen consumption.
It has been an implicit assumption of many authors that energy metabolism has not been compromised until there is a fall in ATP concentration or a fall in CMRO2. However, from the perspective of bioenergetics, the phosphorylation potential is a better measure of cerebral energy state than ATP concentration or total high-energy phosphate concentration because it represents the free energy available on hydrolysis of ATP that provides the thermodynamic driving force to ensure that ATP-utilising reactions, such as the sodium/potassium pumps, proceed in the forward direction. It has been observed that disturbances in cerebral function occur at higher PaO2 than that known to limit CMRO2(Siesjö, 1978) and that the electrocorticogram becomes isoelectric in adult cats when PCr falls to low levels but when there are no detectable changes in ATP (Gyulai et al., 1987). These observations and the results presented here suggest that falls in ATP concentration or CMRO2 occur late in the hypoxic process and only when the CuA centre is almost fully reduced.
It has been suggested that the term “dysoxia” be used to define conditions in which oxygen availability limits metabolism, in preference to the terms “hypoxia” or “hypoxaemia,” which simply refer to low oxygen or low arterial oxygen tension, respectively (Connett et al., 1990). In terms of energy metabolism, “dysoxia” could be defined as a fall in the phosphorylation potential rather than a fall in ATP or CMRO2, and the results from this study suggest that the CuA signal from NIRS would be a good indicator of this definition of dysoxia during hypoxaemia. However, Eq. 1 shows that the oxidation state of cytochrome c and the CuA centre of cytochrome oxidase can also be affected by activation or inhibition of the tricarboxylic acid cycle, which would lead to changes in the redox potential of NADH and parallel changes in the redox potential of CuA at constant electrochemical potential; such changes may occur during hypercapnia, when there is a fall in the concentration of tricarboxylic acid cycle intermediates (Siesjö, 1978).