
Abstract
Clinicians lack a practical method for measuring CBF rapidly, repeatedly, and noninvasively at the bedside. A new noninvasive technique for estimation of cerebral hemodynamics by use of near-infrared spectroscopy (NIRS) and an intravenously infused tracer dye is proposed. Kinetics of the infrared tracer indocyanine green were monitored on the intact skull in pigs. According to an algorithm derived from fluorescein flowmetry, a relative blood flow index (BFI) was calculated. Data obtained were compared with cerebral and galeal blood flow values assessed by radioactive microspheres under baseline conditions and during hemorrhagic shock and resuscitation. Blood flow index correlated significantly (rs = 0.814, P < 0.001) with cortical blood flow but not with galeal blood flow (rs = 0.258). However, limits of agreement between BFI and CBF are rather wide (± 38.2 ± 6.4 mL 100 g−1 min−1) and require further studies. Data presented demonstrate that detection of tracer kinetics in the cerebrovasculature by NIRS may serve as valuable tool for the noninvasive estimation of regional CBF. Indocyanine green dilution curves monitored noninvasively on the intact skull by NIRS reflect dye passage through the cerebral, not extracerebral, circulation.
Keywords
Adequate cerebral perfusion is a prerequisite for intact neuronal activity and is generally maintained by the autoregulation of the cerebral circulation. Critical reduction of CBF causes regional or global cerebral ischemia and constitutes a threat to the survival of brain tissue. Despite its crucial prognostic and diagnostic relevance, clinicians lack a practical method for measuring CBF rapidly, repeatedly, and noninvasively at the bedside. Conventional methods using 133Xe (Veall, 1969) or 85Kr (Ingvar and Lassen, 1962), computed tomography (Meyer et al., 1980), positron emission tomography (Raichle et al., 1976; Frackowiak et al., 1980; Phelps et al., 1981), single photon emission computed tomography (Uszler et al., 1975; Lassen et al., 1988), and perfusion magnetic resonance imaging (Singer and Crooks, 1983; Hossmann and Hoehn-Berlage, 1995; Wittlich et al., 1995) involve ionizing radiation and use of complex technical equipment not readily available for all diagnostic units or at bedside.
Since its first description in 1977 by Jöbsis, near-infrared spectroscopy (NIRS) has become an extensively used noninvasive method for monitoring the changing levels of chromophores in the brain, namely, oxygenated and deoxygenated hemoglobin and cell-oxidized cytochrome aa3 (McCormick et al., 1991; Kirkpatrick et al., 1995). Near-infrared light, in the spectral range of 700 to 1,000 nm, can penetrate tissue much deeper than visible light, up to 6 cm of muscle (van der Zee et al., 1992). However, contributions of galeal versus cerebral tissue to the NIRS signal detected on the intact skull are still unclear (Germon et al., 1995).
Near-infrared spectroscopy also enables detection of other chromophore tracers with absorption properties in the near-infrared spectrum. Indocyanine green (ICG) elicits an absorption peak at 805 nm (Landsman et al., 1976) and, following intravenous infusion, is restricted to the intravascular compartment (Cherrick et al., 1960) by >95% binding to plasma proteins (Muckle, 1976). This enables monitoring of the passage of an injected ICG bolus through the cerebral vasculature by NIRS (McCormick et al., 1992). Moreover, its rapid clearance from blood by hepatic uptake and biliary excretion makes ICG a suitable tracer for repetitive measurements even at short intervals without accumulation of dye (Haller et al., 1993).
Recently Roberts et al. (1993) proposed a new method for noninvasive measurement of CBF based on monitoring ICG kinetics in the cerebrovasculature by NIRS and Fick's principle. However, this approach has not been validated by a standard reference method and requires implantation of a fiberoptic dye dilution catheter into a main artery. Thus, the method appears unsuitable for rapid noninvasive estimation of CBF at the bedside.
In 1985 Perbeck et al. (1985b) developed a method called fluorescein flowmetry for measurement of relative blood flow in the intestine by intravital fluorescence microscopy. In fluorescein flowmetry, blood flow is expressed as an index representing the ratio between the maximum fluorescence obtained during the first circulatory passage of an intravenously infused bolus of the fluorescent chromophore sodium fluorescein and the rise time, defined as the time interval between 10 and 90% of the maximum fluorescence.
To establish a new method for the rapid noninvasive measurement of regional CBF, we applied the mathematical model used in fluorescein flowmetry on the first circulatory passage of an ICG bolus through the porcine cerebral vasculature as monitored by NIRS. Data obtained were compared with cerebral and galeal blood flow values assessed simultaneously by a radioactive microsphere reference sampling technique. To test the novel technique under both physiological and pathophysiological conditions, measurements were performed during baseline and in a model of coronary stenosis and hemorrhagic shock with subsequent resuscitation.
METHODS
Animal preparation
Experiments were performed in eight farm-bred pigs of either sex (24.3 ± 0.8 kg body wt). All animals received care in accordance with the “Guide for the Care and Use of Laboratory Animals” (NIH publication no. 85-23, rev. 1985). The study was approved by the animal care and use committee of the local government authorities (Regierung von Oberbayern).
Anesthetic protocol and surgical preparation were performed as previously described by Welte et al. (1997). In brief, following premedication by intramuscular injection of azaperone 6 to 8 mg/kg (Stresnil; Janssen, Neuss, Germany), ketamine 2.5 to 3.5 mg/kg (Ketavet; Parke-Davis, Berlin, Germany), and atropine 0.02 to 0.05 mg/kg (B. Braun, Melsungen, Germany), anesthesia was induced by intravenous application of pentobarbital 8 to 10 mg/kg (Nembutal; Ceva, Bad Segeberg, Germany) and fentanyl 5 to 10 μg/kg (Janssen, Neuss, Germany) and maintained by continuous infusion of pentobarbital 1.5 mg/kg/min, fentanyl 20 μg/kg/min, and pancuronium 0.15 mg/kg/min (Curamed Pharma, Karlsruhe, Germany).
After endotracheal intubation, the animals were mechanically ventilated (Servo 900B; Siemens-Elema, Solna, Sweden) at a rate of 12 breaths/min and an inspired O2 fraction (Fi
A fluid-filled catheter (Leader Cath G18; Vygon, Econen, France) was advanced into the descending aorta via the left femoral artery for continuous measurement of aortic pressure (AP) and heart rate (HR) and for arterial blood sampling. Large-bore catheters were placed into the inferior vena cava via the right femoral vein for withdrawal of venous reference sample and into the superior vena cava via the right internal jugular vein for intravenous administration of ICG. A pigtail catheter (7F; Cordis Corp., Miami, FL, U.S.A.) was positioned in the descending aorta via the right femoral artery for withdrawal of arterial reference sample, and a sidewinder catheter (6F; Cordis Corp.) was passed into the left atrium via the right carotid artery for injection of microspheres. Through a minilaparotomy, a Foley catheter was inserted into the urinary bladder. After midline sternotomy, the pericardium was opened and an ultrasonic flow probe (14-mm diameter; Transonic, Ithaca, NY, U.S.A.) was implanted around the root of the aorta for continuous registration of cardiac output (CO). The proximal left anterior descending artery (LAD) was dissected for placement of an ultrasonic flow probe, and two thin Teflon-coated wires were placed around the LAD distal to the flow probe. The more proximal of these two wires was subsequently connected to a micrometer screw to produce a stable degree of coronary stenosis. The distal wire served as constrictor to test the hyperemic response to short-lasting total coronary blood flow obstruction. All measurements were performed with animals in the supine position.
Radioactive microsphere method
Regional CBF was measured using radioactively labeled microspheres (Heyman et al., 1977) with diameters of 15.5 ± 0.1 μm (NEN-TRAC; DuPont, Wilmington, DE, U.S.A.) suspended in 0.9% NaCl/0.1% Tween. Total number of injected microspheres was chosen to be in a range that causes no disturbances of CBF (unpublished data). The 5 × 10⁶ radioactively labeled microspheres from the stock solution were suspended in 10 mL normal saline, agitated in an ultrasonic bath and vortex mixer to ensure disaggregation of particles, and injected into the left atrium over a 50-second interval, while reference samples of arterial and venous blood were drawn (6.47 mL/min for 3 minutes, starting 10 seconds before the injection) from the abdominal aorta and inferior vena cava, respectively (Harvard Apparatus, South Natick, MA, U.S.A.). During injection, the vial containing the microspheres was continuously agitated to prevent settling of the latter. To avoid hypovolemia caused by reference sampling, the amount of blood withdrawn was simultaneously replaced by intravenous infusion of normal saline. Microsphere injections were repeated one to four times using five different radionuclides in random sequence for each injection (141Ce, 114In, 95Nb, 46Sc, 85Sr). No cardiorespiratory changes were noted after injection of microspheres.
After killing of the animals by intravenous injection of saturated potassium chloride and subsequent craniotomy, the galea in between the two NIR optodes (see below), the entire brain, as well as the kidneys were carefully removed and fixed in 10% formaldehyde for 4 to 5 days. Following fixation, brains were divided into cerebellum and six coronary slices each were dissected further into cortical gray matter, white matter, basal brain regions, and basal ganglia for each hemisphere. Specimens were weighed, and the spectral radioactivity of each nuclide assumed to be linearly proportional to number of microspheres was quantified in each tissue sample as well as in arterial and venous reference blood samples. Spectral activity was assessed over a 360-second period in a 1,024-channel gamma-counter (model 5650; Packard Instruments, Downers Grove, IL, U.S.A.) with a 3-in NaJ (TI) detector connected to a multichannel analyzer (series 35plus MCA; Canberra Industries, Meriden, CT, U.S.A.). The software program MIC III (Gross et al., 1990) allowed for separation of the gamma spectra as well as data management and calculation of specific blood flow values. Before each animal's tissue samples were counted, the correct position of the gamma peak of a Cs standard was documented, and standards of the isotopes used in the experiment as well as four blank probes were counted. This information was used by MIC III to deconvolute gamma spectra emitted by organ samples and to correct for background activity. Sample blood flow was calculated for each nuclide as
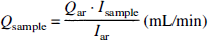
where Qar is the rate of withdrawal of arterial reference blood, Iar is counts/min in arterial reference blood, and Isample is counts/min in tissue sample. Sample flow was normalized to 100 g tissue weight. To evaluate methodological error (Buckberg et al., 1971), the number of microspheres per tissue sample was calculated using the specific activity per microsphere. This was determined by assessing the activity of a specimen with a defined number of microspheres of each label. For this purpose, microsphere suspension was spread on 1 cm2 of drawing paper fixed onto a microscopic slide. The microspheres were counted three times by microscopic examination by different persons, and the results were accepted if the difference between counts did not exceed 1% and microsphere counts were between 600 and 1,000. The gamma activity of specimens was counted for 20 minutes, and the resulting value was divided by the number of microspheres.
Regression analysis was applied to blood flow values calculated for left and right kidney for internal control of validity and reproducibility of the microsphere technique applied. The regression line passed through the origin with a Pearson product-moment correlation of r = 0.999 (P < 0.0001), and flow values were within the 95% confidence interval.
Near-infrared spectroscopy
Kinetics of the tracer substance ICG (ICG-Pulsion; Pulsion Medical Systems, Munich, Germany) were monitored on the intact skull by NIRS. The spectrometer employed (NIRO 500; Hamamtsu Photonics, Herrsching, Germany) uses pulsed laser diodes generating near-infrared light at four distinct wavelengths (775, 825, 846, and 905 nm), which was transmitted via a fiberoptic bundle to an optode placed rostrally on the pig's left forehead. Scattered light was collected by a second optode placed temporoparietally on the ipsilateral side at a distance of 2.7 ± 0.1 cm. Following amplification of the scattering light signal by a photomultiplier tube, attenuation of light in tissue was assessed for each of the four wavelengths applied.
Simultaneously to each microsphere injection, ICG 0.1 mg/kg diluted in aqua ad injectabilia (2 mg/mL) was injected (5 mL/s) by means of an injector device (Injector ZI-03; Pulsion Medical Systems) as bolus into the superior vena cava. From 5 minutes before to 15 minutes past dye administration, changes of attenuation of scattered light were detected continuously for each laser wavelength at a maximum sampling frequency of 2 Hz. Data were displayed graphically on a monitor and transferred in real-time to a portable PC (220CDT; Toshiba, Neuss, Germany).
Data analysis
Concentration of chromophore in tissue was calculated from attenuation of light according to modified Lambert-Beer law (Edwards et al., 1993) as

where OD is the attenuation of light expressed as optical density, α is the specific extinction coefficient of the chromophore [(mmol/L)−1 cm−1], c the concentration of chromophore in tissue (mmol/L), d is the geometrical distance between point of light entry and point of light exit (cm), B is the differential pathlength factor taking into account the increased optical path due to scattering of light in tissue and enabling calculation of the true optical distance in between the two optodes defined as “differential path length,” and G is an additive term due to scattering losses of light.
In tissue containing several different chromophores, except at very high concentrations not usually met in biological media, the overall absorption coefficient αc is the linear sum of the contributions of each compound (Wray et al., 1988):

The spectrometer employed (NIRO 500) allows for simultaneous determination of the concentrations of three different chromophores within tissue. Biological tissues have a variety of physiological chromophores that exhibit absorption properties in the near-infrared spectrum. Nevertheless, most of these compounds, e.g., lipids or melanin, can be thought of as constant during the time course of measurement. However, oxygen saturation may vary, and as hemoglobin absorbs near-infrared light in dependence of its oxygenation status, both oxygenated hemoglobin as well as deoxyhemoglobin have to be taken into account. Thus, the specific absorption coefficients of oxyhemoglobin, hemoglobin, and ICG (Table 1) were applied to the modified Lambert-Beer law, and the concentration of each single compound in tissue was calculated from the simultaneous equations for each wavelength applied using matrix inversion (Wray et al., 1988).
Specific extinction coefficients of chromophores [(mmol/L)−1 · cm−1]
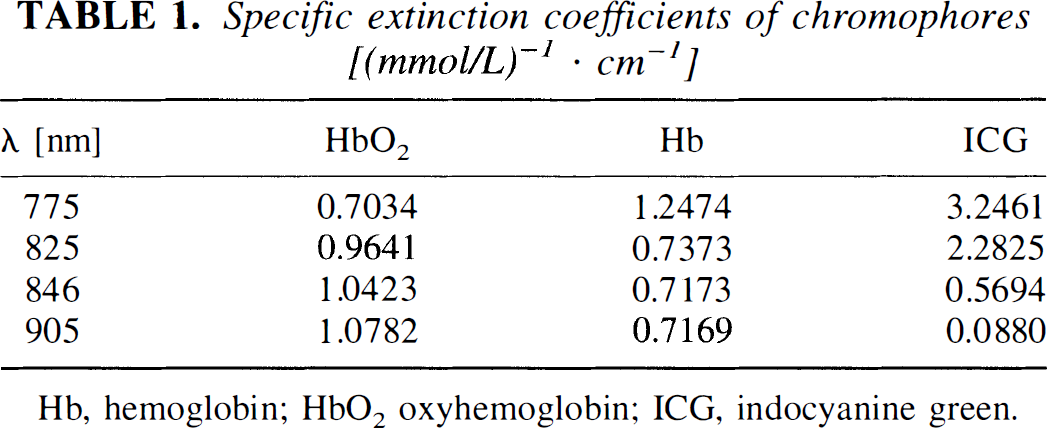
Hb, hemoglobin; HbO2 oxyhemoglobin; ICG, indocyanine green.
The differential pathlength factor B was assumed to be 5.93 as determined for human adult head by time-of-flight measurement of an ultrashort optical pulse through the tissue (van der Zee et al., 1992). As the additive factor G, representing scattering losses of light, is unknown, absolute concentrations of chromophores cannot be calculated from measurement of absolute attenuation. However, changes in chromophore concentration can be calculated from attenuation changes if G is considered to remain constant throughout the measurement (Elwell, 1995):

In contrast to oxygenated hemoglobin or deoxyhemoglobin, the tricarbocyanine chromophore ICG is no physiological component of tissues. Thus, measurements in tissue before intravenous administration of ICG reflect background activity, and ICG concentrations measured subsequently following intravenous bolus injection of the dye can be expressed in absolute values (mg ICG/100 g tissue).
For each intravenous bolus injection of ICG, a blood flow index (BFI) was determined from the dye kinetics detected by NIRS according to an algorithm established by Perbeck et al. (1985b) for estimation of blood flow by fluorescein flowmetry. The authors developed a method for measurement of relative blood flow in intestinal capillaries by use of sodium fluorescein as tracer substance.
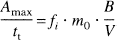
According to the Sapirstein bolus fraction principle (1956), for any time t ≤ Tmax, the tissue receives the same fraction of cardiac plasma output as the fraction of bolus is received:

where fi is the plasma flow to the tissue, CPO is cardiac plasma output, Amax is maximal signal, Tmax is time for maximal signal, m0 is bolus injected, and B is the efficiency of the detector.
The mean transit time of the entire circulation tt is the ratio of the volume of tracer distribution (V = plasma volume) and the cardiac plasma output (Lassen and Perl, 1979):

Thus, it follows from Eqs. 5 and 6,
If plasma volume V, injected tracer amount m0, and detector efficiency are considered to remain constant, fi can be calculated in relative terms as

Provided that vascular geometry is constant, mean transit time tt determines dispersion of an administered tracer bolus and thus dispersion time td. With good approximation, td can be calculated from the rise time tr defined as time interval between 10 and 90% of the maximal signal (Perbeck et al., 1985b), thereby eliminating the need for exact temporal definition of the start and end of tracer washin. As only a relative measure is derived, blood flow in arbitrary units of ICG concentration per second can be estimated as

where fi′ is proportional to fi, or, respectively, as
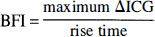
Blood flow index is only a relative measure of blood flow as all constants have been excluded from calculation; i.e., it is proportional to flow with an unknown factor of proportionality.
For determination of maximum ΔICG, background was calculated as mean of 10 values preceding signal rise and subtracted from maximum ICG signal.
Experimental protocol
The experimental protocol was performed as recently described by Welte et al. (1997). In brief, after termination of the surgical preparation, baseline values were recorded when AP, HR, and CO had been stable for at least 30 minutes. Following baseline recordings, critical LAD stenosis was induced by tightening the micrometer-controlled constrictor until the hyperemic response was completely abolished without impairing resting flow. After 10 to 15 minutes of stable LAD flow, measurements of BFI and CBF were repeated and hemorrhagic shock was induced by withdrawal of blood. Aortic pressure was reduced to 45 to 50 mm Hg within 15 minutes and then maintained at this level for 60 minutes by further withdrawal or retransfusion of blood before measurements were repeated again. Seventy-five minutes after induction of hemorrhagic shock, resuscitation was started by intravenous infusion of hypertonic 7.2% saline/10% Dextran 60 (10% of the shed blood volume within 2 minutes; Schiwa GmbH, Glandorf, Germany). Thirty minutes after primary therapy, fluid resuscitation was continued with 6% Dextran 60 (10% of shed blood volume), and BFI and CBF were determined again 60 minutes after start of resuscitation. As two of eight animals died due to ventricular fibrillation following induction of LAD stenosis (only baseline values) and hemorrhagic shock (recordings under baseline conditions and LAD stenosis), respectively, the total number of measurements amounted to 27.
Statistics
All data are given as means ± SD. Data were analyzed statistically for differences between repeated measurements and baseline with the Friedman repeated measures analysis of variance on ranks. For detection of differences between hemispheres, the Wilcoxon matched pairs signed rank test was applied. For evaluation of relationship between CBF as measured by radioactive microsphere method and BFI as calculated from NIRS data, Spearman's coefficient of correlation was used. Agreement between the two methods was assessed according to Bland and Altman (1986) and bias, precision of estimated limits of agreement, as well as relation between differences and mean values were determined. Statistical significance was assumed at P < 0.05.
RESULTS
Macrohemodynamics and arterial blood gases
Macrohemodynamic data and arterial blood gases during baseline, LAD stenosis, hemorrhagic shock, and resuscitation are presented in Table 2. Induction of the critical LAD stenosis had no effect on central hemodynamics. Hemorrhage to AP of 48.8 mm Hg increased HR by 61.5% and reduced CO by 49.0% from baseline values, respectively. Sixty minutes after primary resuscitation, AP and CO were still reduced by 34.3 and 30.3%, respectively, and HR was elevated by 49.8% as compared with baseline values. Arterial blood gases did not change significantly throughout the experiments.
Macrohemodynamics and blood gases
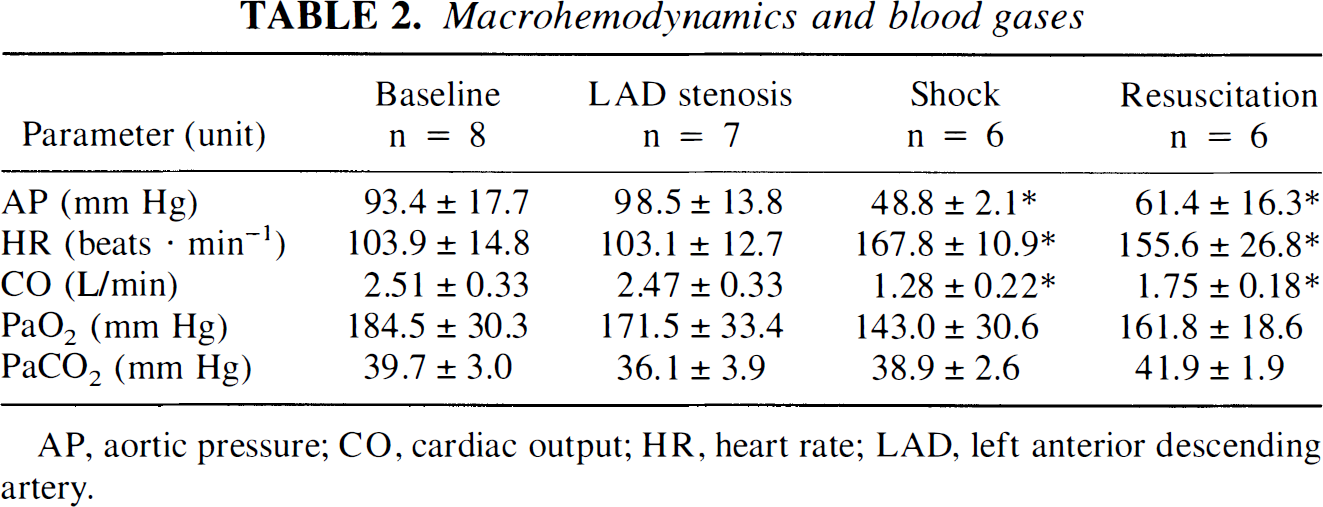
AP, aortic pressure; CO, cardiac output; HR, heart rate; LAD, left anterior descending artery.
Radioactive microsphere method
Porcine brains (78.6 ± 6.5 g) were dissected into 46 tissue samples with a mean sample weight of 1.71 ± 0.84 g (range 0.54 to 3.93 g). Mean number of microspheres per tissue sample was 2,235 ± 41.5 for each nuclide with a minimal number of 432. Arterial blood samples contained 13,859 ± 625 microspheres (minimum 7,454), whereas number in venous blood samples was negligible (123 ± 11 microspheres).
Blood flow data derived from radioactive microsphere technique in porcine cerebral and galeal tissue situated in between the two NIR optodes, respectively, are presented in Table 3. Blood flow in cerebrum as well as galea did not reveal significant changes throughout experiments. Following hemorrhage, blood flow increased in all cerebral structures assessed without reaching significance.
Cerebral and galeal blood flow and blood flow index
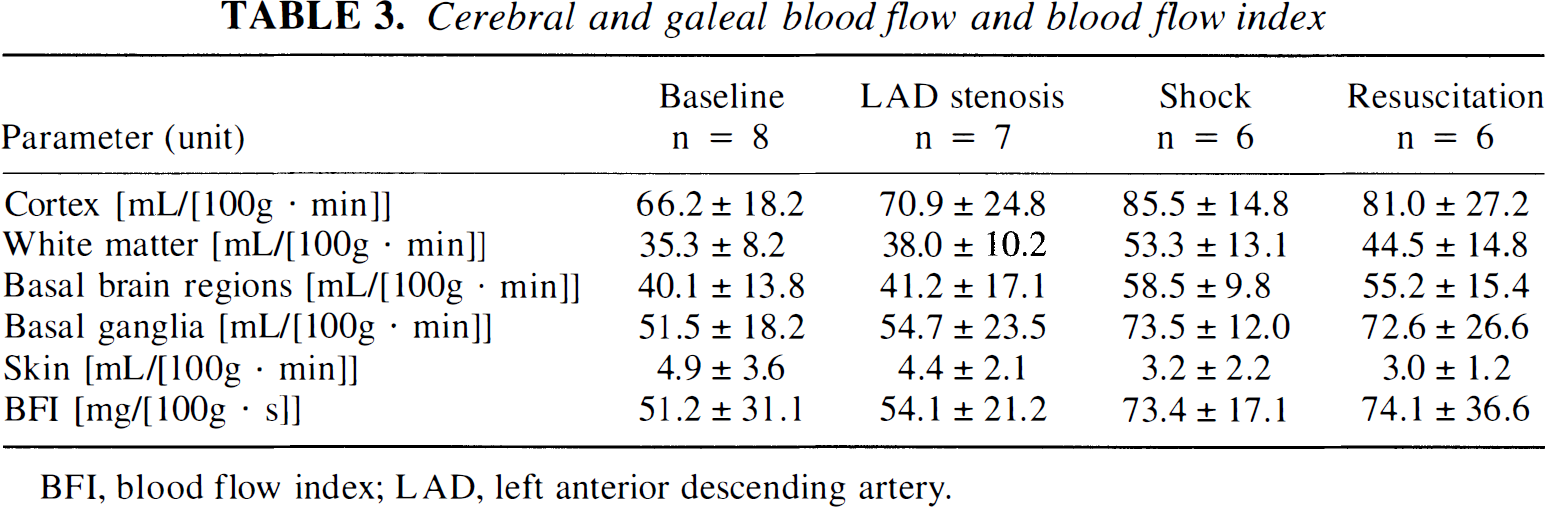
BFI, blood flow index; LAD, left anterior descending artery.
Near-infrared spectroscopy
First circulatory passage of an ICG bolus infused into the superior vena cava resulted in distinct changes of optical density as detected by NIRS in the intact porcine head. Figure 1 shows an original NIRS recording of the time course of concentration changes for the three chromophores oxyhemoglobin, hemoglobin, and ICG during bolus injection of ICG. Circulatory passage of ICG did not induce changes of oxyhemoglobin or hemoglobin concentrations as calculated from optical densities derived from NIRS. The periodical fluctuations seen in both recordings reflect changes in cerebral blood volume due to respiratory movements at a respiratory rate of 12 breaths/min. However, ICG concentration changed markedly, revealing chromophore kinetics typical for an indicator dilution curve. The dilution curve assessed by NIRS starts with a distinct delay, reflecting passage of the chromophore bolus from the superior vena cava through the pulmonary circulation and left ventricle into the cerebral microcirculation. Recirculation of the tracer bolus can be observed 20 seconds following dye injection.
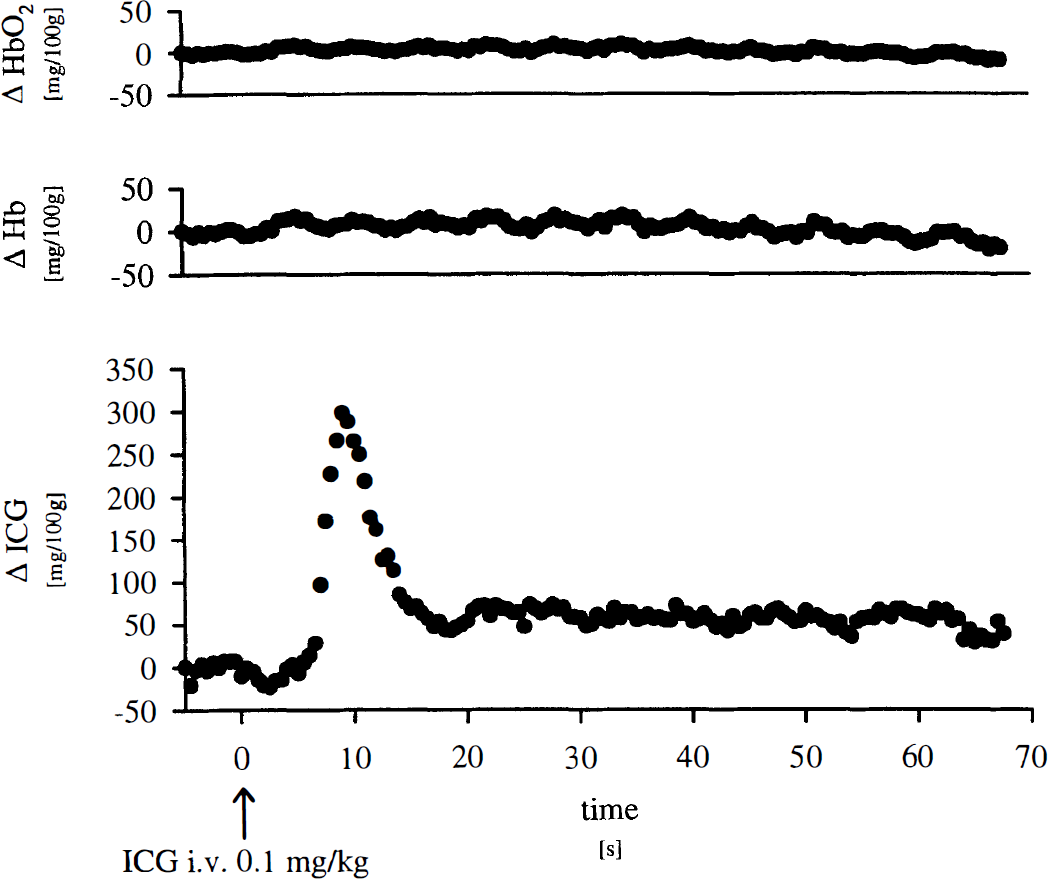
Original near-infrared spectroscopy recording of oxygenated hemoglobin (HbO2), deoxyhemoglobin (Hb), and indocyanine green (ICG) kinetics in porcine head during bolus injection of ICG.
Blood flow index
Blood flow index was calculated for 27 bolus injections of ICG in eight animals. Figure 2 gives an example of BFI calculation in an original recording of ICG kinetics in porcine head as monitored by NIRS. Prior to ICG infusion, the background signal remains relatively constant as compared with maximum signal at 1.8 ± 3.3 mg/100 g (–10.6 ± 8.5 mg/100 g in Fig. 2). Indocyanine green bolus infusion causes a rapid up-slope of the ICG signal up to a mean maximum of 166.7 ± 57.5 mg/100 g (308.6 mg/100 g in Fig. 2) followed by dye washout and recirculation. Rise time, defined as time interval between 10 and 90% of the maximum signal (Perbeck et al., 1985a), was 2.5 seconds for the given example and 3.1 ± 1.5 seconds in overall experiments. Thus, calculated BFIs were 62.8 ± 29.9 mg/100 g/s and 123.4 mg/100 g/s in overall experiments and in the example given, respectively.
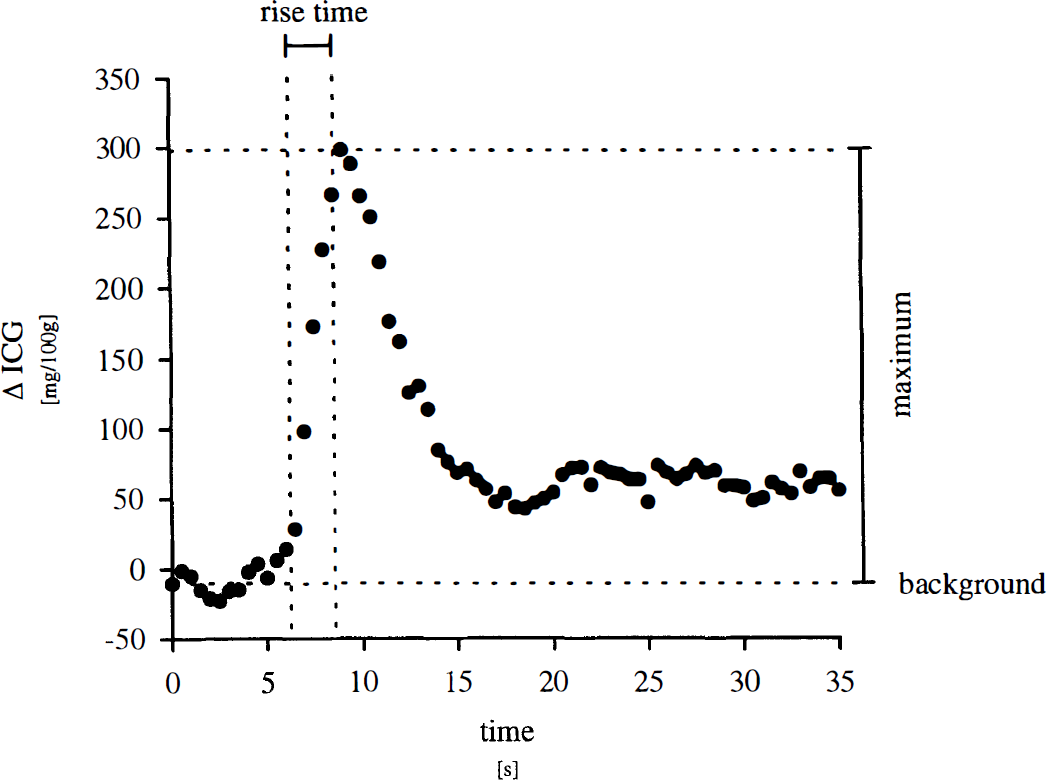
Calculation of blood flow index from indocyanine green (ICG) kinetics monitored in intact porcine head by near-infrared spectroscopy.
Blood flow indexes derived from NIRS recordings did not change significantly throughout the experiments (Table 3). However, following hemorrhage, BFI increased slightly, parallel to changes of cerebral hemodynamics without reaching significance.
Comparison of methods
Blood flow indexes calculated from NIRS data were compared with simultaneous measurement of CBF by radioactive microsphere reference sampling technique. Blood flow index correlated significantly (rs = 0.814, P < 0.001) with CBF values in cortical gray matter between the two optodes as measured by radioactive microspheres (Fig. 3). Coefficient of correlation between CBF values and BFI decreased with increasing tissue depth. Thus, rs was 0.793 for white matter, 0.771 for basal brain regions, and 0.724 for basal ganglia (P < 0.001, respectively). For the entire left cerebral hemisphere, rs was 0.788 (P < 0.001). However, no significant correlation was found between BFI and galeal blood flow in between the optodes (rs = 0.275) (Fig. 4).
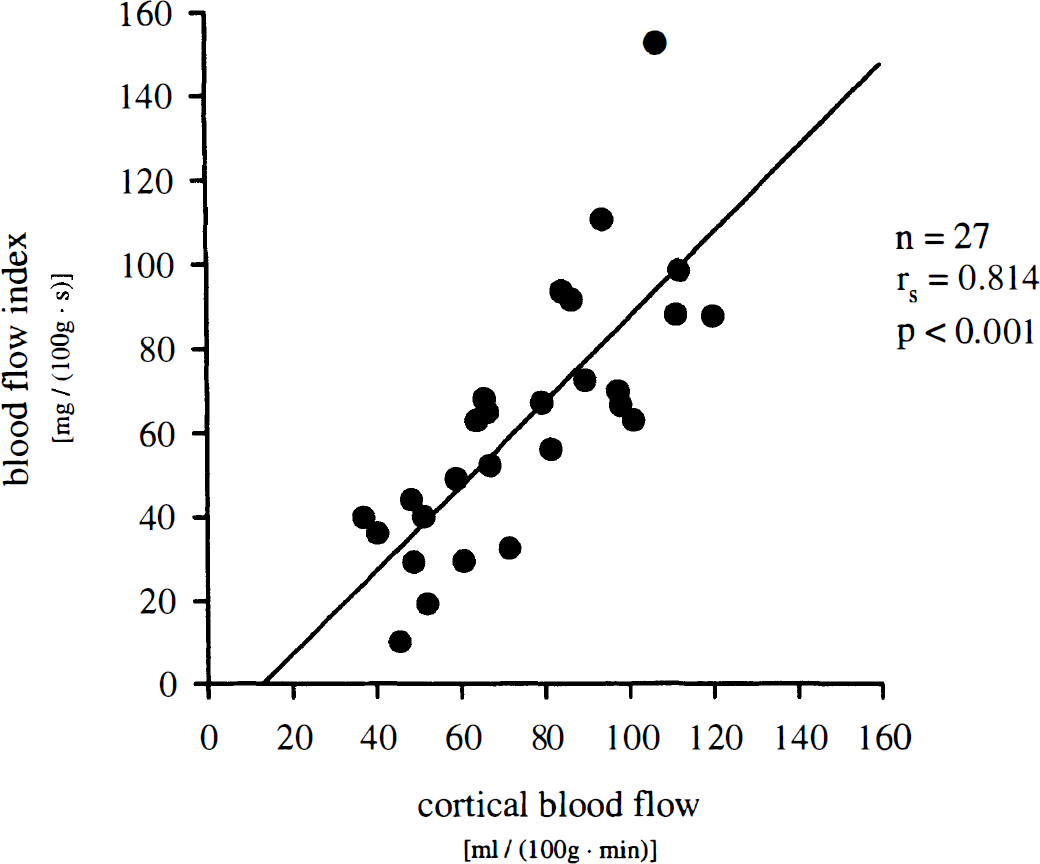
Correlation of blood flow index assessed by near-infrared spectroscopy in intact porcine head and CBF in cortical gray matter as measured simultaneously by radioactive microspheres. rs, Spearman's coefficient of correlation; n = 27 measurements in 8 animals.
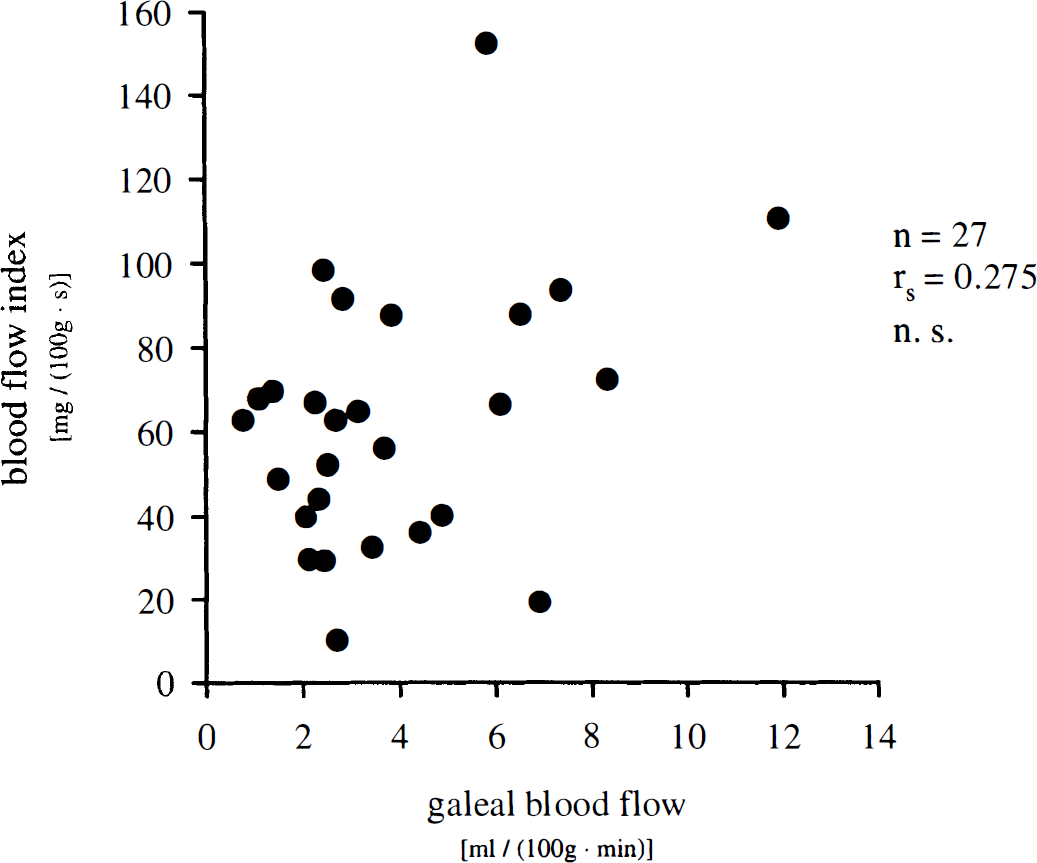
Correlation of blood flow index assessed by near-infrared spectroscopy in intact porcine head and galeal blood flow as measured simultaneously by radioactive microspheres. rs, Spearman's coefficient of correlation; n = 27 measurements in 8 animals.
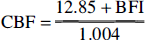
Blood flow index was thus considered to reflect cortical CBF best and not galeal blood flow. Assuming linear correlation, a regression line can be drawn for BFI and cortical blood flow, which may serve for approximate transformation of BFI data into absolute blood flow values and thus enable statistical analysis of agreement between the two methods according to Bland and Altman (1986). The respective regression line follows the equation
Following transformation of BFIs into CBF data according to Eq. 11, agreement between methods can be tested by plotting their difference against their mean (Fig. 5). As the differences did not vary in any systematic way over the range of CBF values assessed, there is no obvious relationship between the measurement error and the true value (rs = −0.230). There is also no relationship (rs = 0.162) between the absolute value of difference and the mean, indicating that scatter of differences reflecting the absolute measurement error does not increase as CBF increases.
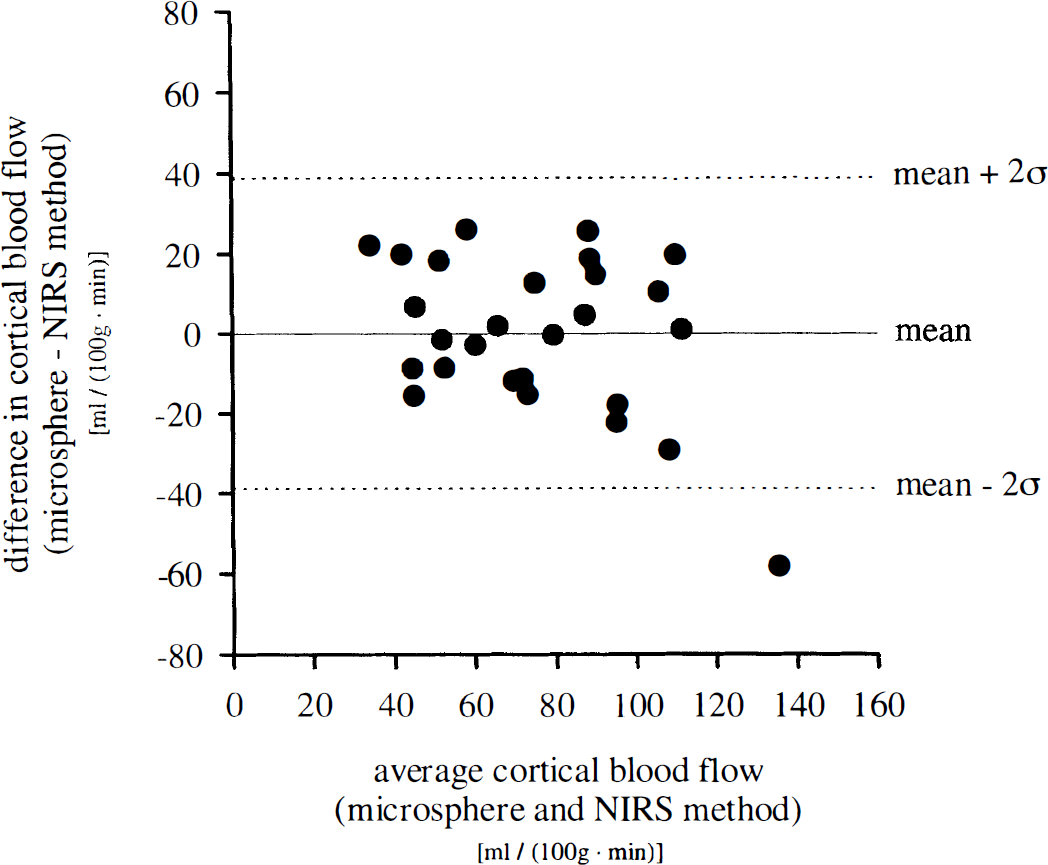
Analysis of agreement according to Bland and Altman (1986) between calculation of blood flow index from near-infrared spectroscopy data and measurement of cortical blood flow by radioactive microspheres. Plot of the difference between the methods against their mean. rs, Spearman's coefficient of correlation; n = 27 measurements in 8 animals; rs = −0.230; not significant.
The bias, estimated by the mean difference ± SE, is 0 ± 3.7 mL 100 g−1 min−1, as it has previously been eliminated by inclusion of an additive term in the transformation according to Eq. 11; 97.6% of differences lie within the interval mean ± 2 SD of differences (± 38.2 ± 6.4 mL 100 g−1 min−1; ± 2σ ± SE of 2σ), indicating normal distribution (Gaussian) of the measurement error. The interval mean ± 2σ of differences is referred to as the “limits of agreement,” indicating that CBF calculation from measurement of BFI and transformation according to regression analysis may be 38 mL 100 g−1 min−1 below or above the CBF value derived from radioactive microsphere measurement.
DISCUSSION
The present study was aimed at developing a new method for the rapid and noninvasive measurement of regional CBF and to test for its validity by comparing it with an established standard reference technique under both physiological and pathophysiological conditions in a model of coronary stenosis and hemorrhagic shock with resuscitation.
The main finding of our study is that a BFI calculated from NIRS recordings of ICG kinetics in porcine head correlated significantly with cortical blood flow as measured by radioactive microspheres. In contrast, BFI did not reveal correlation with galeal blood flow assessed by the microsphere technique. Thus, analysis of ICG kinetics may serve as a useful tool for noninvasive estimation of CBF by NIRS.
Conventional methods for measurement of regional volume flow in the cerebral circulation such as radioactive 85Kr (Ingvar and Lassen, 1962) or 133Xenon (Veall, 1969) washout function, in vivo autoradiography using stable Xe and computed tomography (Meyer et al., 1980), H215O washout function by positron emission tomography (Raichle et al., 1976), 13NH3 uptake by positron emission tomography (Phelps et al., 1981), and H215O delivery by positron emission tomography (Frackowiak et al., 1980), uptake of [123I]4-iodoantipyrine (Uszler et al., 1975) or 99mTc-hexamethyl-propyleneamine oxime (Lassen et al., 1988) by single photon emission computed tomography, as well as the various techniques of perfusion magnetic resonance imaging (Singer and Crooks, 1983; Hossmann and Hoehn-Berlage, 1995; Wittlich et al., 1995) all expose patient and personnel to ionizing radiation and require complex technical equipment not readily available for all diagnostic units or at the bedside. Nitrous oxide inhalation (Kety and Schmidt, 1948) is restricted to measurement of global blood flow, and Doppler ultrasound (Aaslid et al., 1982) assesses flow velocity rather than volume flow.
In a novel approach to overcome these methodological disadvantages and limitations, we monitored the kinetics of an intravenously administered tracer dye through the cerebrovasculature by NIRS and correlated data obtained from dye dilution curves with CBF values assessed by a standard reference method.
Radioactive microsphere method
The radioactive microsphere reference sampling technique (Heyman et al., 1977) served as the standard reference method for measurement of cerebral and galeal blood flow in pigs. To minimize errors in flow measurements, the catheter for microsphere injection was inserted into the left atrium rather than the left ventricle (Heyman et al., 1977) and arterial blood was collected from the abdominal aorta rather than from the ascending aorta (Baer et al., 1984). Baseline CBF in our experiments compares well with previously published data by Moore et al. (1994) and Lindner et al. (1992), who reported on CBF of 51 ± 4 (mean ± SEM) and 50 mL 100 g−1 min−1, respectively. The relatively low CBF in comparison with results assessed by van Woerkens et al. (1992) in the conscious pig may be related to the anesthetic regimen applied, as fentanyl and barbiturates have been described to reduce CBF (Den Boer et al., 1993). High CBF assessed in cortical gray matter and relatively low CBF in white matter reflect the well known high- and low-flow compartments of the brain microvasculature (Ginsberg, 1986; Yonas et al., 1991; Elwell et al., 1993). Ligation of the right carotid artery as applied in our model for introduction of a sidewinder catheter into the left atrium did not affect regional CBF, as no significant difference was detected between hemispheres (left: 59.0 ± 18.9 mL 100 g−1 min−1; right: 60.0 ± 19.4 mL 100 g−1 min−1).
According to Buckberg et al. (1971), the radioactive microsphere method requires a minimal number of 384 microspheres per sample probe to achieve a confidence level of 95% and a precision of 10%. As the mean number of microspheres per sample was 2,235 ± 41.5 for each nuclide with a minimum of 432, these criteria were met in our experiments.
Repeated injections of large numbers of microspheres might compromise CBF due to cumulative occlusion of capillary segments (Del Maestro et al., 1979). Therefore, the total number of microspheres was chosen to be in a range that has previously been demonstrated not to disturb CBF (unpublished data). Moreover, disturbance of tissue blood flow would not compromise the comparison between measurements of CBF by radioactive microspheres and NIRS.
Near-infrared spectroscopy
The first circulatory passage of an ICG bolus injected into the superior vena cava was monitored by NIRS in the intact porcine head. Optodes were fixed in consideration of the porcine anatomy studied in two preceding experiments. Optode placement was limited rostrally by the pig's frontal sinus and caudally by the strong muscular system of the neck, restricting mean optode distance to 2.7 ± 0.1 cm. This distance appears satisfactory, as van der Zee et al. (1992) have reported differential pathlength factor B to be almost constant beyond 2.5 cm of interoptode spacing in all tissues examined. Hongo et al. (1995) reported that detection of a substantial absorption signal is reliable for interoptode spacing of ≥2.5 cm in adult humans. On the other hand, a rather small distance between optodes may provide a higher spatial resolution and thus allow for regional measurement of CBF (McCormick et al., 1992). Interoptode spacing was nearly constant throughout experiments, taking into account that with separation of light source and detector penetration, depth of photons (Bonner et al., 1987; Cui et al., 1991) as well as light absorption by an intraarterially administered ICG bolus increase (Hongo et al., 1995). For calculation of light attenuation (optical density) according to Eqs. 2 to 4, the differential pathlength factor B for the organ of interest must be known. As determinations of differential pathlength factors by time-of-flight measurement (Delpy et al., 1988) or by intensity-modulated optical spectroscopy (Arridge et al., 1992) both require a complex experimental setup and have not been performed for porcine head yet, we used values reported for human adult head (van der Zee et al., 1992) in our experiments. Though this may not be the accurate value for calculation of optical pathlength in pig, it does not compromise the results of our study, as the latter was aimed at investigating the correlation between two methods of measurement rather than presenting absolute data. However, it restricts application of Eq. 11 for transformation of BFI into CBF data to measurements in porcine head.
Cui et al. (1991) have described the mean path of near-infrared photons through turbid biological media when both source and detector are in the same plane by a “banana shape” with ends connecting the source and detector and the middle portion penetrating deepest into tissue. Van der Zee et al. (1992) reported penetration of near-infrared light up to 6 cm in muscle, and Hongo et al. (1995) as well as McCormick et al. (1992) differentiated between intra- and extracranial components of NIRS signal by ICG injections into the internal and/or external carotid arteries. McCormick et al. (1992) recorded a tracer bolus washing into and out of the cerebrovascular bed with a 2.7-cm source-receiver separation distance following ICG injection into the internal carotid artery in humans and concluded that near-infrared light can penetrate living human scalp and skull, undergo attenuation in the vascular compartment, and manifest this attenuation as an altered transmission intensity. This is in accordance with theoretical analyses and modeling paradigms predicting infrared light transmission through the living human scalp, calvaria, and brain (Chance et al., 1988; Delpy et al., 1988).
However, although there is little doubt that NIRS can detect changes in cerebral optical properties, it has not been demonstrated so far that these changes can be reliably distinguished from changes in extracerebral tissue (Germon et al., 1995). Kirkpatrick et al. (1995) indeed found a marked response of the NIRS signal to clamping of the internal carotid artery but not of the external carotid artery and concluded that NIRS registers rapid changes of cerebral oxygenation during carotid endarterectomy. However, these results may also be explained by contribution of the internal carotid artery to the blood supply of the extracerebral tissues and thus are no direct proof that signals detected by NIRS reflect processes in cerebral rather than extracerebral tissue (Germon et al., 1995). In fact, Harris et al. (1994) have demonstrated that the NIRS signal is extremely sensitive to changes in extracerebral oxygenation. Though bone itself shows little general absorption in the near-infrared region (Elwell, 1995), blood flow through the galea and skull has carefully to be taken into account when tracer kinetics obtained from intact head by NIRS are interpreted.
The study presented is the first one providing direct proof that signals recorded by NIRS reflect cerebral rather than extracerebral phenomena. Tracer kinetics of an intravenously injected ICG bolus recorded on the intact porcine head by NIRS correlate significantly with CBF measured in cerebral cortex by radioactive microspheres but not with galeal blood flow. This result is in accordance with the theoretical considerations of McCormick et al. (1992) who calculated, based on computer modeling studies (Nossal et al., 1989), a cerebral penetration depth of 1.2 to 2.0 cm for an interoptode spacing of 2.7 cm.
Though this result cannot be directly transferred to measurements of oxygenation by NIRS in humans, it gives strong hints that these signals reflect cerebral rather than extracerebral oxygenation provided interoptode spacing exceeds 2.5 cm.
Indocyanine green
The tricarbocyanine chromophore ICG strictly confined to the intravascular compartment was used as hemodynamic tracer. The detectability of ICG kinetics in human and feline head, respectively, by NIRS has previously been reported by several investigators (Proctor et al., 1984; McCormick et al., 1992; Roberts et al., 1993; Hongo et al., 1995). McCormick et al. (1992) calculated a signal-to-noise ratio for detection of ICG in the cerebrovasculature of >100:1, signal being defined as the maximum increase in optical density associated with ICG infusion and noise as the peak-to-peak baseline optical density oscillation. In our experiments signal-to-noise ratio was lower (47.3 ± 3.2:1), which may be attributed to the prolonged dye passage between site of injection (superior vena cava versus internal carotid artery) and region of interest (cerebrovasculature), but still allowed for clear identification of indicator dilution curves (Figs. 1 and 2).
The use of ICG as tracer to monitor cerebral hemodynamics has several practical advantages. The dye is well known for its use in determination of CO (Fox et al., 1957) and in choroidal angiography (Kogure and Choromokos, 1969). It is nontoxic (Fox and Wood, 1960), and serious adverse reactions are extremely rare (Carski et al., 1978; Speich et al., 1988; Benya et al., 1989), though it may interfere with thyroid function studies due to the presence of iodide in the dye (Fox and Wood, 1960).
ICG is completely excreted by the liver (Wheeler et al., 1958) and is cleared from the human circulation with a half-time of 3.2 ± 0.6 to 3.4 ± 0.7 minutes (Haller et al., 1993). Maximal daily dosage should not exceed 5 mg/kg (product information ICG-Pulsion; Pulsion Medical Systems). This allows for up to 50 repetitions of tracer injection per day at the given dosage of 0.1 mg/kg; however, dye clearance may be prolonged in patients with impaired hepatic function (Cherrick et al., 1960). For quantitative analysis of dye kinetics, it is essential that the spectral absorption characteristics of the dye follow Beer's law. As this law applies only to solutions of indicator in homogeneous fluids, linearity is not completely achieved when optical density is related to dye concentration in whole blood (Fox and Wood, 1960), but as deviation from Beer's law is minor, it is unlikely to introduce significant errors into quantitative detection of ICG kinetics by NIRS.
Estimation of cerebral hemodynamics from ICG kinetics monitored by NIRS has previously been proposed by various authors. Ferrari et al. (1989) calculated mean cerebral transit time from ICG clearance curves monitored by NIRS and compared data obtained with CBF assessed by the radioactive microsphere technique. Colacino et al. (1981) also assessed mean transit time from ICG clearance curves according to Zierler (1965) by the height-over-area technique. Assuming a constant cerebral blood volume in duck's head of 3 ml/100 g, Colacino et al. estimated CBF as ratio of cerebral blood volume to mean transit time. However, as demonstrated by Ferrari et al. (1989), when cerebral perfusion pressure falls below 40 mm Hg, metabolic factors will dilate cerebral vessels that become pressure passive and cerebral blood volume will increase. Thus, calculation of mean transit time from ICG clearance curves monitored by NIRS may serve as valuable tool for estimation of cerebral hemodynamics but does not necessarily reflect CBF.
Roberts et al. (1993) proposed a method for measurement of CBF by means of NIRS and ICG based on Fick's principle. This concept had previously been established by Edwards et al. (1988, 1993) using oxygenated hemoglobin as tracer substance. However, in a recent study in dogs, this technique has been shown to be inaccurate when compared with other accepted techniques such as the radioactive microsphere or venous outflow techniques (Newton et al., 1997). Conclusively, though ICG kinetics in the cerebrovasculature were monitored by NIRS in a variety of studies, a valid technique for estimation of CBF by NIRS and ICG has not been presented yet.
Blood flow index
From tracer kinetics in porcine head recorded by NIRS, a BFI was calculated according to an algorithm established by Perbeck et al. (1985b) for estimation of blood flow by fluorescein flowmetry (Eq. 10).
Fluorescein flowmetry was validated by comparison with 133Xe clearance and electromagnetic blood flowmetry (Perbeck et al., 1985a) as well as with 113Sn radioactively labeled microspheres and 86Rb chloride (Kumlien and Perbeck, 1986). In infrared videoangiofluorographic studies of the skin using ICG as tracer dye (Rübben et al., 1994), time to achieve maximum signal intensity (tr) has also been reported to depend on blood flow.
Fluorescein flowmetry was originally developed by Perbeck et al. (1985b) for use of a diffusible tracer, e.g., sodium fluorescein. However, as demonstrated in Eqs. 5 to 9, the underlying mathematical concept can be transfered to use of a strictly intravascular dye, e.g., ICG, as changes of maximum signal and rise time, respectively, will go parallel for use of both a diffusible or a strictly intravascular dye.
Cerebral blood flow and blood flow index in model of LAD stenosis and hemorrhagic shock with resuscitation
Cerebral blood flow as well as BFI were assessed by radioactive microspheres and NIRS, respectively, under both physiological and pathophysiological conditions in a porcine model of coronary stenosis and hemorrhagic shock with resuscitation. Hemorrhagic shock is known to alter cerebral hemodynamics in dependence on its severity. Whereas CBF remains unchanged (Härtl et al., 1995) or even increases in less severe hemorrhage (Waschke et al., 1996), it may decline in severe hemorrhage despite the well developed autoregulatory mechanisms of the cerebrovasculature (Prough et al., 1991) and thus impair vital cerebral functions. However, following resuscitation with hypertonic saline, CBF may be restored and even exceed baseline values (Prough et al., 1991).
In the applied model of successive LAD stenosis, hemorrhagic shock, and resuscitation established by Welte et al. (1997), CBF did not change significantly throughout experiments within all cerebral structures assessed, indicating intact cerebrovascular autoregulation. Following hemorrhage, a slight increase of CBF was observed, which is in accordance with previous findings of Waschke et al. (1996) in less severe hemorrhage in rats. As previously described, following resuscitation with hypertonic 7.2% saline/10% Dextran 60, CBF is elevated above baseline values (Kreimeier et al., 1990) but does not exceed CBF under conditions of shock if cerebrovascular autoregulation is still intact (Härtl et al., 1995).
Though the experimental protocol applied in this study induced significant changes of neither CBF nor BFI, it can be stated that the indicated changes of these two parameters following induction of hemorrhage paralleled each other.
Comparison of methods
Blood flow index correlated significantly with CBF in brain cortex as measured by the radioactive microsphere technique. Thus, estimation of blood flow from cerebrovascular tracer kinetics recorded by NIRS appears to be a new promising approach for noninvasive measurement of regional CBF. This concept not only holds true under physiological conditions, but may also be applied under pathophysiological conditions, e.g., hemorrhagic shock.
Linear correlation of BFI versus CBF assessed by radioactive microspheres reveals an offset on the abscissa of 12.8 mL 100 g−1 min−1, indicating minimal CBF required for quantification of BFI from NIRS recordings of ICG kinetics (Fig. 3 and Eq. 11).
Use of Algorithm 11 derived in the present study for transformation of BFI into CBF data is restricted to studies in porcine head and cannot be transferred to other species or organs. At this early stage, estimation of blood flow by calculation of BFI may detect changes of CBF within single individuals but does not provide absolute CBF values.
The limits of agreement between the newly developed method and the standard reference technique calculated according to Bland and Altman (1986) are rather wide and reflect the small sample size and the great variation of differences. Even on the most optimistic interpretation, there can be considerable discrepancy between the two methods, and thus estimation of CBF by use of NIRS and an intravenously administered tracer dye is still far from being acceptable for clinical routine use. However, the present study demonstrates the theoretical feasibility of noninvasive monitoring of CBF by NIRS.
SUMMARY AND CONCLUSION
This is the first report of a noninvasive estimation of CBF by means of NIRS and an intravenously administered tracer dye and its validation in a pig model by use of a standard reference technique. Blood flow index calculated from tracer kinetics in cerebrovasculature by an algorithm derived from fluorescein flowmetry correlated significantly with CBF in brain cortex but not with galeal blood flow in the tissue as assessed by NIRS. Thus, detection of tracer kinetics in the cerebrovasculature by NIRS may serve as a valuable tool for the noninvasive, rapid, and repeated monitoring of cerebral hemodynamics. The technique proposed can also be applied in diagnostic units where complex technical equipment (computed tomography, positron emission tomography, single photon emission computed tomography) is not readily available and is suitable for bedside use. The latter is of particular importance, as the frequency of secondary pathophysiological insults in head-injured patients increases with intrahospital transport (Andrews et al., 1990).
Furthermore, the present study demonstrates for the first time that chromophore kinetics recorded by NIRS in the intact head reflect blood flow in cerebral rather than extracerebral tissue.
Though accuracy of the new method is yet too low for its application in clinical routine practice, the first results obtained in this study appear very promising. The results presented will have to be confirmed in larger sample sizes as well as under various physiological and pathophysiological conditions of flow. Inclusion of the tracer input function as measured, e.g., by a second spectroscope positioned on the ipsilateral carotid artery, into the algorithm applied may improve the accuracy of this technique.
Footnotes
Abbreviations used
Acknowledgments
The authors thank L. Schleinkofer, U. Pfeiffer, H. Brechtelsbauer, M. Haller, P. Lackermeier, F. Staub, N. Plesnila, and M. Moll for their suggestions and support, and M. Cope for provision of the specific absorption coefficients of ICG.