
Abstract
Predicting the onset of secondary energy failure after a hypoxic–ischemic insult in newborns is critical for providing effective treatment. Measuring reductions in the cerebral metabolic rate of oxygen (CMRO2) may be one method for early detection, as hypoxia–ischemia is believed to impair oxidative metabolism. We have developed a near-infrared spectroscopy (NIRS) technique based on the Fick Principle for measuring CMRO2. This technique combines cerebral blood flow (CBF) measurements obtained using the tracer indocyanine green with measurements of the cerebral deoxy-hemoglobin (Hb) concentration. In this study, NIRS measurements of CMRO2 were compared with CMRO2 determined from the product of CBF and the cerebral arteriovenous difference in oxygen measured from blood samples. The blood samples were collected from a peripheral artery and the sagittal sinus. Eight piglets were subjected to five cerebral metabolic states created by varying the plane of anesthesia. No significant difference was found between CMRO2 measurements obtained with the two techniques at any anesthetic level (P > 0.5). Furthermore, there was a strong correlation when concomitant CMRO2 values from the two techniques were compared (R2 = 0.88, P< 0.001). This work showed that CMRO2 can be determined accurately by combining NIRS measurements of CBF and Hb. Since NIRS is safe and measurements can be obtained at the bedside, it is believed that this technique could assist in the early diagnosis of cerebral energy dysfunction after hypoxia–ischemia.
Keywords
Introduction
A continuous and abundant supply of oxygen is necessary to meet the high energy demands of brain cells (Zauner et al, 2002). Consequently, determining that the cerebral metabolic rate of oxygen (CMRO2) remains above critical thresholds is an accepted indicator of neuronal viability (Astrup, 1982). In terms of neonatal brain injury, a reduction in CMRO2 has been postulated as an early indicator of secondary brain damage after hypoxia–ischemia (Hagberg, 2004; Puka-Sundvall et al, 2000). This impairment in oxidative metabolism has been shown by magnetic resonance spectroscopy (MRS) (Cady, 2001); however, the clinical utility of MRS is hampered by the long examination times and the risks associated with transporting critically ill newborns from intensive care units. A rapid method for measuring CMRO2 at the bedside could greatly assist in the management of hypoxia–ischemia by detecting impaired oxidative metabolism before the onset of secondary brain injury.
Near-infrared spectroscopy (NIRS) is a promising technique for detecting neonatal brain injury as it is safe, portable, and techniques for measuring cerebral blood flow (CBF) and tissue oxygenation have been developed (Nicklin et al, 2003). Cerebral oxygenation has been studied by measuring deoxyhemoglobin (Hb), oxy-hemoglobin (HbO2), and cytochrome oxidase concentrations (Kusaka et al, 2002; Hueber et al, 2001; Watzman et al, 2000; Brun et al, 1997; Ferrari et al, 1989; Springett et al, 2000). Near-infrared spectroscopy has also been used to measure CBF using the near-infrared (NIR) tracer indocyanine green (ICG) (Patel et al, 1998; Springett et al, 2001; Brown et al, 2002). By combining CBF and absolute Hb concentration measurements, our group has developed an NIRS method for measuring the CMRO2 that is based on the Fick Principle (Siesjo, 1978). The feasibility of this technique was first shown by measuring the effects of indomethacin on CBF and CMRO2 in a piglet model (Brown et al, 2003). In agreement with previous studies (Armstead et al, 1988; Coyle et al, 1995), it was shown that indomethacin reduced CBF (by 18%) but had no effect on CMRO2. These results showed that the NIRS technique could measure CBF and CMRO2 independently. However, before the technique can be considered for clinical studies, it is crucial to validate the CMRO2 measurements. With this goal in mind, the purpose of the present study was to compare NIRS measurements of CMRO2 to measurements obtained directly from blood samples. Measurements were obtained over a range of CMRO2 by manipulating the level of anesthesia. The precision of the method was assessed from sequential measurements obtained at constant CMRO2. A preliminary version of this work has been presented in abstract form (Tichauer et al, 2005b).
Theory
Second Derivative Near-Infrared Spectroscopy
The underlying principles behind the use of NIRS to probe biologic media are relatively simple and have been described in detail elsewhere (Jobsis, 1977). As NIR light enters the tissue, it is multiply scattered and partially absorbed by four endogenous NIR light absorbers: HbO2, Hb, cytochrome oxidase, and water. The scatter causes the total pathlength traveled by the NIR light from the emission probe to detection probe to be larger than the physical distance between the two probes. This increase in pathlength can be corrected for by using the differential pathlength factor (DPF), as first described by Delpy et al (1988). With accurate knowledge of the DPF, a modified version of the Beer–Lambert law can be used to determine absolute changes in the concentrations of the endogenous NIR absorbers by least-squared fitting:
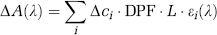
where △A(λ) is the change in attenuation as a function of wavelength, △ci is the absolute change in concentration of the ith NIR absorber, L is the physical distance between emission and detection, and ε i (λ) is the extinction coefficient of the ith NIR absorber as a function of wavelength. Using the second derivative technique described by Matcher et al (1994) to account for scatter and assuming a water concentration of 85% (Cooper et al, 1996), the DPF and absolute concentrations of endogenous absorbers—as opposed to absolute changes of concentrations—can be obtained in real time.
Cerebral Metabolic Rate of Oxygen Measurements
By using NIRS to measure the concentration of chromophores, CMRO2 can be determined using the Fick Principle as follows:

where AVDO2 is the arterial-venous difference of oxygen, or the difference between the oxygen concentration of the arterial system feeding the tissue of interest and the oxygen concentration of the venous system draining the tissue of interest. Assuming that the oxygen content of arterial blood is the same throughout the body, the arterial O2 concentration can be calculated from hemoximeter analysis of arterial blood samples from a peripheral artery. The venous O2 concentration is more difficult to determine noninvasively. However, considering that the Hb measured in the brain is due solely to O2 dissociation from HbO2, we propose to use the NIRS measurements of tissue Hb concentration as an indirect measure of the venous O2 concentration. With this approach, it is necessary to account for the fact that the tissue Hb concentration is a weighted average of the three blood compartments: arterial, capillary, and venous. The relative distribution of arterial, capillary, and venous compartments in the total cerebral blood volume (CBV) is generally accepted to be approximately 20%, 10%, and 70%, respectively (Phelps et al, 1979). Assuming that the capillary concentration of Hb is the average of arterial and venous concentrations, the venous concentration of Hb can be written as follows:
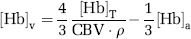
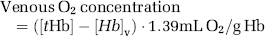
where [Hb]v, [Hb]T, and [Hb]a are the venous, tissue, and arterial concentrations of Hb, respectively. The tissue Hb concentration, [Hb]T, is measured by NIRS and [Hb]a can be measured by either hemoximeter analysis of an arterial blood sample. The NIRS measurement of [Hb]T is normalized by the dilution factor, CBV · ρ, to determine the concentration of Hb in just the blood compartment of the tissue region of interest. The density of brain tissue, ρ, is 1.05 g/mL and is used to convert the CBV from volume of blood per mass of tissue to volume of blood per volume of tissue. Finally, with knowledge of the total hemoglobin (tHb = Hb + HbO2) measured from a blood sample, the venous O2 concentration can be determined as follows (Brown et al, 2003):
Cerebral Blood Flow Measurements
To determine CMRO2 using equation (2), CBF must also be measured. One method is to use NIRS to track the tissue concentration of an intravascular light absorbing dye, ICG (Patel et al, 1998). Both CBF and CBV can be calculated based on the relationship:

where Q(t) is the tissue concentration of ICG as a function of time, Ca(t) is the arterial concentration of ICG as a function of time, * refers to the convolution operator, and R(t) is the impulse residue function. If the input function, CBF · Ca(t), is equal to a dirac-delta function then R(t) would equal Q(t). The tissue curve, Q(t), is measured by NIRS and Ca(t) is measured by a pulse dye densitometer. The deconvolution of Q(t) and Ca(t) then yields CBF R(t) (Cenic et al, 1999). The initial height of this function corresponds to the CBF and the area under the function corresponds to CBV (Zierler, 1965).
Materials and methods
Animal Preparation
The study was approved by the Council on Animal Care at the University of Western Ontario. Newborn Duroc piglets, 0 to 3 days of age, were delivered from a local supplier on the morning of the experiment. Piglets were anesthetized with isoflurane (3% to 4% during preparatory surgery, 1.5% postsurgery), paralyzed via injections of vecuronium (0.1 mg/kg every 30 mins), tracheotomized, and mechanically ventilated on an oxygen/medical air mixture. Catheters were inserted into an ear vein for ICG injection, and into a femoral artery to continuously monitor blood pressure and for the collection of arterial blood samples for gas and glucose analyses. The sagittal and lambdoid sutures were identified and a small burr hole was drilled 1 cm posterior to the lambda structure. A catheter was inserted into the superior sagittal sinus for the collection of cerebral venous blood samples.
Arterial CO2 tension (paCO2) was monitored throughout the experiment, either directly from blood samples or from the end-tidal CO2 tension, and maintained at approximately 40 mm Hg by adjusting the breathing rate. Arterial oxygen tension (paO2) was maintained at a level between 90 to 130 mm Hg by adjusting the ratio of oxygen to medical air. A heated water blanket was used to maintain rectal temperature between 37.5°C and 38.5°C. Blood glucose levels were monitored intermittently, and if they fell below 3 mmol/L, a 2 mL infusion of 25% glucose solution was administered intravenously. Arterial pH (pHa) and heart rate (HR) were also monitored throughout the experiment. After surgery, piglets were positioned into a frame holding the NIRS probes and allowed to stabilize for 45 mins before the beginning of the experiment. The probes were positioned 3 cm apart, parasagittally, on the top of the unshaved piglet's head.
Experimental Procedure: Accuracy
To determine the accuracy of the NIRS method, CMRO2 measurements were made over a range of metabolic states. Experiments were conducted on 12 piglets. In each piglet, a range of cerebral metabolic states was created by varying the level and type of anesthetic. For the initial 30 mins after surgery, piglets were maintained on 1.5% isoflurane. At 30 mins, isoflurane was discontinued and an intravenous infusion of fentanyl started (0.04 mg/kg h), coupled with ventilation on 70% nitrous oxide and 30% oxygen. This fentanyl/N2O combination created a pseudoconscious level of metabolism (Åkeson et al, 1992). After approximately 30 mins on this anesthetic combination, three successive intravenous injections of pentobarbital (5, 10, and 30 mg/kg) were administered at 30 min intervals. At each level of anesthesia, CMRO2 was measured with both the NIRS system and from blood samples concurrently. For each method, two measurements were collected per anesthetic level.
Experimental Procedure: Precision
To determine the precision of the NIRS method, repeated measurements were obtained at a constant CMRO2. Experiments were conducted on 18 piglets that were also part of a hypoxia-ischemia study (Tichauer et al, 2005a). The animal preparation was the same as described above, except that no sagittal sinus catheter was inserted. Animals were maintained at 1.5% isoflurane, and after the 30 mins stabilization period, three measurements of CMRO2 were acquired at 15 mins intervals.
Near-Infrared Spectrometer
The NIRS system was a continuous wave, broadband (600 to 980 nm) unit comprised of a tungsten halogen light source, two fiber-optic cables, and a spectrometer. The spectrometer consisted of a holographic grating housed in a light-tight container attached to a cooled CCD camera (Wright Instruments, Enfield, Middlesex, UK). The NIR light was transmitted through one optode, into the head, and a fraction of the scattered light was collected by the second optode. The intensity spectrum of the collected light was determined by channelling the light onto the holographic grating, where it was dispersed across the CCD chip with a spectral sampling width of 0.395 ± 0.001 nm. The system had a sampling rate of 200 ms.
Tissue Indocyanine Green Concentration Measurement
A 0.1 mg/kg bolus of ICG was injected into an ear vein in piglets for every NIRS measurement of CBF. The absolute change in concentration of ICG in the NIR-illuminated region of interest was calculated using the modified Beer-Lambert law (equation (1)) with the DPF determined using the second derivative technique (Matcher et al, 1994). Since there was no ICG in the tissue before the injection, the absolute change in ICG measured with the NIRS system was simply the absolute concentration of ICG in the tissue (Brown et al, 2002).
Arterial Indocyanine Green Concentration Measurement
Arterial ICG concentration was measured noninvasively on a hindfoot of the piglets using a Nihon Kohden dye densitogram unit (model DDG-2001 A/K, Tokyo, Japan). The dye densitogram works on similar properties to NIRS, and is described in detail elsewhere (Iijima et al, 1997). Measurements of arterial ICG concentration were made once every heartbeat. In a normal piglet, the HR is approximately 150 beats/mins, allowing measurements to be made approximately every 400 ms.
Tissue Absolute Hemoglobin Concentration Measurement
Absolute Hb concentrations within the NIR-illuminated region of interest were based on the technique developed by Matcher et al (1994). For the CMRO2 measurements, the absolute Hb concentration was determined by averaging Hb concentrations from individual spectrum collected in a 3-secs period immediately preceding the injection of ICG.
Blood Sample Cerebral Metabolic Rate of Oxygen Measurement
To validate the NIRS measurements, AVDO2 was determined directly from blood samples collected from a femoral artery and the sagittal sinus. The latter has been shown to primarily drain the cerebral cortex (Scremin et al, 1982), which is the region interrogated by the NIRS probes. The samples were immediately placed in ice, and the oxygen saturation (SO2) and Hb concentrations were determined using a hemoximeter (Radiometer OSM3, Copenhagen, Denmark). Cerebral metabolic rate of Oxygen was determined from equation (2) using the measured AVDO2 and CBF determined with the ICG/NIRS technique. It is acceptable to use the NIRS measurement of CBF as this technique has been previously validated (Brown et al, 2002).
Statistical Analysis: Accuracy and Precision
All data are presented as mean ± s.e.m. The repeated-measures analysis of variance (ANOVA) was used to determine the accuracy of the NIRS CMRO2 measurements compared with the blood sample results, as well as the precision of the NIRS CMRO2 measurements. A repeated-measures ANOVA was also used to uncover anesthetic effects on CMRO2, CBF, CBV, and other physiologic parameters.
A common regression analysis could not be used to determine the correlation between the NIRS- and blood-based measurements of CMRO2 because multiple measurements were acquired from the same animal, and therefore, the data points cannot be assumed to be independent (Ewing et al, 2003). To account for the difference between the number of piglets and the number of data points, a variation of the generalized estimating equation method was utilized (Zeger et al, 1988). First, a linear fit was applied to the data from each piglet individually. Second, a significant correlation was tested by using a t-test to compare the average of the distribution of slopes to the null hypothesis (i.e., a slope = 0). Finally, the distribution of slopes was compared with a slope of 1 to determine the agreement of the correlation with the line of identity.
Results
For the CMRO2 accuracy study, four of the 12 piglets were excluded as a result of puncturing the sagittal sinus during the insertion of the catheter. This led to blood leaking into the cerebral spinal fluid, which in turn caused the NIRS measurements of [Hb] to be overestimated. The occurrence of a hemorrhage was suspected if the NIRS measurements of [Hb] under isoflurane anesthesia were at least 2 s.d. greater than the average [Hb] measurement, and was further verified by visual inspection. The average [Hb] was determined from the 18 piglets used in the precision experiment, which did not include catheterization of the sagittal sinus.
Table 1 presents the averaged physiologic parameters of the eight piglets (four males, four females, mean weight 1.54 ± 0.11 kg, mean age 1.1 ± 0.2 days) at each level of anesthesia. Both the HR and mean arterial blood pressure (MAP) varied with the level of anesthesia, as expected (Siesjo, 1978). There was a statistically significant increase in HR and MAP when the anesthetic was switched from isoflurane to fentanyl/N2O (P < 0.05). The increased levels of MAP and HR persisted over the first two injections of pentobarbital, but returned to isoflurane levels after the final injection of pentobarbital. No significant differences were found between the different levels of anesthesia with respect to paO2, paCO2, SaO2, tHb, or pHa.
Physiologic parameters at each anesthetic level
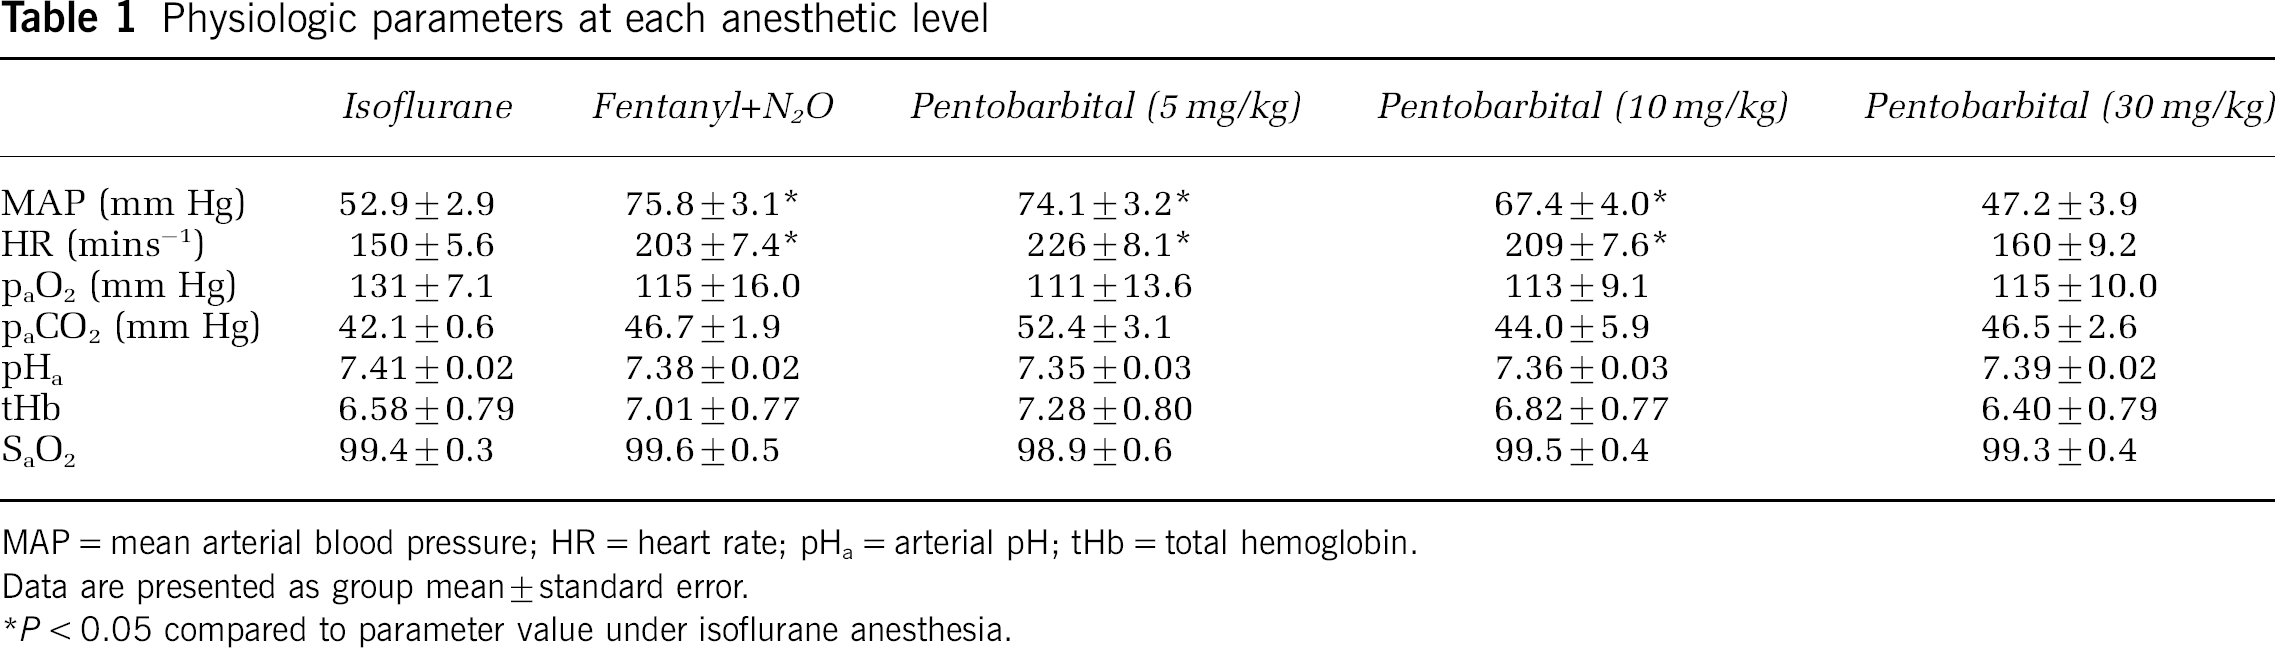
MAP = mean arterial blood pressure; HR = heart rate; pHa = arterial pH; tHb = total hemoglobin.
Data are presented as group mean ± standard error.
P < 0.05 compared to parameter value under isoflurane anesthesia.
Figure 1 displays the measurements of CMRO2 from the NIRS method and from blood samples at the five sequential levels of anesthesia. A repeated-measures ANOVA, with the level of anesthetic as the within-subject factor and method of measurement as the between-subject factor, was applied to the data. There was a significant anesthetic effect (F4, 56 = 64.093, Power > 0.99, P < 0.01), but there was no significant measurement by anesthetic effect (F4, 56 = 0.848, Power < 0.25, P > 0.5) or measurement effect (F4, 56 = 0.002, Power < 0.1, P > 0.9). This indicates that changes in anesthetics caused significant changes in CMRO2, as determined by both methods, but more importantly, there were no significant differences in the values of CMRO2 measured by the two methods at any level of anesthesia. Similarly, Figure 2 displays the average CBF and CBV values at each level of anesthesia. Both CBF and CBV were significantly affected by the level of anesthesia with the effect being more pronounced in the CBF measurements (F4, 56 = 20.709, Power > 0.99, P < 0.001) than in the CBV measurements (F4, 56 = 4.842, Power > 0.7, P < 0.05). Details of the measured parameters at every anesthetic level are provided in Table 2. Data from both NIRS and the blood samples are given for CMRO2, the AVDO2, and the venous oxygen saturation (SvO2).
NIRS-measured parameters with corresponding blood sample measurements
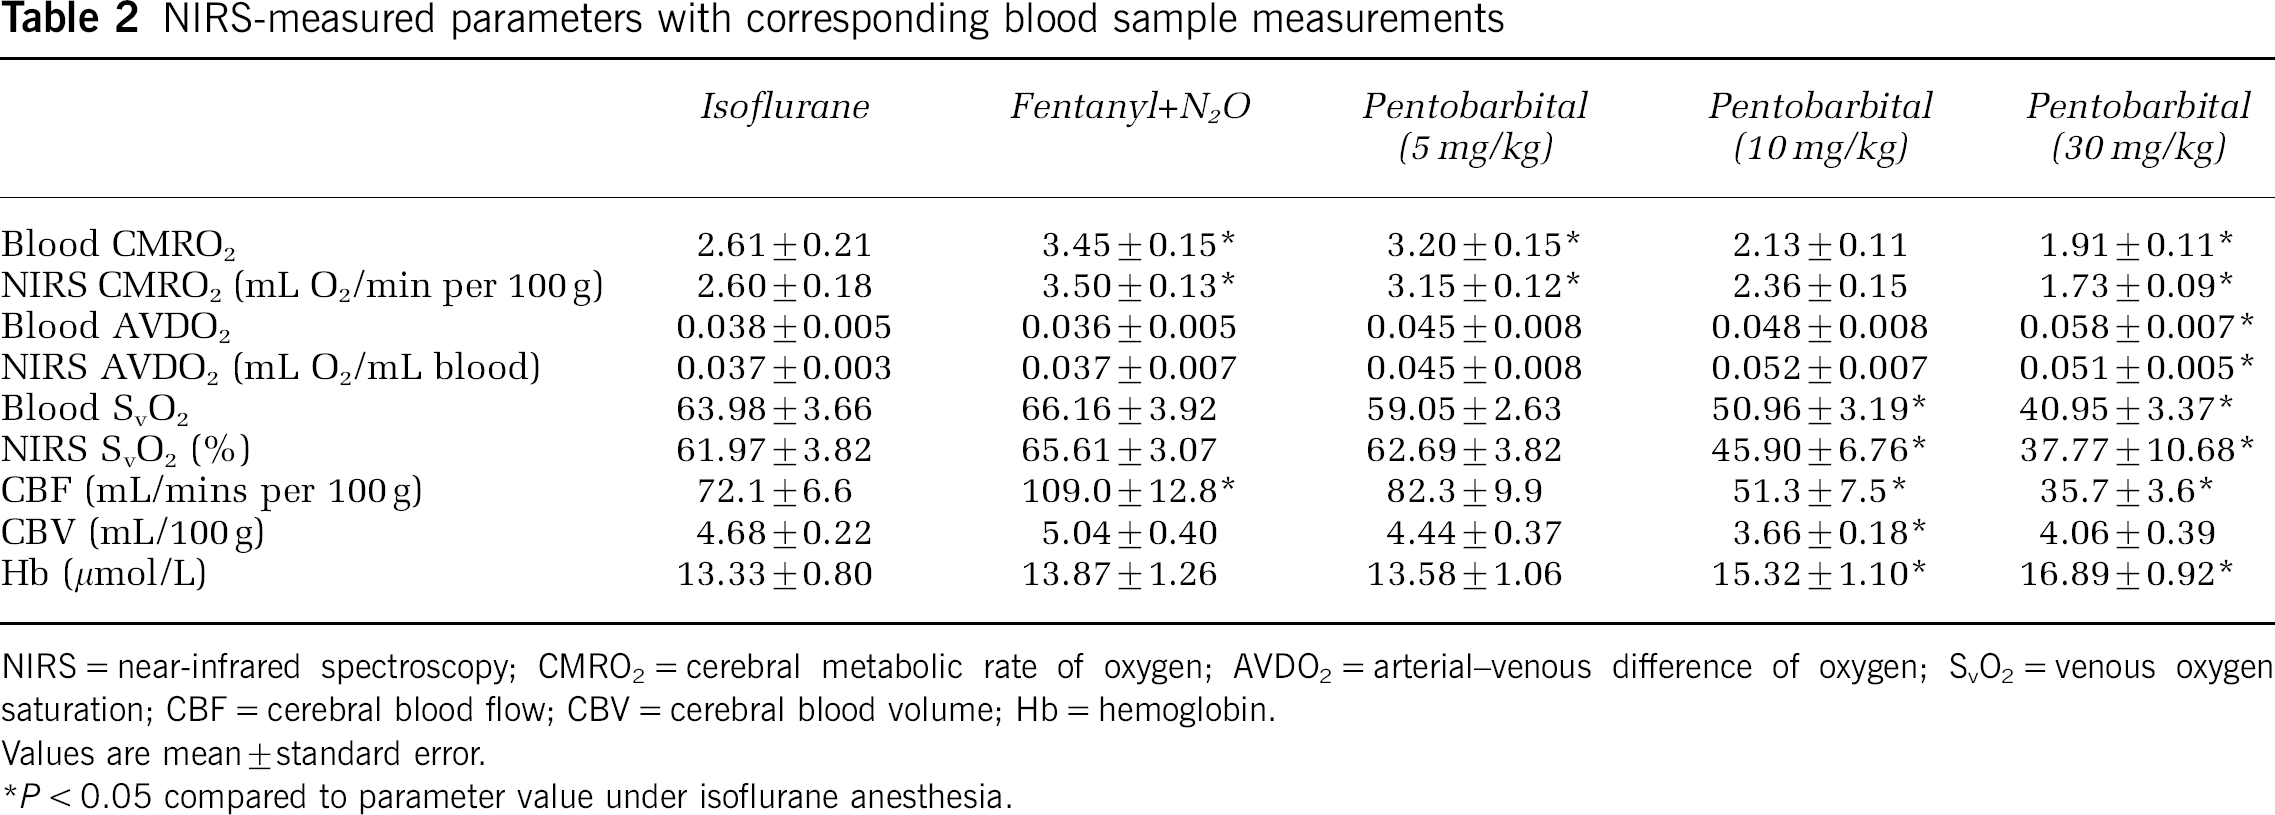
NIRS = near-infrared spectroscopy; CMRO2 = cerebral metabolic rate of oxygen; AVDO2 = arterial-venous difference of oxygen; SvO2 = venous oxygen saturation; CBF = cerebral blood flow; CBV = cerebral blood volume; Hb = hemoglobin.
Values are mean ± standard error.
P < 0.05 compared to parameter value under isoflurane anesthesia.
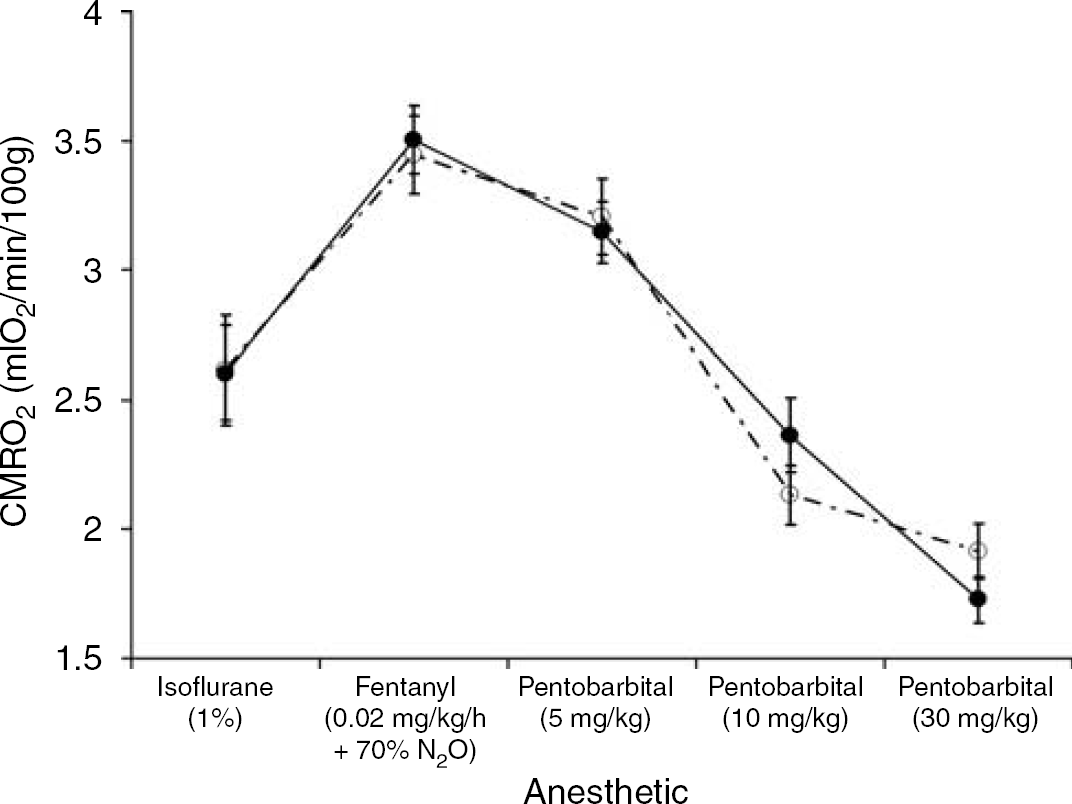
Comparison of near-infrared spectroscopy (NIRS) and blood sample measurements of cerebral metabolic rate of oxygen (CMRO2). The data are presented as a function of sequential anesthetic conditions. The average NIRS measurements of CMRO2 are marked by the solid black circles connected by the solid black line and the blood sample measurements of CMRO2 are marked by the open circles connected by the dashed line. The lines are presented to accentuate the trend in the data. Error bars represent the standard error.
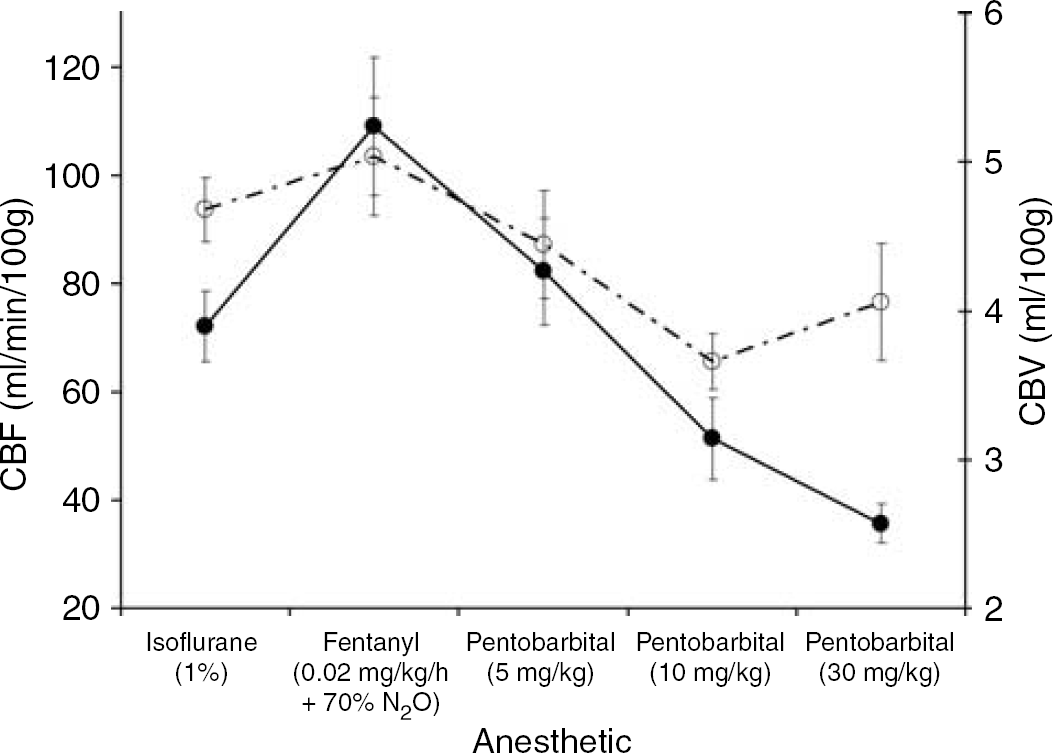
Average values of cerebral blood flow (CBF) and cerebral blood volume (CBV) from eight piglets. Data are presented as a function of sequential anesthetic conditions. The CBF data are represented by the solid circles connected by the solid black line and the CBV data are represented by the open circles connected by the dashed line. The lines are solely meant to accentuate the trend in the data. Error bars represent the standard error.
In Figure 3, the NIRS CMRO2 measurements are plotted as a function of their corresponding blood sample-based measurement. As discussed in the Materials and methods, a simple regression analysis was not applied as five pairs of CMRO2 measurements were acquired from each piglet. Instead, Figure 3 includes the results from regression analysis for each piglet individually, as well as the average of the eight analyses. The average slope was 1.05 ± 0.14, which was significantly different from the null (slope = 0, P < 0.001), but not significantly different from the line of identity (slope = 1, P > 0.7).
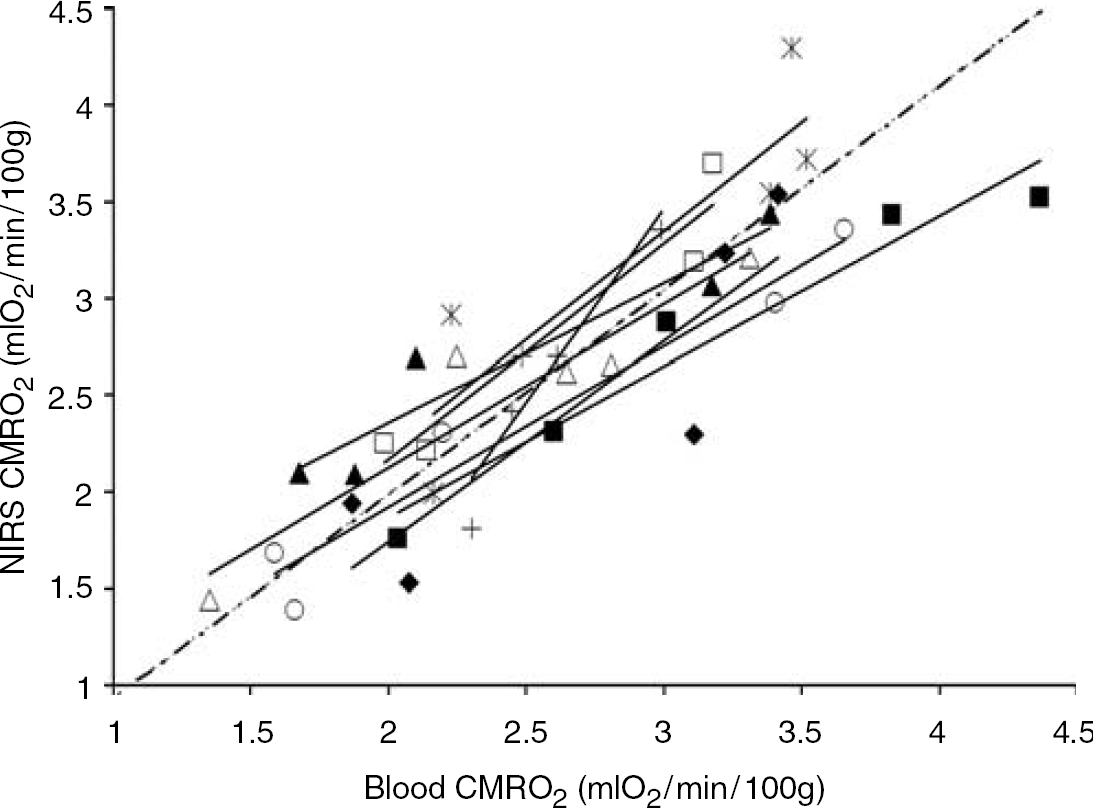
Correlation plot comparing concurrent near-infrared spectroscopy and blood sample measurements of cerebral metabolic rate of oxygen (CMRO2). Each symbol type represents data from one of eight piglets. The thin solid lines indicate the individual linear regressions for each piglet and the dotted line indicates the average slope of all the individual regressions (slope = 1.05 ± 0.14, intercept = −0.13 ± 0.37 mL O2/mins per 100 g).
This indicates that there was a significant correlation between the NIRS CMRO2 measurements and those obtained from the blood samples. The average intercept for the eight piglets was −0.13 ± 0.37, which was not significantly different from zero (P > 0.5), and the average R2 associated with the individual fits was 0.88 ± 0.03. Based on the sample size and the measurement errors with both methods, the NIRS and blood sample measurements of CMRO2 were found to agree to within 17% (P < 0.05, Power > 0.80).
Figure 4 presents a Bland-Altman plot comparing the CMRO2 measurements from NIRS and from blood samples (Bland and Altman, 1986). The mean difference between the two methods is −0.006 mL O2/mins per 100 g. The limits of agreement—that is, the boundaries of the region in which 95% of the differences lie—are −0.73 and 0.74 mL O2/mins per 100 g (i.e., ± 28% of the average isoflurane CMRO2 values).
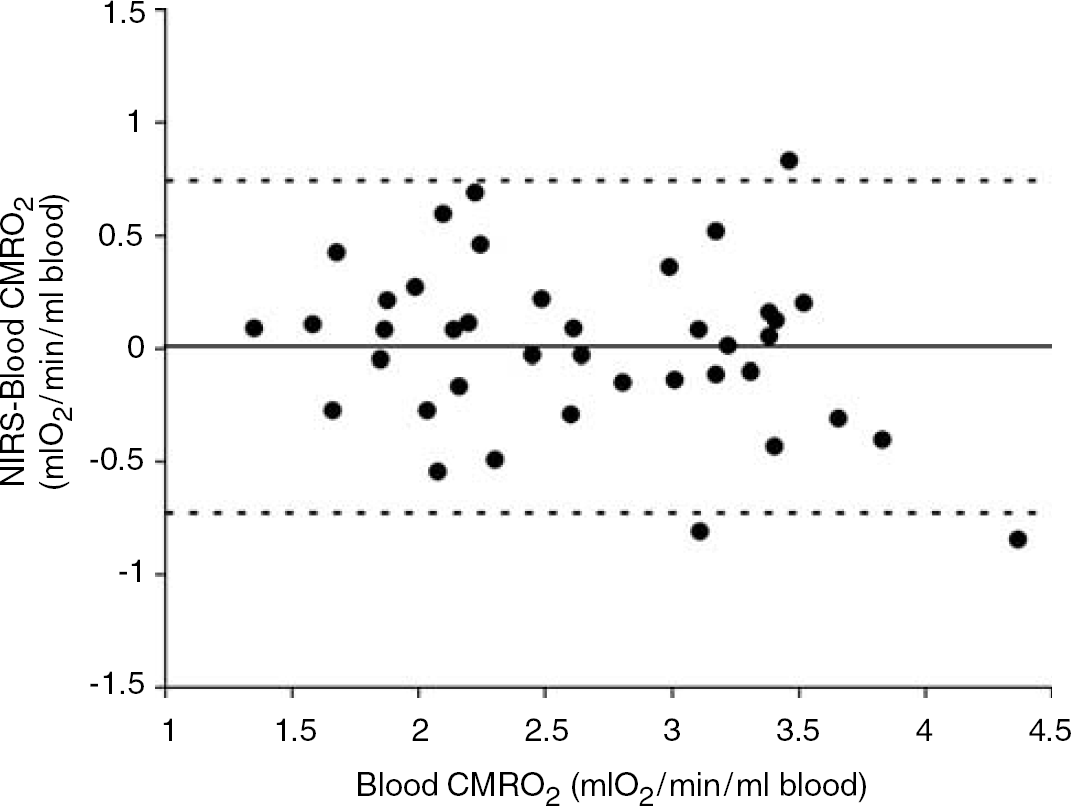
Bland–Altman plot comparing cerebral metabolic rate of oxygen (CMRO2) measurements obtained with near-infrared spectroscopy and from blood samples. The mean difference between the two methods is 0.006 mL O2/mins per 100 g. The limits of agreement, that is, the boundaries of the region in which 95% of the differences lie, are −0.73 and 0.074 mL O2/ml blood. The solid line shows the mean difference and the dotted lines show the limits of agreement (mean ± 2 standard deviation (s.d.)).
Table 3 displays the results from the 18 piglets (eight males, 10 females, mean weight 1.60 ± 0.25 kg, and mean age 7.1 ± 3.0 h) used for the precision analysis of the NIRS CMRO2 measurements. Using a repeated-measures ANOVA, the precision of the CMRO2 measurement was determined to be 10.7%. There were no significant within-subject effects between the different time points (F = 2.039, Observed Power < 0.4, P > 0.1).
Precision analysis
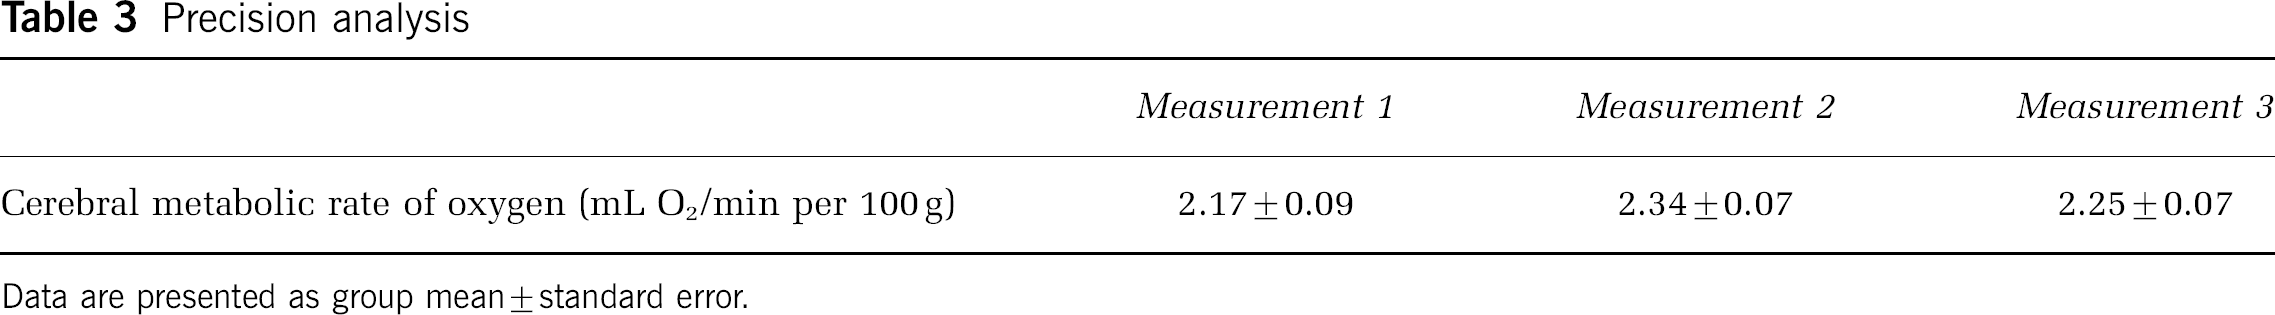
Data are presented as group mean ± standard error.
Discussion
Assessing the severity of a hypoxic-ischemic insult after resuscitation, but within a critical time frame when treatment effectiveness is at its greatest, remains a problem (du Plessis and Volpe, 2002). Measuring reduced CMRO2 may be one method for predicting the early onset of hypoxic-ischemic brain damage (Hagberg, 2004). Because of recent advances in hemodynamic measurements (Springett et al, 2001; Brown et al, 2002) and in the quantification of NIR chromophores in vivo (Matcher et al, 1994; Cooper et al, 1996), NIRS has the potential to offer a safe and rapid approach for quantitatively measuring CMRO2 in newborns. In the present study, we found excellent agreement within a range of approximately 1.5 to 4.0 mL O2/mins per 100 g between our NIRS-based measurements of CMRO2 and concurrent measurements of CMRO2 obtained from arterial and sagittal sinus blood samples.
Few studies have attempted to measure CMRO2 with NIRS (Boas et al, 2003). Measuring absolute CMRO2 is difficult because of the high scattering properties of tissue. Acquiring quantitative measures of in vivo chromophore concentrations is challenging as scatter increases the pathlength and the measured absorption of light. In the present study, the second derivative technique was applied to continuous wave data to account for scatter (Matcher et al, 1994). Real-time measurements of the differential pathlength were acquired using the known water concentration in brain (85%) (Cooper et al, 1996). A consequence of the second derivative approach is that the AVDO2 must be calculated solely from the tissue [Hb] as the second derivative of the HbO2 absorption spectrum is relatively featureless. With this approach, an independent measure of the arterial oxygenation must be obtained, which can be determined directly from an arterial blood sample or indirectly from the arterial oxygen saturation. It is necessary to normalize the tissue [Hb] by CBV, which is obtained from the ICG measurements, and to assume a relative distribution of [Hb] in the vasculature. The measurement of AVDO2 is combined with the ICG-based CBF measurement to calculate CMRO2. To our knowledge, this is the first study that has successfully validated an NIRS-based measurement of CMRO2.
As a caveat, the accuracy of the NIRS measurements with the second derivative technique relies on the assumption that the interrogated medium is homogeneous. This is a reasonable assumption with regards to piglets and human neonates as their skulls are relatively thin, but a poor assumption with regards to adults (Cooper et al, 1996). It has been shown that over 50% of the illuminated tissue volume in adults can be comprised of extra-cerebral tissue (Steinbrink et al, 2001). This signal contamination has been shown to cause a significant underestimation of CBF, and presumably the same would apply to CMRO2 (Gora et al, 2002).
The NIRS-based measurements of CMRO2 were validated against CMRO2 measurements determined from blood sampled from the sagittal sinus. As such, the two CMRO2 measurements were not collected from exactly the same brain volumes. However, there should be significant overlap between the two sampled volumes since both techniques primarily measure cortical tissue (Scremin et al, 1982). Partial volume errors were avoided by using anesthetics to alter CMRO2 globally (Siesjo, 1978). Furthermore, the same CBF measurement determined with the ICG/NIRS technique was used for both the NIRS and the blood sampling measurements of CMRO2. Since NIRS measurements of CBF have been previously validated (Brown et al, 2002), this study was essentially a validation of the NIRS-based AVDO2 measurements. By including CBF and CBV measurements, AVDO2 measurements could be expressed in the form of CMRO2 measurements. This is a critical point as CMRO2 is a more direct marker of neuronal viability than AVDO2 (Zauner et al, 2002). It is possible to achieve significant changes in the AVDO2 while CMRO2 is maintained at a constant level to ensure that the neuronal energy demands are met (Siesjo, 1978). For example, we have found that CMRO2 is more sensitive than CBF and AVDO2 to cerebral energy impairment after hypoxic–ischemic insults in newborn piglets (Tichauer et al, 2005a).
Quantitative measures of AVDO2 were calculated under the assumption that the relative contribution of venous and arterial blood to the total blood volume in the brain is 3:1 (Phelps et al, 1979). Because of its importance, there have been a number of studies that have attempted to measure the relative vascular distribution (Wiedeman, 1963; Moskalenko et al, 1980; Mchedlishvili, 1986; Brun et al, 1997; Watzman et al, 2000; Hueber et al, 2001; Kusaka et al, 2002). The 75:25 ratio commonly used today originated from Mchedlishvili and is based on cerebrovascular resistance measurements. More recent studies have compared NIRS tissue oxygenation measurements to oxygenation measurements from arterial and venous blood samples, and have shown similar results to Mchedlishvili under normal physiologic conditions (Brun et al, 1997; Watzman et al, 2000; Hueber et al, 2001; Kusaka et al, 2002; Ferrari et al, 1989).
Changes in the venous to arterial ratio have been reported. Hueber et al (2001) and Kusaka et al (2002) measured a vascular ratio of 50:50 under hypoxic conditions. Kusaka et al attributed this change to an increase in CBF caused by hypoxic arteriole vasodilation. However, our data did not indicate a change in the venous to arterial ratio of this magnitude over the CBF range investigated (35 to 100 mL/mins per 100 g). Using a repeated-measures ANOVA, it was determined that a 17% or greater change in CMRO2 between the NIRS and blood sample measurements could be detected. A difference in the CMRO2 measurements of 17% or greater translates into approximately a 12% or greater change in the venous to arterial ratio. Therefore, a 25% change in this ratio, as observed by Hueber et al and Kusaka et al, should have been detected in this study. A possible reason for this discrepancy could be a greater increase in CBF during their hypoxic conditions. In agreement with our results, Brun et al (1997) and Watzman et al (2000) found no significant change in the venous to arterial ratio during hypo- and hypercapnia. We plan to investigate if different levels of hypoxia will reduce the accuracy of the proposed NIRS technique for measuring CMRO2.
In a comparison study of NIRS tissue oxygenation measurements to venous (from interior jugular vein) and arterial blood samples in humans, Watzman et al found significant intersubject differences in the venous to arterial ratio. The study was conducted in children less than 8 years with a diagnosis of congenital heart disease requiring cardiac catheterization. Understandably, there was a high degree of heterogeneity with regards to arterial oxygen saturation (the range was from 68% to 100%) because of the medical conditions of the subjects. Since this study used an NIRS technique similar to Hueber et al, variation resulting from different arterial oxygen saturation is expected. If this variation is real, then it could limit the use of the NIRS technique clinically. However, Brown et al (2003) found only a 15% error in the CMRO2 when there was a 10% error in the relative contributions of arterial and venous blood.
The proposed NIRS technique is based on previously established methods for measuring CBF and tissue [Hb] (Matcher et al, 1994; Cooper et al, 1996; Brown et al, 2002). This present study showed that over a wide range, there was a significant correlation between CMRO2 measurements based on the second derivative NIRS technique and those based on blood samples. Furthermore, repeated measurements obtained while maintaining constant CMRO2 showed that the NIRS technique can measure CMRO2 with a precision of 10.7%. Since NIRS is safe and measurements can be obtained at the bedside in only a few minutes, it is believed that this technique could assist in monitoring cerebral metabolism in the neonatal intensive care unit. This could be particularly relevant to the early diagnosis of cerebral energy dysfunction after hypoxia-ischemia.
Footnotes
Acknowledgements
The advice on statistical analysis from Drs Yves Bureau and James Ewing was greatly appreciated, as was the many helpful discussions on NIRS with Dr Derek Brown.