
Abstract
Near infrared spectroscopy (NIRS) is used to measure CBF (CBFNIRS) in humans, based on Fick's principle, using oxygen as an intravascular tracer. We compared CBFNIRS with CBF measured by microspheres (CBFμ) and the venous outflow technique (CBFv) in 15 dogs, altering CBF with ventilation-induced changes in PaCO2. Five hundred forty-nine CBFNIRS measurements were attempted using an integration time of 2.5 s on the saturation signal from the tongue. One hundred ninety-eight (36.1%) of the measurements fulfilled predefined criteria. The coefficient of variation (CV) for six measurements under stable conditions was 29.1%. The CBFNIRS measurements correlated best with microsphere-measured blood flows in the cortical gray matter (median 0.43, range 0.16–0.93); the contributions of the skull and dura were variable. The CBFv varied by a median of 12% (range 0–67%) during the CBFNIRS measurements. The percentage of acceptable CBFNIRS measurements, the CV, and the correlation coefficients of the CBFNIRS were improved by using saturation signal directly from the artery and varying the integration time with an estimate of the minimum transit time. The current method of measuring CBFNIRS in the reflectance mode is inaccurate when compared with other accepted techniques.
Near infrared spectroscopy (NIRS) measures oxyhemoglobin (HbO2) and deoxyhemoglobin (DHb) in tissues noninvasively. NIRS has been proposed as a technique to measure CBF (Edwards et al., 1988), and since HbO2 is used, the technique provides an indirect measure of oxygen delivery to the brain. Furthermore, NIRS can provide repeated measurements without the use of ionizing radiation.
The NIRS measurement of CBF (CBFNIRS) (Edwards et al., 1988) is based upon the finding that light in the NIR region penetrates biological tissue up to 8 cm (Jobsis, 1977) and is absorbed by DHb and HbO2. Experimentally derived algorithms have been developed that allow quantification of each of these chromophores (Matcher et al., 1995). It has been proposed that CBF can be measured by monitoring changes in HbO2 in response to changes in inspired oxygen (Edwards et al., 1988). Previous attempts to validate this technique have demonstrated good correlation with the xenon measurement of CBF in neonates (Skov et al., 1991; Bucher et al., 1993) when the optodes are placed across the head in the transmission mode; i.e., the angle subtended by the emitter and detector optodes at the center of the head is >90°. However, more recent studies have used the NIRS technique in older children (Fallon et al., 1993) and adults (Elwell et al., 1994), with the optodes placed across the forehead in the reflectance mode (angle <90°). The latter configuration is quite different from that in which the validation procedures have been performed in that light penetration into the brain will be poorer and the CBF on average will be higher. Furthermore there are two other problems with CBFNIRS: over 66% of the measurements are not used as they do not fulfill preset criteria, and the coefficient of variation (CV) of the measurements is over 17% (Fallon et al., 1993; Elwell et al., 1994).
We determined the validity of NIRS measurements of CBF in the reflectance mode by comparing the CBFNIRS with other independent measures of CBF in dogs. We used radiolabeled microspheres to quantify steady-state CBF and regional CBF (CBFμ) and the venous outflow technique to evaluate fluctuations in CBF (CBFv) induced by hypoxia during the NIRS measurements and examine the source of the variability in the CBFNIRS.
METHODS
NIRS theory
Changes in the concentrations of DHb and HbO2 can be quantified using a modified Beer-Lambert law that describes optical attenuation in a highly scattering medium:

where OD is optical density, α the absorption coefficient of the chromophore (mM−1 cm−1), c the concentration of the chromophore (mM), L the physical distance between the points where the light enters and leaves the tissue (cm), B a pathlength factor that takes into account the amount of scattering of light in the tissue, and G the factor related to the geometry and scattering coefficient of the tissue. If L, B, and G are assumed to remain constant, changes in concentration of the chromophore will be proportional to the changes in optical density. The absorption coefficients of HbO2 and DHb have been derived (Cope, 1991; Matcher et al., 1995) and corrected for wavelength-dependent pathlengths (Essenpreis et al., 1993). The pathlength factor has been measured in the heads of rats and humans (van der Zee et al., 1992) and is relatively constant when the interoptode distance is >2.5 cm in the reflectance mode (van der Zee et al., 1992; Ferrari et al., 1993).
CBFNIRS
The CBFNIRS is based on Fick's principle using oxygen (O2) as the intravascular tracer (Edwards et al., 1988). According to Fick's principle, the rate of accumulation (Q) of a tracer substance in an organ is equal to the difference between the rate of arrival and rate of departure of that substance:
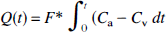
where Q(t) is the amount of the tracer in tissue, F is flow, and Ca and Cv are the concentrations of the tracer in arterial and venous blood, respectively. If the measurements of the rate of accumulation of the tracer are made within the minimum transit time (mTT) of the tracer through the brain, then the venous outflow concentration will be zero. Thus CBF can be calculated from the ratio of the quantity of tracer accumulated to the quantity of tracer introduced during time t:

With a sudden increase in arterial oxygen saturation (ΔSaO2), the initial increase in cerebral HbO2 concentration represents the accumulation of the tracer Q. The quantity of tracer introduced is the product of the integral of ΔSaO2 with respect to time and the arterial Hb concentration. Thus CBF can be calculated in milliliters per 100 g per minute from the following equation:
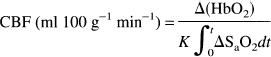
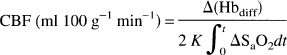
where K is a constant reflecting the molecular weight of Hb, cerebral tissue density, and concentration of Hb in the subject's blood. The signal/noise ratio of the NIRS data can be improved by measuring the change in the difference between HbO2 and DHb, i.e., [Hbdiff] = [HbO2] – [DHb], since if the total Hb concentration ([HbT] = [HbO2] + [DHb]) is constant, then the changes in HbO2 and DHb will be equal and opposite and the difference between these changes will be twice the amplitude of the changes of HbO2. Thus the equation becomes
General procedure
Sixteen mongrel male dogs (20–30 kg) were anesthetized with sodium pentobarbital (35 mg kg−1 i.v.) and mechanically ventilated, using one cylinder of a dual cylinder ventilator (Harvard model 618). The dogs were paralyzed with pancuronium (0.1 mg kg−1) and anesthesia was maintained with sodium pentobarbital.
Surgical preparation.
Catheters were placed via a femoral artery into the left cardiac ventricle for microsphere injection, in the other femoral artery for withdrawal, a brachial artery for monitoring MABP, and a femoral vein for administration of drugs and fluids. In 10 of 16 dogs, an omocervical artery was cannulated for an arteriovenous fistula created to continually pass whole blood through a specially constructed oximeter and return it to the other femoral vein. In 8 of 16 dogs the confluence of the sagittal sinus, the straight vein, and lateral cerebral sinuses were cannulated for the measurement of CBFv (Rapela and Green, 1964). In all animals, the scalp and temporalis muscle overlying the cranial vault were surgically reflected. The optical probes were placed 3–5 cm apart on the skull, ensuring that they were positioned posterior to the frontal sinuses and up to 1 cm anterior to the bregma on the left side. The optodes were shielded from ambient light with NIR opaque modeling clay and a black plastic bag placed over the whole head.
Instrumentation.
The NIRO 500 (Hamamatsu Photonics, Hamamatsu, Japan) was used in these studies. It uses pulsed laser diodes at four wavelengths (779, 828, 839, 913 nm) as its light source and a photomultiplier tube for detection. The changes in HbO2 and DHb were calculated using an established four-wavelength algorithm (Matcher et al., 1995). The data were collected every 0.5 s during CBFNIRS measurements.
Peripheral SaO2 was monitored with a pulse oximeter (Nellcor, U.S.A.), modified to measure in the beat-to-beat mode, and the sensor was applied to the tongue. The central SaO2 was monitored with an oximeter constructed in this laboratory that measured changes in light at 660 nm (transmitted through an in-line catheter placed between the omnocervical artery and femoral vein). Regular measurements of arterial SaO2 were made throughout the experiment and the results were used to calibrate both oximeters. The data from the oximeters were not used if there was not a substantial linear relationship (regression analysis, r2 < 0.80) between the oximeters and the co-oximeter measurements.
CBF measurements
CBFNIRS measurements.
CBFNIRS was measured by inducing mild hypoxia (SaO2 85–96%) with the inspiration of 13% O2/87% N2. When a steady SaO2 baseline had been achieved, a bolus of O2 was delivered by switching from the cylinder delivering the hypoxic mixture to the cylinder with 100% O2 flowing through it. The switch was made near the endotracheal tube so that the change was as close to a step change as possible. CBFNIRS was calculated from EQUATION 5 by measuring the area under the rise in SaO2 over the integration time (shaded portion in Fig. 1) and regressing the result against the change in Hbdiff. The CBFNIRS measurements were considered acceptable if they fulfilled the following criteria based upon previous studies (Edwards et al., 1988; Elwell et al., 1994): (a) The SaO2 baseline before the introduction of oxygen was between 85 and 96% saturation and varied only by one point >2% during the 5 s immediately prior to the takeoff point (Fig. 1); (b) the SaO2 rose by at least 1%/s; (c) the change in the ratio of the HbT/Hbdiff was <0.25 during the measurement; (d) the change in end-tidal CO2 was <5% during the measurement; (e) the change in MABP was <5 mm Hg during the measurement.
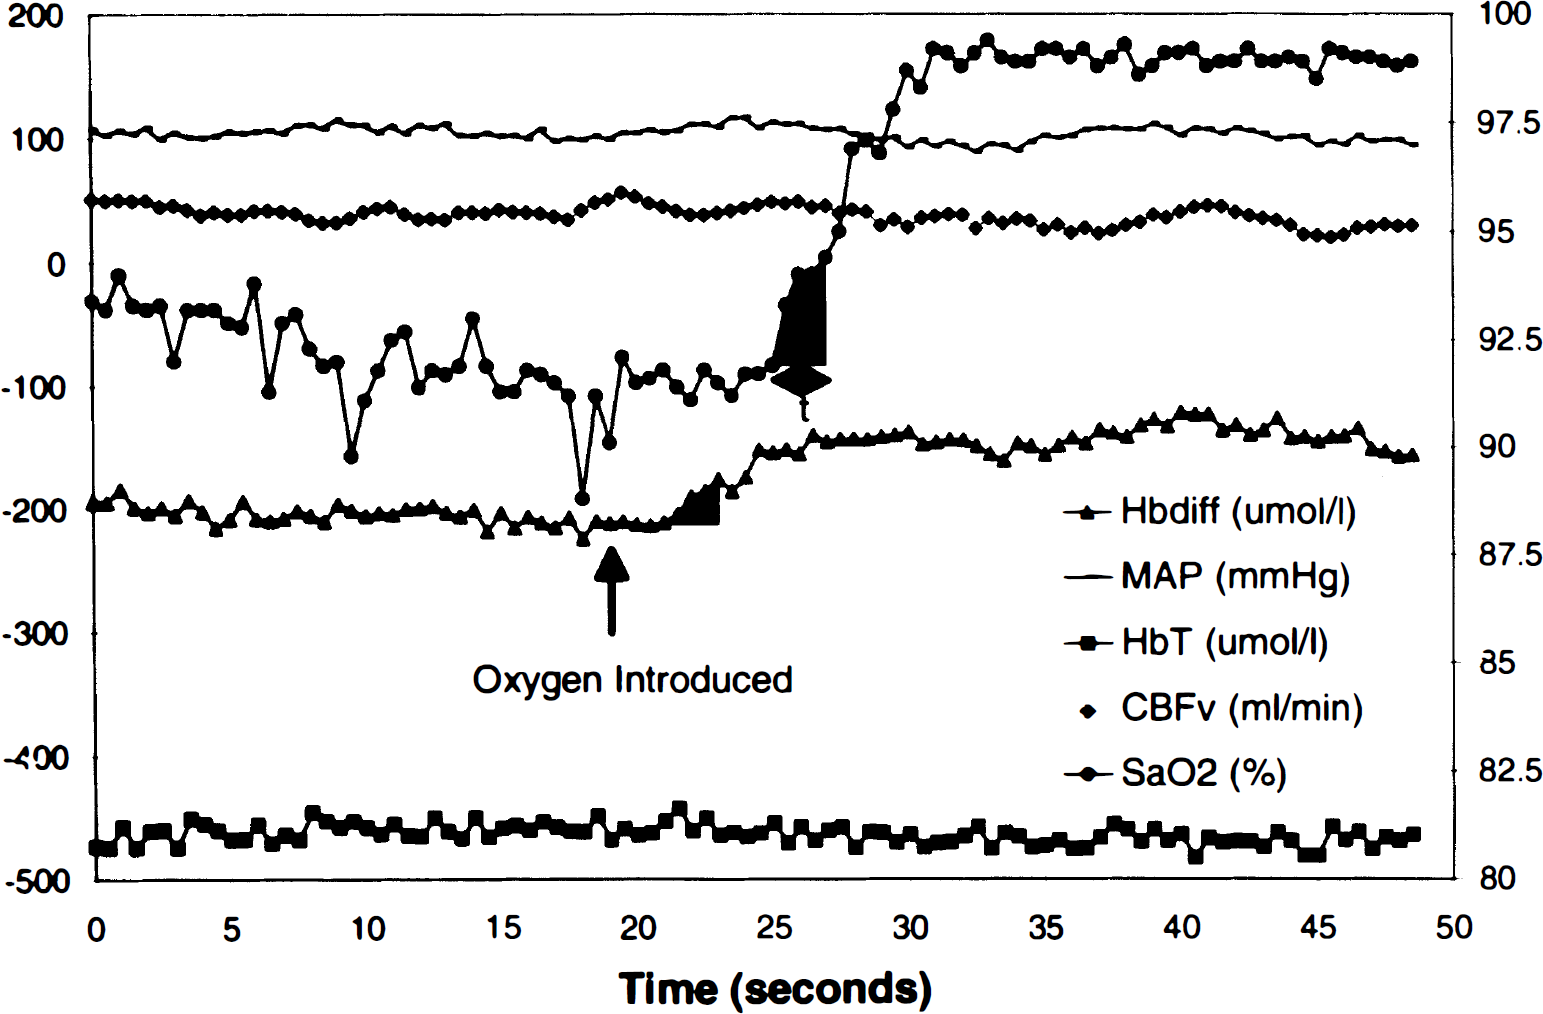
Measurement of CBF with NIRS. Panel shows changes in parameters during CBF measurement: peripheral SaO2 signal, with calculation of the amount of tracer introduced (shaded area) in time t; Hbdiff (HbO2 – DHb), HbT (HbO2 + DHb), MABP, and CBFv. Arrow shows time when oxygen was introduced. See text for abbreviations.
At least six NIRS measurements were made for each microsphere measurement and PaCO2 level. The means of the accepted values were used for comparison with the microsphere measurements. The single accepted measurements were compared directly with the CBFv. A differential pathlength factor (DPF) of 4.39 was used for the calculations, based upon neonates and other animals (Cope, 1991).
In eight dogs CBFNIRS was calculated in four different ways: (a) with the peripheral signal and a standard integration time (t) of 2.5 s; (b) with the peripheral signal and t altered according to an estimate of the mTT based upon previous indocyanine green measurements (Fig. 2); (c) with the central signal and t = 2.5 s; (d) with the central signal and t = estimated mTT.
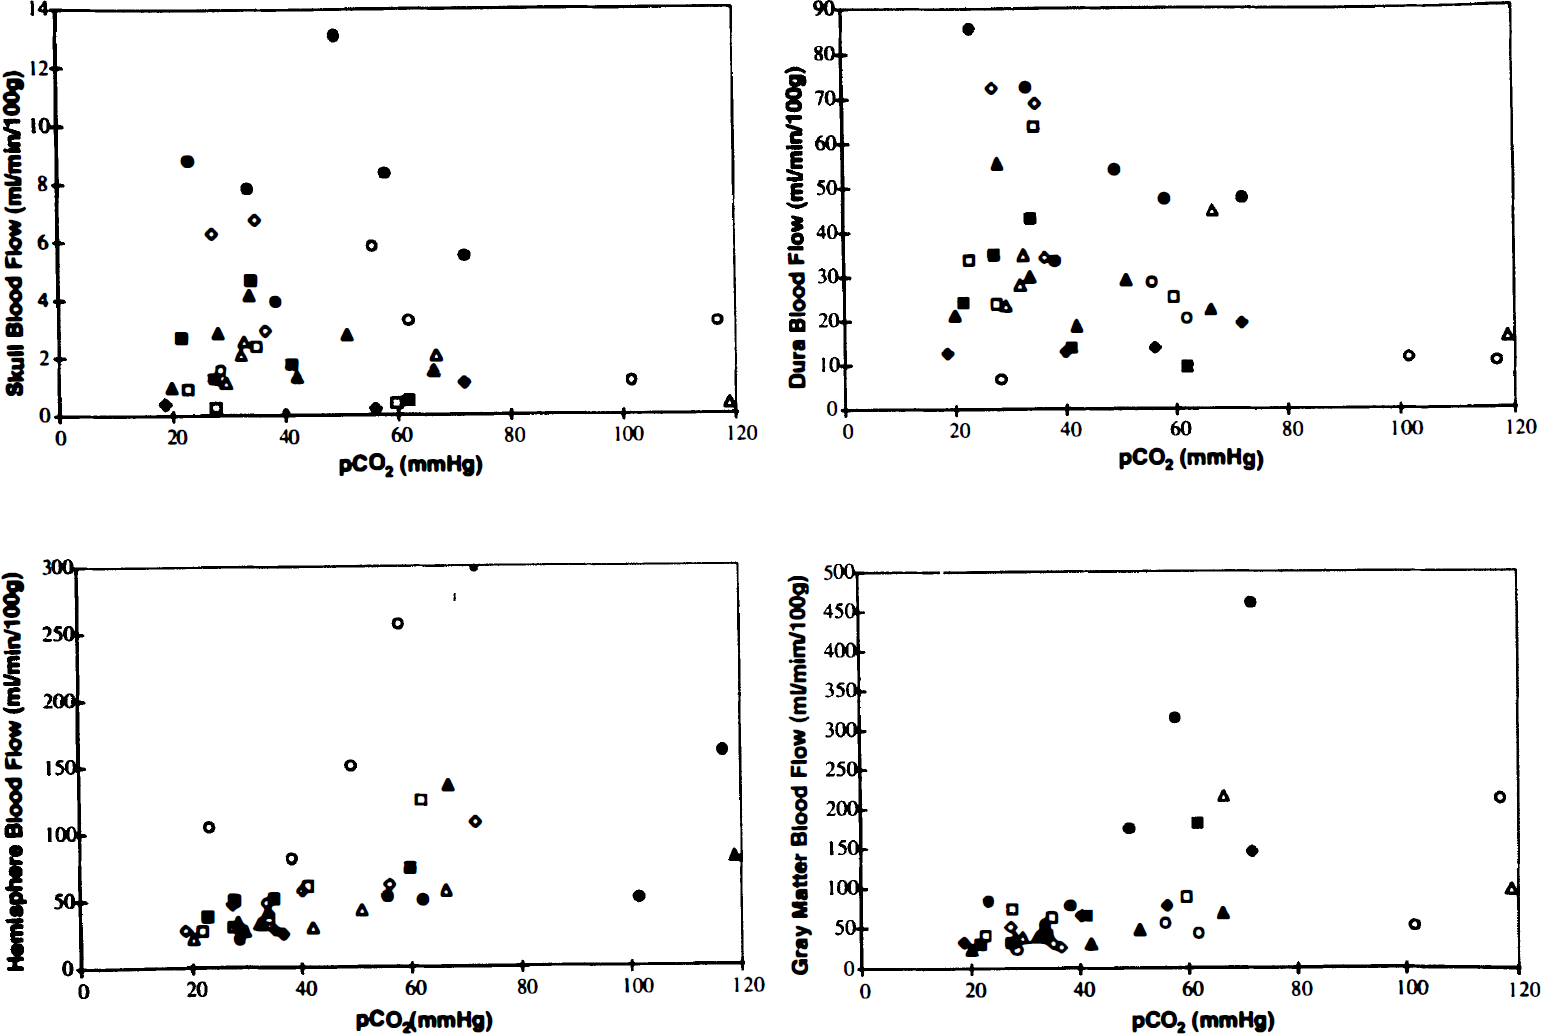
PaCO2 versus regional blood flow, measured by microspheres. Each symbol represents a single experiment. Blood flow through the outermost cortical core sample and the hemisphere was sensitive to changes in arterial PaCO2. In contrast there was no relationship between blood flow and PaCO2 in the skull and dura.
CBFμ measurements.
Regional CBF values were measured with radiolabeled microspheres using the reference sample method (Heymann et al., 1977). Microspheres were injected into the left cardiac ventricle, and the reference blood sample withdrawn from a brachiocephalic artery using a Harvard withdrawal syringe pump. Intraventricular pressure recordings were taken before and after each injection to verify that the left ventricular catheter was in position at the time of the injection. Approximately 4 × 10⁶ microspheres of six isotopes, 153Gd, 114In, 113Sn, 103Ru, 95Nb, and 45Sc, were injected in random sequence in each animal (Marcus et al. 1976).
At the conclusion of the experiment, the animal was killed by intravenous potassium chloride injection. The brain was removed and placed in 10% buffered formalin for 2–7 days. Samples of bone (>2 g) and the dura over the left hemisphere were also taken. The left and right halves of the brain were dissected into discrete areas: gray matter (cortical gray matter and caudate nucleus), white matter, and a core of brain tissue cut from the brain situated between the NIRS probes. This core was horizontally sectioned into five slices (designated core 1–5) ∼1 mm thick. The outmost slice (core 1) consisted of cortical gray matter, while gray matter flow consisted of blood flow measured in both cortical and deep gray matter (e.g., basal ganglia). Slices 2–5 consisted of blood flow of varying combinations of white and gray matter measured at different depths, since the depth of penetration of NIR light into the brain is an unknown variable. After weighing, the tissue samples were placed in counting vials and counted in a United Technologies Packard autogamma series 5000 scintillation spectrometer with appropriately positioned energy window settings for the isotopes. Window counts were corrected by application of an algorithm that utilizes experimentally determined overlap coefficients to correct for overlapping areas of the energy spectrum among isotopes. CBF values were calculated from the following equation:
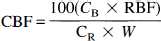
where CBF is regional CBF (ml 100 g−1 min−1), CB is brain tissue counts, RBF is reference blood sample withdrawal rate (ml min−1), CR is counts in the reference arterial blood sample, and W is tissue weight (g).
CBFv measurements.
The CBFv was used to monitor CBF during the hypoxic swings required for the NIRS measurements and to determine the predictive interval of the CBFNIRS since this technique has less intrinsic variability than the microsphere technique. Briefly, the confluence of the cerebral sinuses was cannulated, the lateral sinuses were occluded with bone wax, and the blood drained was diverted through a calibrated electromagnetic flow probe (Biotronix) before being returned to the dog via the femoral vein (Traystman and Rapela, 1975). The readings from the probe were calibrated before and after the set of six NIRS measurements.
Experimental protocol
The CBF level was changed by either altering ventilation or adding carbon dioxide (CO2) to the inspired air mixture. Measurements of CBFNIRS and CBFμ were attempted only if the end-tidal CO2 was stable for at least 15 min, switching from one side of the ventilator cylinder delivering the hypoxic mixture to the ventilator cylinder containing 100% oxygen caused no changes in end-tidal CO2, MABP was stable, and in the dogs prepared for the CBFv technique, the CBFv was stable. Fifteen to thirty minutes before measuring CBF, the animal was given pancuronium (0.1 mg/kg), pentobarbital, fluid, and sodium bicarbonate [ml NaHCO3 = (base excess × 0.3)/2], if deemed necessary. Arterial blood samples were withdrawn from the brachial artery catheter at the nadir of SaO2 and after the 100% O2 was administered during the first and last CBFNIRS measurements and before each microsphere measurement at each PaCO2 level. The blood was used to determine pH, PaO2, and PaCO2 (ABC-3 Radiometer, Denmark), O2 content, hemoglobin content, hemoglobin saturation (OSM3 Hemoximeter, Radiometer, Denmark), glucose, and lactate (2300 Stat Yellow Springs). The measurements on the Hemoximeter were performed with the machine calibrated for dog blood.
Three CBFNIRS measurements were made, then a microsphere measurement was made at the nadir of SaO2 of the fourth CBFNIRS measurement, followed by at least two additional CBFNIRS measurements. The CBFNIRS measurements were considered only if the animal remained stable without fluctuations in end-tidal CO2 and MABP during the 30–45 min required to perform six CBFNIRS measurements and a microsphere measurement. The validities of the CBFμ and CBFv were assessed by comparing these with each other. To determine the CV of the CBFμ, three sets of microspheres were injected within 2 min in animals that were hemodynamically stable. The CBFv measurements were correlated with the CBFμ for comparison with the CBFNIRS measurements.
Data analysis
Each of the CBFNIRS measurements was inspected to determine if it fulfilled the criteria stated previously. The mean and standard deviation of the CBFNIRS measurements were calculated for each microsphere measurement at each PaCO2 level. The CV was calculated from the standard deviation/mean and expressed as a percentage. Results were analyzed on an experiment-by-experiment basis by visual inspection and by correlation analysis, since the underlying hypothesis to be tested was that the CBFNIRS and either CBFμ or CBFv should be proportionally related with all data pairs falling on a straight line, preferably the line of identity in each animal. We used the correlation coefficient to compare the strength of the relationship between the NIRS measurements and the regional blood flow in the different animals and compare the CBF measured by the different techniques. Linear regression analysis was performed for the calibration of the oximeters. The Student t test was used to compare microsphere-measured blood flow between the two sides.
RESULTS
CBFμ measurements
Whole-brain blood flow ranged from 14 to 290 ml 100 g−1 min1. The median CV of the whole-brain blood flow in four animals in which three microsphere measurements were made under stable conditions was 11.16% (range 1.16–13.65%). There was no difference in the CV of the blood flow between the regions, including the dura and bone. In seven preparations in which the CBF was measured by microspheres and the venous outflow, the median correlation coefficient between these two techniques was 0.94 (range 0.77–0.98).
In the eight preparations with CBFμ and CBFNIRS measurements that maintained responsiveness to PaCO2 throughout the experiment, the blood flow in left gray matter and left core 1 tissues responded more than any of the other tissues to changes in PaCO2, while the blood flow in skull and dura showed little consistent response to PaCO2 (Fig. 2). There were no significant differences in the CBFμ measured in the gray matter, hemisphere, or core tissue samples between the sides (Student's t test, p > 0.05).
CBFNIRS measurements
The optodes were placed 4.02 ± 0.48 cm apart on the left skull.
Five hundred forty-nine CBFNIRS measurements were attempted in 16 dogs using the peripheral hemoglobin saturation signal with an integration time of 2.5 s. Only 198 (36.1%) measurements were considered to be acceptable using our selection criteria. The remaining 351 measurements were rejected because (a) SaO2 baseline was unstable (23.3%), (b) SaO2 baseline was <85% (8.0%), (c) SaO2 rose poorly (19.3%), and (d) HbT/Hbdiff ratio changed by >0.25 (23.0%). The CBFNIRS ranged from 9.89 to 229.2 ml 100 g−1 min−1 and the CV of the measurements had a median of 29.1% (range 3.8–102.9%).
In the eight dogs in which CBFNIRS could be calculated from the peripheral signal at three or more different microsphere measurements, the peripheral signal correlated best with the microsphere flows in first slice of core tissue (left core 1), i.e., cortical gray matter (median 0.43, range 0.16–0.93) and left hemisphere (median 0.34, range 0.18–0.88) (Table 1). Although the median correlation coefficient between the CBFNIRS and microsphere flow in the data was 0.79, the range included negative correlation in three animals. The order of the tissue correlation coefficients in the tissues varied between the animals. In the comparison with the CBFμ in the left hemisphere, the CBFNIRS measurements fell away from the line of identity (Fig. 3), particularly at higher flows (Fig. 4).
Correlation coefficients of blood flow
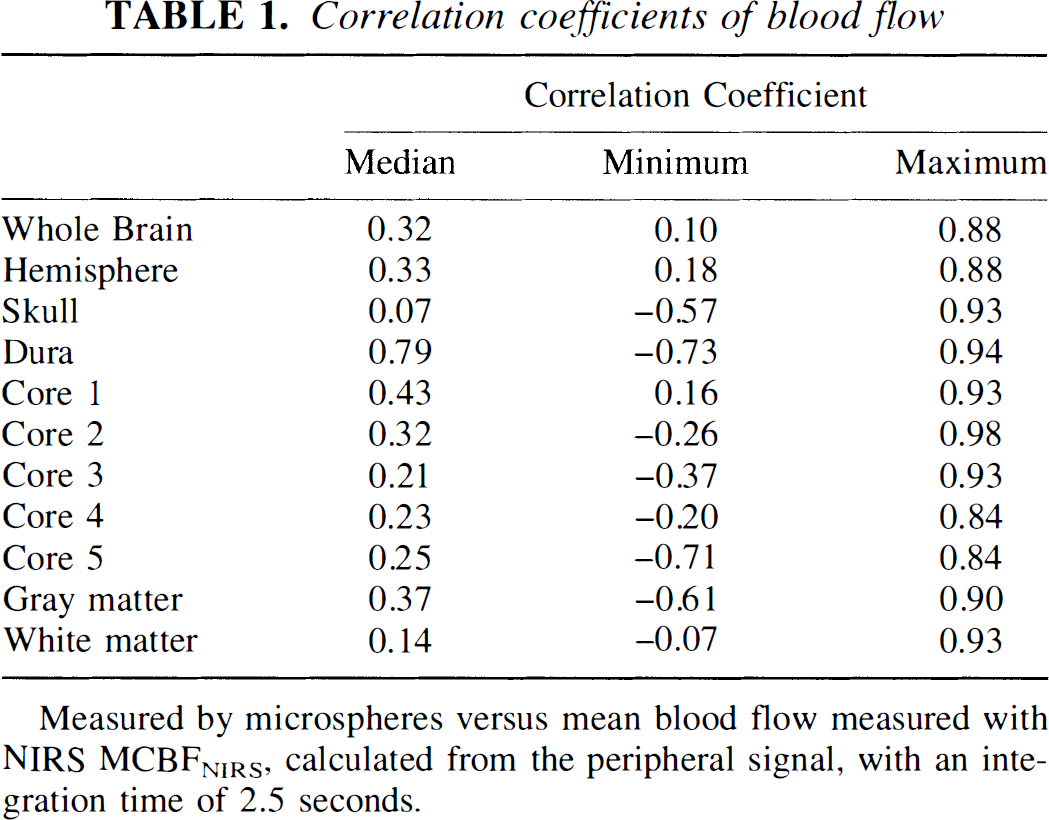
Measured by microspheres versus mean blood flow measured with NIRS MCBFNIRS, calculated from the peripheral signal, with an integration time of 2.5 seconds.
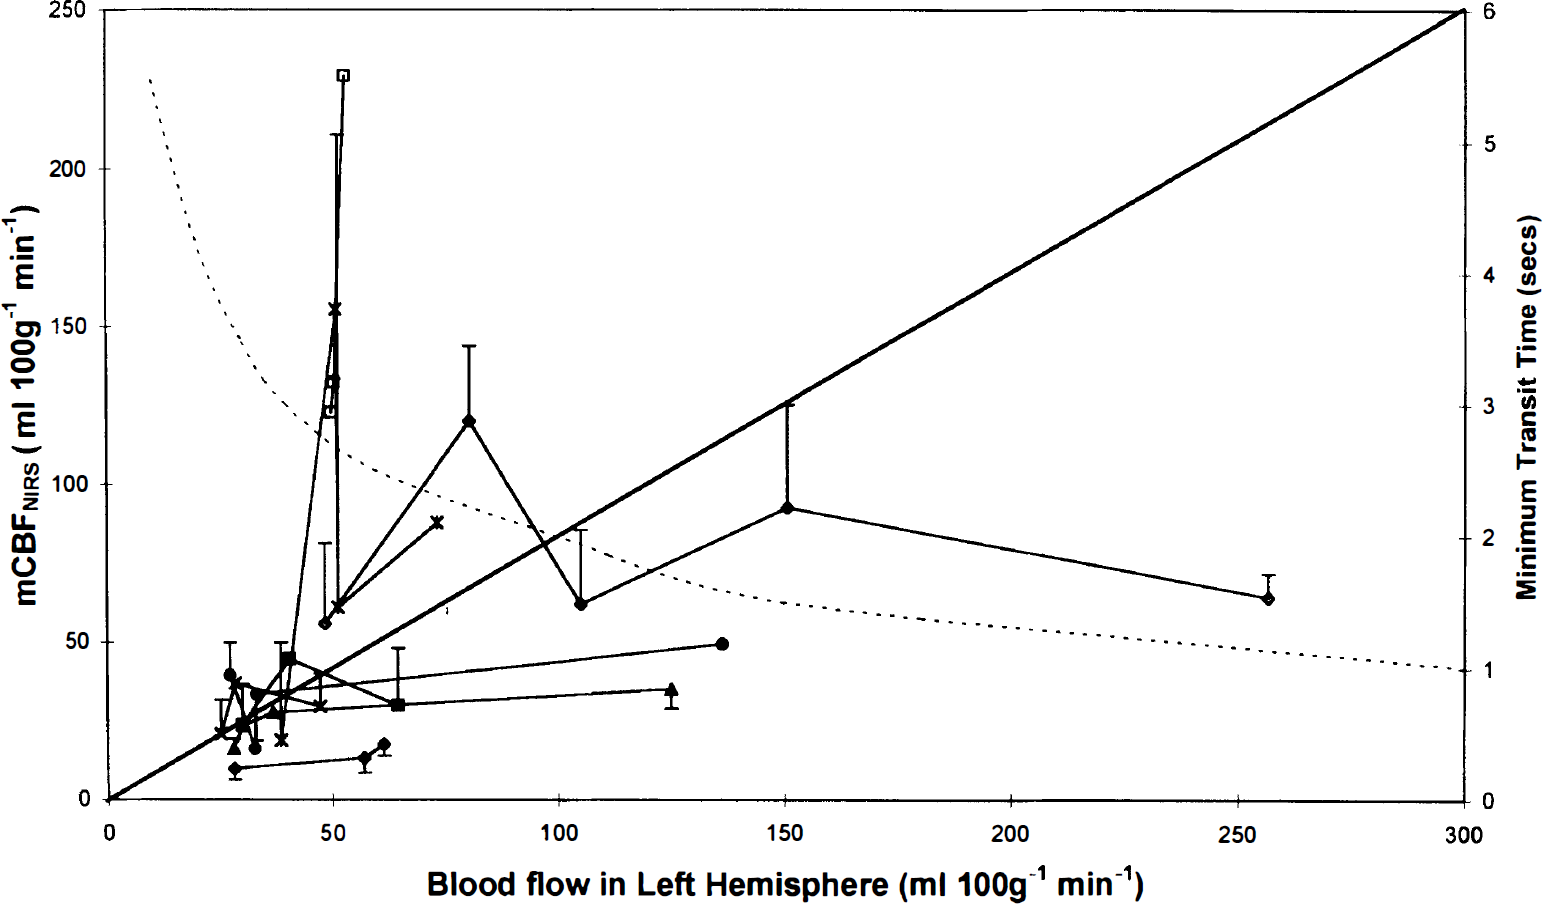
Blood flow in the left hemisphere measured by microspheres plotted against mean CBFNIRS (mCBFNIRS) and estimated minimum transit time (dotted line) derived from previous experiments. Each symbol represents a single experiment. Error bars representing 1 SD are shown for the mCBFNIRS when there were three or more acceptable runs.
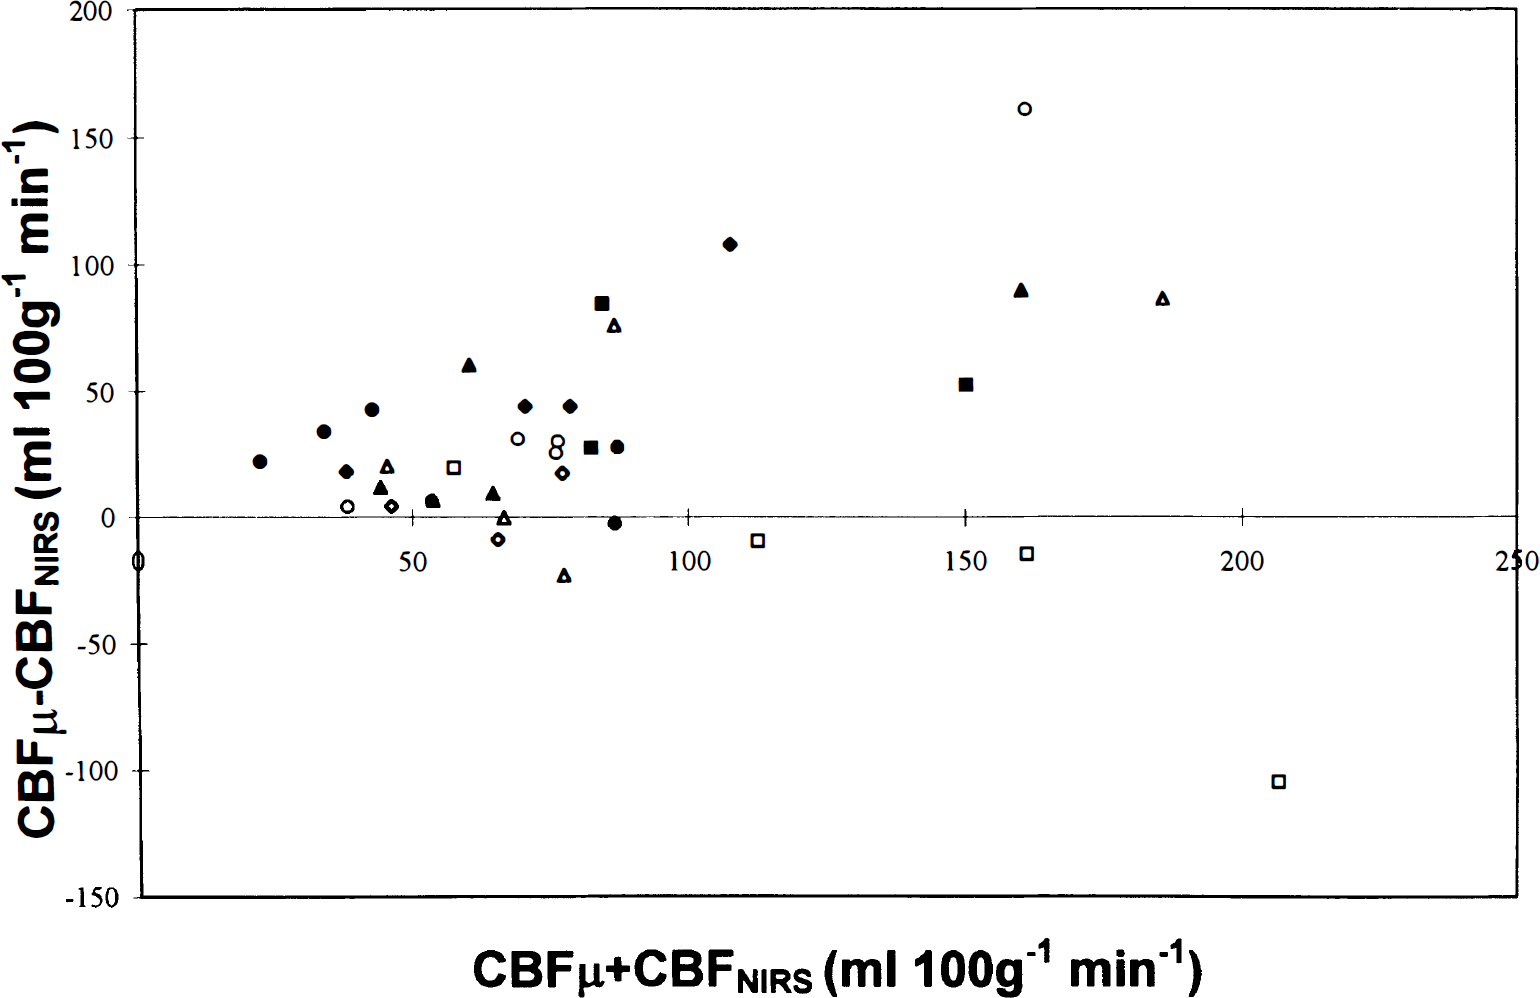
Difference between the blood flow in left hemisphere measured with microspheres (CBFμ) and mean CBFNIRS (mCBFNIRS) plotted against the average of CBFμ and mCBFNIRS, showing an increase in the difference as CBF increases. Each symbol represents a single experiment.
The correlation coefficient, CV, and number of acceptable CBFNIRS measurements were improved by using the central saturation signal instead of the peripheral saturation signal and altering the integration time to take into account the change in transit time estimated from microsphere measurements (Table 2). The CBFNIRS correlated best with the left core 1 and left gray matter regardless of the method used to calculate the CBFNIRS.
Comparison of the different methods of measuring mean CBFNIRS with CBF measured by microspheres (CBFμ) and single CBFNIRS and venous outflow (CBFv)
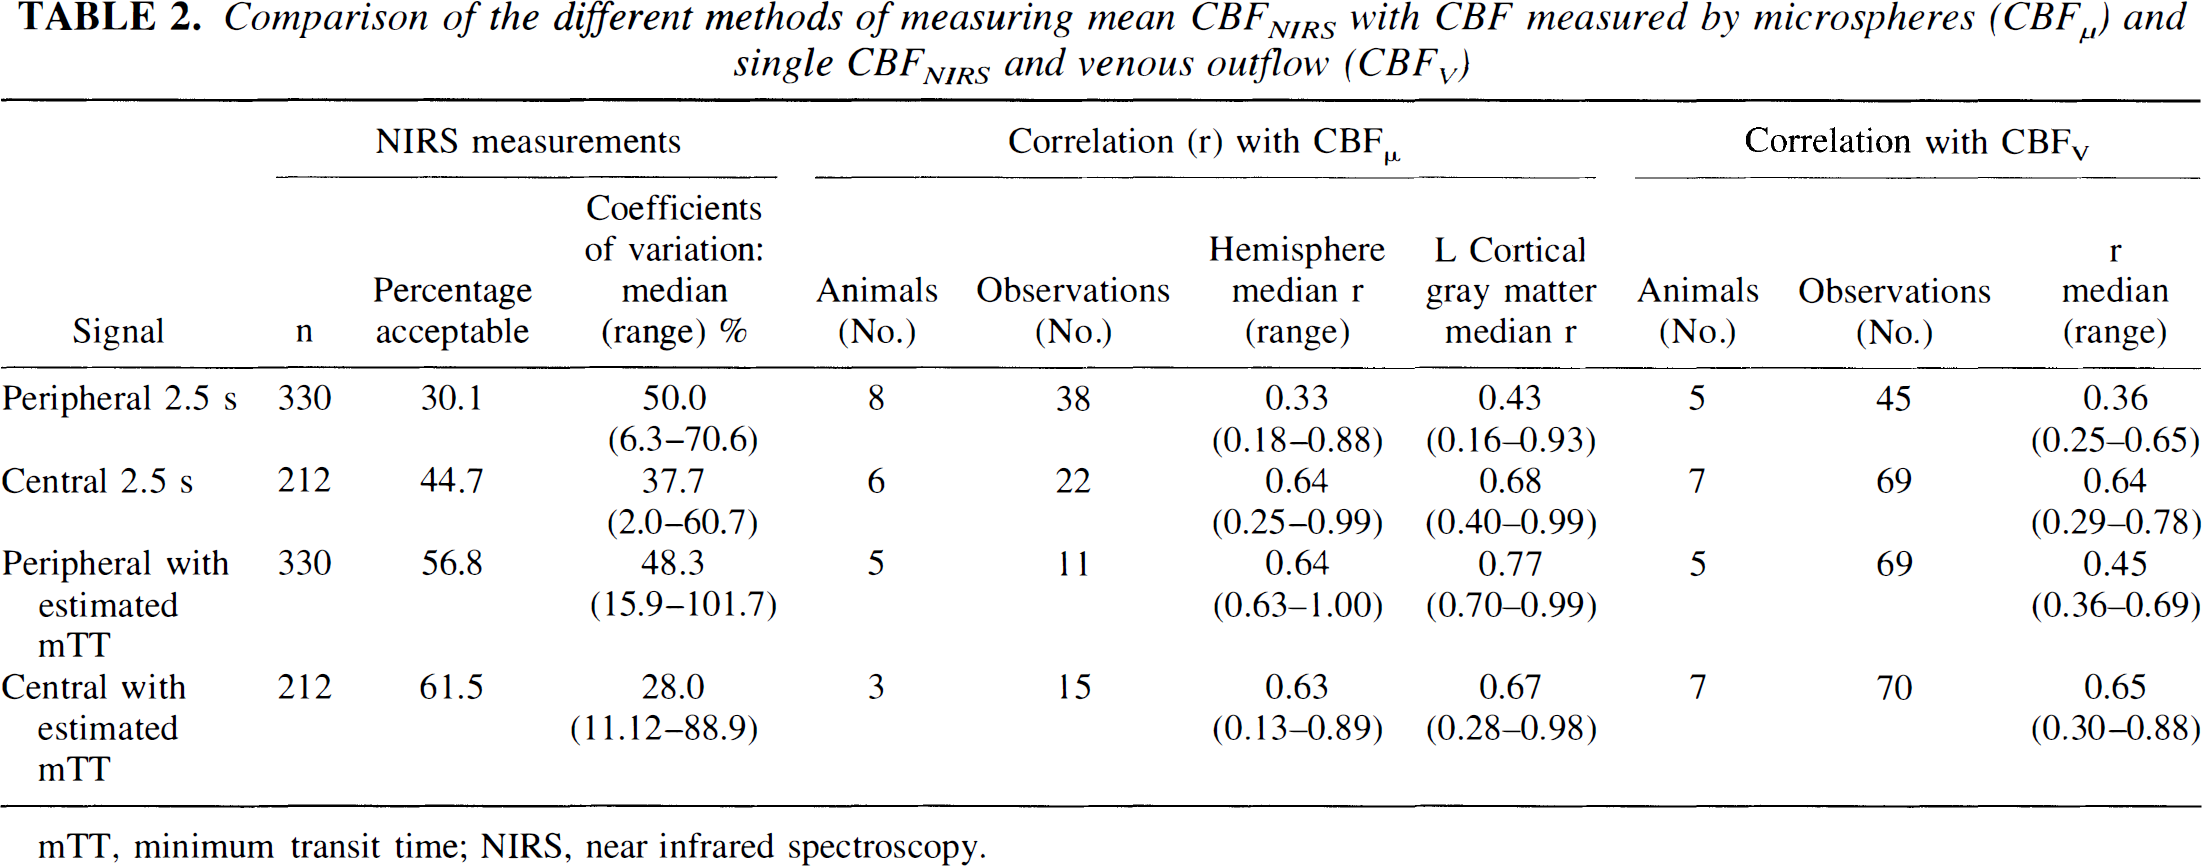
mTT, minimum transit time; NIRS, near infrared spectroscopy.
CBFNIRS and CBFv
The correlation between the individual CBFNIRS and CBFv was worse than that between the mean CBFNIRS and CBFμ. The percentage change in the CBFv during the entire CBFNIRS measurement (i.e., the induction of hypoxia and the administration of 100% O2) did not correlate with the minimum arterial content or the minimum SaO2 during the measurement, although changes occurred only when the SaO2 was <96%. The percentage change also did not correlate with the amount of change in arterial content or SaO2 during the measurement or the change in HbT during the Hbdiff increase.
DISCUSSION
NIRS is a potentially exciting technique for measuring CBF, since it may directly measure oxygen delivery to the brain. We found that NIRS detects blood flow in the brain, but this method using oxygen as an intravascular marker in the reflectance mode is an inaccurate measure of CBF. The correlations between the CBF measured by NIRS using the SaO2 signal from the peripheral tissues and a fixed integration time (used in clinical studies), and the CBF measured by microspheres (Fig. 3) or cerebral venous outflow technique are poor. The correlation was improved by using the central SaO2 signal directly from an artery and varying the integration time with an estimate of the mTT. Even with these improvements, CBFNIRS tended to underestimate the CBF.
The CBFNIRS method using oxygen as an intravascular marker correlated with xenon measurements of CBF in neonates (Skov et al., 1991; Bucher et al., 1993). Neonates have low CBF (10–30 ml 100 g−1 min−1), which is associated with long transit times (Fig. 3), so that the accuracy of the measurements can be improved by examining more data points and allowing a larger input of tracer within the mTT. Furthermore it is possible to position the optodes in the transmission mode in neonates, thereby reducing the extracranial contamination to that of the xenon method. We examined the CBFNIRS method in the reflectance mode since this is required for older children and adults.
The discrepancies between the CBFNIRS and the other methods for measuring CBF could be caused by changes in the DPF, extracranial contamination, changes in CBF, or consumption of the intravascular marker, oxygen, during the measurements. The DPF is essential for the quantitative measurements of the chromophores. It takes into consideration that the distance light travels is further than the spacing between the optodes, since the light is scattered by the tissue. The DPF depends upon the optical properties of the tissue and the measurement geometry. The contribution of the skull to the DPF in transmission across a rat's head as measured by time of flight was near 10% (Delpy et al., 1989). However, in the reflection mode across the larger head of the dog, the contribution of the skull to the DPF may be greater (Hiraoka et al., 1993). We were not able to measure the DPF, but used an estimate of 4.39 based upon other experimental data (Cope, 1991). This may account for the underreading of the CBFNIRS compared with the CBFμ in Fig. 3, but would not affect the correlation coefficients or account for the nonlinear variation with blood flow. The DPF varies considerably between subjects; in rats the mean and standard deviation were 5.26 and 0.31, respectively (Delpy et al., 1989). The DPF also varies with changes in the amount of DHb and HbO2, although in the rat and the human the changes induced by breathing 12–100% oxygen were <6% (Delpy et al., 1989; Ferrari et al., 1990). Thus, although we could not measure the DPF, changes in the DPF should have little effect on the interpretation of results within an animal.
An important consideration of the NIRS measurements of cerebral hemodynamics in the reflection mode is the amount of extracranial contamination. By altering the CO2, we were able to change the blood flow in the intracranial compartment without significant changes in the extracranial compartment (Fig. 2). These data suggest that the extracranial compartments (skull and dura in these preparations) make a variable contribution to the CBFNIRS in the animals, since in some animals the microsphere-measured flows in the skull and dura correlated best with the NIRS measurements, while in other animals the correlation was the least compared with other tissues. Thus the median correlation coefficient of the measurements between the NIRS and dural blood flow was 0.79, but the range (−0.73 to 0.94) included three negative correlation coefficients. Overall, however, the most reliable correlations occurred between the CBFNIRS and the microsphere flows in core 1, i.e., cortical gray matter, hemisphere, and whole brain (Table 1), suggesting that NIRS detects intracranial blood flow. The order of the correlations, however, among these tissues varied between animals, suggesting that the contribution of the different tissues to the NIRS signal varied with animal. This, together with the differences in the DPF, makes comparisons between subjects difficult.
The CVs of the NIRS measurements are high, both in clinical studies (Skov et al., 1991; Bucher et al., 1993; Elwell et al., 1994) and in this study. This could be caused by (a) the quality of the peripheral signal, from which the amount of tracer introduced into the system is calculated; (b) the measurements not taking place within the mTT; (c) changes in CBF secondary to the hypoxia induced for the measurement; (d) loss of oxygen within the mTT; and (e) changes in the distribution of the NIR signal with CBF.
Most clinical studies have used a saturation monitor attached to an ear or finger to detect the changes in SaO2. The quality of the SaO2 signal is important since 43% of the CBFNIRS measurements had to be excluded because the SaO2 baseline was not stable or the rise in the SaO2 was not smooth. We found that the percentage of rejected measurements was reduced by using the signal direct from an artery.
One of the prerequisites of this method is that the calculations must occur within the mTT, so that the venous outflux is zero. By altering the calculations to include an estimate of the mTT, the correlation between the NIRS measurements and the microspheres or CBFv was improved and the number of unsuccessful measurements and CV was reduced. Although the mTT can be measured with the NIRS using indocyanine green (Ferrari et al., 1992), the bolus has to be delivered into the carotid circulation, as a large bolus into the venous circulation does not provide a good-quality signal in the head.
The Fick principle assumes that there is no consumption of the tracer within the measurement period. There is evidence that oxygen diffuses from the arterioles within the mTT. In hamster retractor muscle, about two-thirds of the net decline in SaO2 occurs in the arterioles under resting conditions (Swain and Pittman, 1989). Similar studies, however, have not been reported in the brain, although the amount of oxygen unloaded during the NIRS measurement is thought to be <6% (Elwell et al., 1994).
Another assumption of the NIRS method is that the CBF does not change with the induction of mild hypoxia (SaO2 > 85%) required to make these measurements. There is no overall change in CBF during small changes in PaO2 in humans (Siesjo, 1978). Likewise Kogure et al. (1970) found that CBF did not increase until the PaO2 was below 60 mm Hg in dogs, although Traystman et al. (1978) found a linear relationship between a stepwise reduction in O2 content and CBF. We found that CBF did not change overall during most hypoxic runs, although fluctuations in CBFv occurred during most measurements. In most cases there was an initial increase in CBFv as the animal was made hypoxic, followed by a reduction of CBFv with the administration of 100% O2 (Fig. 1). There was up to a median of 12% change in CBFv during the hypoxic runs, although the percentage change did not correlate with the change in O2 content, possibly because differences in the depth of anesthesia between the animals.
We are unable to calculate the overall limits of agreement (Bland and Altman, 1986) between the CBFNIRS and the other measures of CBF, since each animal had a different number of acceptable NIRS measurements. The CBFμ provided measurements of regional CBF but has an intrinsic variability (median 11.6%) that makes comparisons difficult. The CBFv allowed us to identify the changes in the CBF during the CBFNIRS measurements and compare single CBFNIRS measurements. The CBFv, however, measures global CBF, while the CBFNIRS is thought to be a measure of regional blood flow.
In conclusion, NIRS detects blood flow in the brain in most subjects, but measurement of CBFNIRS in the reflectance mode, using oxygen as an intravascular tracer is inaccurate, particularly at high CBF values (Fig. 3). Furthermore, many of the measurements have to be discarded and there is a high CV of the remaining measurements. The causes of the inaccuracy are likely to be a combination of factors. We have identified the variable contribution of the extracranial compartment and changes in CBF induced by the NIRS measurements to be responsible for some of the inaccuracy and the quality of the saturation signal to be important in determining the number of acceptable measurements. However, diffusion of oxygen within the mTT and changes in the DPF during the measurements may also contribute. The major differences between this validation study and others that showed a better correlation (Skov et al., 1991; Bucher et al., 1993) were higher flow values, shorter mTT, and greater contamination because of a reflection geometry and thicker, denser extracranial tissues. To improve the accuracy and reduce the variability of the CBFNIRS measurements in older subjects with higher flows, the DPF should be measured at the time of the CBF measurement, instruments with faster sampling times and lower noise need to be developed, and a greater increase in intravascular marker needs to be produced in a shorter time period.
Footnotes
Abbreviations used
Acknowledgements
We thank Professor R. Royall for statistical advice.