
Abstract
Gaining insights into brain oxygen metabolism has been one of the key areas of research in neurosciences. Extensive efforts have been devoted to developing approaches capable of providing measures of brain oxygen metabolism not only under normal physiological conditions but, more importantly, in various pathophysiological conditions such as cerebral ischemia. In particular, quantitative measures of cerebral metabolic rate of oxygen using positron emission tomography (PET) have been shown to be capable of discerning brain tissue viability during ischemic insults. However, the complex logistics associated with oxygen-15 PET have substantially hampered its wide clinical applicability. In contrast, magnetic resonance imaging (MRI)-based approaches have provided quantitative measures of cerebral oxygen metabolism similar to that obtained using PET. Given the wide availability, MRI-based approaches may have broader clinical impacts, particularly in cerebral ischemia, when time is a critical factor in deciding treatment selection. In this article, we review the pathophysiological basis of altered cerebral hemodynamics and oxygen metabolism in cerebral ischemia, how quantitative measures of cerebral metabolism were obtained using the Kety–Schmidt approach, the physical concepts of non-invasive oxygen metabolism imaging approaches, and, finally, clinical applications of the discussed imaging approaches.
Keywords
Early approaches measuring global cerebral hemodynamics
Whole brain cerebral metabolism in normal awake adults 3 .
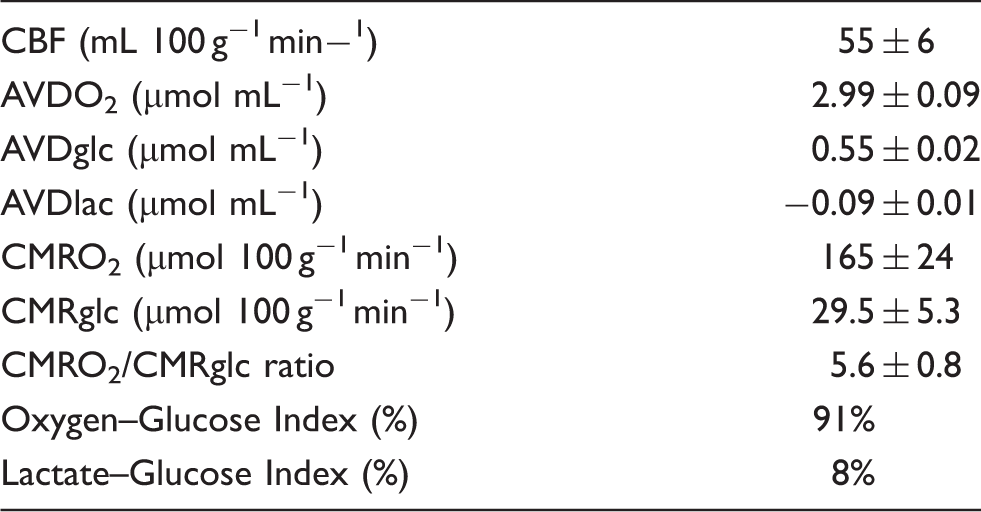
AVDO2: arterio-jugular venous difference of oxygen; AVDglc: arterio-jugular venous difference of glucose; AVDlac: arterio-jugular venous difference of lactate; Oxygen-Glucose Index: 100 AVDO2/6 AVDglc, the percentage of glucose metabolized to H2O and CO2; Lactate-Glucose Index: 100 AVDlac/2AVDglc, the percentage of glucose metabolized to lactate.
Alteration of cerebral hemodynamics during acute cerebral ischemia
CBF is regulated by the cerebral perfusion pressure (CPP) and the cerebrovascular resistance (CVR) with the following relationship

CPP is equal to the difference between arterial and cerebral venous pressures. Cerebral venous pressure is negligible unless there is an elevated intracranial pressure (ICP) or venous obstruction. Under a constant CPP, alteration of CVR will lead to changes in CBF. CVR is determined by blood viscosity, vessel length, and vessel radius. Of these parameters, only vessel radius is amenable to rapid physiological regulation. Thus, the control of CBF under conditions of normal CPP is determined by the caliber of the resistance vessels, primarily arterioles, which dilate or constrict in response to a variety of stimuli.
When CPP falls, the cerebral vasculature can respond with two compensatory mechanisms serving to maintain the normal delivery of oxygen and nutrients. First, arterioles can dilate in order to reduce vascular resistance and maintain CBF at near normal levels. 8 This phenomenon, termed autoregulation, operates over a wide range of perfusion pressure reductions. 9 The second compensatory mechanism functions through increases in oxygen extraction fraction (OEF).10,11 When the delivery of oxygen falls, the amount of available oxygen extracted from the blood can increase in order to maintain normal oxygen metabolism. OEF can increase from a baseline of 40% to up to 90%.12–14 There are slight increases in OEF through the autoregulatory range, as CBF falls at a slight, but constant rate.10,15,16 OEF increases dramatically once the autoregulatory capacity has been exhausted and CBF declines markedly. However, at maximal oxygen extraction, any further reduction in CBF results in a decline of CMRO2, leading to a cascade of cellular events that may progress to neural cell death. Therefore, a non-invasive means to probe these alterations of cerebral hemodynamics, particularly OEF and CMRO2, may be useful in differentiating viable from infarcted tissue.
Imaging approaches providing regional measures of cerebral oxygen metabolism
Although feasibility of measuring cerebral oxygen metabolism has been demonstrated using several different imaging modalities, including positron emission tomography (PET), magnetic resonance imaging (MRI), and near infrared spectroscopy (NIRS),17,18 a review of the two most widely used imaging modalities, namely PET and MRI for obtaining quantitative measures of cerebral oxygen metabolism will be provided in this article. In particular, more emphasis will be given to MRI owing to its wide availability in both research as well as clinical arenas.
Positron emission tomography
While global measurements of cerebral oxygen metabolism had provided physiological insights into normal and, more importantly, altered cerebral oxygen metabolism in response to diseased conditions, measuring regional CMRO2 (rCMRO2) was largely impossible until the development of oxygen-15 radiotracer techniques. These techniques made it possible to measure regional CBF (rCBF) with oxygen-15 water or oxygen-15 carbon dioxide, regional cerebral blood volume (rCBV) with oxygen-15 carbon monoxide, and rOEF and rCMRO2 with oxygen-15 oxygen in combination with rCBF and rCBV.19,20 However, it was not until the invention of PET with improved spatial resolution and image quality that accurate quantitative, in vivo measurements of rCBF, rCBV, rOEF, and rCMRO2 became practical.
Molecules labeled with radioactive atoms have been utilized extensively for many years to investigate physiology and pathology. These radiotracers are administered to an organism in such small quantities that they do not affect the physiologic process under study. Yet, the radioactivity is sufficiently high to be measured by an appropriate detection system. For external detection of the radiation emitted by internal radiotracers (or emission CT), the desired data in the reconstructed image is the quantitative spatial distribution of the radioactivity. PET employs the physical properties of positrons to provide accurate quantitation of regional radioactivity in vivo. Certain radionuclides decay by emission of a positron, a small particle with the same mass as an electron but positively charged. After traveling a few millimeters through tissue, the positron interacts with an electron, resulting in the destruction of both. This annihilation generates two photons (gamma rays) that travel away from the annihilation site at 180° in opposite directions. A pair of external radiation detectors positioned on either side of a positron-emitting source will register these photons almost simultaneously. (The difference in time is equivalent to the difference in the distance the two photons travel divided by the speed of light.) If a detector pair connected by an electronic circuit is designed to register signal of two photons arriving within a short time interval, then only photons arising from positron annihilations occurring between the detector pair will be recorded. The fraction of radioactivity (attenuation) lost due to absorption by surrounding tissue can be measured accurately and then corrected using the following approach. For a pair of annihilation photons, the tissue composition and total distance traveled by both gamma photons will be the same regardless the location where annihilation occurs. The attenuation fraction for any pair of coincidence detectors relative to a specific object will thus be the same whether the annihilation occurs internally or externally to the object. This measurement can be accurately achieved prior to an internal administration of any radiotracers by a positron emitting source placed between the detector pair and outside the head (or other part of the body to be studied). When a radiotracer is administered, this individually measured attenuation fraction is used to correct the number of coincidence events recorded by the detector pair from inside the body. This yields the actual number of positron annihilations that took place within its field of view. In older model PET scanners, photon absorption was directly measured with an externally located positron-emitting radionuclide source such as 68Ge-68Ga rings or radiating rods. Some modern scanners combine PET with CT and use a calculated “attenuation correction” based on CT data.
A PET scanner consists of multiple rings, each with a large number of detectors. Each detector is connected by coincidence circuits to other detectors in the same or different rings. After corrections for attenuation, the information obtained from each of these detector pairs is used to construct a series of projections, each representing the distribution of regional radioactivity as viewed from a specific angle. These projections are then reconstructed to produce two-dimensional slices representing regional radioactivity within the field of view of the scanner. These individual slices can be combined into a true three-dimensional image. 21
PET studies of cerebrovascular disease are technically challenging because they require an on-site cyclotron and radiochemistry facility due to the short half-life of oxygen-15 of 2 min. Converting the PET measurements of radioactivity to quantitative physiological measurements requires a mathematical model that quantitatively relates the PET measurements to the physiologic variable under study. This model must take into account a variety of factors including delivery of the tracer to the tissue, distribution and metabolism of the tracer within the tissue, recirculation of metabolized and unmetabolized tracer and the amount of tracer remaining in the blood. Consequently, most quantitative PET methods require arterial blood sampling to provide input data for the tracer kinetics model and complex post-processing. 22
While a variety of PET methods for measuring rCBF have been proposed, most studies on patients with cerebrovascular disease have been performed with techniques that rely on oxygen-15 water as a flow tracer. The most widely used method for measuring rCBF with PET involves the continuous inhalation of oxygen-15-labeled carbon dioxide. 20 In the pulmonary vessels, oxygen-15-labeled carbon dioxide is rapidly converted to oxygen-15 water by carbonic anhydrase in red blood cells. The resulting oxygen-15 water circulates throughout the body and diffuses into the brain. After 5 to 10 min, a steady state in the brain is reached such that the amount of radioactivity entering as oxygen-15 water is equal to the amount lost by radioactive decay and venous outflow. Regional CBF can then be calculated if the arterial blood radioactivity is known. An alternative method for measuring rCBF with oxygen-15 water is based on the classic tissue autoradiographic technique of Kety and co-workers.23,24 This method utilizes a bolus intravenous injection of oxygen-15 water followed by a 40-s PET scan. An arterial time-activity curve sampled from a peripheral artery is also obtained. Any differences between the peripheral arterial curve and the cerebral arterial curve will lead to errors in calculated rCBF.22,25 Oxygen-15 water is incompletely extracted from the blood when flow is high, which results in underestimation of rCBF. However, the measurement is accurate at low CBF.26,27
Measurement of rCBV is performed following inhalation of air containing trace amounts of carbon monoxide labeled with either carbon-11 or oxygen-15. 28 The labeled carbon monoxide binds to hemoglobin in red blood cells and circulates throughout the body. When equilibrium between arterial and venous circulations is reached, regional radioactivity in the brain will be equal to the amount of labeled carboxyhemoglobin and therefore proportional to the regional red cell mass. By measuring the amount of radioactivity in a peripheral blood sample and correcting for the difference between the peripheral, major vessel hematocrit and the mean hematocrit of cerebral microvessels, the intraparenchymal cerebral blood volume can be determined.29,30 Regional CBV data can be used to correct other PET measurements regarding the amount of radiotracer remaining within the intravascular space. This correction is extremely important for measurements of oxygen metabolism, as discussed below. In addition, rCBV provides an index of local vasodilation, which is of value as an indicator of local reduction in tissue perfusion pressure.
Several different PET methods have been used to measure rOEF and rCMRO2 with oxygen-15 radiotracers.28,31 The steady-state method employs continuous inhalation of oxygen-15 carbon dioxide to measure rCBF as noted above followed by a second continuous inhalation of oxygen-15 oxygen. For accurate quantitation, arterial blood samples are collected. The contribution of intravascular oxygen-15 hemoglobin to the oxygen-15 oxygen image can be corrected by using data from a separately performed rCBV measurement, thus creating an image of tissue oxygen uptake alone.21,22 The ratio of the oxygen-15 oxygen image to the oxygen-15 carbon dioxide image produces an image in which counts are proportional to rOEF. Subsequently, the rOEF image can be combined with the oxygen-15 carbon dioxide image and measured arterial oxygen content to create a CMRO2 image. 32 The alternative brief inhalation method employs a brief inhalation of oxygen-15 oxygen combined with separately performed oxygen-15 water rCBF and oxygen-15 carbon monoxide rCBV scans. Arterial blood samples are collected rapidly, beginning at the time of radiopharmaceutical administration. Data are analyzed based on a three-compartment model that accounts for intravascular O-15 hemoglobin and O-15 water from systemic and cerebral metabolism. 23 The brief inhalation method for measuring OEF has been validated for a wide range of CBF, OEF, and CMRO2.33,34 Several other PET rOEF methods have also been developed.35,36
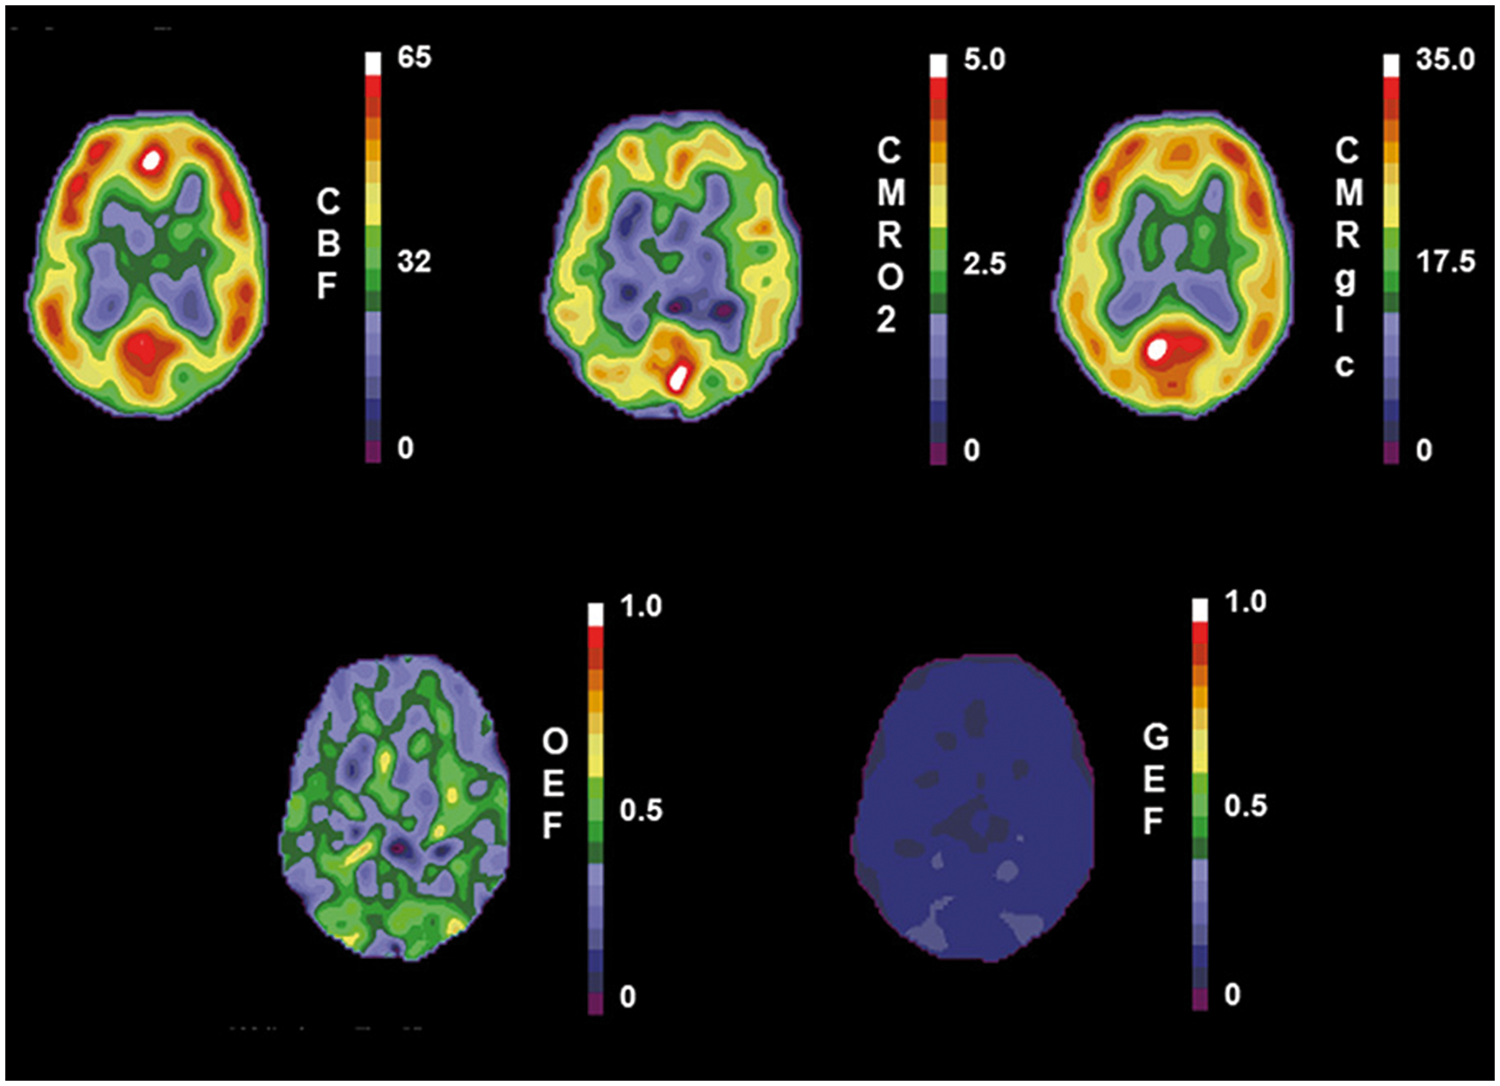
In the normal resting brain, rCBF is closely matched to the resting metabolic rate of the tissue. As a consequence of the close regional coupling of resting CBF with both CMRO2 and CMRglc, the OEF and glucose extraction fraction (GEF) are strikingly more uniform than that either CBF or metabolism (Figure 1).37–39
Normal positron emission tomography scans of cerebral blood flow (CBF) in mL 100 g−1 min−1, cerebral metabolic rate of oxygen (CMRO2) in mL 100 g−1 min−1, cerebral metabolic rate of glucose (CMRglc) in µmol 100 g−1 min−1, oxygen extraction fraction (OEF) and glucose extraction fraction (GEF). (Reprinted Powers
156
).
Magnetic resonance imaging
It has been widely demonstrated that MR signal intensity, particularly T2 and T2*, is modulated by the concentration of deoxyhemoglobin; wherein an increase in deoxyhemoglobin concentration leads to a shortening of T2 and T2* and vice versa. This phenomenon is widely known as the blood-oxygen level dependent (BOLD) contrast.40–43 Although BOLD effects were first utilized to reveal rCBF changes in brain regions responding to external stimuli, extensive efforts have been devoted to developing approaches, based on BOLD, to also provide insights into cerebral blood oxygenation under pathophysiological conditions, such as hypoxia,44–50 hyper- and hypocapnia,46,51,52 hemodilution, 53 and ischemia.54,55 Although these early studies offered important evidence on the efficacy of BOLD-based cerebral blood oxygenation approaches, only qualitative measures were available. Subsequently, quantitative measures of BOLD effects were reported both experimentally56–61 and theoretically62–70 by several different groups. A brief overview of several representative approaches is provided below.
Measurements of blood oxygenation in MR visible vessels
Two main approaches have been proposed to directly measure blood oxygenation in MR visible vessels, namely R2-based methods and susceptometry-based oximetry (SBO). Discussion of these approaches is provided below. Since all MR approaches for measuring blood oxygenation use either R2 (=1/T2), R2* (=1/T2*) or R2′ (=1/T2′), the relation between these parameters is provided below

R2 (or T2)-based approaches
Through measurements of T2 in ex vivo blood samples with different oxygenation levels, Thulborn et al.
57
first reported a linear relation between R2 (i.e. 1/T2) and the square of the fraction of deoxyhemoglobin in 1982. A simplified signal model characterizing the relation between R2 and blood oxygenation was later proposed by Wright et al.,
58
which states

By combing TRUST and the phase contrast (PC) approaches for measuring flow velocity, Liu et al. 76 further demonstrated that a global measure of CMRO2 can be obtained in vivo. It is worth noting that the global CMRO2 herein was estimated as a product of the total inflow at the internal carotid artery (velocity × cross-section area) and the arterial (internal carotid artery) venous (jugular vein or superior sagittal sinuses) oxygenation difference. The effectiveness of the TRUST approach was recently evaluated through a multisite study (6 sites and 250 subjects with 125 subjects from the site of the original team). 77 A mean venous oxygenation of 61 ± 5.8% was reported. Although the standard error appears to be site dependent, it is relatively small (∼1.5%). More recently, Krishnamurthy et al. 73 demonstrated accurate measures of blood oxygenation in small cerebral veins using the TRUST approach. Together, these results demonstrate the potential applicability of this approach in a routine clinical setup for evaluating alterations of cerebral blood oxygenation in MR visible vessels.
Overall, the R2-based approaches are capable of obtaining quantitative measures of blood oxygenation in MR visible vessels. In addition, R2-based approaches are insensitive to vessel orientation and local magnetic field variation, which could affect the accuracy of measuring blood oxygenation using susceptibility-based approaches (to be discussed below). Finally, rapid measurements of blood oxygenation in the internal jugular vein have been demonstrated (<1 min) by Qin et al., 78 greatly facilitating future clinical applications. Nevertheless, there are several limitations associated with R2-based approaches. Only global measures of blood oxygenation can be achieved and its ability to measure blood oxygenation at the tissue level is limited. A calibration curve is needed to convert experimentally measured R2 in MR visible vessels to blood oxygenation. Specifically, the experimentally derived calibration curve is sequence and field strength dependent. In other words, the sequence and field strength used for obtaining the calibration curve and subsequent in vivo experiments need to be identical. Finally, R2 is hematocrit (Hct) dependent. Since Hct varies with vessel size, a correction factor similar to that used for PET29,30 may be needed when the experimentally derived calibration curve is applied for obtaining blood oxygenation in small intracranial vessels.
SBO approaches
Although the underlying physical mechanisms of SBO are largely similar to the T2*-based approaches (to be discussed below), SBO measures phase shift between a blood vessel containing deoxyhemoglobin and the surrounding tissues. In contrast, signal intensity changes resulting from the presence of deoxyhemoglobin are measured in T2*-based approaches. The SBO approach was first proposed by Haacke et al.
79
in 1997. Blood oxygenation of small cerebral veins was measured in subjects at rest and during performing a motor paradigm, respectively. Specifically, the phase difference between the intravascular compartment and the surrounding tissues can be used to measure blood oxygenation using the relation below

Similar to the aforementioned R2-based approaches, SBO approaches are unable to provide blood oxygenation at a tissue level since measures of blood oxygenation are obtained from MR visible vessels. In addition, a prior knowledge of the angle between the long-axis of the vessel of interest and the main magnetic field is needed for estimation of blood oxygenation. Fernandez-Seara et al. 80 conducted a simulation study to determine the effects of vessel tilt angle on the measurements of Y. Their results indicated that errors of Y measurements increase with tilt angle. Hernandez-Torres et al. 82 further demonstrated that orientation of vessels with respect to the main magnetic field could also affect the estimates of CBF and CBV when the dynamic susceptibility contrast approach was employed. Nevertheless, recently proposed velocity selective pulses for T2-based approaches83,84 and combing SBO with quantitative susceptibility mapping85,86 may allow estimates of tissue level oxygenation mapping although validations of these approaches have yet to be completed. Finally, similar to the R2-based approaches, a rapid SBO approach, on the order of 30 s, has been demonstrated by Jain et al,. 87 enabling monitoring of altered global OEF/CMRO2 under dynamic pathophysiological conditions.
R2*(R2′)-based approaches
In contrast to the approaches discussed above, R2*(R2′)-based approaches are capable of providing quantitative measures of blood oxygenation at a regional tissue level, which is essential for clinical applications since most of the cerebrovascular disorders are focal rather than global diseases. The R2′-based approaches are largely built on the theoretical framework proposed by Yablonskiy and Haacke.
88
Specifically, assuming capillary vessels containing deoxyhemoglobin can be modeled as randomly orientated cylinders with respect to the main magnetic field and a negligible volume fraction within one imaging voxel, the MR signal of a given voxel can be written as

Based on the theoretical framework proposed by Yablonskiy and Haacke, 88 several imaging approaches have been proposed by different groups. Using a gradient-echo sampling of the spin-echo (GESSE) sequence, He and Yablonskiy89,90 proposed the quantitative BOLD (qBOLD) approach by taking into account the intravascular contributions, different tissue compartments, and macroscopic magnetic field inhomogeneity. While exciting results have been reported, qBOLD highly depends on the available SNR to ensure reliable estimates of physiologically relevant parameters. To mitigate these difficulties, Christen et al. proposed a multiparametric qBOLD approach61,91,92 by independently measuring CBV, tissue T2, and magnetic field inhomogeneities. The reduced number of free parameters with the multiparametric qBOLD approach has led to improved spatial resolution and accuracy of oxygenation estimates when compared to the qBOLD approach. However, the use of a contrast agent for CBV estimates complicates the experimental protocol. This approach also uses the total cerebral blood volume instead of the venous CBV. As a result, the measured oxygenation corresponds to oxygen saturation averaged across the arterio-venous networks within a given voxel. 70
Instead of using a GESSE sequence, An and Lin 93 proposed an asymmetric spin-echo (ASE) sequence. Specifically, a series of images are acquired by varying the time interval (τ) between the application of a π pulse and TE/2 while keeping TE constant. As a result, spin-echo images are obtained at τ = 0 while images acquired using non-zero τ will exhibit different sensitivity to susceptibility effects – the longer the τ, the larger the susceptibility effects. Since the TE is kept as a constant, unlike the above discussed multiparametric qBOLD approach, the effects of T2 can be ignored, leading to a decrease in total acquisition time. With the ASE approach, An and Lin94–97 demonstrated that experimental measures of R2′ and vCBV can be obtained, which in turn provide quantitative measures of OEF. Results from both animals and human subjects have been demonstrated.93,97–100 In addition, detailed experimental validation for the measures of vCBV and OEF under different physiologically relevant experimental conditions, including inspired gas manipulations (hypoxia, hypocapnia, and hypercapnia) and focal cerebral ischemia have been conducted. Results of vCBV and OEF are consistent with anticipated physiological response to the employed experimental conditions.97,98,101
It is worth noting that the means by which ASE-derived OEF was validated is the same as with those previously used for PET OEF validation.
28
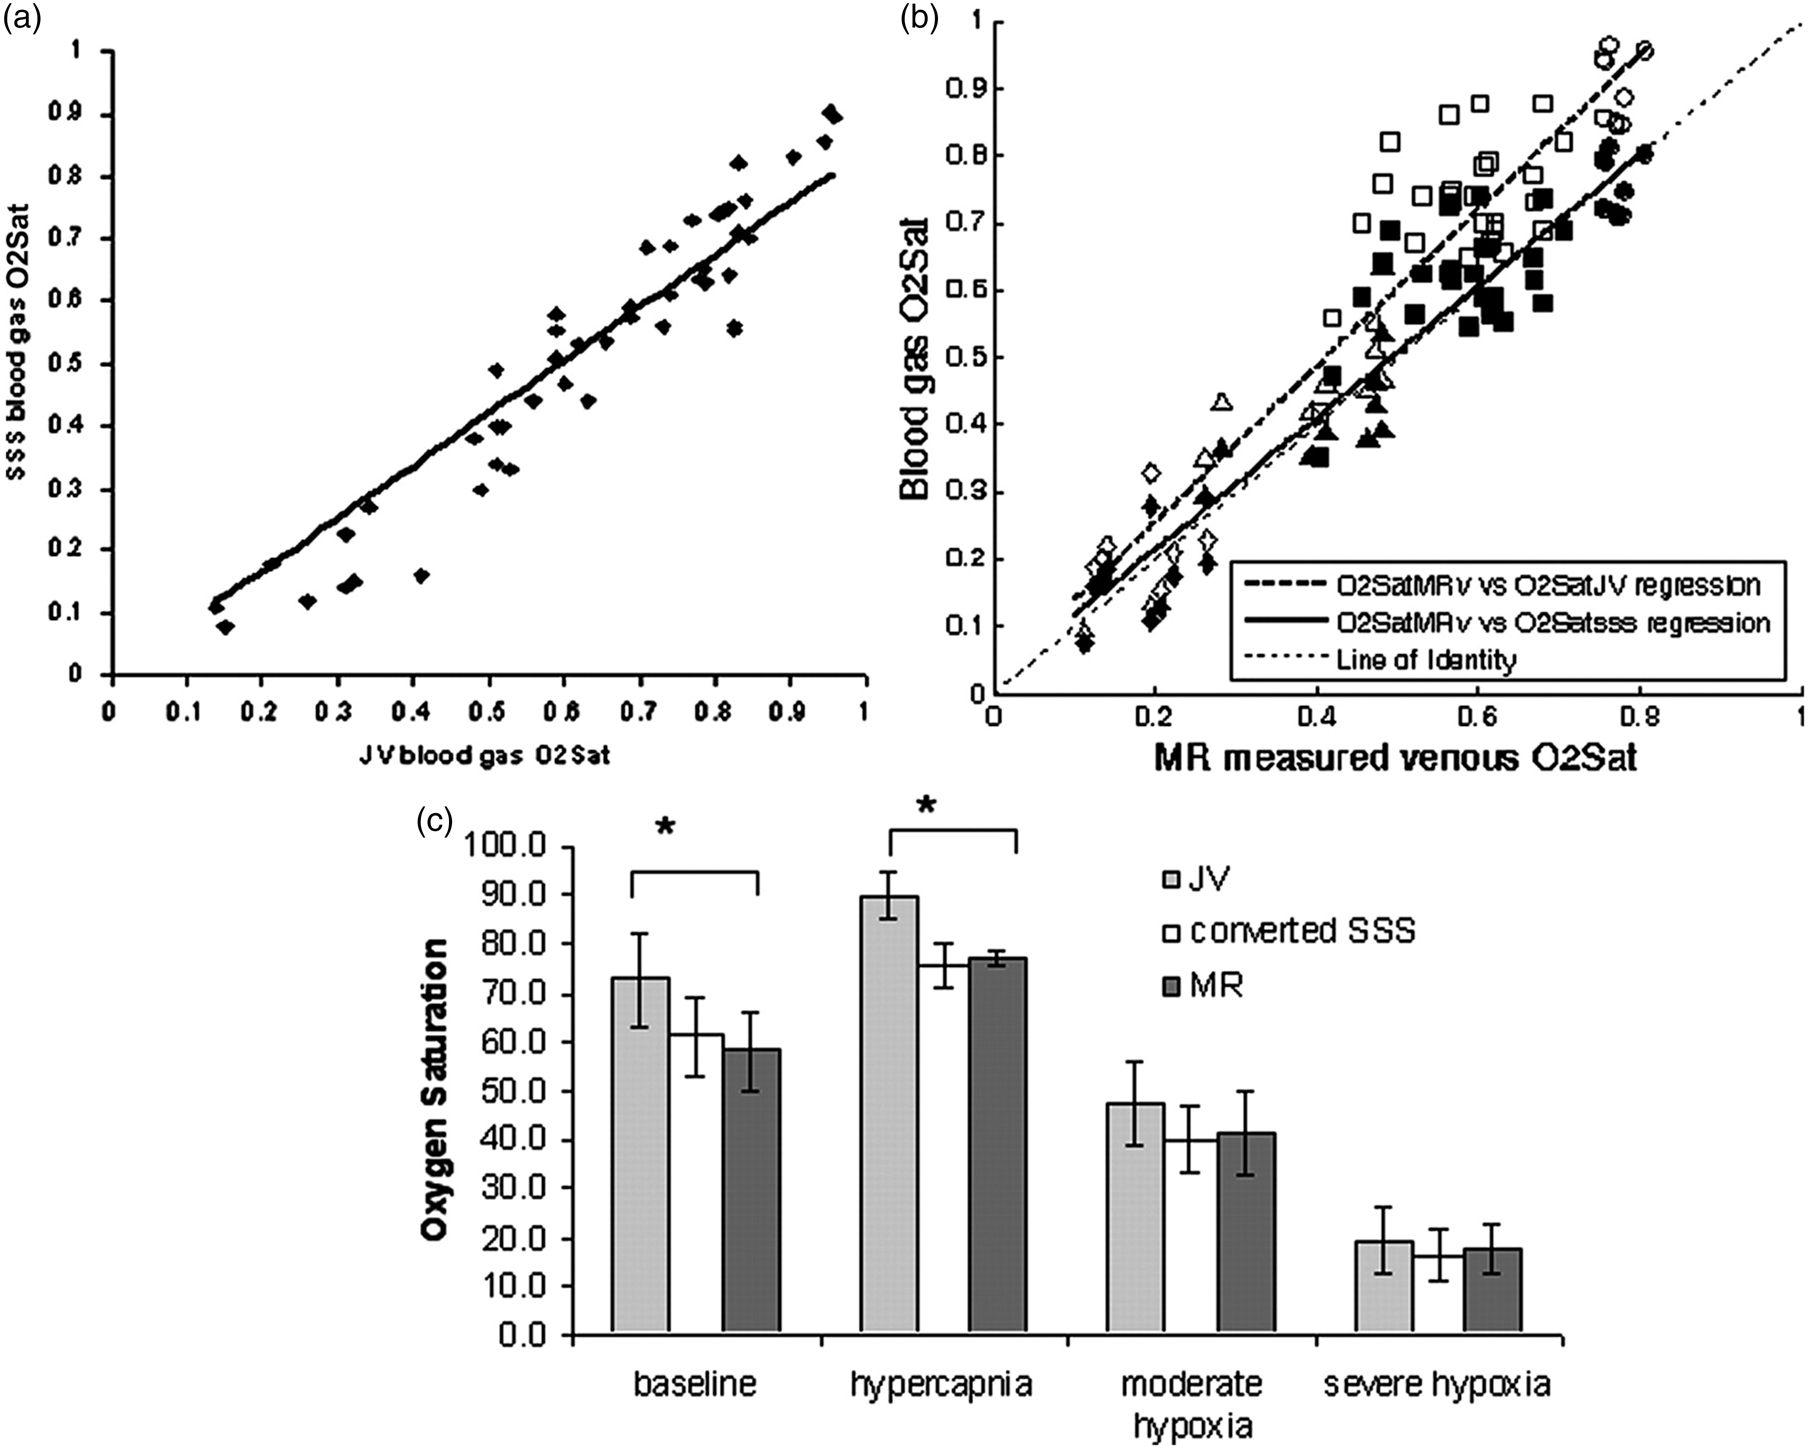
Specifically, inspired gas manipulations were employed to alter cerebral OEF such that a pathophysiologically relevant range of OEF (∼0.2–0.9) was created in an animal model. Jugular blood samples were concurrently obtained during MR imaging experiments measuring cerebral OEF using ASE. The levels of jugular blood oxygenation were then obtained via blood gas analysis and converted to blood oxygenation of the superior sagittal sinus through an experimentally obtained calibration curve. A highly linear relationship was obtained (Figure 2) between MR-measured blood oxygenation of the brain parenchyma (OEF) and the converted oxygenation of the superior sagittal sinus (O2SatSSS = 0.9763 O2SatMR + 0.021; r = 0.94), suggesting a highly accurate measure of OEF can be obtained using the ASE approach.
101
(a) A linear relation of blood oxygenation between jugular (JV) and superior sagittal sinus (SSS) is observed across a wide range of blood oxygenation. The SSS O2 saturation is lower than that of JV blood samples. (b) The relationships between MR estimated brain oxygenation and JV and SSS blood oxygenation, respectively. (c) Comparisons of MR estimated brain oxygenation, converted SSS oxygenation from JV blood samples that were obtained concurrent with MR imaging using results shown in (a), and JV blood samples are shown at baseline, hypercapnia, moderate hypoxia, and severe hypoxia, respectively. (Reprinted with permission from An et al.
101
).
An et al. 102 further evaluated the reproducibility of the ASE approach for obtaining OEF and CMRO2 in healthy subjects undergoing a series of inspired gas challenges. Specifically, five episodes of gas challenges (air1/carbogen1 (3% CO2 and 97% oxygen)/air2/carbogen2/air3) were employed. ASE and CBF using the ASL approaches were acquired during each challenge and a 5-min break was employed between two adjacent challenges. The OEF and CMRO2 measured at each gas challenge were 33.3 ± 2.5 (OEF) and 13.8 ± 3.7 (CMRO2) in air1, 29.8 ± 2.4 and 13.6 ± 3.9 in carbogen1, 33.8 ± 1.9 and 13.9 ± 4.0 in air2, 29.4 ± 3.2 and 13.4 ± 3.9 in carbogen2, and, finally, 35.0 ± 3.6 and 13.9 ± 4.7 in air3, respectively. These results demonstrate that not only do OEF and CMRO2 respond consistently with the reported results during carbogen challenges, but that they also showed the reproducibility of the ASE approach. Nevertheless, additional validation in human subjects using the recently available hybrid PET/MR 103 may be needed to further determine the accuracy of the ASE approach.
In summary, unlike the R2-based and SBO approaches where global measurements of blood oxygenation are obtained from MR visible vessels, the R2′-based approaches are capable of providing regional tissue measurements of blood oxygenation, an approach that is clearly of importance for assessing regional alterations resulting from neurological diseases that do not affect the entire brain. In addition, since the signal model proposed by Yablonskiy and Haacke 88 assumes that blood vessels are randomly orientated with respect to the main magnetic field, R2′-based approaches are insensitive to vessel orientations. Nevertheless, there are several limitations associated with R2′-based approaches. First, magnetic field variation from sources other than deoxyhemoglobin needs to be corrected to obtain accurate measures of blood oxygenation. An and Lin demonstrated that vCBV was substantially overestimated (3.68 ± 0.52%) but became more consistent with the value reported in the literature after correcting for local field variation. 98 However, the needed correction lengthened the total acquisition time. Second, the assumption that intracranial vessels are randomly orientated with respect to the main magnetic field may not be completely valid. Using the susceptibility weighted imaging approach, 104 it appears that most intracranial veins run in parallel with white matter tracts. 82 Nevertheless, this assumption is most likely valid at the capillary level. Finally, unlike R2-based and SBO approaches, which are capable of obtaining estimates of blood oxygenation <1 min, the R2′-based approaches typically take ∼5 min or more to ensure an adequate signal-to-noise ratio for obtaining accurate measures of blood oxygenation. This is due to the fact that the R2′-based approaches rely on signal changes induced by a relatively small fraction of blood in each imaging voxel (CBV, 3–5%). Although the acquisition time appears long when compared to R2-based and SBO approaches, the ASE approach proposed by An and Lin 93 has been clinically evaluated. Specifically, a prospective study focusing on the ability of ASE measured CMRO2 to discern tissue viability in acute ischemic stroke patients has been conducted, 105 which will be discussed below.
Clinical applications in ischemic stroke
Although quantitative OEF provides a measure of the extent to which oxygen is extracted from arterial blood, CMRO2 has been shown to be more effective at discerning tissue viability during cerebral ischemia.105,106
While the feasibility of obtaining quantitative measures of CMRO2 has been demonstrated using the approaches discussed above (T2-based,81,107,108 SBO,81,85,109 and R2*-based methods 110 ), the applications of MR derived CMRO2 for cerebral ischemia have largely relied on the R2*-based approaches.100,101,105,111–114 This is due to the fact that both R2-based and SBO approaches provide blood oxygenation in MR visible vessels and thus global instead of regional CMRO2 is typically obtained. Therefore, in the context of this review article, we will focus our discussion on the applications of PET and R2*-based approaches in cerebral ischemia below.
Changes in CBF and CMRO2 with acute ischemic stroke
Experimental data from middle cerebral artery occlusion in large mammals show an initial reduction in CBF that is most severe in the central perfusion territory of the artery. The reduction becomes increasingly less in peripheral areas where collateral circulation from other arteries provides additional blood flow. 115 Accompanying this initial prominent reduction in CBF within 1-h post-occlusion is an increase in OEF. CMRO2 is reduced somewhat initially, but falls further over the subsequent 2–3 h. CBF remains relatively stable, falling only slightly.116–120 Reflecting the stably reduced CBF and further declining CMRO2, the initially markedly increased OEF progressively decreases. By 24 h, CBF in the center of the ischemic region reaches its nadir at less than 20% of baseline values and CMRO2 reaches 25% of baseline values. Also at this time point, increased OEF is seen to develop outside the area of primary perfusion disturbance in the tissue adjacent to the infarct core. 120 The volume of severely hypometabolic tissue remains stable between 1 and 7 h post-occlusion, but increases by 24 h and increases even further an average of 17 days after occlusion. 121 The fate of high OEF regions in the core and surrounding regions is variable; some portions may go on to infarct and other portions may survive. 116 An area of selective neuronal necrosis occurs outside the infarction itself. 122
Human data obtained at 2 to 24 h after ictus show an area of reduced CBF, reduced CMRO2, and high OEF.123,124 In the rim of tissue surrounding the infarct core, areas demonstrating reduced CBF and increased OEF with variable CMRO2 can often be identified within hours after ictus and may persist for up to 16 h. As with the animal data, the fate of high OEF regions in the core and surrounding regions is variable; some will infarct and some will not.125,126 Spontaneous reperfusion may take place within a few hours of infarction,
127
but peaks at day 14.
128
This rise in CBF occurs without a concomitant rise in CMRO2; rather, CMRO2 generally falls further. Consequently, a decrease in regional OEF below normal values mirrors the rise in CBF. This state, termed “luxury perfusion”
129
indicates that the normal coupling of CBF to oxygen metabolism in the resting brain is deranged. Luxury perfusion may be absolute, with CBF values greater than normal. Alternatively, luxury perfusion may be relative, with low or normal CBF that is still in excess of that required to achieve a normal OEF for the reduced CMRO2.
130
Luxury perfusion is evident by 48 h in one-third of patients131,132 and peaks at one to two weeks, paralleling the time course of spontaneous reperfusion.
130
Following this subacute period, CBF progressively declines and OEF normalizes such that the chronic stable infarct demonstrates flow and metabolism that are close to zero with OEF at or below baseline values.
133
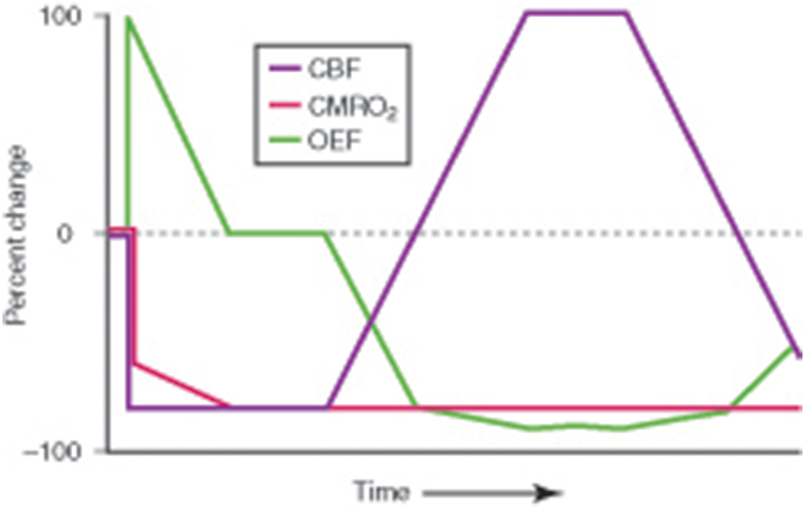
(Figure 3).
Pathophysiological changes in cerebral infarction. At the onset of ischemia, the initial fall in regional cerebral blood flow (CBF) is mirrored by a rise in regional oxygen extraction fraction (OEF). Since the increase in OEF is no longer able to maintain the energy needs of the brain, regional cerebral oxygen metabolism (CMRO2) falls to the level of oxygen delivery. With time, CMRO2 falls further even though there is no further decrease in CBF, resulting in a decrease in OEF. Reperfusion via recanalization of the occluded artery or recruitment of collateral pathways results in an increase in CBF (“luxury perfusion”) and a concomitant fall in OEF below baseline with no change in CMRO2. With evolution to the stage of chronic infarction, CBF progressively declines and OEF increases, but often remains below baseline values. (Reprinted from Powers.
156
).
Studies with PET and 18FDG have shown evidence for dissociation of oxidative and glucose metabolism,37,124,131,134 with better preservation of CMRglc such that the CMRO2/CMRglc ratio is one-third that for normal brain.
134
This finding of relatively increased glycolysis in the presence of adequate oxygen delivery has been attributed to glycolytic activity in neutrophils and macrophages.
134
An alternative explanation for the increased glucose consumption is spreading depression,
135
which is a reversible, slow (≈3 mm/min) wave of depolarization accompanied by a marked change in interstitial ion concentrations that occurs spontaneously during ischemia in association with the sustained increase of extracellular potassium and glutamate.
136
Using a rapid acquisition of MR ASL approach, Kao et al.
137
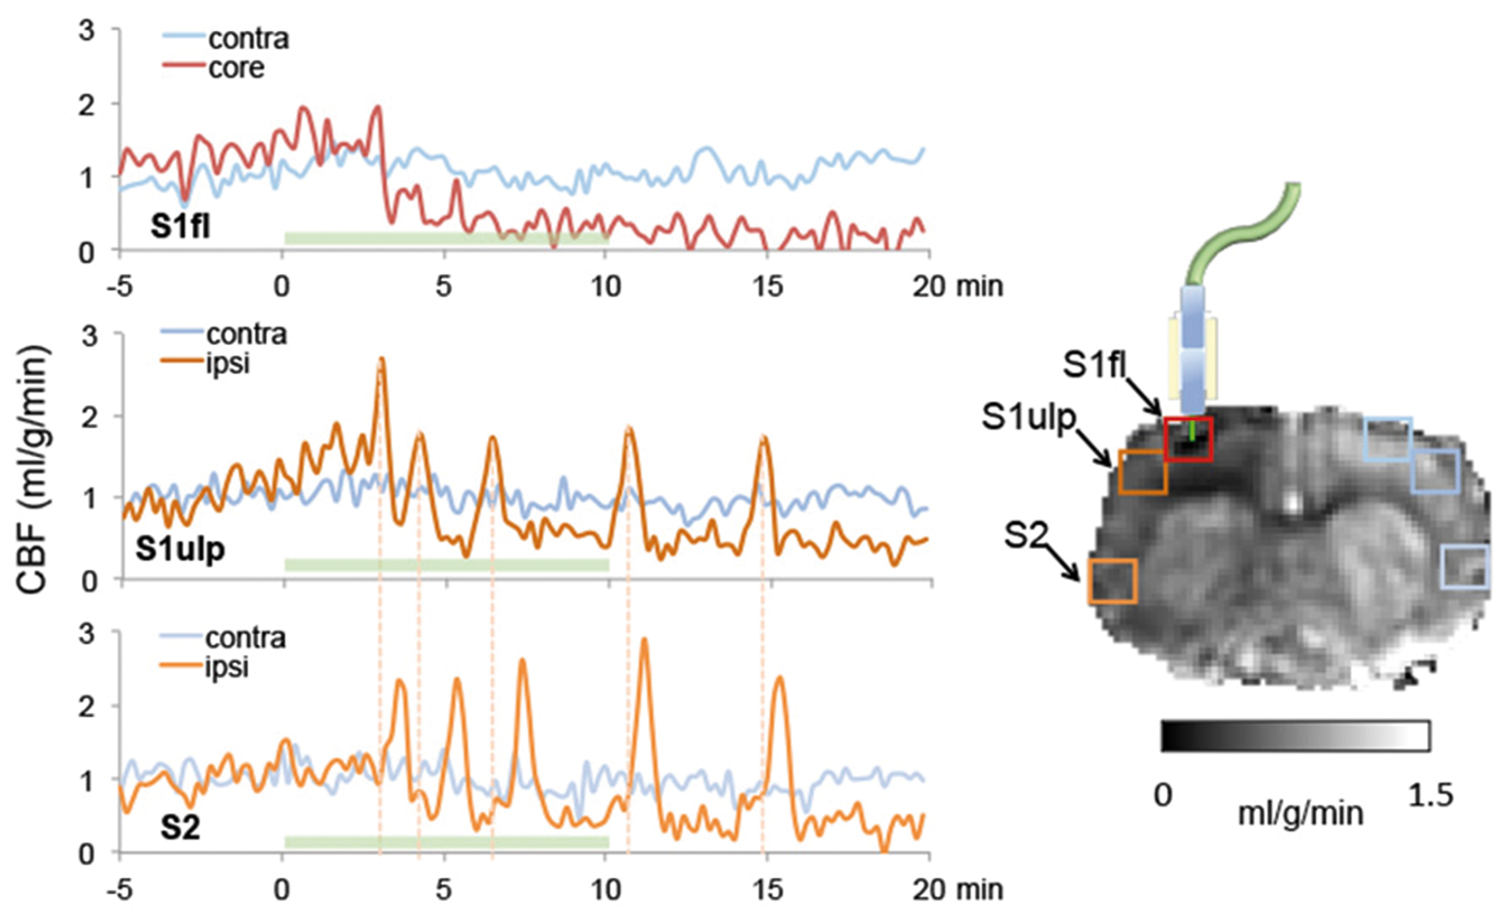
demonstrated spatiotemporal dynamics of CBF changes reflecting cortical spreading depression in a rodent model of acute ischemia (Figure 4). The frequency and severity of this excitation-induced spreading depression correlate with the ultimate extent of structural injury in experimental models.
138
Imaging ischemic lesion onset with real-time MR cerebral blood flow (CBF) measurements. Continuous CBF maps using the arterial spin labeling approach with 3S temporal resolution were acquired prior to and during (green shaded area indicating the laser-on period) the onset of ischemic lesion using a novel rat model of photothrombotic ischemia capable of inducing ischemic lesion inside the MR scanner. CBF time courses from three regions, the core in the laser target region (S1fl), peri-infarct tissue (S1ulp), and normal tissue (S2) in the ipsi-lesional and corresponding location in the contra-lesional hemisphere were analyzed. The cortical spreading depression (CSD) in the core followed by a long-lasting CBF reduction indicates the terminal depolarization. CSDs can be clearly identified when comparing the CBF time courses between the S1ulp and S2 regions (dashed line). The gray scale bar indicates CBF values. (Unpublished data, Courtesy of Shih.
157
).
Flow-metabolism thresholds of tissue function and viability in acute ischemic stroke
In the early hours after cerebral arterial occlusion, the area of the brain with reduced blood flow consists of a mixture of cells. Some of the cells are already irreversibly damaged and destined for death while the others exhibit abnormal biochemical changes and will go on to die later, but may recover if the biochemical processes leading to cell death are interrupted by pharmacologic treatment or re-establishment of CBF. Irreversibly damaged cells are more common in the central areas with the greatest reduction of blood flow whereas potentially salvageable cells are more common in the periphery. The latter cells have been termed the ischemic penumbra. 139 Identification of the ischemic penumbra by measurements of CBF alone is difficult because of the importance of both magnitude and duration of CBF reduction in determining cell death, the different sensitivities of white matter and gray matter, different sensitivities of neurons within gray matter, and the occurrence of luxury perfusion in dead tissue.126,140,141 Quantitative data from PET studies, which primarily reflect gray matter, show that CBF > 20 mL/100 g/min may indicate tissue that is not at risk or is already dead and undergoing luxury perfusion. CBF 10–20 mL/100 g/min may indicate tissue that is at risk but salvageable by immediate reperfusion. However, when tissue types are considered, this range of CBF may result in gray matter death but may not be at risk if it is white matter. CBF < 10 mL/100 g/min may indicate tissue is at risk but salvageable or already dead. Thus, while CBF measurements are moderately successful at identifying tissue that is in trouble, they cannot reliably differentiate tissue at risk but salvageable from dead tissue. In contrast, PET measurements of CMRO2 have been shown quite reliable for identifying dead tissue within studies, but with some variation across studies. CMRO2 thresholds for irreversible infarction in humans have been reported from 0.87 to 1.7 mL/100 g/min in different studies.123,140,142,143 The different threshold values are due to different PET methodologies with those at the lower end of the ranges derived from single voxel measurements of both gray and white matter and those at the higher end derived from larger regions primarily in gray matter. The combination of PET CBF < 60% of normal and PET CMRO2 > 40% of normal accurately identifies areas of the brain that will go on to infarct if untreated and live if treated, in these studies treatment being successful reperfusion.116,121,140,141,143–145 These data represent a mixture of humans and non-human primates with minimal human reperfusion data. Because tissue regions demonstrating increased OEF represent areas with reduced blood supply relative to oxygen demand but still with metabolically active cells, OEF has received much attention as the factor capable of predicting tissue viability, but it has been shown to be a poor predictor of tissue outcome.97,101,115,119
While PET studies have provided valuable insights into potential CMRO2 threshold for irreversible ischemic injury, wide clinical applications of PET measured CMRO2 in management of acute stroke patients have been hampered by the requirement of having an onsite cyclotron and the complex logistics. Alternatively, MR-based CMRO2 may offer a means to discern viable tissues such that individualized treatments can be achieved based on MR derived tissue viability maps.
Lee et al. 114 reported initial clinical experience on MR derived CMRO2 in seven acute stroke patients who underwent a series of MRI, including 4.5 ± 0.9 h (tp1), three to five days (tp2), and 1 to 3 months (tp3) after symptom onset. Several brain regions were operationally defined using tp3 T2-weighted images and diffusion/perfusion images at tp1. Specifically, T2-weighted images obtained from tp3 were used to determine final infarction. Ischemia penumbra was defined as regions exhibiting diffusion-perfusion mismatch at tp1. Finally, the salvaged penumbra was defined as regions in the ischemic penumbra not evolved to infarction at tp3. They showed that MR-derived CMRO2 value in the regions eventually infarcted and salvaged penumbra were reduced to 0.40 ± 0.24 and 0.55 ± 0.11 of the contralateral hemisphere, respectively. These results appear consistent with that reported using PET.116,121,140,141,143–145
Several studies have been conducted to evaluate the potential efficiency of MR derived oxygen metabolism for evaluating acute stroke patients. Gersing et al. 146 separately measured R2, R2*, rCBV, and rCBF in 23 acute stroke patients (<6 h from symptom onset). Using equation (5), OEF was obtained, which in turn provided an estimate of CMRO2 as the product of OEF and CBF. In comparison to diffusion and perfusion results, a significantly reduced CMRO2 was observed in the diffusion defined abnormal regions but not in the perfusion impaired areas when compared to that in the contralateral hemisphere. Similarly, Bauer et al. 147 separately measured R2 and R2*, which in turn provided an estimate of R2′ (equation (2)). Diffusion and perfusion images were also acquired. Time-to-peak maps using perfusion images were thresholded to define different degrees of perfusion deficits. R2′ values were significantly increased in the diffusion-defined abnormal regions when compared to that in the contralateral hemisphere, similar to that reported by Gersing et al. 146 However, a significant increase in R2′ values was also observed in the perfusion-impaired regions when compared to that in the contralateral hemisphere but was significantly lower than that in the diffusion-defined abnormal regions. These findings appear to differ from those reported by Gersing et al. 146 Since CMRO2 was employed by Gersing et al. 146 while only R2′ values were used by Bauer et al., 147 which did not take into consideration of CBF; this major experimental difference may lead to the observed discrepancies.
More recently, An et al. reported results in a larger sample size (n = 40)
105
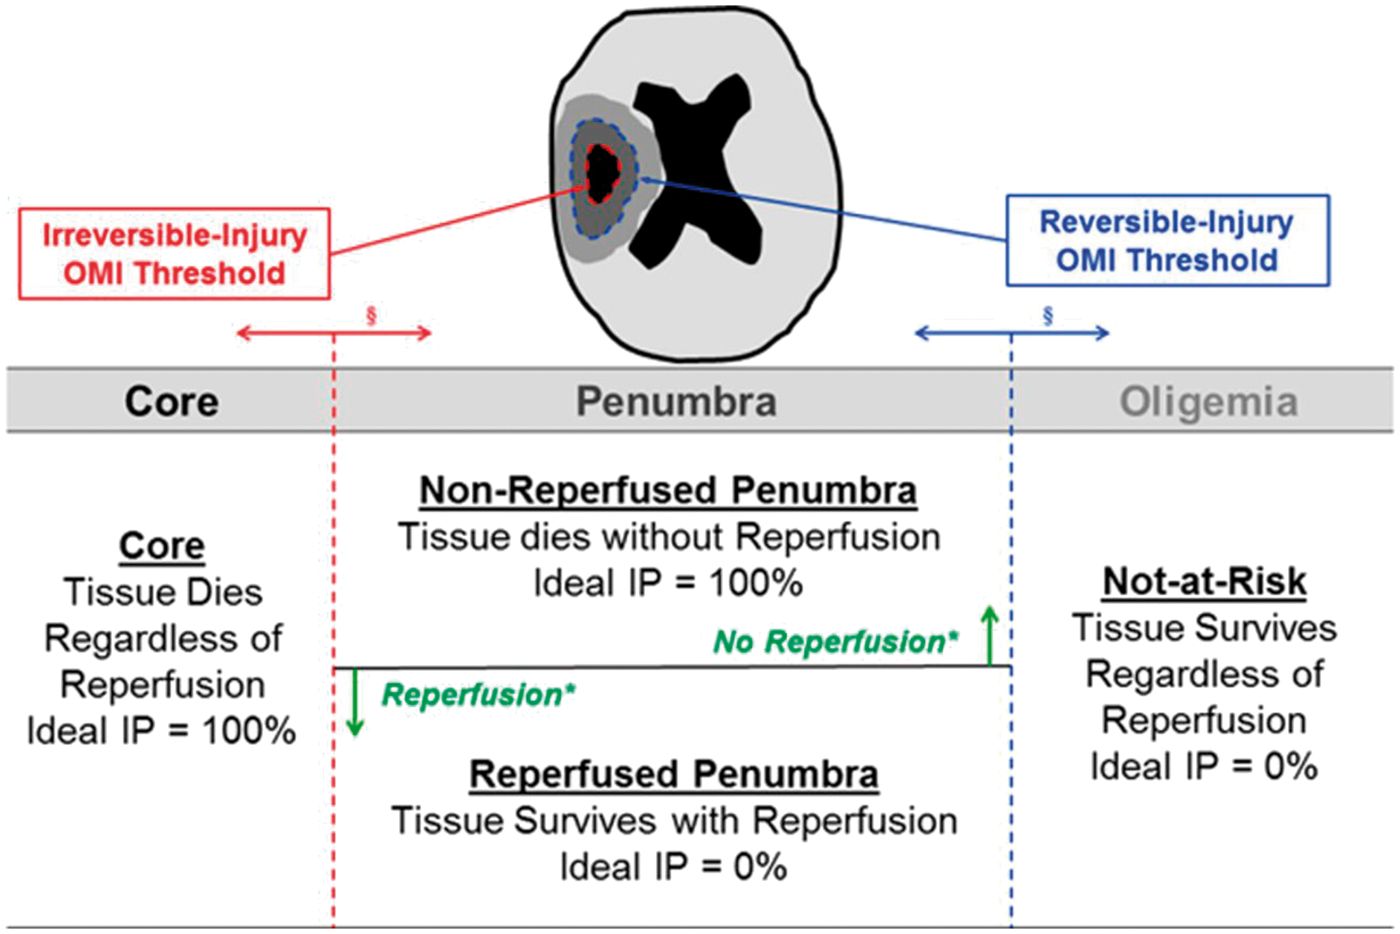
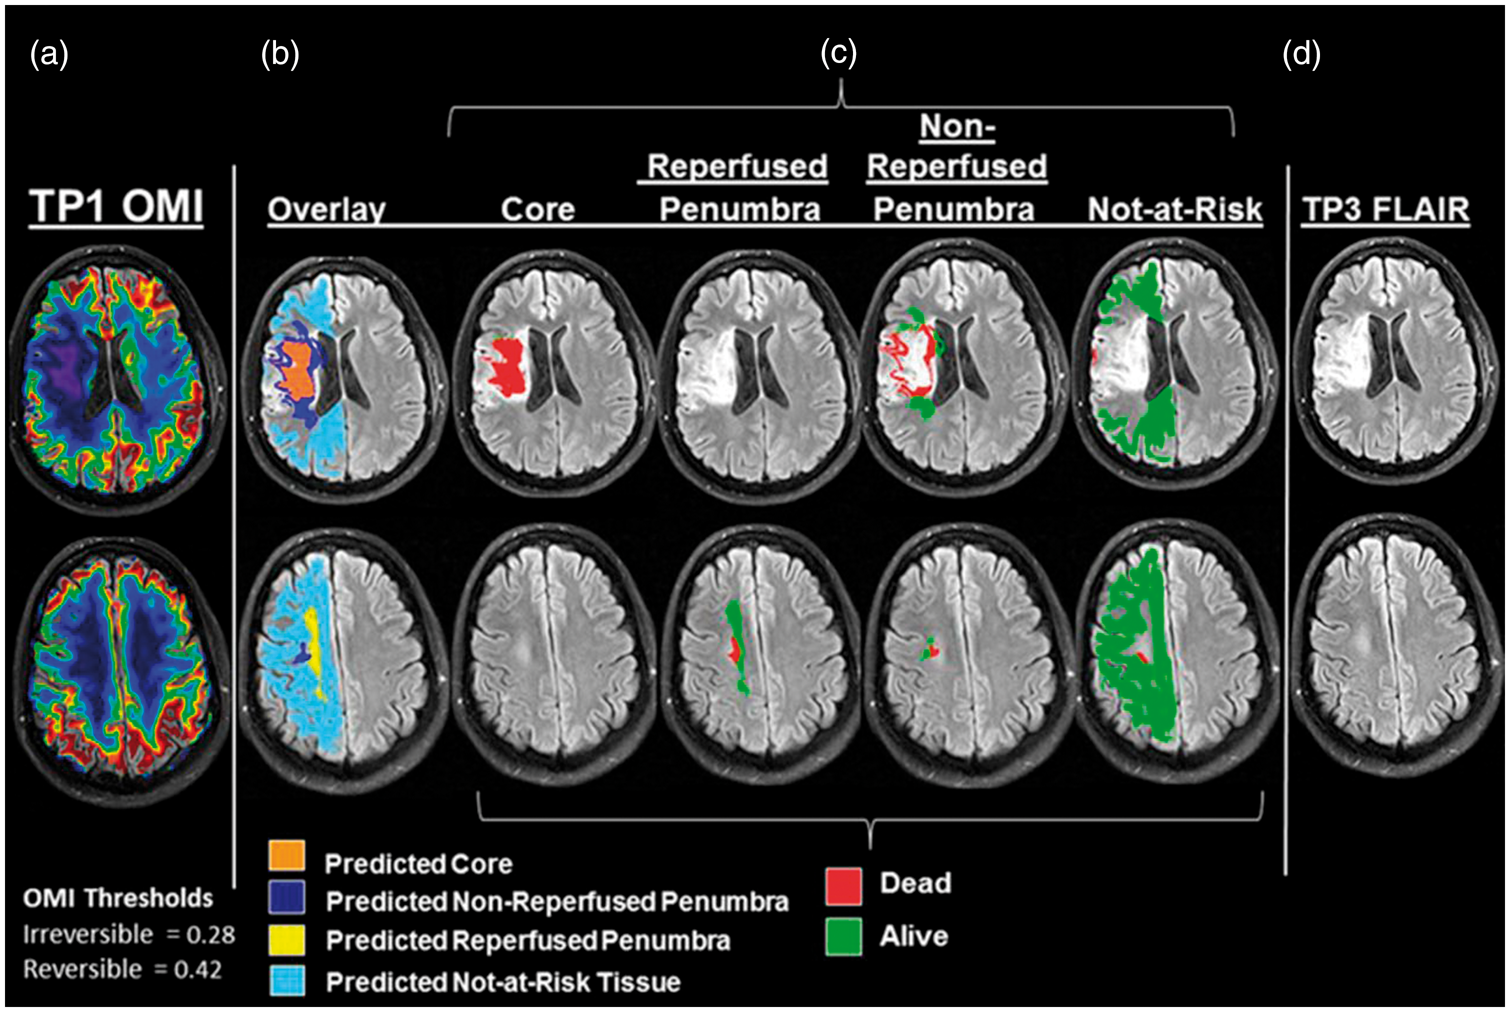
using the ASE approach. Similar to their early study, ischemic stroke patients underwent a series of MR imaging sessions, including <4.5 h, 6 h, and 1 month after stroke onset. An ASE sequence was used to acquire images for estimating OEF while dynamic susceptibility contrast was used to obtain CBF, which in turn provided an estimate of oxygen metabolic index (OMI). Using a computation-intensive method, they aimed to identify OMI thresholds for delineating ischemic penumbra (Figure 5): a lower threshold value below which tissue would eventually evolve to infarct (ischemic core) and an upper threshold to distinguish ischemic penumbra from tissue not-at-risk for infarction. In other words, tissues with OMI values lie between the upper and lower OMI threshold values would be indicative of ischemic penumbra where final tissue fate depends on whether CBF is restored in a timely manner. They reported that the optimal OMI lower and upper threshold were 0.28 and 0.42 of normal values of the contralateral hemisphere, respectively (Figure 6). That is, tissues with an OMI less than 0.28 reflect ischemic core whereas greater than 0.42 represent normal (oligemic) tissues, respectively. A 10-fold cross-validation method was used to further evaluate the experimentally derived OMI threshold values. Median infarct probabilities were 90.6% for core, 89.7% for nonreperfused penumbra, 9.95% for reperfused penumbra, and 6.28% for not-at-risk tissue, respectively.
Pictorial diagram provides the definitions of different categories of brain tissue under ischemic insults and the lower (irreversible injury) and upper (reversible injury) MR derived oxygen metabolic index threshold values to separate core (infarct probability (IP) = 100%) from penumbra and penumbra from oligemia (IP = 0%), respectively. In addition, penumbra is further separated into non-reperfused (IP = 100%) and reperfused penumbra (IP = 0%), respectively. (Reprinted with permission from An et al.
105
). A representative example of an ischemic stroke patient is shown. The patient was imaged three times, including hyperacute (<3 h), acute (∼6 h) and chronic (1 month) stages. Column A shows the MR derived oxygen metabolic index maps using the approach proposed by An et al. The images were obtained at ∼2 h 10 min after symptom onset. The patient received tPA infusion concurrently with MR imaging. With the experimentally derived two threshold values, core/penumbra = 0.28, penumbra/not-at-risk = 0.42, ischemic tissues are classified into predicted core, predicted non-reperfused penumbra, predicted reperfused penumbra, and predicted not-at-risk tissues and overlay onto MR images (Column B), respectively. Column C shows the dead and alive tissues based on FLAIR image obtained from the same patient at chronic stage (Column D), overlaying on MR images of the four tissue categories. FLAIR: fluid attenuation inversion recovery; tPA: tissue plasminogen activator. (Reprinted with permission from An et al.
105
).
While these results are encouraging and demonstrated the potential clinical values of MR-derived OMI for stratifying acute stroke patients for different therapeutic interventions, further studies focusing on the following areas are needed. First, this prospective study conducted by An et al. 105 was done in a single center. Therefore, the robustness of the ASE approach needs further evaluations through a multi-center study using different scanners across different institutions. Second, as discussed previously, signal changes resulting from sources other than deoxyhemoglobin will affect the accuracy of estimating blood oxygenation using R2′-based approaches. Therefore, it is critically important to correct for this confound. Careful shimming prior to acquiring images using R2′-based approaches is recommended. In addition, magnetic field variation along the slice select direction is typically larger than that in the in-plane directions. 98 This is due to the fact that the spatial resolution along the slice select direction is generally lower than the in-plane resolution for a 2D approach. To mitigate magnetic field variation along the slice selection, the z-shimming approach148,149 can be used although acquisition time will be lengthened. Third, the total acquisition time of the ASE approach is ∼5 min, which is longer than that of using R2-based and SBO approaches. Although 5 min acquisition time may be reasonable for non-acute and stable patients, it may be too long for evaluating tissue viability in acute stroke patients. Combining ASE with the multi-band approach150–152 could potentially decrease acquisition time. Fourth, the ASE approach requires somewhat complex data fitting processing to estimate both R2′ and vCBV. In particular, the estimates of vCBV require a high SNR. Alternatively, Christen et al. proposed to independently measure CBV.61,91,92 More studies are needed to further evaluate this approach in a prospective manner. Finally, future human reperfusion studies are needed to demonstrate reliability for identifying preventable infarction in clinically heterogeneous patient populations.
Future roles of oxygen metabolism imaging in clinical acute stroke
Since the first FDA approval of tissue plasminogen activator (tPA) for treating acute patients within 3 h of symptom onset, the major limitations have been with regard to the narrow time window, ineffectiveness in some patients with major intracranial vessel occlusion, and increased risks of symptomatic intracranial hemorrhage. These shortcomings have prompted extensive efforts aiming to select patients who will surely benefit, and extend the therapeutic window for acute revascularization treatment. The therapeutic time window of intravenous infusion of tPA has been extended from the original 3 h to 4.5 h. More recently, with the use of mechanic retrieval devices, the therapeutic time window has been further extended to 6 h. While these advancements have certainly expanded therapeutic benefits to many patients who were previously ineligible for iv-tPA, one immediate question is whether the therapeutic window can be further extended in some patients. Specifically, different genetic backgrounds could produce in variations in collateral vessels, and comorbidities and variations in physiological parameters such as body temperature can affect tissue tolerance to ischemia. 153 In fact, evidence of hypoxic but viable tissue has been found up to two days after ischemic stroke. Heiss et al. 154 observed an increase of PET OEF at the border zone of infarct up to 48 h after symptom onset in 16 acute stroke patients. Read et al. 155 have observed viable hypoxic tissue up to 42 h after stroke using 18FMISO. These studies indicating the prolonged presence of hypoxic tissue raise the possibility that ischemic penumbra may be present in a selected subgroup of patients for a much longer period of time than previously anticipated. Therefore, an approach capable of identifying ischemic tissue that is still viable but will go on to die if not reperfused is highly desirable, allowing further extension of therapeutic window. Considering the tight relation between tissue viability and oxygen metabolism, we believe that the approaches discussed in this review article may serve the need to further extend therapeutic window beyond 6 h. In addition to extending therapeutic window, oxygen metabolism imaging may also be an effective approach to identify wake-up stroke patients and/or patients with an unknown onset time who may benefit from currently available treatments.
Conclusion
While extensive efforts have been devoted to developing approaches capable of providing quantitative measures of cerebral oxygen metabolism, continuing improvements of aforementioned approaches are needed. Although An et al. 105 reported encouraging results using an ASE sequence, the sample size remains to be relatively small. In addition, a prospective study with reperfusion therapies will be needed to truly validate the potential clinical applicability of these aforementioned approaches. Finally, to be clinically practical for managing acute stroke patients, approaches with rapid imaging acquisition, on-the-fly data analysis and insensitive to motion artifacts will be needed.
Footnotes
Funding
The author(s) received no financial support for the research, authorship, and/or publication of this article.
Declaration of conflicting interests
The author(s) declared no potential conflicts of interest with respect to the research, authorship, and/or publication of this article.