
Abstract
In the bolus tracking technique with computed tomography (CT) or magnetic resonance imaging, cerebral blood flow (CBF) is computed from deconvolution analysis, but its accuracy is unclear. To evaluate the reliability of CT perfusion (CTP)-derived CBF, we examined 27 patients with symptomatic or asymptomatic unilateral cerebrovascular steno-occlusive disease. Results from three deconvolution algorithms, standard singular value decomposition (sSVD), delay-corrected SVD (dSVD), and block-circulant SVD (cSVD), were compared with 15O positron emission tomography (PET) as a reference standard. To investigate CBF errors associated with the deconvolution analysis, differences in lesion-to-normal CBF ratios between PET and CTP were correlated with prolongation of arterial-tissue delay (ATD) and mean transit time (MTT) in the lesion hemisphere. Computed tomography perfusion results strongly depended on the deconvolution algorithms used. Standard singular value decomposition showed ATD-dependent underestimation of CBF ratio, whereas cSVD showed overestimation of the CBF ratio when MTT was severely prolonged in the lesions. The computer simulations reproduced the trend observed in patients. Deconvolution by dSVD can provide lesion-to-normal CBF ratios less dependent on ATD and MTT, but requires accurate ATD maps in advance. A practical and accurate method for CTP is required to assess CBF in patients with MTT-prolonged regions.
Keywords
INTRODUCTION
Evaluation of cerebral blood flow (CBF) is indispensable for understanding cerebral hemodynamics in patients with cerebrovascular disease.1,2 In the bolus tracking technique with computed tomography (CT) or magnetic resonance (MR) imaging, CBF is computed from deconvolution analysis.3–5 The recent advent of multidetector row CT allows a whole-brain, simultaneous acquisition of CT perfusion (CTP) and CT angiography, which has become a powerful tool for the assessment of cerebrovascular disease.6–8 However, the reliability of CBF derived from the deconvolution analysis remains unclear, irrespective of CTP or MR perfusion (MRP).9,10
In bolus tracking, a time-intensity curve (TIC), a plot of tracer concentration over time, is continuously acquired after the rapid injection of contrast media. This curve is subsequently deconvoluted by an arterial input function (AIF) to determine local CBF in tissue. The accuracy of these deconvolution-derived CBFs is strongly affected by the temporal characteristics of tracer bolus passage,11,12 which is characterized by arterial-tissue delay (ATD) and mean transit time (MTT). Whereas ATD represents the time required for the tracer to arrive at the local tissue from the upstream artery in which the AIF is measured, MTT represents the time required to pass through a capillary in the local tissue. Even when the true CBF is the same, deconvolution analysis may erroneously provide different CBF estimates for tissues with different ATD and MTT values.11,13 These ATD and MTT dependences become problematic, especially in patients with cerebrovascular steno-occlusive disease, because the reduction in perfusion pressure can reduce blood flow velocity, resulting in the prolongation of ATD and MTT in the affected brain areas.1,14,15
The degree to which CBF estimates depend on ATD and MTT varies with deconvolution algorithms used. Standard singular value decomposition (standard SVD; sSVD), one of the deconvolution techniques initially developed, is strongly dependent on ATD, underestimating CBF in brain regions with prolonged ATD.4,13 To overcome the ATD dependence, alternative methods such as block-circulant SVD (cSVD) and delay-corrected SVD (dSVD) have been developed and shown to eliminate the ATD-dependent CBF underestimation in the affected brain areas.16–18 In contrast to ATD dependence, the importance of MTT dependence has not been well recognized. Simulation studies have shown that deconvolution CBFs depend on true MTT values and are underestimated, especially with short MTTs.4,11,12,16,17 However, the implications of MTT dependence on actual CBF maps obtained from patients have not yet been reported. In accordance with the ATD and MTT dependence of the algorithms used, deconvolution analysis causes CBF errors of different magnitude for normal brain areas (normal ATD and MTT) and lesions (prolonged ATD and MTT). This complicates the interpretation of lesion-to-normal CBF ratios; that is, the image contrast of CBF maps.
Another technical issue in CTP is the effect of signals from large blood vessels. Vascular pixel elimination (VPE) eliminates vascular pixels in CBF maps by applying the threshold processing for cerebral blood volume (CBV) maps. 19 Although the VPE method yields absolute CBF values in healthy humans similar to those obtained by positron emission tomography (PET), it is not clear whether VPE is equally accurate in patients with stenosis or occlusion of major cerebral arteries, which is often accompanied by vascular dilatation.
The aim of the study was to evaluate the reliability of CTP-derived CBF maps from patients with cerebrovascular steno-occlusive disease. Results based on three deconvolution algorithms, sSVD, dSVD, and cSVD, were directly compared with PET, the gold standard for CBF measurements. The lesion-to-normal CBF ratio, rather than absolute CBF, was used in the analysis. Cerebral blood flow ratios are frequently used clinically to evaluate CBF reduction. To investigate ATD- and MTT-dependent deconvolution errors, differences in CBF ratios between PET and CTP were correlated with prolongation of ATD and MTT in the lesion hemisphere. Arterial-tissue delay was estimated from the CTP dynamic curve independently of the deconvolution analysis and MTT was determined from PET data (MTT = CBV/CBF). Computer simulations were also performed to assess CBF errors for each deconvolution algorithm and to interpret the human data.
MATERIALS AND METHODS
SUBJECTS
Patients with atherosclerotic steno-occlusive disease who underwent both CTP and 15 O-PET as part of their routine preoperative examination from April 2008 to March 2013 were eligible if they met the following criteria: (1) occlusion or stenosis (> 50% diameter reduction) of the unilateral internal carotid artery (ICA) or middle cerebral artery (MCA) as documented by MR or CT angiography, (2) no evidence of large cortical infarctions on recent MR image, (3) more than 2 weeks from symptom onset, and (4) not more than 1 month between CTP and PET examinations, with no changes in neurologic manifestations during the interval. Twenty-seven patients (22 men, 5 women; mean age, 68 years; range, 52 to 83 years) were enrolled in the study. Ten of these patients had been included in our previous study. 20 In the 18 symptomatic patients, the interval between symptom onset and CTP examination ranged from 15 to 328 days (median, 48 days; mean, 93 days). The intervals between CTP and PET ranged from 0 to 22 days (median, 2 days; mean, 4 days). Computed tomography perfusion was performed first in 17 patients, PET was performed first in 6 patients, and the remaining 4 patients received both examinations on the same day. Written informed consent was obtained from each patient after he/she received a detailed explanation of the purpose of the examination and the scanning procedures. This study was performed in accordance with the Ethical Guideline for Clinical Research, issued by Ministry of Health, Labor and Welfare, Japanese Government (2008), and was approved by the Ethics Committee of Research Institute for Brain and Blood Vessels-Akita (No. 14-13).
Positron Emission Tomography
A SET-3000GCT/M (Eminence SOPHIA; Shimadzu Corp., Kyoto, Japan) dedicated to the 3D-acquisition mode was used. The details of 15 O PET have been described elsewhere.21–23 Three emission scans, with inhaled [ 15 O]-CO, inhaled [ 15 O]-O2, and injected [ 15 O]-H2O, were performed to determine CBV, cerebral metabolic rate of oxygen, oxygen extraction fraction, and CBF maps. Mean transit time values were calculated by dividing CBV by CBF (MTT=CBV/CBF).
Computed Tomography Perfusion
A 320-detector row CT (Aquilion ONE; Toshiba Medical Systems, Tochigi, Japan) was used. 20 Computed tomography perfusion was performed as a dynamic contrast material-enhanced scan covering the entire brain with a 0.5-mm section thickness, 512 × 512 matrix, and 160-mm axial field of view. Although the scanning protocol varied slightly during the study period, the typical protocol was as follows: Iopamidol (40 mL; Iopamiron 370; Bayer Schering Pharma, Berlin, Germany) was injected with a power injector at a flow rate of 5 mL/s followed by the injection of 30 mL of saline at the same rate. Before the contrast material arrived in the brain, five scans were performed for baseline subtraction (80 kV tube voltage, 80 mA tube current), followed by continuous dynamic scans for the arterial phase (80 kV tube voltage, 150 mA tube current) and five intermittent scans at 4-second intervals for the venous phase (80 kV tube voltage, 80 mA tube current). The scanning speed was 1 second per rotation, and total scanning time was 52.5 seconds. The radiation dose per patient was approximately 6.8 mSv (effective dose).
Deconvolution Analysis
Baseline-subtracted CT dynamic data were reformatted to 256 × 256 × 160 voxels (0.94 mm × 0.94 mm × 1.00 mm), and spatially-smoothed with a Gaussian filter (full width at half maximum, 7 mm; filter size, 7 × 7 × 7 voxels) for noise reduction. The CBF maps were calculated based on three deconvolution algorithms:
sSVD, one of the initially-established methods frequently used for CTP and MRP, 4 with CBF estimates dependent on ATD.4,13
dSVD, which eliminates ATD-dependence by adjusting the difference in tracer arrival time between AIF and TIC. 18 After time-shifting of TIC on a pixel-by-pixel basis, sSVD deconvolution is performed. Arterial-tissue delay maps are required in advance.
cSVD, a delay-insensitive method 16 frequently used as an alternative to sSVD. Arterial-tissue delay dependence is eliminated by modifying the matrix to have a circulant property. Another implementation approach, called reformulated SVD, has been described. 17
Cerebral blood flow was calculated as the maximum value of the residue function obtained from the deconvolution analysis and scaled by a factor that corrects for the hematocrit difference between large vessels (for AIF) and tissue capillaries,
Arterial input function required for deconvolution was measured from the spatially-smoothed dynamic data. A single voxel was manually selected from a horizontal segment of the MCA contralateral to the stenosis or occlusion using an interactive tool to observe dynamic curves. To correct for a partial volume effect, AIF was normalized by the AUC (area under the curve) of AIF measured from unsmoothed dynamic data. Partial volume effect was considered sufficiently small for the AIF measured on MCA using thin-slice CT data. 24 As with the hematocrit correction mentioned above, the partial volume effect correction in AIF did not directly affect the results because the parameter measured was lesion-to-normal CBF ratio, not absolute CBF.
The ATD maps required for dSVD were obtained by least-squares fitting using AIF and TIC on a pixel-by-pixel basis. 18 To avoid noise-induced instability of the fitting and to shorten the calculation time, low-resolution ATD maps were initially calculated from the dynamic data with a matrix dimension of 64 × 64 × 160 converted from the original (256 × 256 × 160). Subsequently, these ATD maps were reconverted back to their original size and used for dSVD. The ATD maps were also used to assess ATD-dependent CBF errors, as described below.
Vascular Pixel Elimination
To assess the impact of VPE processing, CBF maps were generated with and without the VPE. Vascular pixel elimination was modified from the original method. 19 First a CBV map was calculated from the unsmoothed dynamic data set (CBVunsm (mL/100 g)), as a ratio of the AUC of TIC to the AUC of AIF, correcting for the hematocrit. Vascular pixels were identified by threshold processing of the CBVunsm map and zero values were assigned to the vascular pixels of the unsmoothed dynamic data. Subsequently, the dynamic data were spatially smoothed with the Gaussian filter, minimizing the spread of residual vascular signals to surrounding tissue pixels by spatial smoothing. Four threshold values, 5.0, 7.5, 11.3, and 16.9 (mL/100 g), with spacing of a factor of 1.5 between adjacent values, were tested. While higher threshold values caused insufficiency of VPE processing, smaller values generated noisy CBF maps because of the removal of many vascular pixels. For further analysis, the threshold was fixed at 11.3 (mL/100 g).
Region of Interest Analysis
All parametric maps from PET and CTP were spatially normalized to the anatomic brain template by SPM8 software (http://www.fil.ion.ucl.ac.uk/spm, Wellcome Trust Centre for Neuroimaging, UCL, London, UK). The 3DSRT region of interest (ROI) template was applied. 25 The hemispheric ROI was created by combining small segments in MCA territory from the basal ganglia level to the centrum semiovale level, and defined on both the lesion and normal hemispheres (see Figure 3). Lesion and normal hemispheric values were calculated for each parametric map of each patient. The lesion-to-normal ratio of each hemispheric CBF was calculated (‘CBF ratio’). For ATD (CTP) and MTT (PET), the lesion-to-normal differences in hemispheric values were calculated (‘ATD difference’ and ‘MTT difference’, respectively).
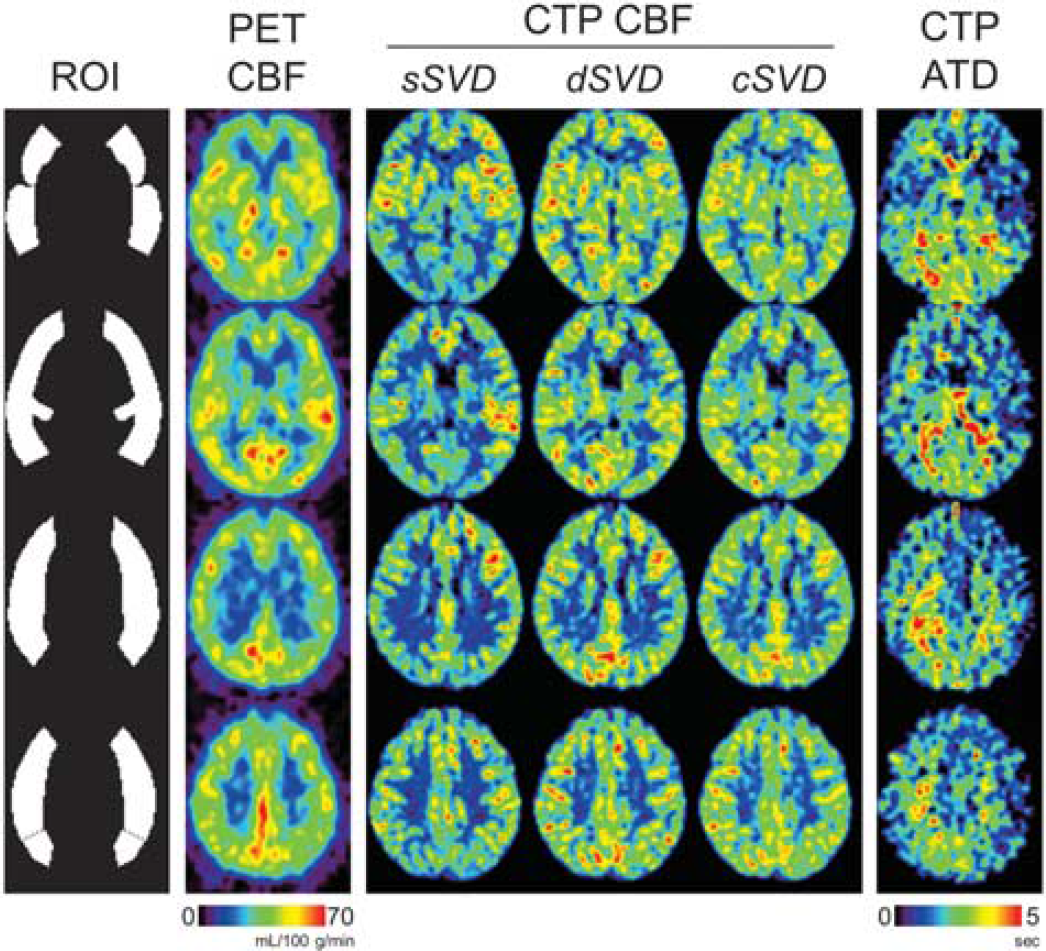
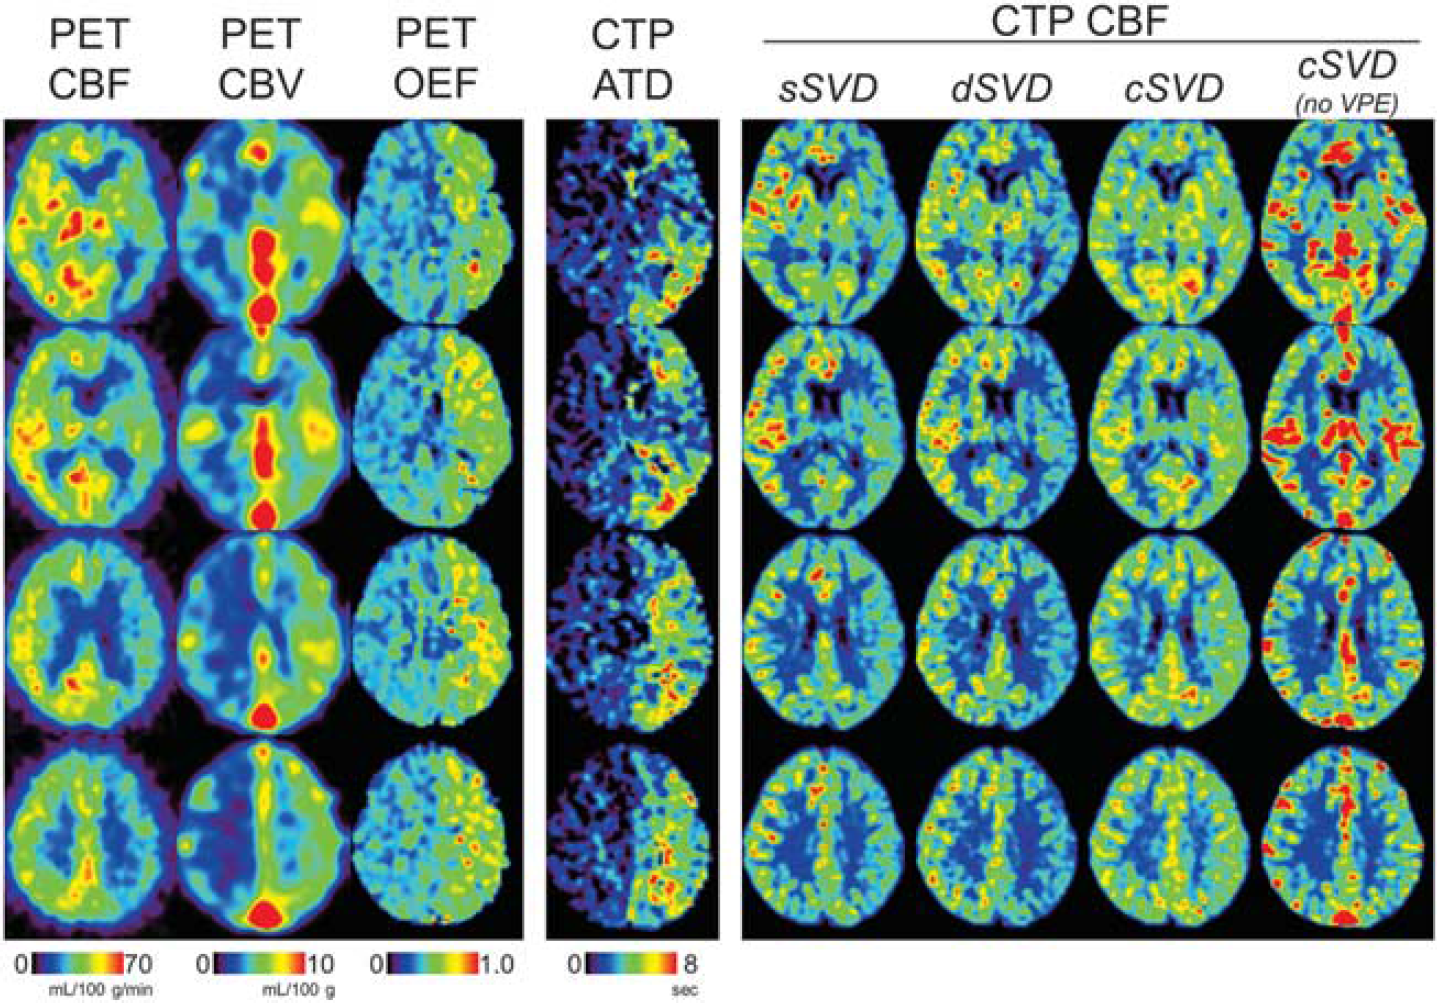
Computed tomography perfusion (CTP)-derived cerebral blood flow (CBF) maps with vascular pixel elimination (VPE) and positron emission tomography (PET) results in a patient (No. 09) with right internal carotid artery (ICA) stenosis, with four slices located 0, 12, 24, and 36 mm from the anterior commissure-posterior commissure (AC-PC) line. Regions of interest (ROIs) covering the cerebral cortex in middle cerebral artery (MCA) territory are also shown. CTP CBF maps are scaled relative to the CBF in the normal hemisphere so that the normal hemisphere is similarly displayed for all deconvolution algorithms. cSVD, block-circulant singular value decomposition; dSVD, delay-corrected singular value decomposition; sSVD, standard singular value decomposition.
The effects of the deconvolution algorithms and VPE processing on CBF ratios were assessed by analysis of variance (ANOVA). Differences between PET and CTP were examined by paired
Differences in lesion-to-normal CBF ratios between CTP and PET were calculated as 100% × (CBF ratioCTP – CBF ratioPET)/CBF ratioPET, and were correlated with ATD and MTT differences. Any statistically significant correlation was subjected to least-squares regression analysis.
In all analyses, statistical significance was defined at
Simulation Study
Computer simulations were performed to assess ATD- and MTT-dependent CBF errors induced by each deconvolution algorithm, according to standard simulation procedures.4,13,18 For fixed CBF with varying ATD or MTT, tissue TICs were calculated as a convolution of AIF and residue function multiplied by CBF. The CBF estimates were derived by the deconvolution of the simulated TICs and subsequently compared with the true CBF to determine CBF errors as a percentage. Noise effects were not considered because this simulation study focused on ATD and MTT dependences of CBF estimates. Patient-averaged AIF, defined as the mean of AUC-normalized AIFs for all patients in the study, was used in the simulations. Residue function was assumed to be a combination of boxcar and exponential decay functions, considered more physiologically plausible than either alone. 26 The SVD cutoff was set at 0.10 for all deconvolution algorithms.
RESULTS
Computed Tomography Perfusion-Derived Cerebral Blood Flow
Computed tomography perfusion-derived lesion-to-normal CBF ratios, ATD differences, and PET results for each patient are summarized in Table 1. All the results from CTP in Table 1 were obtained with VPE processing, but the results including CBF estimates without VPE processing are plotted in Supplementary Figure 1. Average CBF ratios with and without VPE processing were 0.81 and 0.78, respectively, for sSVD; 0.94 and 0.91, respectively, for dSVD; and 1.01 and 1.01, respectively, for cSVD. Repeated-measures ANOVA showed significant differences in CBF ratios among the deconvolution algorithms (
Results in each patient
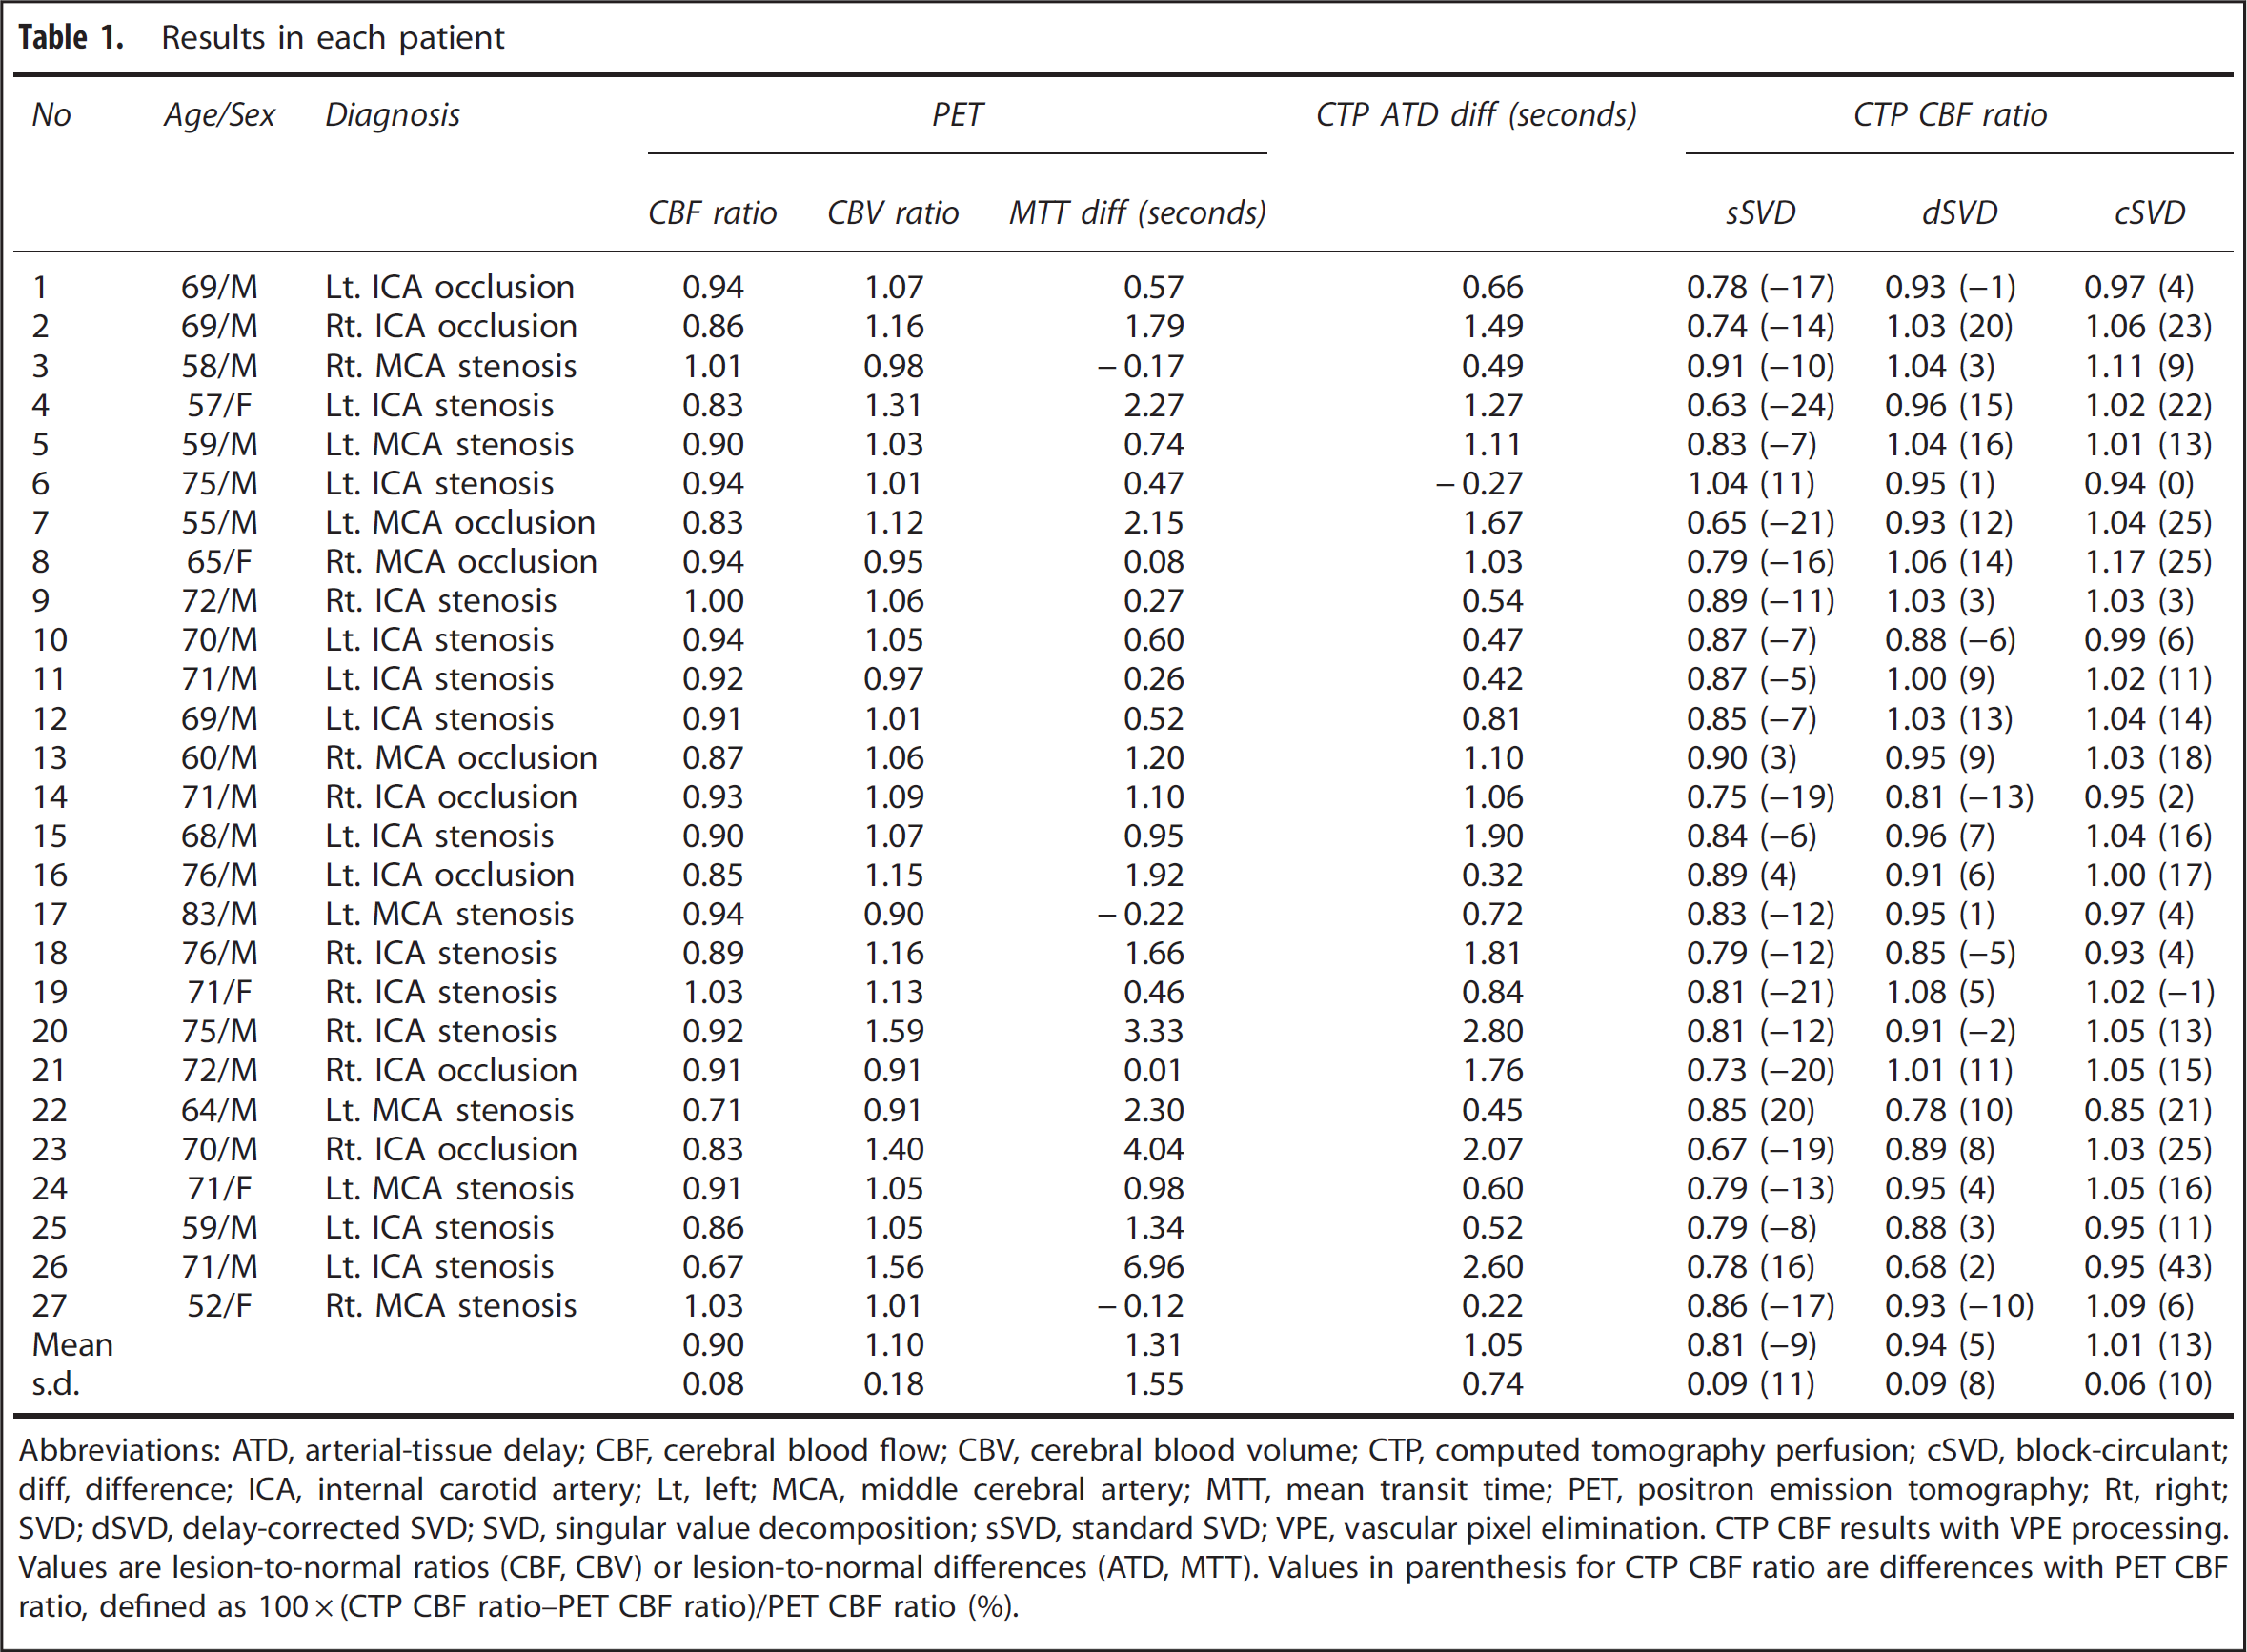
Abbreviations: ATD, arterial-tissue delay; CBF, cerebral blood flow; CBV, cerebral blood volume; CTP, computed tomography perfusion; cSVD, block-circulant; diff, difference; ICA, internal carotid artery; Lt, left; MCA, middle cerebral artery; MTT, mean transit time; PET, positron emission tomography; Rt, right; SVD; dSVD, delay-corrected SVD; SVD, singular value decomposition; sSVD, standard SVD; VPE, vascular pixel elimination.
CTP CBF results with VPE processing. Values are lesion-to-normal ratios (CBF, CBV) or lesion-to-normal differences (ATD, MTT). Values in parenthesis for CTP CBF ratio are differences with PET CBF ratio, defined as 100 × (CTP CBF ratio–PET CBF ratio)/PET CBF ratio (%).
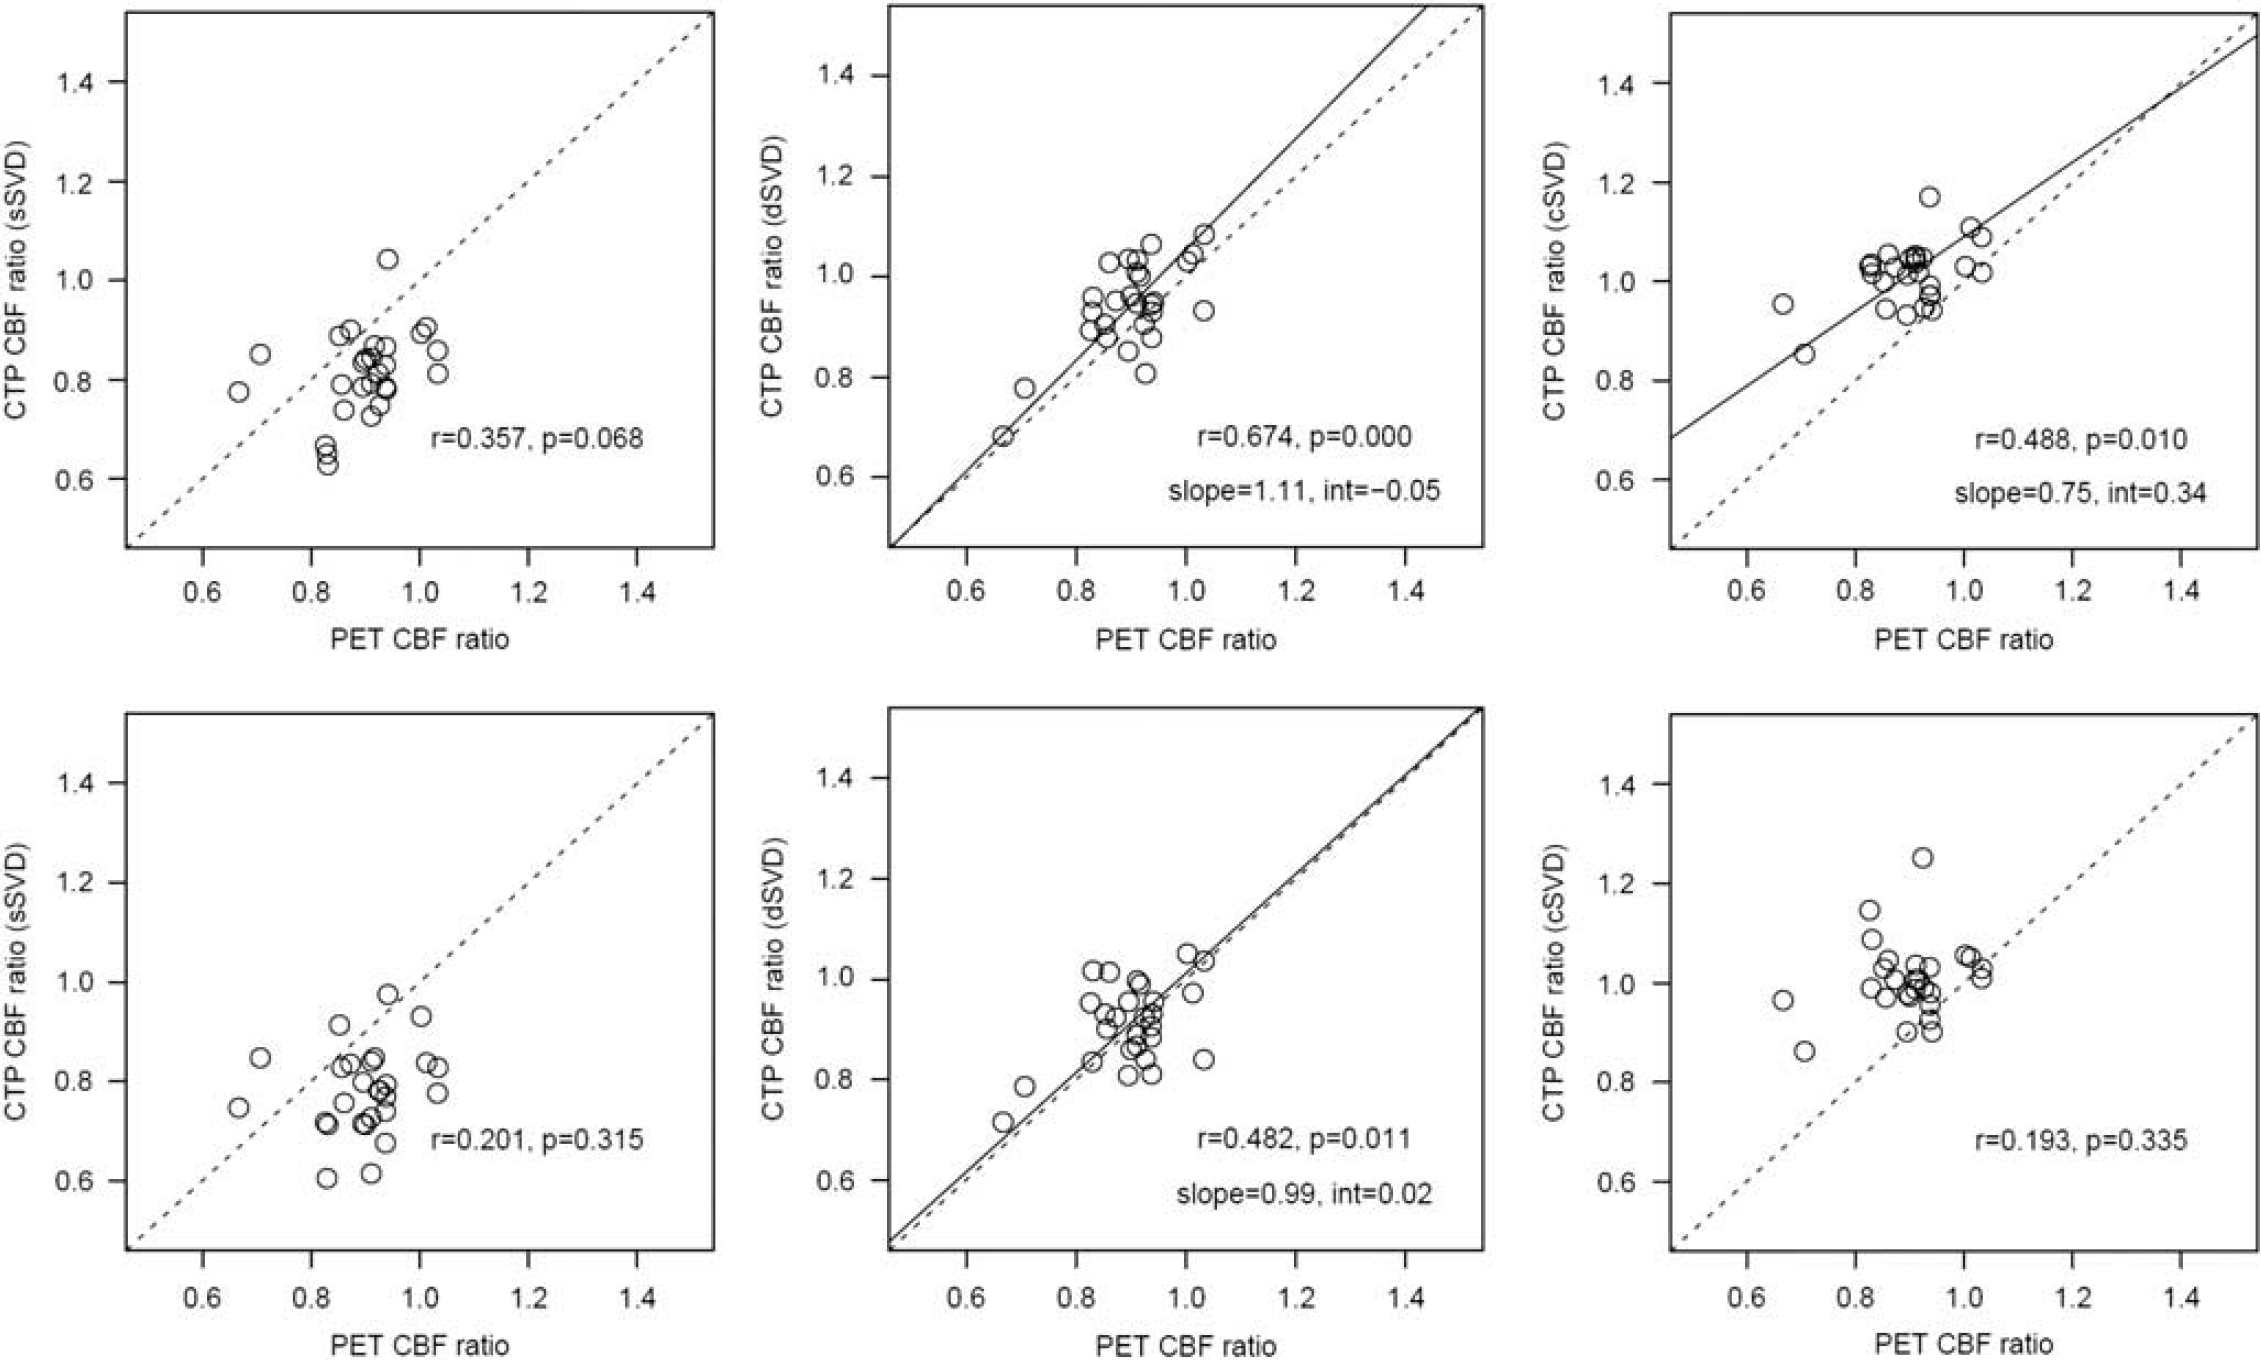
Correlations of lesion-to-normal cerebral blood flow (CBF) ratios of positron emission tomography (PET) and computed tomography perfusion (CTP) with vascular pixel elimination (VPE) (upper panels) and without VPE (lower panels) for standard singular value decomposition (sSVD) (left), delay-corrected singular value decompositio (dSVD) (center), and block-circulant singular value decomposition (cSVD) (right).
Comparison with Positron Emission Tomography
Computed tomography perfusion-derived CBF ratios significantly differed from PET CBF ratios, except for dSVD without VPE processing (Supplementary Figure 1). Compared with PET CBF ratios (0.90), sSVD yielded lower (–9%), and dSVD (+5%) and cSVD (+13%) higher, CBF ratios (Table 1; CTP with VPE processing). Scatter plots of CBF ratios between PET and CTP with VPE processing are shown in the upper panel of Figure 1. Correlations with PET were statistically significant for dSVD and cSVD, but not for sSVD. When VPE processing was not applied (lower panel of Figure 1), the variability in CTP CBF ratios increased and the correlation coefficients with PET decreased.
Relationship to Arterial-Tissue Delay and Mean Transit Time
Differences in lesion-to-normal CBF ratio between CTP with VPE processing and PET were plotted relative to lesion-to-normal ATD difference (Figure 2, upper panel) and lesion-to-normal MTT difference (Figure 2, lower panel). Correlation and regression analyses were performed after excluding one patient (No. 26), with an extremely large (greater than mean+3 s.d.) lesion-to-normal MTT difference (Table 1). For sSVD, the difference in CBF ratio between CTP and PET was negatively correlated with the ATD difference. For cSVD, the difference in CBF ratio was positively correlated with both ATD difference and MTT difference, with the correlation becoming stronger if Patient No. 26 was included. There was no significant correlation for dSVD. Analyses without VPE processing showed the same trend, but the dependences on ATD and MTT became more prominent (Supplementary Figure 2). For example, for cSVD the correlation coefficient of MTT dependence increased from 0.535 with to 0.869 without VPE processing. For dSVD, the correlation with MTT difference reached statistical significance.
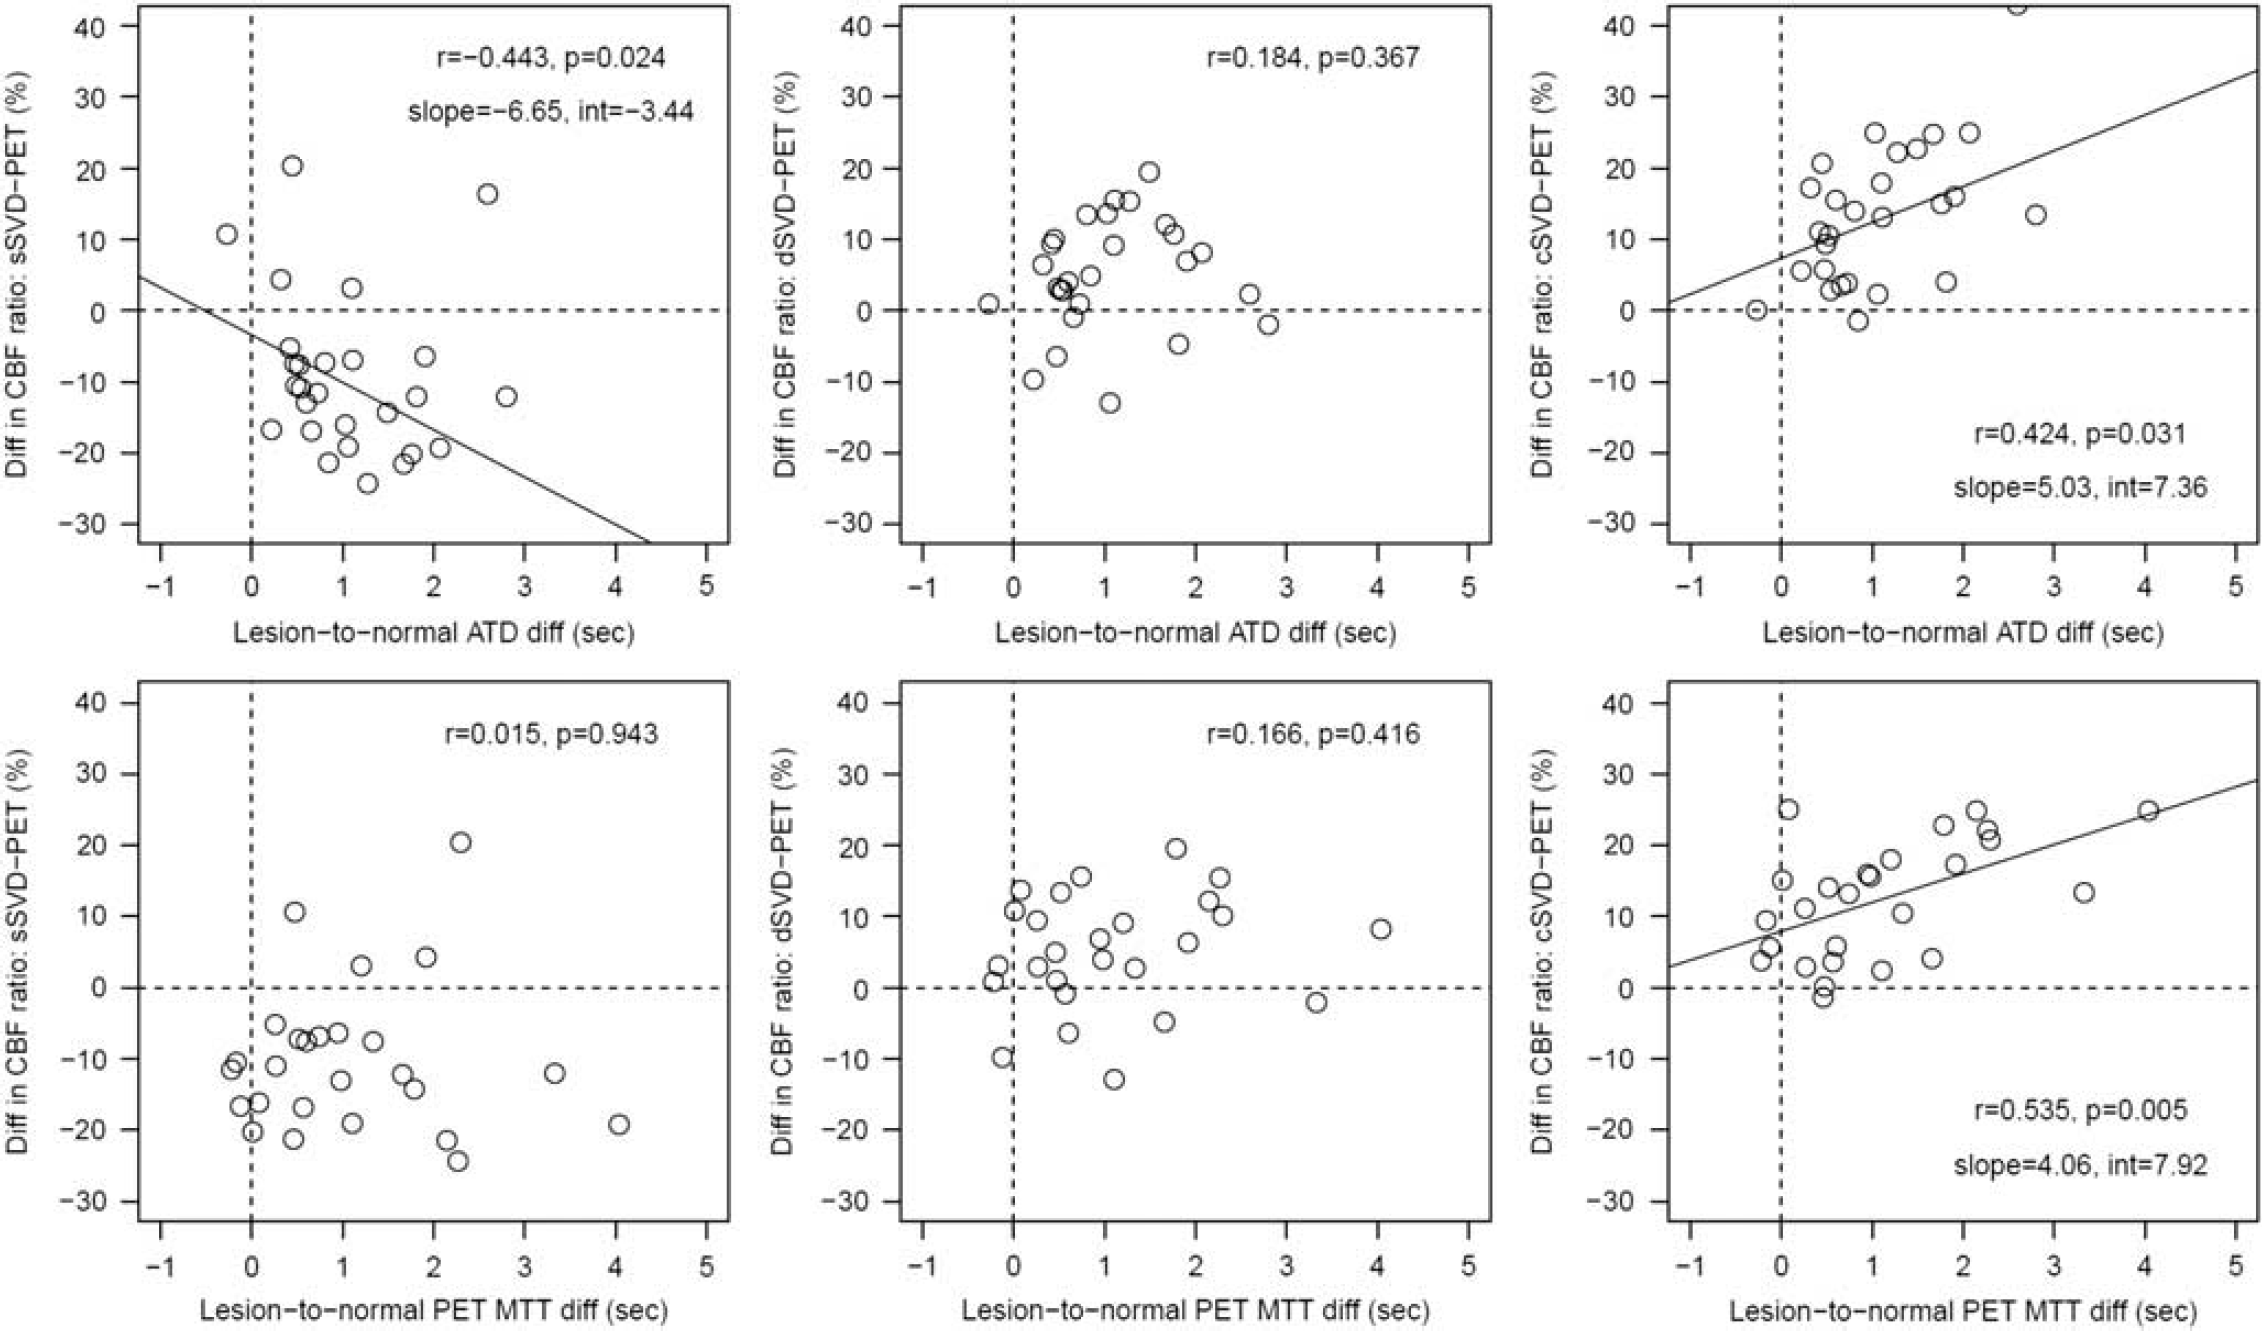
Differences in lesion-to-normal cerebral blood flow (CBF) ratios between computed tomography perfusion (CTP) (with vascular pixel elimination (VPE)) and positron emission tomography (PET), in relation to lesion-to-normal differences in arterial-tissue delay (ATD) (upper panel) and mean transit time (MTT) (lower panel).
The correlation between ATD difference and MTT difference was statistically significant (
Representative Maps
Computed tomography perfusion and PET maps from two representative patients are presented in Figures 3 and 4. Computed tomography perfusion CBF maps were scaled relative to each normal hemisphere so that the normal hemisphere was similarly displayed for all deconvolution algorithms. Figure 3 shows results from a patient with right ICA stenosis (No. 09). Although ATD was slightly prolonged (0.54 second) in the right hemisphere compared with the normal left hemisphere, PET CBF maps showed no visible left-right asymmetry (CBF ratio, 1.00) and MTT prolongation was slight (0.27 second). Similarly, CTP-derived CBF maps showed no recognizable asymmetry for dSVD (CBF ratio, 1.03) and cSVD (CBF ratio, 1.03), although the sSVD CBF ratio was reduced to 0.89.
Computed tomography perfusion (CTP)-derived cerebral blood flow (CBF) maps with vascular pixel elimination (VPE) and positron emission tomography (PET) in a patient (No. 26) with left internal carotid artery (ICA) stenosis, with four slices located 0, 12, 24, and 36 mm from the anterior commissure-posterior commissure (AC-PC) line. A CBF map without VPE is also shown for block-circulant singular value decomposition (cSVD). CTP CBF maps were scaled relative to the CBF in each normal hemisphere so that the normal hemisphere is similarly displayed for all deconvolution algorithms. dSVD, delay-corrected singular value decomposition; sSVD, standard singular value decomposition.
Figure 4 shows maps of a patient with left ICA stenosis (No. 26). Positron emission tomography maps showed a significant reduction in CBF and increases in CBV and oxygen extraction fraction in the left hemisphere, indicating a severe reduction of perfusion pressure. Similarly, CTP-derived ATD maps showed marked prolongation of ATD (2.60 seconds) in the left hemisphere. Both sSVD and dSVD CBF maps showed reduced CBF in the left hemisphere, although the PET CBF ratio (0.67) was close to that of dSVD (0.68) than to sSVD (0.78). In contrast to both these algorithms, cSVD yielded CBF maps with no apparent left-right asymmetry (CBF ratio, 0.95). Figure 4 also shows CBF maps without VPE processing for cSVD. Irrespective of VPE processing, CBF reduction in left hemisphere was not clear with cSVD.
Simulation Study
Arterial-tissue delay-dependent errors in CBF estimates were simulated with three different MTT values (4, 6, and 10 seconds) (Figure 5, upper panel). Simulation results normalized at ATD = 0 second are also shown (Figure 5, lower panel). For sSVD, simulations with MTTs of 4 and 6 seconds showed ATD-dependent CBF underestimations for positive ATD values, but these results were not observed when MTT was 10 seconds. For dSVD and cSVD, ATD dependences were small for all MTT conditions.
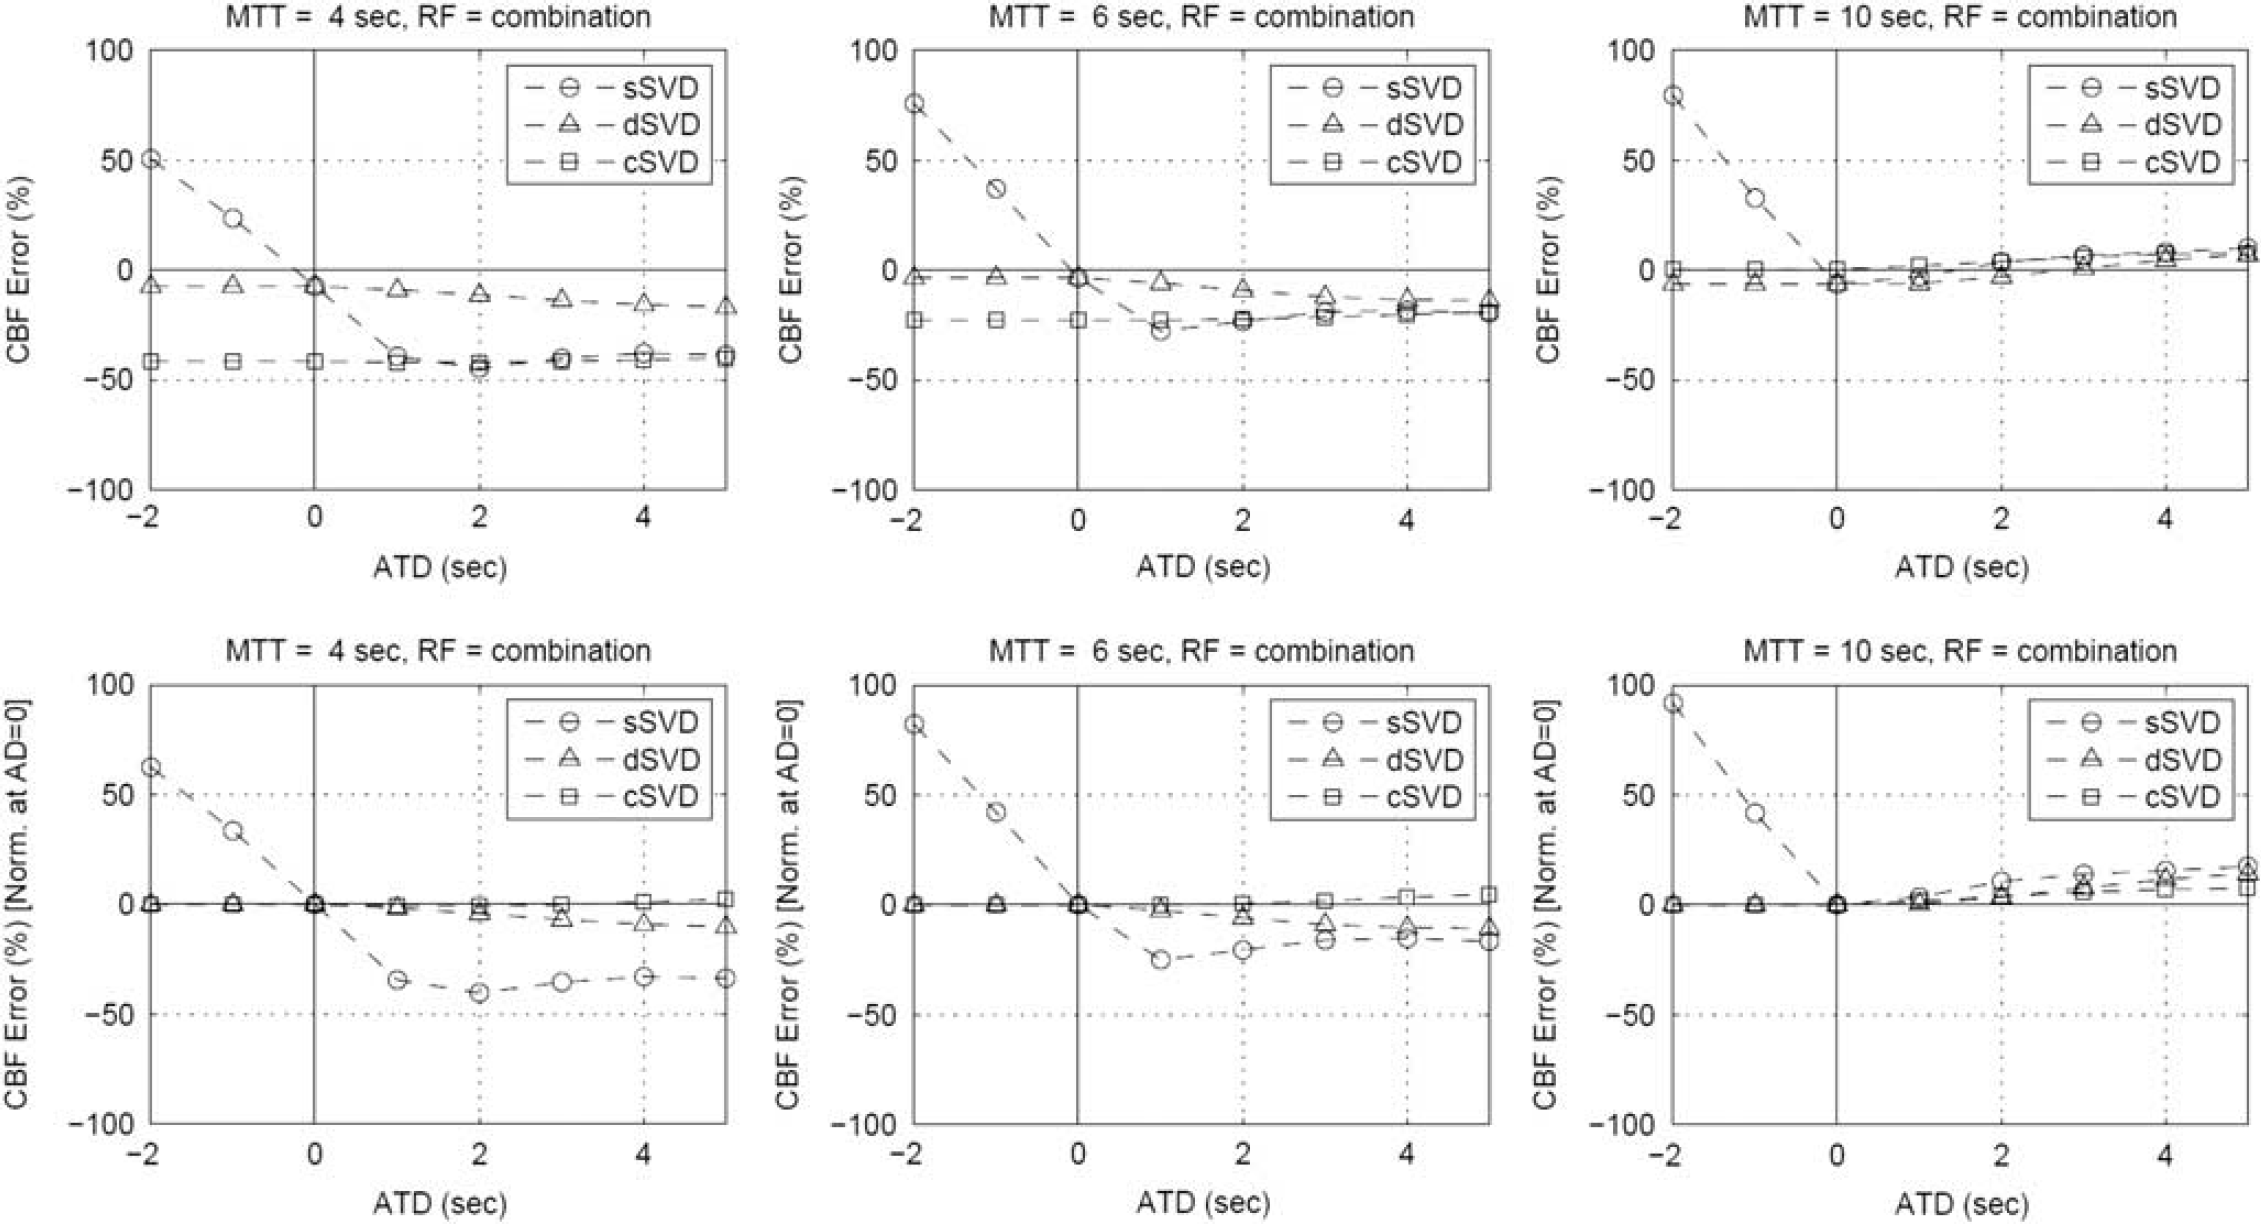
Simulation results of cerebral blood flow (CBF) errors in relation to arterial-tissue delay (ATD), with absolute (upper panels) and relative (lower panels) CBF errors normalized at ATD = 0 second (lower). Mean transit times (MTTs) were set at 4 seconds (normal; left), 6 seconds (normal to slightly prolonged, center), and 10 seconds (severely prolonged, right). Residue function was assumed to be a combination of a boxcar and an exponential decay function. cSVD, block-circulant singular value decomposition; dSVD, delay-corrected singular value decomposition; sSVD, standard singular value decomposition. 26
Figure 6 (upper panel) shows MTT-dependent errors in CBF estimates, with the normalized results at MTT of 4 seconds, defined as normal, shown in the lower panel of Figure 6. The results are identical for sSVD and dSVD because both algorithms have the same properties apart from ATD dependence, with this simulation assuming an ATD of 0 second. For all the deconvolution algorithms, CBF underestimations were observed with short MTT values, with the largest degree for cSVD. Therefore, the normalized CBFs were overestimated with longer MTT (> 4 seconds), especially for cSVD.
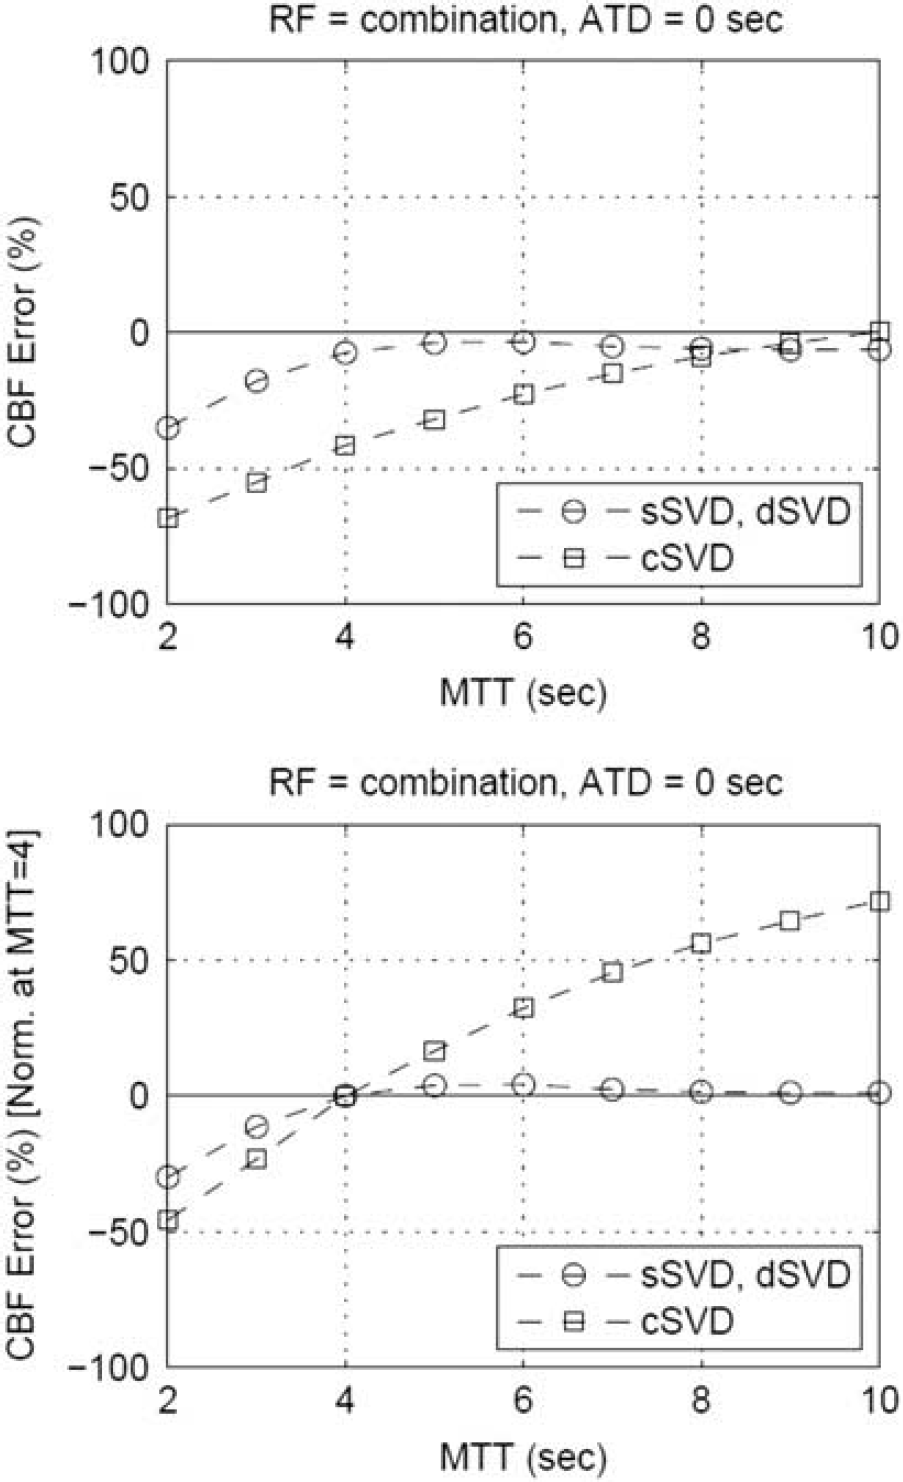
Simulation results of cerebral blood flow (CBF) errors in relation to mean transit time (MTT), with absolute (upper panels) and relative (lower panels) CBF errors normalized at MTT = 4 seconds. Residue function was assumed to be a combination of a boxcar and an exponential decay function. 26 ATD, arterial-tissue delay; cSVD, block-circulant singular value decomposition; dSVD, delay-corrected singular value decomposition; sSVD, standard singular value decomposition.
In all the simulations shown above, the residue function was assumed to be the combination of a boxcar and an exponential function. 26 Simulations with each alone showed the same trends: ATD-dependent underestimations of CBF ratio for sSVD and MTT-dependent overestimations of CBF ratio for cSVD (Supplementary Figure 4).
DISCUSSION
Deconvolution Analysis
The deconvolution algorithms tested in the present study provided CBF ratios different from those provided by PET, in that CBF ratios were underestimated for sSVD and overestimated for dSVD and cSVD. The errors in CBF ratio using the deconvolution algorithms were dependent, to different degrees, on ATD and MTT. The simulations reproduced the results observed in patients, in that sSVD overestimated CBF ratios for ATD-prolonged regions, whereas cSVD overestimated CBF ratios for MTT-prolonged regions. Because dSVD is independent of ATD and its degree of MTT dependence is identical to that of sSVD, dSVD may be the most appropriate of the three algorithms. However, dSVD requires pixel-by-pixel determinations of ATD values. The ATD map was calculated by the least-squares fitting procedure in the present study, but using a more realistic method such as the threshold processing of TICs, reasonably accurate maps are difficult to calculate in clinical practice. 27 A simple, robust method that generates CBF maps with sufficient accuracy is therefore required.
Cerebral blood flow underestimation by sSVD due to the presence of ATD has been reported in patients.16,18 In Patient No. 09, sSVD showed a significant reduction in CBF in the lesional hemisphere, which should be interpreted as ATD-dependent CBF errors in sSVD. Delay-insensitive deconvolution algorithms are indispensable for assessing mild-to-moderate CBF reduction. Both dSVD and cSVD provided higher lesion-to-normal CBF ratios than sSVD, findings that we considered reasonable because of the delay-insensitive properties of dSVD and cSVD.16,18 However, the degree to which CBF estimates were dependent on MTT differed markedly for dSVD and cSVD. The simulations also showed that cSVD is more MTT dependent than dSVD. The cSVD algorithm should not be applied to patients with severely prolonged MTT because the MTT-dependent overestimation of CBF ratio may obscure CBF reduction in the lesion. In theory, cSVD is not dependent on ATD. However, our findings showed the ATD dependence of CBF estimates even for cSVD. The ATD dependence of cSVD may be attributable to the pathophysiologic correlation between ATD and MTT, not to an algorithmic error. In patients with steno-occlusive disease, reductions in perfusion pressure inevitably cause the prolongation of both ATD and MTT and their pathophysiologic correlation.
The simulations showed that absolute CBFs were underestimated in short MTT regions to varying degrees, depending on the deconvolution algorithms, and that each of these underestimations results in the overestimation of CBF ratios in MTT-prolonged regions. Underestimates are the result of the regularization of deconvolution (i.e., SVD cutoff), eliminating high-frequency components of the residue function.11,17 That is, current deconvolution methods cannot capture the rapid kinetics of intravascular tracers with sufficient accuracy for CBF quantification. 28 Improved deconvolution algorithms have been proposed,11,29,30 but must be validated before clinical use of CBF maps. The MTT dependence of these algorithms requires validation in humans.
Vascular Pixel Elimination
Vascular pixel elimination processing has been shown to greatly change absolute CBF values.19,31 In the present study, however, VPE had marginal (~ 3%) effects on CBF ratios. The VPE processing affects both lesions and normal brain tissue to a similar degree, resulting in similar CBF ratios with and without the VPE. In the absence of VPE processing, however, the correlations with PET became weakened, and the dependences on ATD and MTT more prominent. These results indicate that VPE processing partly improves the reliability of CTP CBF maps in patients with steno-occlusive disease, consistent with a previous study showing that excluding high-blood flow areas in CTP improved the correlation between CTP CBF and single photon emission computed tomography CBF over the entire brain. 31 The current VPE method, in which vascular pixels are removed using pre-specified thresholds of CBV, has room for improvement.
Limitations
Manufacturer-supplied programs are usually used in clinical practice. Such programs vary in implementation of deconvolution algorithms, VPE processing, SVD cutoff values, partial volume effect correction, and other details of data handling. Therefore, the present findings obtained with in-house deconvolution programs cannot be easily related to CTP CBF maps created from a specific CT scanner in a clinical setting. In our previous study in 10 patients, CBF maps were by the manufacturer-supplied program using a delay-insensitive deconvolution (called SVD plus) and VPE processing. 20 Although we observed a significant correlation between PET and CTP results, the reliability of the CBF maps could not be fully determined because the details of these programs were not disclosed to users, partly motivating this present study. Standardization of post processing for CTP and MRP is urgently needed,32–34 and the present investigation may help to understand the variety of the deconvolution algorithms.
The heterogeneity of the patients is one of the limitations. This retrospective study included both symptomatic and asymptomatic patients with atherosclerotic stenosis or occlusion of major artery. Because of a limited number of patients, it is difficult to relate the present results to the previous ischemic events. Almost all patients were scanned with PET to assess indications for revascularization surgery, with many having a mild reduction in CBF in the lesion hemisphere (0.90 of the mean PET CBF ratio). If CBF reduction is more severe, then the MTT-dependent overestimation of CBF ratio with cSVD may not be a problem. In contrast to our findings, showing that CBF ratios were overestimated for cSVD, CBF ratios showed good agreement with cSVD and single photon emission computed tomography in patients with cerebrovascular steno-occlusive disease. 35 This discrepancy may be because of differences in the degree of CBF reduction, as well as to the different standard methods used (PET or single photon emission computed tomography).
Relatively large size of ROIs, covering the whole MCA region in the hemisphere, was applied in the present study. A smaller size of ROIs fitted to the region of ischemic core will calculate lower values of lesion-to-normal CBF ratio, and may provide more definitive results on ATD and MTT dependence. However, the analysis using the small ROIs inevitably enhances errors associated with the difference in effective spatial resolution of reconstructed PET and CTP images and the registration between both the modalities. Using small multiple ROIs allows analysis of deconvolution-induced errors in regional CBFs for each subject, and warrants a further study.
Extrapolating the current findings to an MRP study requires attention. Simulation results showed that the ATD and MTT dependence of CBF estimates are milder for MRP, in which the injection duration is shorter and the temporal width of AIF smaller than for CTP (data not shown). Magnetic resonance perfusion may be more appropriate than CTP for detecting mild-to-moderate CBF reduction in hemodynamically-compromised brain regions.
CONCLUSION
Computed tomography perfusion results strongly depend on the deconvolution algorithms used. With sSVD, ATD dependence results in underestimations of lesion-to-normal CBF ratio. With cSVD, MTT prolongation in the lesions results in overestimation of lesion-to-normal CBF ratio. Deconvolution by dSVD provides lesion-to-normal CBF ratios that are less sensitive to ATD and MTT, but requires accurate ATD maps in advance. A practical method less dependent on MTT is needed for accurate CBF assessment in patients with cerebrovascular steno-occlusive disease.
DISCLOSURE/CONFLICT OF INTEREST
The authors declare no conflict of interest.
Footnotes
References
Supplementary Material
Please find the following supplemental material available below.
For Open Access articles published under a Creative Commons License, all supplemental material carries the same license as the article it is associated with.
For non-Open Access articles published, all supplemental material carries a non-exclusive license, and permission requests for re-use of supplemental material or any part of supplemental material shall be sent directly to the copyright owner as specified in the copyright notice associated with the article.