
Abstract
Perfusion-weighted (PW) magnetic resonance imaging (MRI) is used to detect penumbral tissue in acute stroke, but the selection of optimal PW-maps and thresholds for tissue at risk detection remains a matter of debate. We validated the performance of PW-maps with 15O-water-positron emission tomography (PET) in a large comparative PET-MR cohort of acute stroke patients. In acute and subacute stroke patients with back-to-back MRI and PET imaging, PW-maps were validated with 15O-water-PET. We pooled two different cerebral blood flow (CBF) PET-maps to define the critical flow (CF) threshold, (i) quantitative (q)CBF-PET with the CF threshold <20 ml/100 g/min and (ii) normalized non-quantitative (nq)CBF-PET with a CF threshold of <70% (corresponding to <20 ml/100 g/min according to a previously published normogram). A receiver operating characteristic (ROC) curve analysis was performed to specify the accuracy and the optimal critical flow threshold of each PW-map as defined by PET. In 53 patients, (stroke to imaging: 9.8 h; PET to MRI: 52 min) PW-time-to-maximum (Tmax) with a threshold >6.1 s (AUC = 0.94) and non-deconvolved PW-time-to-peak (TTP) >4.8 s (AUC = 0.93) showed the best performance to detect the CF threshold as defined by PET. PW-Tmax with a threshold >6.1 s and TTP with a threshold >4.8 s are the most predictive in detecting the CF threshold for MR-based mismatch definition.
Keywords
Introduction
The ischemic penumbra refers to critically perfused tissue at risk of infarction if no reperfusion is established to maintain cell viability. 1 Accurate ischemic penumbra detection is therefore essential for the identification of viable brain tissue which is the therapeutic target in acute ischemic stroke. 2 15O positron emission tomography (PET) is the gold standard to detect penumbra tissue in acute ischemic stroke. 15O PET studies define the penumbra as ischemic tissue of reduced cerebral blood flow (CBF) with an increased oxygen extraction fraction (OEF) leading to a preserved oxygen metabolism (CMRO2).3,4 Several studies have identified limits of brain tissue tolerance to ischemia based on microelectrode studies, histology, and PET studies. 5 The widely established PET CBF critical flow (CF) threshold of approximately <20 ml/100 g/min helps to discriminate benign oligemic tissue from critically perfused penumbral tissue.5–7
Since PET imaging in acute stroke is logistically challenging and restricted to few research sites, the magnetic resonance imaging (MRI)-based mismatch concept – a surrogate of the penumbra concept in PET – has been implemented. Clinical studies and therapeutic decisions in ischemic stroke are increasingly based on the widely available MR mismatch concept. However, there are only few acute ischemic stroke studies with a limited number of patients that validate the MR-based mismatch by direct comparison with 15O PET.8–10
Patients with acute ischemic stroke might benefit beyond the 4.5-h time window from the accurate identification of the salvageable tissue. Therefore, the aim of our study was to identify and validate the best perfusion-weighted (PW) maps and thresholds to detect critically perfused tissue at risk of infarction. To this end, we investigated how precisely the established CF threshold (<20 ml/100 g/min) from 15O-water-PET, can be estimated by commonly used MRI PW-maps.
Material and methods
Patients
This prospective imaging study includes patients with acute and subacute ischemic hemispheric stroke with consecutive PET and MRI imaging. Time between both imaging modalities was kept as short as possible and any patients with changes in NIHSS >2 during and between both imaging procedures were excluded. Pure subcortical strokes and small vessel strokes were excluded. An experienced stroke neurologist supervised the patients during the whole procedure according to our stroke unit standards. Part of this patient population as well as the inclusion and exclusion criteria were described and published previously.9,10 The study was approved by the local ethics committee of the University of Cologne, Germany. All patients gave written informed consent in accordance with the ethical standards of the Helsinki Declaration of 1975 and its later amendments.
MRI and PET (image) acquisition
MRI was performed on a 1.5 Tesla whole-body scanner (Philips Intera Master). Dynamic susceptibility contrast (DSC) PW-images were acquired in an axial direction (20 slices, 6 mm slice-thickness, 0.6 mm interslice gap, field of view 23 cm) and multishot 3D T2*-weighted gradient echoplanar imaging (EPI) sequences (PRESTO; effective TE 25 ms, flip angle 9°, EPI factor 17, matrix 64 × 51, resulting voxel size 3.6 × 3.6 × 6 mm) were used. The DSC PW-protocol included 60 measurements at intervals of 1.3 s after standardized intravenous injection of 20 ml of gadolinium-DTPA (Magnevist, Schering AG; power injector infusion flow rate 10 ml/s, followed by of 20-ml saline). T1-weighted images with the following parameters were acquired (TE: 1.8 ms, TR: 145 ms, flip angle: 80°, matrix: 256 × 256, pixel size: 0.9 × 0.9 mm2, slice thickness: 6 mm, interslice gap: 0.6 mm).
PET was performed in a resting state on an ECAT EXACT HR scanner (Siemens/CTI). CBF was measured with an intravenous bolus of 15O-water (60 mCi = 2.2 GBq) in a 2D data acquisition mode providing 47 contiguous 3 mm slices of 5 mm full width at half-maximum (FWHM) in plane reconstructed resolution. Reconstruction was performed by three dimension filtered-back projection using a Hanning filter of cut-off frequency of 0.4 cycles per pixel. After a transmission scan (10 min), data acquisition started after intravenous injection of 15O-water and lasted for 90 s (40 s after the tracer reached the brain). Two groups were measured (i) quantitative CBF (qCBF) group: acquired with continuous arterial blood sampling (radial artery) by an automated blood-sampling system and (ii) non-quantitative CBF (nqCBF) group: images were acquired without an arterial input function (AIF).
MRI and PET (image) postprocessing
Postprocessing of the MRI DSC PW raw images was performed as follows: Using our inhouse software, all raw DICOM DSC images were realigned to correct for movement artifacts. Then we used the research software PMA [version 5.0] 11 to generate non-deconvolved PW-maps of time-to-peak (TTP) from the tissue response curve as well as deconvolved PW-maps of cerebral blood flow (CBF), time-to-maximum (Tmax), and mean transit time (MTT) from the deconvolved tissue response curve using the non-parametric standard singular value decomposition (sSVD) deconvolution method. 12 Deconvolution was performed with a non-distorted AIF defined by 5 to 10 voxels manually chosen from the contralateral proximal M1 segment of the middle cerebral artery (MCA). 13 TTP normalization was performed (e.g. to remove variability due to injection timing) in line with previous studies. For this purpose, the mean value of a region of interest covering the contralateral middle cerebral artery (MCA) territory, in a slice including the basal ganglia, was subtracted from the absolute TTP values.10,14
Postprocessing of the 15O-water PET images to achieve quantification in ml/100 g/min was performed as follows: (i) qCBF maps were measured with a radial artery line and quantified as described in detail previously,
15
(ii) nqCBF maps were measured without an arterial line and normalized by dividing all pixels with the mean activity of a reference ROI from the hemisphere contralateral to the infarction (at the level of the basal ganglia including white, gray matter and the cerebral spinal fluid) multiplied by 100%. These normalized nqCBF maps (in percent mean flow of the contralateral hemisphere) were used to determine CBF values in ml/100 g/min applying a previously published normogram
16
(Figure 1).
Identical slices of cerebral blood flow measure with 15O-water PET within the same patient. (a) qCBF quantified with AIF from arterial line; (b) nqCBF without AIF normalized to contralateral side. The white contour corresponds to the critical flow threshold: (a) <20 ml/100 g/min, (b) <70% (corresponds to <20 ml/100 g/min in the normogram) showing a good agreement between both PET-methods.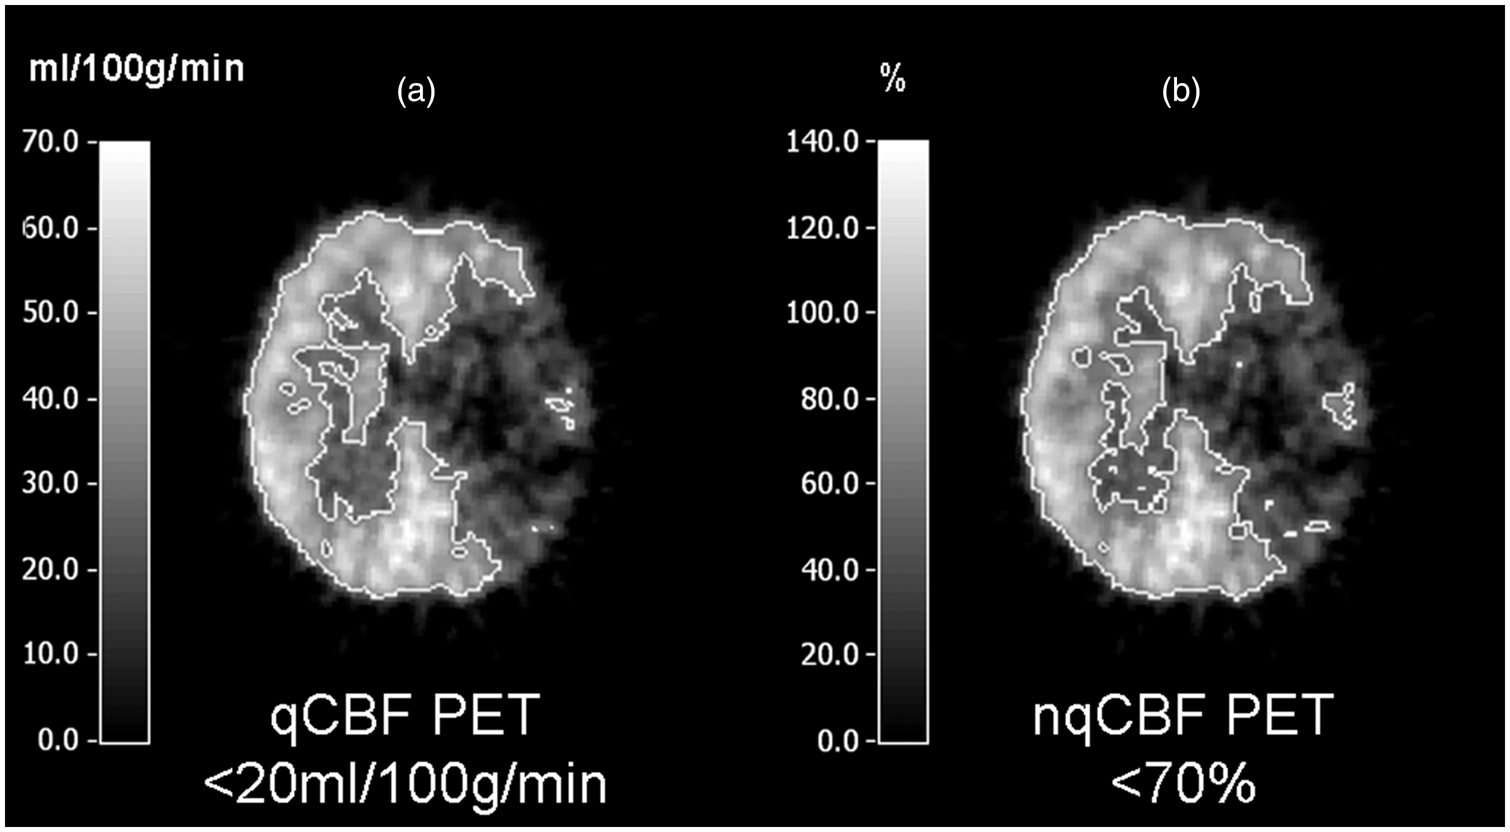
MRI and PET (image) analysis
All PET and MRI images were analysed with a multimodal imaging tool VINCI (Max Planck Institute for Neurological Research, Cologne, Germany). Due to different spatial resolution, the PET images (47 contigous 3-mm slices of 5-mm FWHM in plane reconstructed resolution) were resized to the PWI images (20 slices, 6-mm slice thickness with a voxel size of 3.6 × 3.6 × 6.0 mm). Because head positioning was different in MRI and PET, realignment of the volumetric data by an automated observer-independent algorithm based on multi-resolution maximization of mutual information (implemented in an easy-to-use graphical user interface: VINCI) allowed a volumetric fusion of the data sets.
17
For each patient a 3D brain mask was created based on the individual T1 image. On these individual masks ventricles, most of the white matter, large vessels and the sinuses were excluded by manual segmentation. Then a ROI analysis of the PET and MRI images was performed within this individual 3D brain mask placing 10-mm circular ROI’s along the cortex on each axial slice. These ROI’s were copied on to the coregistered PET-CBF and MRI-PW maps and the mean ROI values were used for further analysis. Voxels within the infarcted tissue without contrast bolus arrival were excluded from further analysis
18
(Figure 2).
ROI-based analysis: Region of interest analysis of positron emission tomography (PET) cerebral blood flow (qCBF or nqCBF group) and perfusion weighted (PW)-maps (CBF, CBV, Tmax, MTT and TTP). Circular regions of interest (10 mm) were manually drawn along the cortical rim and copied on the PET and MR PW-maps. Ventricles and periventricular white mater, large arteries, sinus, and areas of severely delayed contrast agent were excluded. ROC curve analysis was performed with a PET critical flow threshold for qCBF <20 ml/100 g/min or nqCBF <70% (corresponds to <20 ml/100 g/min in the normogram).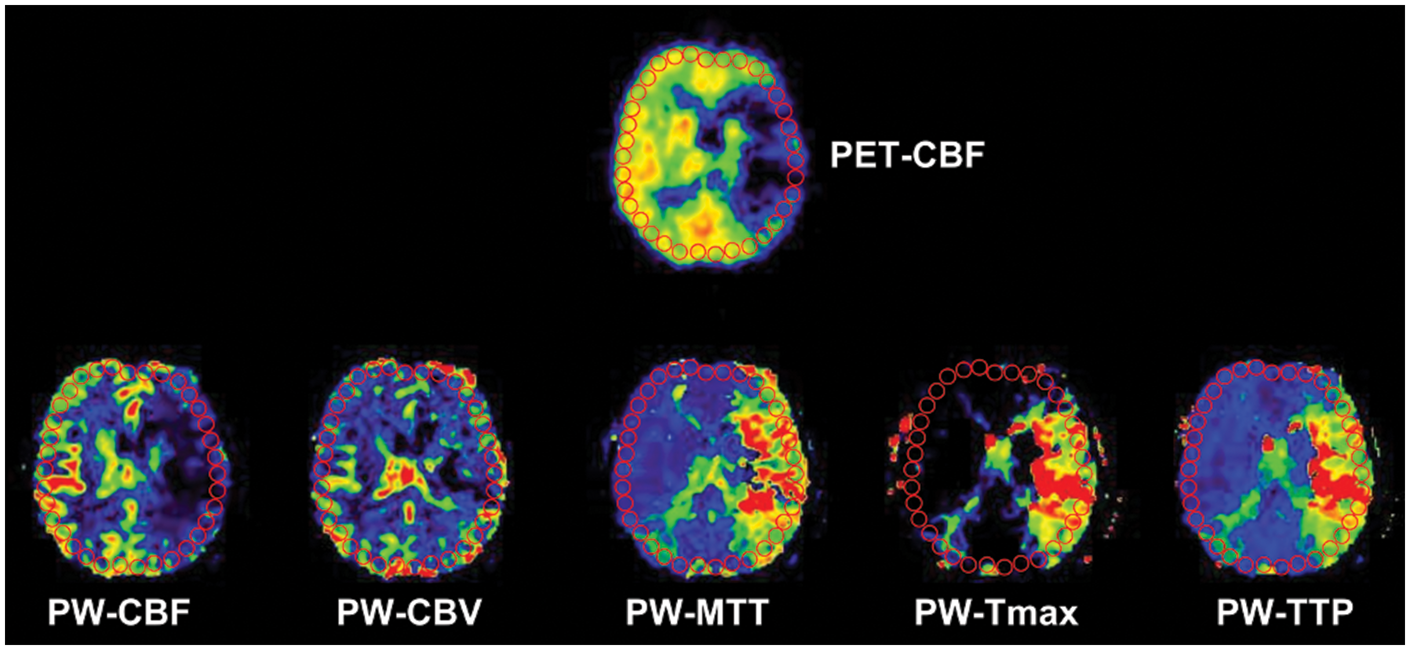
Statistical (image) analysis
The accuracy of the DSC-PW maps (TTP, CBF, MTT, Tmax) to detect the surrogate of the CF threshold as defined by PET, was determined by a receiver operating characteristic (ROC) curve analysis. 19 The CF threshold was defined by the previously validated PET CBF threshold of <20 ml/100 g/min. 4 The ROC curve analysis provides two important measures: The area under the curve (AUC) and the equal sensitivity and specificity threshold (ESST). The AUC represents a threshold independent accuracy measure of CF threshold detection and the ESST the optimal threshold of the DSC PW-maps to discriminate between benign oligemia and critically perfused tissue as defined by PET CBF <20 ml/100 g/min.
The ROC curve analysis was performed separately for each patient from the qCBF and nqCBF PET groups indentifying the AUC and the ESST for each DSC PW-map. In the qCBF PET group, the CF threshold <20 ml/100 g/min was used to classify ROI’s as <20 or >20 ml/100 g/min. In the normalized nqCBF PET group, a threshold corresponding to <20 ml/100 g/min was determined from a PET-based normogram published previously. 16 In this group, a normalized activity <70% of contralateral hemisphere mean activity corresponds to an absolute CBF value of <20 ml/100 g/min and was used for further ROC curve analysis. The qCBF and nqCBF groups were pooled (p)CBF. The median and interquartile range (IQR) of the AUC and ESST measure as well as their sensitivity and specificity values were calculated.
We tested for differences of AUC and ESST between the DSC PW-maps (1) in the qCBF, nqCBF groups and (2) in patients measured <24 h and >24 h. Comparison was performed with the Mann–Whitney rank-sum test. A significance level of p < 0.05 was applied. Data were analyzed with Sigmaplot 12 (SYSSTAT, 2012) and MED Calc (Version 15.2.1).
Results
Clinical data
In the qCBF/nqCBF/pCBF PET group, 31/22/53 patients (median age 56, IQR (48–64)/66 (56–71)/57 (53–67) years, median NIHSS 9 (6–14)/10 (5.8–14.3)/10 (6–14)) were included; 21/21/42 patients were imaged within 24 h after stroke (median 8.9 (4.8–18)/4.4 (2–15)/7 (3–17) h) and 10/1/11 were measured beyond 24 h (median 44 (31–260)/51 (51–51)/48 (32–255) h). The median time delay between MRI and PET was 69 (52–138)/41 (34–49)/52 (42–109) min. Internal carotid artery (ICA) stenosis was present ipsilateral to the infarct in 15/7/22 patients and contralateral to the infarct in 5/3/8 patients.
ROC curve analysis
The ROC curve analysis was performed separately for both PET groups, for every patient and each PWI modality (see table for qCBF and nqCBF group values). Based on the AUC from the pooled PET group, the best threshold independent performing map in detecting the CF threshold as defined by PET was Tmax (AUC 0.94) along with non-deconvolved TTP (AUC 0.93). The performance of CBF (AUC 0.89) and MTT (AUC 0.84) was significantly inferior (p < 0.05). The optimal CF thresholds based on the ESST (median values of the pooled PET group) were Tmax >6.1 s, TTP >4.8 s, CBF <25.0 ml/100 g/min, and MTT >5.6 s (see table for a summary of pCBF group values). There was no significant difference of AUC and ESST values between (1) both PET groups (qCBF and nqCBF) and (2) patients measured within and after 24 h.
Discussion
It was the aim of our study to improve the performance of DSC PW-maps to detect tissue at risk of infarction in acute and subacute ischemic stroke. Therefore, we validated commonly used PW-maps with PET, the gold standard of in vivo penumbra detection, in a large comparative PET-MR cohort of acute and subacute stroke patients.
Median equal sensitivity and specificity threshold critical flow (CF) threshold values of Tmax, MTT, CBF, and TTP-delay with its corresponding sensitivity and specificity and the median area under the curve (AUC) results from the receiver operating characteristic (ROC) curve analysis.
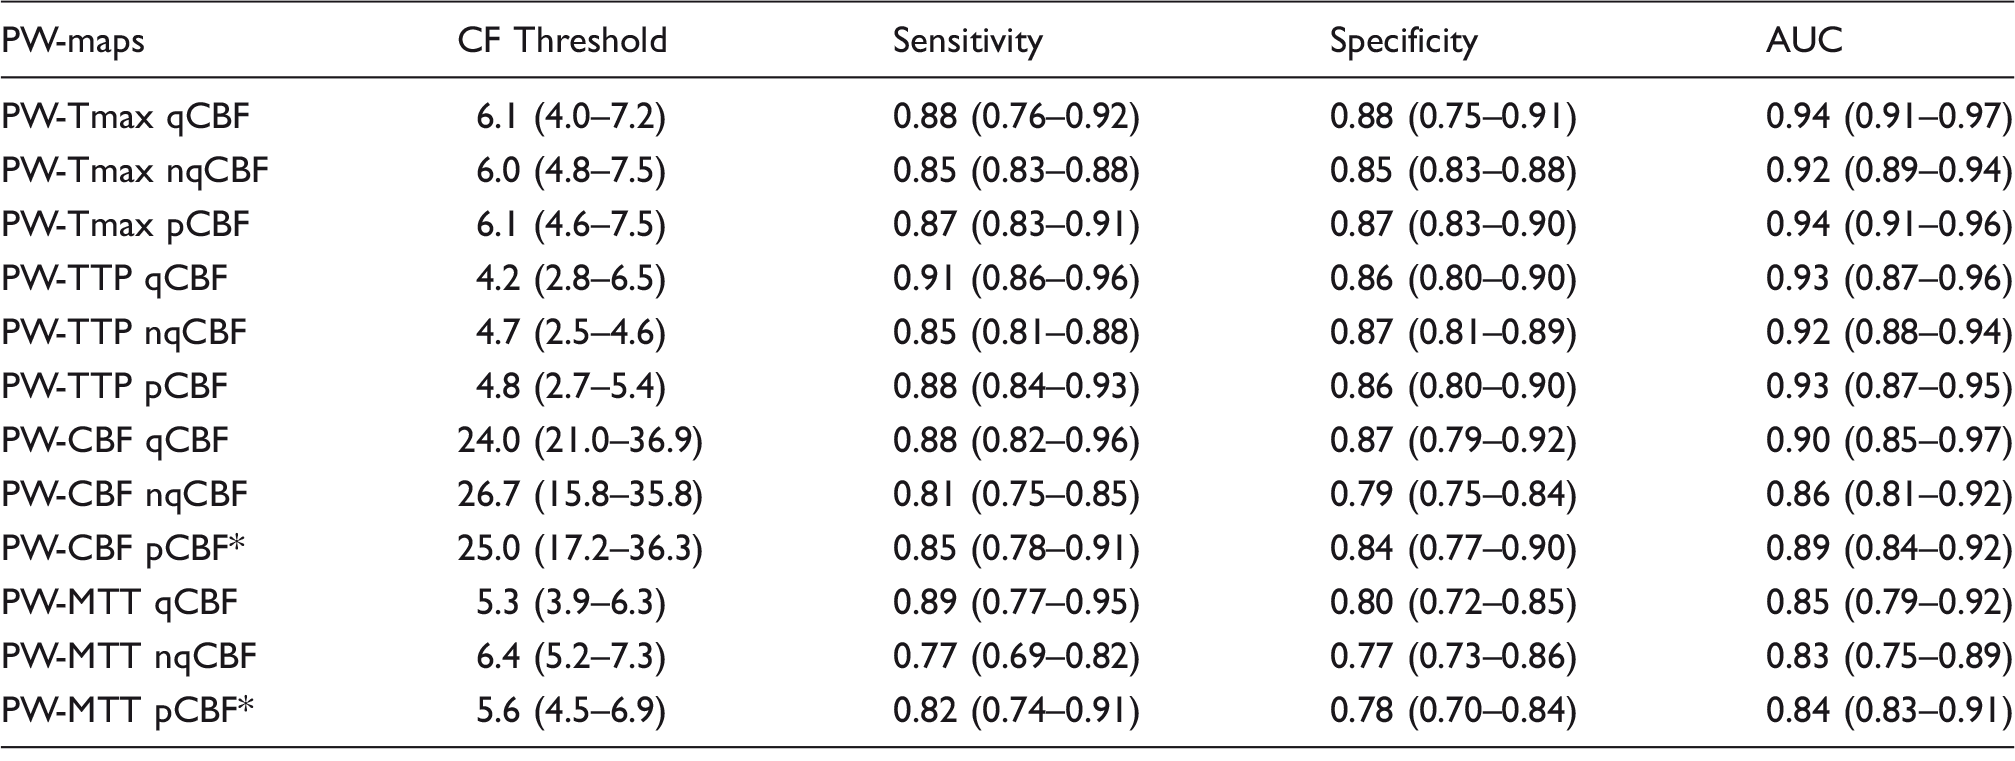
AUC: area under the curve; qCBF: quantitative cerebral blood flow (CBF) PET group; nqCBF: non-quantiative CBF PET group; pCBF: pooled CBF PET group; PW-CBF: cerebral blood flow; PW-Tmax: time to maximum; PW-MTT: mean transit time; PW-TTP: time to peak.
Significantly (p < 0.05) lower AUC values within pCBF group (Wilcoxon test).
Note: There is no significant difference between the qCBF and nqCBF PET groups (Mann–Whitney rank-sum test). Variation is given as interquartile range. Median values for both PET groups (qCBF-PET and nqCBF-PET) and the pooled PET-group values (pCBF-PET).
To accommodate the difference of both PET-CBF methods in CF threshold definition, we calculated the optimal PW-maps (AUC) and CF thresholds (ESST, sensitivity and specificity) separately for the qCBF PET group and the nqCBF PET group. Since we found no significant difference between the two groups, which further strengthened the validity of the nqCBF method, we pooled the data to obtain the optimal PW-maps and CF thresholds for the whole patient sample (n = 53).
We found the PW-map Tmax with a threshold of >6.1 s to be the most predictive in detecting the CF threshold as defined by PET-CBF <20 ml/100 g/min. Since the performance of Tmax also seems to be highly unaffected by deconvolution method or AIF variation, 13 the use of Tmax is highly desirable when it comes to MR mismatch definition. However, the simple non-deconvolved PW-map TTP >4.8 s does also provide a very good estimate of the CF threshold as defined by PET-CBF and its simple and quick calculation might be beneficial in acute stroke. The significantly better performance of time driven PW-maps Tmax and TTP (over e.g. MTT or CBV) may be explained by different calculation of the PW maps from deconvolved (e.g. Tmax, CBF, MTT, CBV) or non-deconvolved (e.g. TTP) tissue response curves. MTT and CBV map calculation relies, in contrast to Tmax or TTP, on the exact determination of the whole tissue response curve. In acute and subacute stroke, however, the tissue curve of the contrast bolus might be alterated by recirculation of the contrast agent, 22 by delay of bolus arrival 18 or, in deconvolved tissue response curves, by a distorted AIF through collateral flow and vessel occlusion. 22
These results further strengthen the results from smaller comparative PET – MR,8–10 comparative Xe-CT – MR 23 and MR studies. 24 Our results support the use of time-based PW-maps Tmax along with non-deconvolved TTP as the most predictive to discriminate benign oligemia from critically perfused tissue.
The definition of the “target” tissue at risk, based on Tmax >6 s, is used in the promising phase III clinical stroke study Extending the time for Thrombolysis in Emergency Neurological Deficits Trial (EXTEND) 25 and its European equivalent European Cooperative Acute Stroke Study-4: Extending the time for Thrombolysis in Emergency Neurological Deficits Trial (ECASS-4:ExTEND) 26 with the goal to establish the clinical benefit of reperfusion therapies in acute stroke beyond 4.5 h and in wake up strokes. A PW-MRI mismatch-based thrombectomy study in acute stroke used Tmax >6 s for tissue at risk detection Diffusion and Perfusion Imaging Evaluation for Understanding Stroke Evolution Trial 2 (DEFUSE-2). 27 However, this study had no controls and by definition could not proof a clinical benefit. Several previous studies have selected patients for i.v. thrombolysis based on PW/DWI mismatch (e.g. the Desmoteplase in Acute Stroke Trial 2 (DIAS-2), Diffusion and Perfusion Imaging Evaluation for Understanding Stroke Evolution Trial (DEFUSE) and Echo Planar Imaging Thrombolysis Evaluation Trial (EPITHET))28–30 but all of them failed to show a clinical benefit. As imaging selection criteria in stroke studies have often been used without previous validation in the past (e.g. visual assessment of mismatch in DIAS-2 and Tmax >2 s in DEFUSE and EPITHET), caution should be taken in concluding that MRI mismatch-based selection for acute stroke therapy (e.g. thrombolysis) is not clinically effective.
Several methodical issues have to be considered when interpreting our results. First, the method of CF definition with a normogram from nqCBF PET as described above can be applied to low flow areas in patients with ischemia when no arterial line can be obtained. However, the estimation of absolute CBF values from normalized nqCBF PET-maps is only valid for low CBF values (<80% of activity in the contralateral hemisphere) where linearity between qCBF and nqCBF PET values is preserved and confidence limits tight enough. 16 Second, the MRI-based mismatch concept is a surrogate of the PET-based penumbra concept. However, this study does not compare the penumbra as defined by PET (CBF, OEF and CMRO2) with the mismatch from MRI, but determines how well the PET-based CF threshold (<20 ml/100 g/min) can be matched by PWI-based thresholds. A comparative study with full O15 PET including CMRO2 would be desirable to further validate PWI-based penumbra detection. Third, part of this patient population was measured in subacute stroke beyond 24 h (n = 11). However, there was no significant difference of PW-map performance between stroke patients measured <24 h (median 7 h) and patients measured beyond 24 hours. These findings strengthen the usefulness of our results for clinical treatment decisions since only patients presenting >4.5 h after stroke onset or with unclear stroke onset would receive a mismatch-based therapy. Fourth, the use of small ROI’s in the ROC curve analysis might be superior to a voxel-based approach since the DSC PW echo-planar (EPI) images experience distortions which make coregistration on a voxel level difficult. Fifth, our results are not applicable to pure subcortical or small vessel strokes. However, our thresholds are in line with previous PET and MR-based validation studies.8,24 Sixth, since we wanted the sensitivity and specificity to be equal for optimal CF threshold definition, we used the ESST. However, other studies might present CF thresholds with different emphasis on sensitivity and specificity. Seventh, perfusion changes during consecutive PET and MR imaging were minimized by keeping the time between PET and MR as short as possible and by only including patients with stable clinical symptoms. Eighth, standardised imaging protocols and postprocessing routines should be used in the future to make results more comparable between centers.
In summary, we have further validated the use of the MRI mismatch concept with the largest comparative PET-MR cohort of acute and subacute stroke. We identified the optimal PW-maps and their optimal CF thresholds to detect “tissue at risk” and could strengthen the use of Tmax >6.1 s along with TTP >4.8 s as the most suitable to detect CF. This could further improve the treatment of patients who present beyond 4.5 h after stroke or with “wake-up” strokes.
Footnotes
Funding
The author(s) disclosed receipt of the following financial support for the research, authorship, and/or publication of this article: The research leading to these results has received funding from the W-D Heiss foundation and the Marga and Walter Boll foundation. This work has also been supported by the German Federal Ministry of Education and Research via the grant ‘‘Center for Stroke Research Berlin’’ (01EO 0801; ![]() ). The funders had no role in study design, data collection and analysis, decision to publish, or preparation of the manuscript.
). The funders had no role in study design, data collection and analysis, decision to publish, or preparation of the manuscript.
Acknowledgments
We express our gratitude to the members of the neurocritical care unit (Department of Neurology), to the staff of the MRI facility (Department of Neuroradiology) and especially to the staff oft the PET unit (Max-Planck-Institute for Neurological Research) for helpful cooperation in this multimodal imaging study.
Declaration of conflicting interests
The author(s) declared no potential conflicts of interest with respect to the research, authorship, and/or publication of this article.
Authors’ contributions
OZW, WDH, and JS conceived and designed the experiment; OZW, WMH, and JS carried out the experiments; OZW, DS, AK, and AS analyzed and interpreted the data; OZW drafted the manuscript; all authors revised the manuscript critically for important intellectual content and approved the final version.