
Abstract
Low brain tissue glucose levels after acute brain injury are associated with poor outcome. Whether enteral nutrition (EN) reliably increases cerebral glucose levels remains unclear. In this retrospective analysis of prospectively collected observational data, we investigate the effect of EN on brain metabolism in 17 poor-grade subarachnoid hemorrhage (SAH) patients undergoing cerebral microdialysis (CMD) monitoring. CMD-values were obtained hourly. A nutritional intervention was defined as the clinical routine administration of EN without supplemental parenteral nutrition. Sixty-three interventions were analyzed. The mean amount of EN per intervention was 472.4 ± 10.7 kcal. CMD-glucose levels significantly increased from 1.59 ± 0.13 mmol/l at baseline to a maximum of 2.03 ± 0.2 mmol/l after 5 h (p < 0.001), independently of insulin-treatment, baseline serum glucose, baseline brain metabolic distress (CMD-lactate-to-pyruvate-ratio (LPR) > 40) and the microdialysis probe location. The increase in CMD-glucose was directly dependent on the magnitude of increase of serum glucose levels (p = 0.007). No change in CMD-lactate, CMD-pyruvate, CMD-LPR, or CMD-glutamate (p > 0.4) was observed. Routine EN also increased CMD-glucose even if baseline concentrations were critically low ( < 0.7 mmol/l, neuroglucopenia; p < 0.001). These results may have treatment implications regarding glucose management of poor-grade aneurysmal SAH patients.
Keywords
Introduction
Glucose and oxygen are the main energy substrates for the brain. Cerebral microdialysis (CMD) allows measurement of interstitial brain glucose levels (CMD-glucose) in patients with severe brain injury. 1 Both, critically low and highly elevated CMD-glucose concentrations, were associated with poor outcome.2–4 A study assessing cerebral metabolism in anesthesized aneurysmal subarachnoid hemorrhage (SAH) patients reported CMD-glucose levels of 2.12 mmol/l in the white matter without radiologic evidence of cerebral ischemia, which is referred to as “normal CMD-glucose levels.” 5 There is insufficient data to define an optimal CMD-glucose range. Several factors influence CMD-glucose levels, including systemic glucose concentrations, 6 insulin, 7 cerebral perfusion pressure (CPP), and cerebral blood flow,2,8 temperature, 9 pharmacological anesthesia, 10 and cortical spreading depolarizations. 11 These associations may differ largely inter-individually and depend on disease-stage and severity.
In the recently published consensus document on CMD, experts suggest intervening in case of neuroglucopenia (pathologically low CMD-glucose), considering baseline serum glucose concentrations and the cerebral redox-state, reflected by the lactate-to-pyruvate-ratio (LPR). 1 These factors need to be taken into account due to the adverse impact of hyperglycemia on outcome and the lack of correlation between systemic and CMD-glucose levels reported in traumatic brain injury (TBI) patients with elevated LPR.12,13 Furthermore, it remains elusive whether such interventions are equally effective in the perilesional and normal-appearing brain tissue.
Besides interventions to decrease the cerebral metabolic rate and, therefore, elevating CMD-glucose levels, increasing systemic glucose levels may result in higher brain glucose concentrations. Candidates for such an intervention include modifying insulin treatment, intravenous glucose infusions, 1 or improving enteral feeding. 14 None of these interventions have been studied systematically and their effect on outcome is unclear.
Enteral nutrition (EN) is the preferred way of feeding ICU patients.15,16 In a microdialysis study, the first bolus of EN was associated with a significant increase of serum and CMD-glucose levels in SAH patients. 17 This association was not found in another study (including 50 SAH patients) using an insulin protocol to control systemic glucose levels. 18 It remains elusive, whether EN is an effective intervention to increase CMD-glucose levels in clinical routine. Recently, we reported the effect of EN on CMD-glucose levels in two patients with viral encephalitis developing episodes of neuroglucopenia. 14 In the current study, we investigated the effect of EN on brain metabolism in a cohort of poor-grade SAH patients.
Materials and methods
Patient selection and ethical approval
Data of 26 consecutive poor-grade SAH patients admitted to the neurological ICU at the Medical University of Innsbruck, Austria, between 2010 and 2012 requiring multimodal neuromonitoring were prospectively recorded. The conduct of this study was approved by the ethics committee of the Medical University of Innsbruck (AN3898 285/4.8, AM4091-292/4.6, UN3898 285/4.8), all provisions of the Helsinki Declaration were followed and informed consent was obtained from all patients according to Austrian law. Inclusion criteria were (a) spontaneous SAH, (b) age ≥ 18 years, and (c) simultaneously available microdialysis and nutrition data.
Grading and patient care
Disease severity was graded using the Hunt and Hess scale and the Acute Physiology and Chronic Health Evaluation II (APACHE II) score.19,20 Computed tomography (CT) was performed on admission, after aneurysm repair and when clinically needed. CT-scans were rated by an independent neuro-radiologist, blinded to clinical data, using the modified Fisher score, the SAH sum-score, and the intraventricular hemorrhage (IVH) sum-score,21,22 and were assessed for the presence of global cerebral edema (GCE). 23 Microdialysis probe location was defined as “perilesional” if the gold tip of the probe was within 1 cm to a focal CT-hypodensity (edema/infarction) or hyperdensity (hematoma), or otherwise as “normal-appearing tissue.”
Clinical care of SAH patients conforms to current guidelines.24,25 Ruptured aneurysms were secured by clipping or coiling. Intravenous fluids, vasopressors (noradrenalin, phenylephrine), and dobutamine were used for hemodynamic stabilization and to achieve CPP > 70 mmHg. 2 All patients were comatose and treated with continuous intravenous midazolam and sufentanil (alternatively s-ketamine) to facilitate mechanical ventilation. Patients were followed with transcranial color-coded duplex sonography and received prophylactic intravenous nimodipine. Delayed cerebral ischemia (DCI) was defined as either a new focal neurological impairment, a decrease of at least two points on the Glasgow Coma Scale, or a new infarct on CT or MRI, not attributable to other causes, especially not aneurysm treatment-related. 26 Functional outcome was assessed 3 months after the bleeding using the modified Rankin Scale (mRS).
Data collection and neuromonitoring
Patient characteristics, complications, and outcome were prospectively recorded in our institutional SAH-database. All continuously measured parameters were saved on a 3-min average interval in our patient data management system (Centricity™ Critical Care 7.0 SP2; GE Healthcare Information Technologies, Dornstadt, Germany) and aggregated over the microdialysis sampling time. Arterial blood glucose levels were measured approximately every 2 h using the ABL 800 FLEX blood gas analyzer (Drott Medizintechnik GmbH, Wiener Neudorf, Austria).
Based on clinical and imaging criteria, patients underwent monitoring of cerebral metabolism and intracranial pressure (ICP). A parenchymal probe (NEUROVENT-P-TEMP; Raumedic®, Helmbrechts, Germany) was inserted for the measurement of ICP, either through a frontal burr hole using a triple-lumen bolt, or together with the CMD-probe (71 High Cut-Off Brain Microdialysis Catheter, M Dialysis AB, Stockholm, Sweden), tunneled and placed in the white matter. Isotonic perfusion fluid (Perfusion Fluid CNS; M Dialysis AB, Stockholm, Sweden) was pumped through the microdialysis system at a flow rate of 0.3 μl/min. Hourly samples were analyzed with CMA 600 and Iscusflex (M Dialysis AB, Stockholm, Sweden) for CMD-glucose, CMD-pyruvate, CMD-lactate, and CMD-glutamate concentrations. At least 1 h passed after the insertion of the probe and the start of sampling.
Hyperglycemia was defined as serum glucose >200 mg/dl (11.1 mmol/l), metabolic distress as LPR > 40, mitochondrial dysfunction as LPR > 30 with pyruvate > 70 µmol/l, ischemia as LPR > 30 with pyruvate < 70 µmol/l and neuroglucopenia as CMD-glucose < 0.7 mmol/l.2,12,27,28
Nutrition and insulin protocol
Our nutrition protocol is derived from current European guidelines. 15 Early EN (within 24 h after aneurysm repair) via nasogastric tube is intended. Standard EN (1 kcal/ml) is initiated with a flow-rate of 20–25 ml/h and gradually increased to target 20–25 kilocalories per kilogram bodyweight per day (kcal/kg/d). Flow-rate is adapted to gastrointestinal tolerance and not increased if gastric residual volume, measured every 6 h, exceeds 250 ml. If 80% of calculated calories cannot be achieved by day 4, supplemental parenteral nutrition (PN; all-in-one emulsion of glucose, amino acids, and lipids) is considered.
Our insulin protocol aims at maintaining serum glucose levels between 110 and 150 mg/dl (6.1–8.3 mmol/l). When low CMD-glucose values are detected, a more liberal glucose regimen is initiated, allowing serum glucose levels up to 180 mg/dl (10 mmol/l). 14
Interventions
An intervention was defined as the start of EN after a period of more than 4 h without nutrition. The observation time included 2 h before EN-start and continued until 6 h after EN-start (standard time for administration of 500 kcal, i.e. one 500 ml packaging unit of our standard EN-product at that time (Isosource® Standard Neutral Smartflex®, Nestlé Austria, Vienna) in our unit). Mean values of the 2 h before EN were defined as baseline. Interventions were excluded if (a) there was no baseline or (b) only a baseline value available, (c) supplemental PN was added, or (d) the EN-goal of 80% of calculated calories was not achieved.
Statistical analysis
Continuous variables were assessed for normality and reported as mean ± standard error of mean (SEM) or median and interquartile range (IQR). Categorical variables are reported as count and proportions in each group. For the assessment of the impact of baseline glucose levels, groups were built using the median. To quantify the increase of serum and CMD-glucose levels, the delta was calculated by subtracting the baseline value from the highest concentration during the intervention. The highest concentration was chosen because, in the exploratory analysis, a significant increase of serum and brain glucose levels was observed after 3 h and peak concentrations after 5 h. Using the mean value of the entire intervention time would therefore have clearly underestimated the effect of EN on cerebral glucose levels. To investigate the relation between the change of serum and CMD-glucose, the delta serum glucose was divided into quartiles.
To account for repeated measurements within subjects and interventions, time-series data were analyzed utilizing a generalized linear model using a normal distribution and identity-link function and were extended by generalized estimating equations (GEEs) with an autoregressive process of the first order. All analyses were performed with IBM-SPSS V22.0 (SPSS Inc., Chicago, IL, USA). The significance level was set at a P-value of < 0.05.
Results
Baseline characteristics, grading, hospital complications, and clinical outcomes.
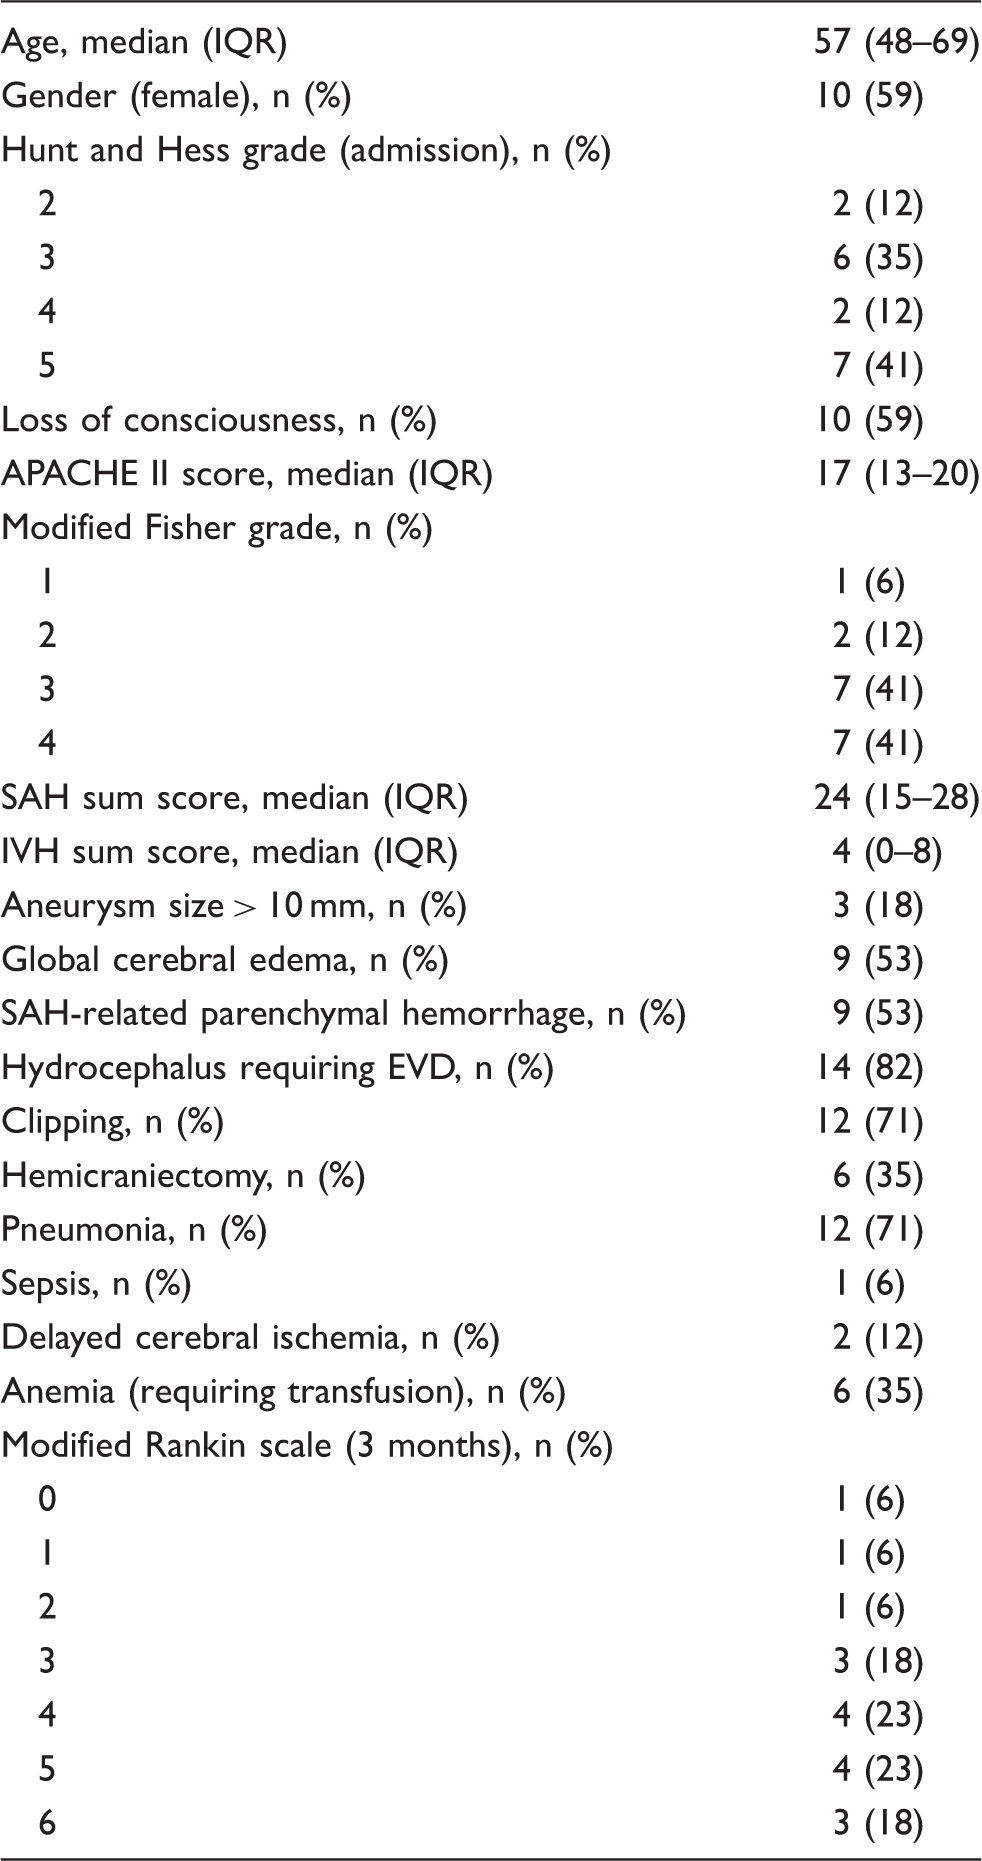
APACHE II: Acute Physiology and Chronic Health Evaluation II; SAH: subarachnoid hemorrhage; IVH: intraventricular hemorrhage.
Interventions, serum glucose, insulin
A mean EN-amount of 472.4 ± 10.7 kcal (1.15 ± 0.034 kcal/kg/h) was administered per intervention. There was no change in CPP (p = 0.55) or body temperature (p = 0.23) during interventions. Serum glucose levels significantly increased after 3–6 h (p < 0.001) compared to baseline (138.9 ± 3.9 mg/dl = 7.7 ± 0.22 mmol/l), with the maximum increase at 4 h (167 ± 8.6 mg/dl = 9.28 ± 0.48 mmol/l), as shown in Figure 1(a). Insulin was administered during 26 interventions (41%), the median dose was 1.8 (IQR 0.4–2.1) U/h with a significant increase during the observation time (p < 0.05). Higher insulin doses were given at higher serum glucose levels (p = 0.036).
Temporal profile of mean values of serum (a) and brain glucose levels (b–f) during the 6 h observation period after the start of enteral nutrition (EN); time point 0 depicts the respective baseline concentrations (mean of the 2 h preceding EN start). Error bars represent the standard error of mean, asterisks indicate that all values beneath (i.e. both curves) are significantly (p-value less than 0.05) increased compared to baseline. Significance was assessed using generalized estimating equations and all analyses were adjusted for cerebral perfusion pressure, body temperature, insulin dose, and microdialysis probe location (except (f)). LPR: lactate-to-pyruvate-ratio.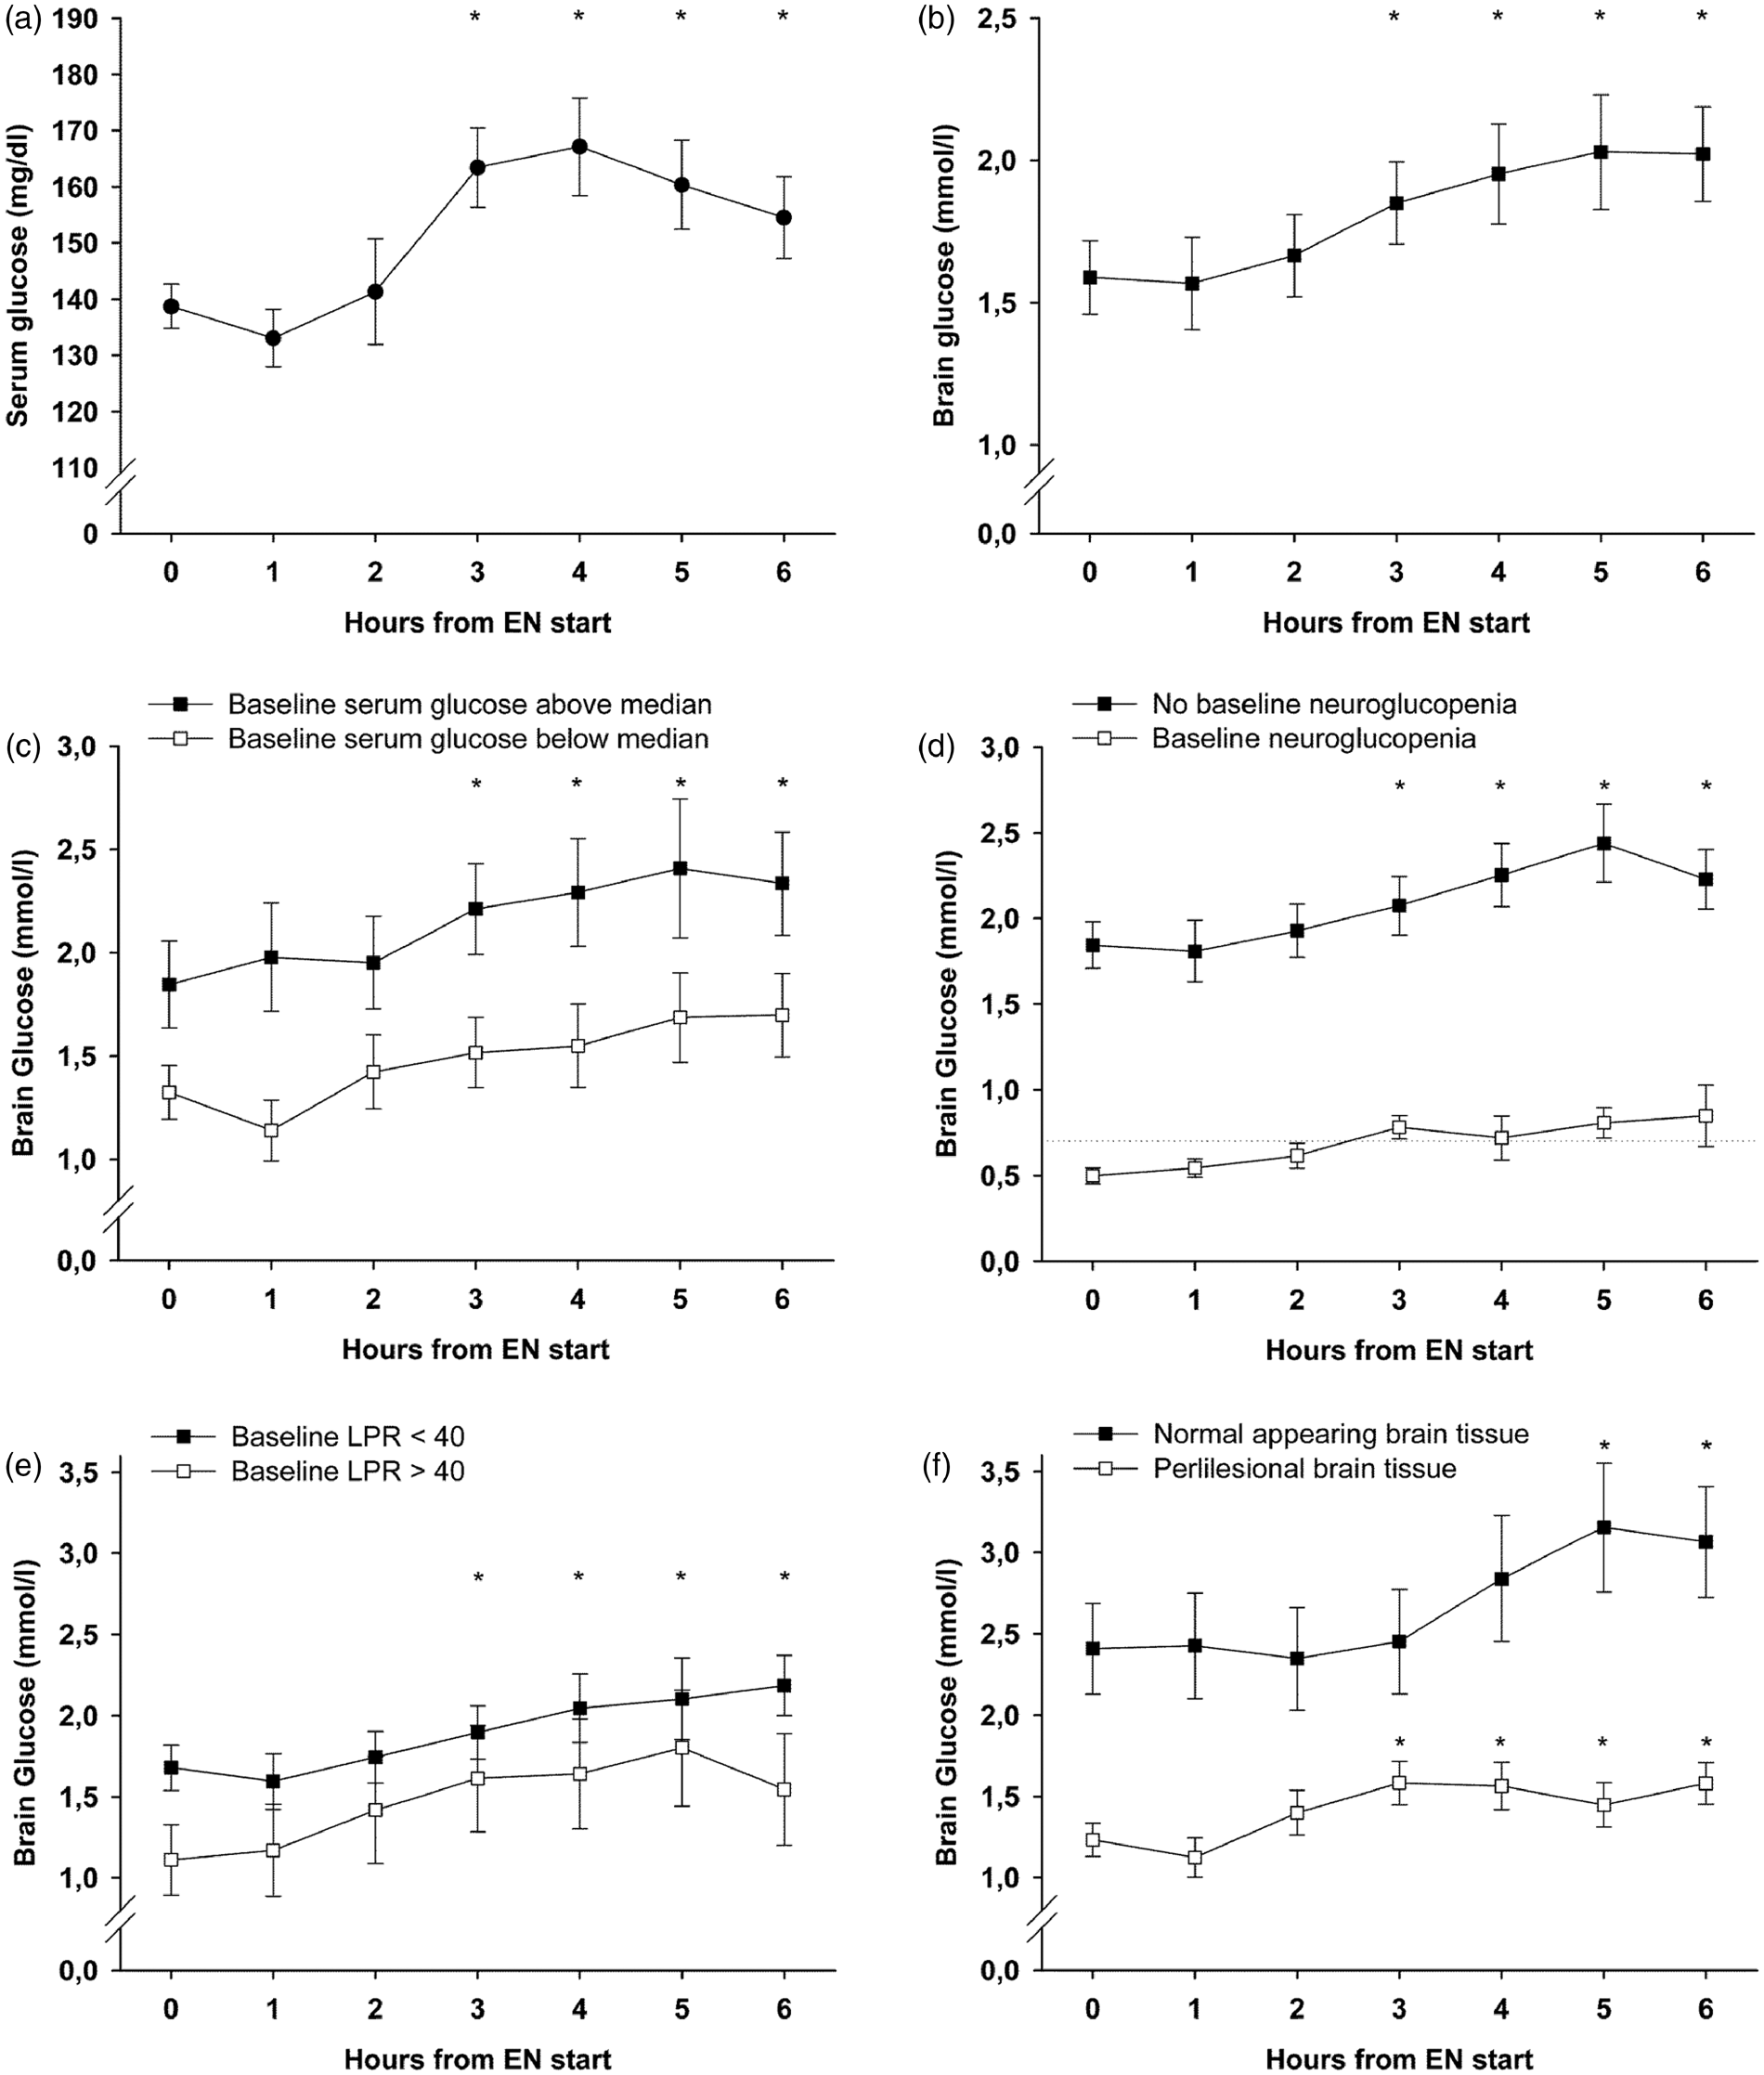
Brain metabolism
The mean baseline CMD-glucose concentration was 1.59 ± 0.13 mmol/l, which increased during the intervention to a maximum of 2.03 ± 0.2 mmol/l after 5 h (p < 0.001, Figure 1(b)). We found a strong influence of serum glucose concentrations on CMD-glucose levels (p < 0.001) and higher overall CMD-glucose levels in normal appearing brain tissue (p < 0.001). After adjusting for CPP, temperature, insulin-dose, probe location, and serum glucose levels, the increase in brain glucose during the intervention, as well as the association with serum glucose, remained significant (p = 0.004 and p = 0.002). The brain-to-serum glucose ratio at baseline was 0.21 and did not change over time (p = 0.29). There was also no change over time in CMD-lactate (baseline 4.9 ± 0.33 mmol/l, p = 0.42), CMD-pyruvate (baseline 144.3 ± 8.32 µmol/l, p = 0.44), CMD-LPR (baseline 35.9 ± 2.47, p = 0.51), or CMD-glutamate (p = 0.59). CMD-glucose levels increased during interventions with and without insulin-treatment (p = 0.012 and p < 0.001). Whether or not ketamine was used during the intervention did not influence baseline CMD-glucose levels (1.56 ± 0.15 mmol/l versus 1.70 ± 0.22 mmol/l, p = 0.8) and brain glucose levels increased under both conditions (p < 0.001 and p = 0.001).
Baseline metabolic profile and the effect of EN
Higher baseline serum glucose levels were associated with higher CMD-glucose levels during the observation period (p = 0.04). Brain glucose levels significantly increased independent of baseline serum glucose concentrations (p < 0.01, Figure 1(c)) and independent of baseline CMD-glucose levels (p < 0.01). In interventions with baseline neuroglucopenia (n = 12) CMD-glucose significantly increased from 0.5 ± 0.046 to 0.85 ± 0.18 mmol/l after 6 h (p < 0.001), with mean values remaining consistently above 0.7 mmol/l after 3 h, Figure 1(d). Baseline cerebral metabolic distress (n = 15, 24%) was associated with lower baseline CMD-glucose (p = 0.016), but did not influence the significant increase in CMD-glucose (p < 0.01) during EN (Figure 1(e)). Moreover, a significant increase in CMD-glucose was observed when the baseline metabolic profile indicated mitochondrial dysfunction (n = 26, 41%, p < 0.001). The median time-point of interventions was 10 days after the hemorrhage. CMD-glucose increased independently of whether EN was given before day 10 or thereafter (p < 0.01). All analyses were adjusted for CPP, body temperature, insulin-dose, and probe location.
Probe location
Probe location was classified as normal appearing tissue during 19 (30%) and as perilesional during 44 interventions (70%). Baseline CMD-glucose levels were 2.4 ± 0.29 and 1.23 ± 0.1 mmol/l, p = 0.017, in the normal and perilesional tissue, respectively. CMD-glucose levels increased significantly in normal appearing (p < 0.05) and perilesional brain tissue (p < 0.001, Figure 1(f)) and were significantly influenced by serum glucose levels (p = 0.005 and p < 0.001). Analyses were adjusted for CPP, temperature, and insulin-dose.
Delta brain glucose
Comparison of interventions associated with an above or below median increase (0.5 mmol/l) of brain glucose levels.
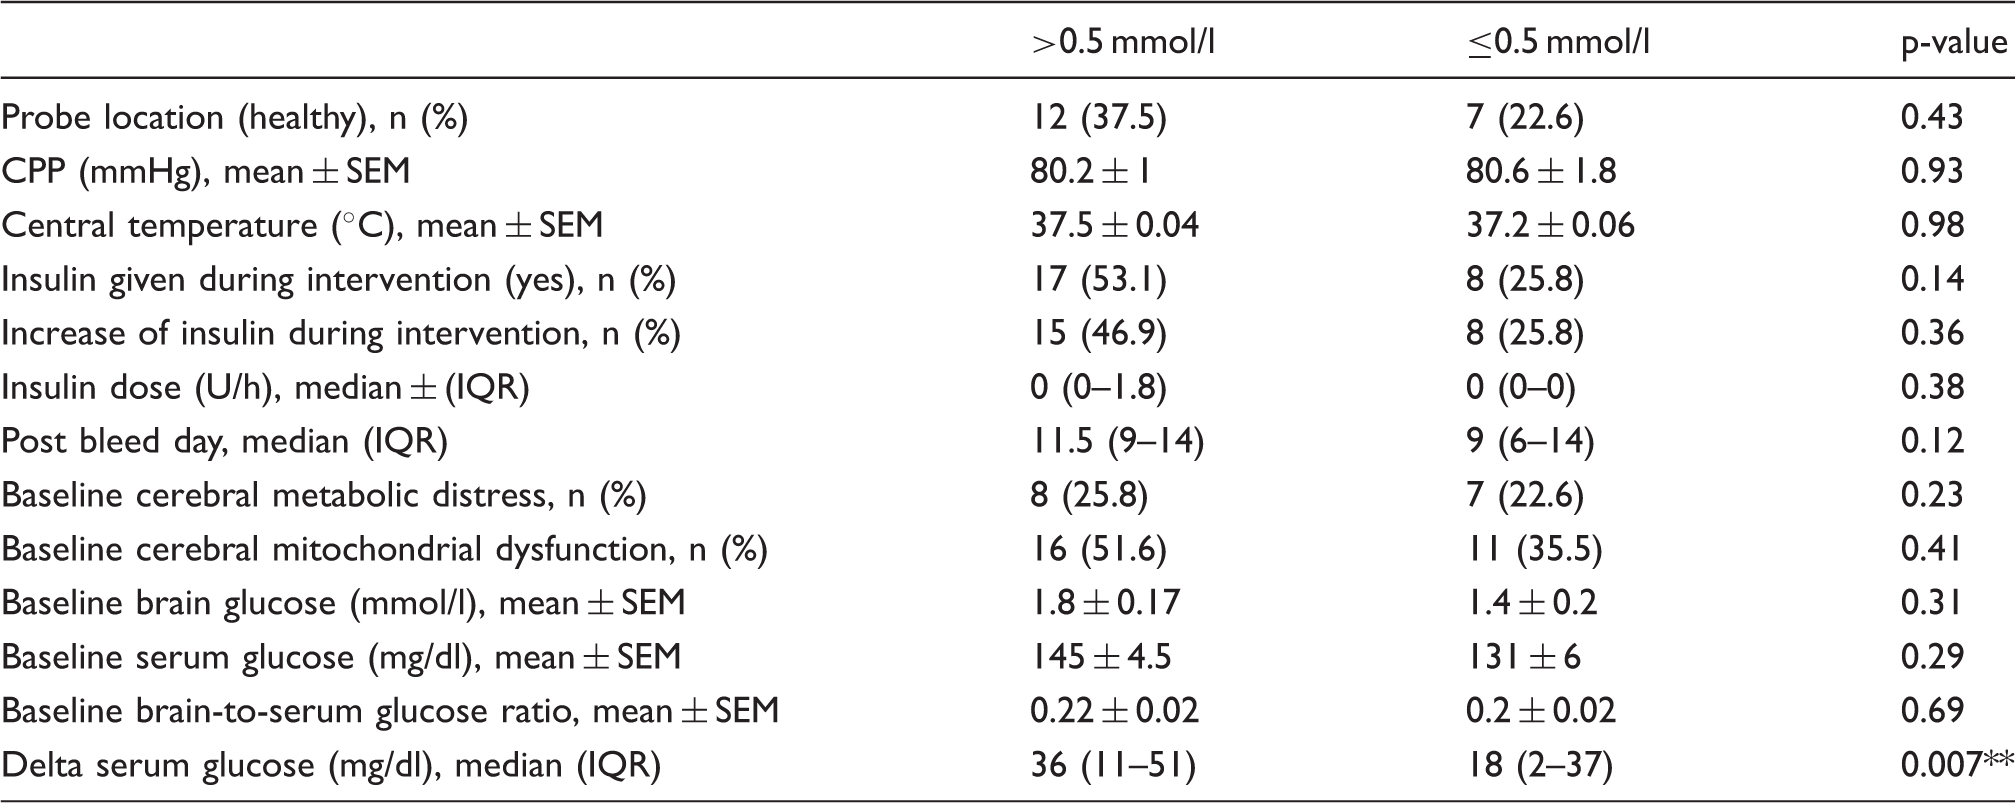
Asterisks indicate a significant association (**p < 0.01) adjusted for cerebral perfusion pressure, body temperature, insulin-dose, and microdialysis probe location.
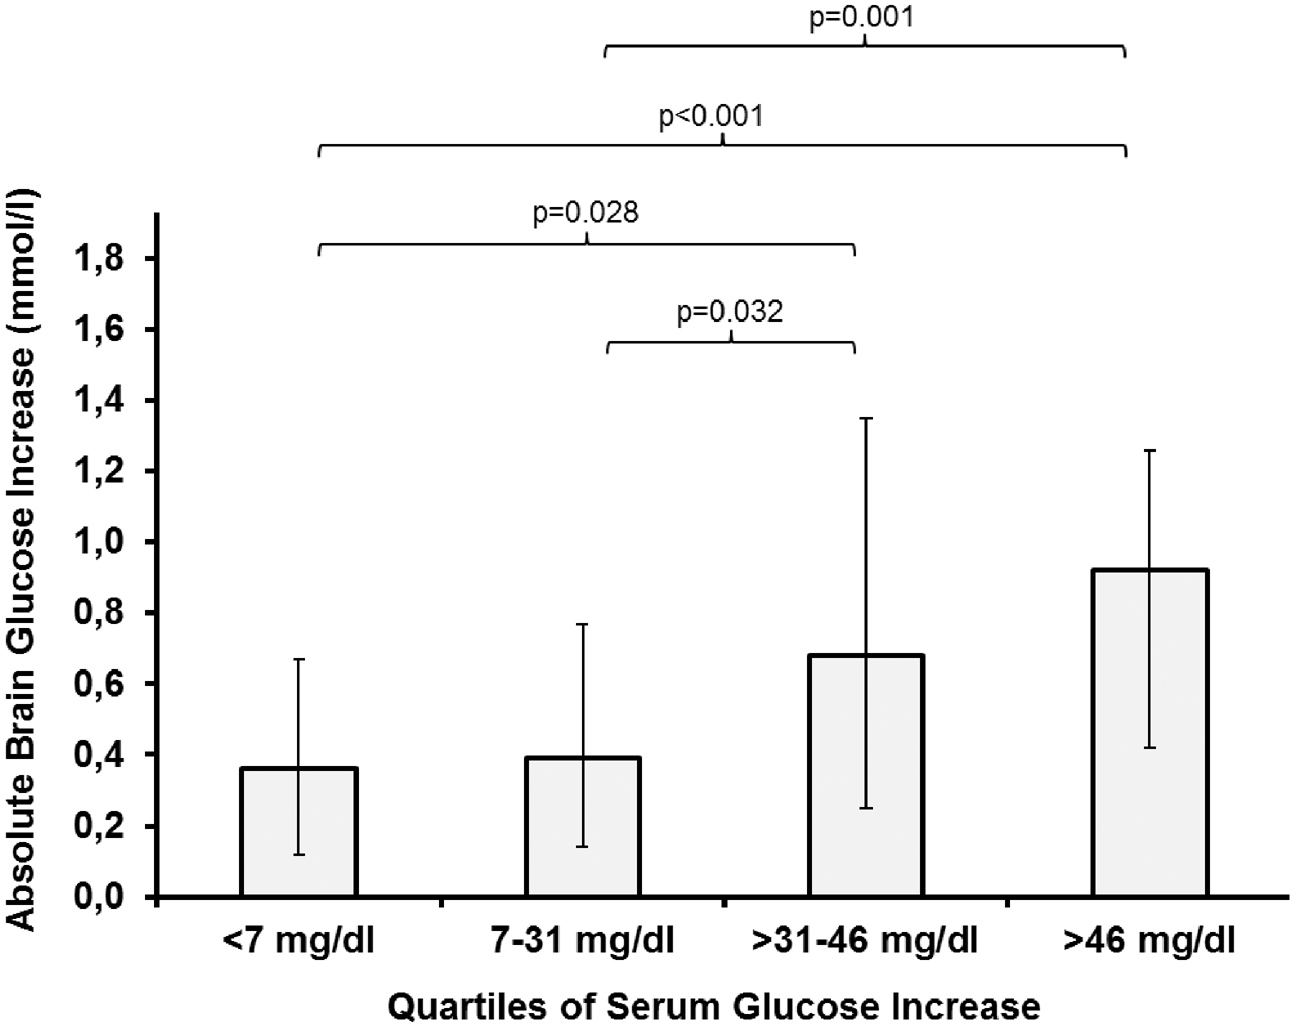
Median increase of brain glucose levels dependent on the quartiles of the delta increase of serum glucose levels. The delta was calculated by subtracting the baseline value from the highest value during an intervention. Error bars represent the interquartile range. Comparisons between groups were performed using generalized estimating equations. All analyses were adjusted for cerebral perfusion pressure, body temperature, insulin dose, and microdialysis probe location.
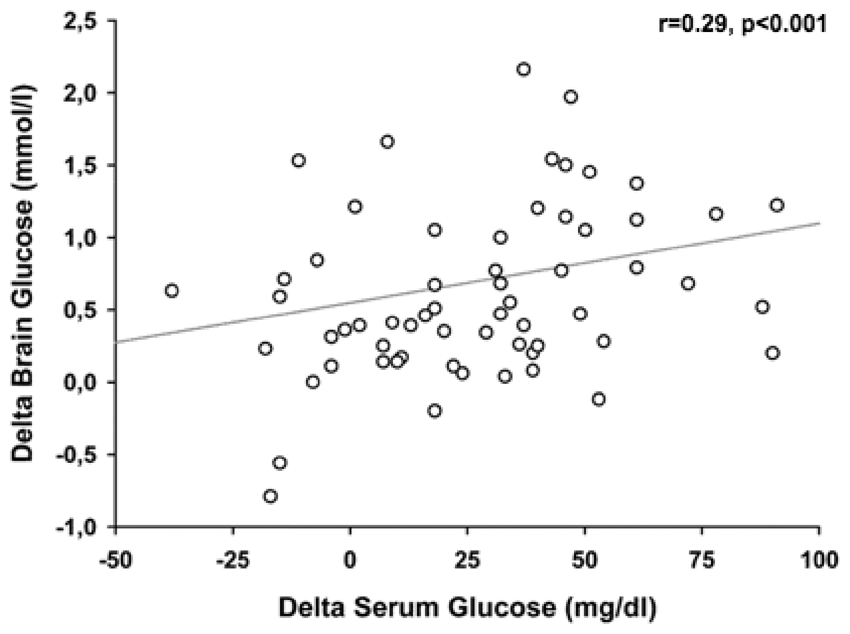
Relation between the delta of serum glucose (x-axis) and the delta of brain glucose levels (y-axis). Spearman’s rho (r) was used as correlation coefficient. The significance of the association was assessed in a generalized estimating equation to account for repeated measurements within subjects and adjusted for cerebral perfusion pressure, body temperature, insulin dose, and microdialysis probe location.
Discussion
Our results indicate that EN is associated with a significant increase in CMD-glucose levels, independent of the baseline brain metabolic profile and insulin administration. Although absolute values were lower and the magnitude of increase was smaller in the perilesional compared to normal appearing brain tissue, we observed significant changes in CMD-glucose in both groups. Our study also suggests that the extent of the increase in serum glucose levels, rather than absolute values, is the most important mechanism by which EN leads to the elevation of CMD-glucose.
Increasing brain glucose levels following EN in SAH patients were reported earlier. 17 However, these patients were not treated with insulin and only the first bolus of EN was analyzed, eventually limiting the clinical applicability of this intervention. In the current study, we analyzed repeated interventions with and without intravenous insulin-administration between days 3–22 and still observed an increase in CMD-glucose. This suggests that EN is an effective way of increasing brain glucose availability throughout the acute and subacute phase of SAH. In another study, no association between EN and CMD-glucose was found. 18 The administered EN-kcal were lower (0.442 kcal/kg/h) than in our patients (1.15 kcal/kg/h) and serum glucose was kept within a slightly lower range, 99–140 mg/dl (5.5–7.77 mmol/l). The authors also timely matched the administered EN with CMD-glucose levels, while we observed the significant increase in CMD-glucose not before 3 h after the start of the intervention.
We found that the effect of EN on CMD-glucose is strongly associated with the delta (increase) of serum glucose levels. The transport of glucose across the blood-brain-barrier (BBB) is accomplished by facilitated diffusion, 29 dependent on the concentration gradient. Our data indicate that this mechanism is not restricted to specific baseline serum glucose levels. Therefore, liberalizing the systemic glucose regimen (transiently allowing higher values) during EN may contribute to a more pronounced nutrition-related increase of CMD-glucose levels. Hyperglycemia > 200 mg/dl (11.1 mmol/l), which occurred more frequently when the delta serum glucose was > 46 mg/dl (2.55 mmol/l), should be avoided due to its association with poor outcome. 12 A serum glucose increase of 31–46 mg/dl (1.72–2.55 mmol/l) may therefore be a reasonable compromise between a pronounced brain glucose increase and a low rate (2%) of hyperglycemia.
The role of insulin regarding cerebral glucose levels is controversially discussed. While older studies describe an increased glucose permeability of the BBB secondary to insulin infusion and an increased net-uptake of glucose if blood sugar levels rise simultaneously, 29 CMD-studies found that insulin may reduce brain glucose levels independent of serum glucose.7,18 Our results indicate that insulin administration during EN does not hinder the increase of CMD-glucose as long as serum glucose levels increase.
The LPR represents the brain cellular redox-state. Elevated LPR is referred to as metabolic distress and can be interpreted as a marker of ischemia or mitochondrial dysfunction.1,28,30 In TBI patients, it was shown that glucose transport to the brain may be impaired when the cerebral LPR is elevated. 13 This led to the discussion if interventions targeting at higher CMD-glucose levels should even be attempted if the brain metabolic profile indicates metabolic distress. 1 Neither baseline LPR > 40 nor a metabolic pattern of mitochondrial dysfunction limited the increase of CMD-glucose in our study. This discrepancy may be due to different pathophysiologic mechanisms in glucose uptake between SAH and TBI patients, as different strengths of associations between systemic and cerebral glucose were described,6,31,32 or owing to the time frame of the analysis: the median time to observations in this previous study was 88 h after the injury, roughly the earliest possible time point for our interventions to be eligible.
The importance of probe location in the interpretation of CMD-values is best described in TBI patients. 33 In SAH patients, new brain lesions detected by CT are associated with reduced local cerebral blood flow. 34 Therefore, these areas may be less susceptible to systemic interventions. In TBI patients, episodes of profound hyperglycemia > 270 mg/dl (15 mmol/l), but not of “moderate” hyperglycemia 216–270 mg/dl (12–15 mmol/l) were associated with a significant increase in CMD-glucose in focal brain lesions. 32 Our results indicate that, although absolute glucose levels were lower in perilesional brain tissue, CMD-glucose significantly increases following EN even close to focal lesions in SAH patients.
Neuroglucopenia is associated with unfavorable outcome in SAH patients.2,3 We observed a significant increase in CMD-glucose during interventions with baseline levels below 0.7 mmol/l (and also below 1 mmol/l, data not shown). Moreover, after 3 h, mean values of CMD-glucose remained above this critical threshold. Therefore, EN may be considered as intervention in future studies aiming at an increase of pathologically low cerebral glucose levels.
Several limitations of this study need to be considered. As our nutrition protocol includes supplemental PN, we had to exclude a substantial amount of interventions to exclusively study the effects of EN, leading to a rather small sample size. This also explains the low rate of DCI in this cohort, while the frequency in screened patients was 6 of 26 (23%). On the other hand, by choosing these strict criteria, we identified a very homogenous set of interventions, reducing a potential bias by a large variability of administered calories. CMD depicts the metabolic profile of only a small area of the brain; therefore, we cannot conclude that the observed changes also occur in remote brain regions. However, all analyses were adjusted for probe location and CMD-catheters were placed in different vascular territories. Although all data were prospectively collected, this is a retrospective analysis and causal relations can only be hypothesized. Nevertheless, as we defined EN-start as the beginning of an intervention, it is plausible that changes occurring during the consecutive hours are related to EN. We decided against reporting our findings over a longer period than 6 h, as we found a large heterogeneity of nutrition procedures after this time frame, which would have limited the significance of our results. It is necessary to note that, apart from increasing CMD-glucose levels, we did not observe an alteration of other brain metabolic parameters. Increased glucose availability may therefore not necessarily transfer into increased neuronal glucose metabolism. The baseline levels of lactate, pyruvate, and LPR were already elevated at the start of the intervention, which may already represent a baseline metabolic state of hyperglycolysis. Therefore, pathophysiologic pathways that lead to glucose breakdown into pyruvate or lactate may already be upregulated. Importantly, we did not observe an isolated increase of lactate or the LPR, which would mean an enhancement of anaerobic glycolysis. Still, our analysis is limited to the observation time of 6 h, making a change after the observation period possible. However, we cannot conclude that increasing brain glucose levels may favorably impact on the clinical course of SAH patients.
Conclusion
EN is associated with an increase of CMD-glucose levels in poor-grade SAH patients. This increase occurred independent of insulin treatment, baseline serum glucose levels, probe location, and evidence of metabolic distress. Neuroglucopenia was corrected by EN. Adequate enteral feeding and simultaneously allowing a transient elevation of serum glucose concentrations may be used as intervention in future trials targeting at an increase of CMD-glucose levels.
Footnotes
Authors’ note
The datasets analyzed during the current study are available from the corresponding author on reasonable request.
Funding
The author(s) disclosed receipt of the following financial support for the research, authorship, and/or publication of this article: This study has received funding from the Austrian Science Fund (FWF) under the project no. KLI375 to RB. The funding body did not participate in the design of the study, collection, analysis, and interpretation of data or in writing the manuscript.
Declaration of conflicting interests
The author(s) declared no potential conflicts of interest with respect to the research, authorship, and/or publication of this article.
Authors’ contributions
MK was involved in study idea and design, interpretation and analysis of data, wrote and drafted the manuscript and approved the final version. RH was involved in study design, acquiring, interpreting, and analyzing data, wrote and drafted the manuscript and approved the final version. AS, RB, MG, PR, BP, CT, and ES were involved in study design, acquiring, and interpreting data, drafted the manuscript and approved the final version. JS was involved in study idea and design, interpretation of data and drafted the manuscript and approved the final version.