
Abstract
13C magnetic resonance spectroscopy (MRS) combined with the administration of 13C labeled substrates uniquely allows to measure metabolic fluxes
INTRODUCTION
Mice have been widely used for genetic modification to investigate the pathology of respective human diseases. The use of
13
C MRS studies on transgenic mouse models may provide unique insights into the pathologies of various brain diseases. For instance, the pathogenesis of Huntington's disease may involve the impairment of glutamate-glutamine cycling
4
assessed uniquely by
13
C MRS.
In addition, a time-resolved isotopic enrichment of plasma glucose is typically required as an input function to derive metabolic fluxes from 13 C labeled time courses using a given metabolic model in a 13 C labeled glucose infusion study. However, frequent blood sampling in small animals such as mouse during 13 C NMR experiment is hardly feasible due to the small blood volume of the mouse and rather big dead volume in the catheter from the center of the magnet to the entrance of the magnet bore.
Relative to direct 13 C MRS techniques, indirect detection of 13 C through 1 H combined with [1,6- 13 C2] or [U- 13 C6] glucose administration can improve the sensitivity and allow the direct measurement of fractional enrichments (FEs). However, the distinct separation of 13 C labeling in Glu and Gln using indirect detection requires sufficiently high spectral resolution. 10 Recently, a short-echo-time (TE) full-sensitivity 1 H-[ 13 C] NMR sequence was proposed and validated at a high magnetic field strength of 14.1 T, which provides high spectral resolution and signal sensitivity. 11
Therefore, the aim of the present study was to use the short-TE full-sensitivity
1
H-[
13
C] MRS
11
combined with high magnetic field (i.e., 14.1 T) and infusion of [U-
13
C6] glucose to measure the time-resolved
13
C labeling of individual metabolites with a focus on glutamate and glutamine, to assess metabolic fluxes
MATERIALS AND METHODS
Animal Preparation
Male ICR-CD mice (33.4 ± 3.7 g,
In Vivo NMR Spectroscopy
Magnetic resonance spectroscopy experiments were performed in a 14.1 T magnet with a 26 cm horizontal bore (Agilent Technologies, Palo Alto, CA, USA) using a homebuilt geometrically decoupled
1
H quadrature surface coil (13 mm diameter) and a linearly polarized
13
C coil (10 mm diameter) as a transceiver. Images for voxel positioning were obtained using a multislice fast spin-echo sequence in sagittal and coronal planes (effective TE = 54 ms, repetition time = 4,000 ms, echo train length = 8, average = 4, slice thickness = 0.6 mm, slices = 25, field of view = 20 × 20 mm2, data matrix = 256 × 256).
13
C decoupled
1
H MR spectra were acquired using a previously proposed full signal intensity 1H-[
13
C] NMR sequence ‘SPECIAL-BISEP’ (Supplementary Figure S1),
11
which was a hybrid sequence composed of SPECIAL (SPin ECho, full Intensity Acquired Localized spectroscopy) localization part
16
and a preceding
13
C editing block based on the inversion B1-insensitive spectral editing pulse (BISEP), including a segmented 0o BIR-4 pulse with two pulse interval delays (
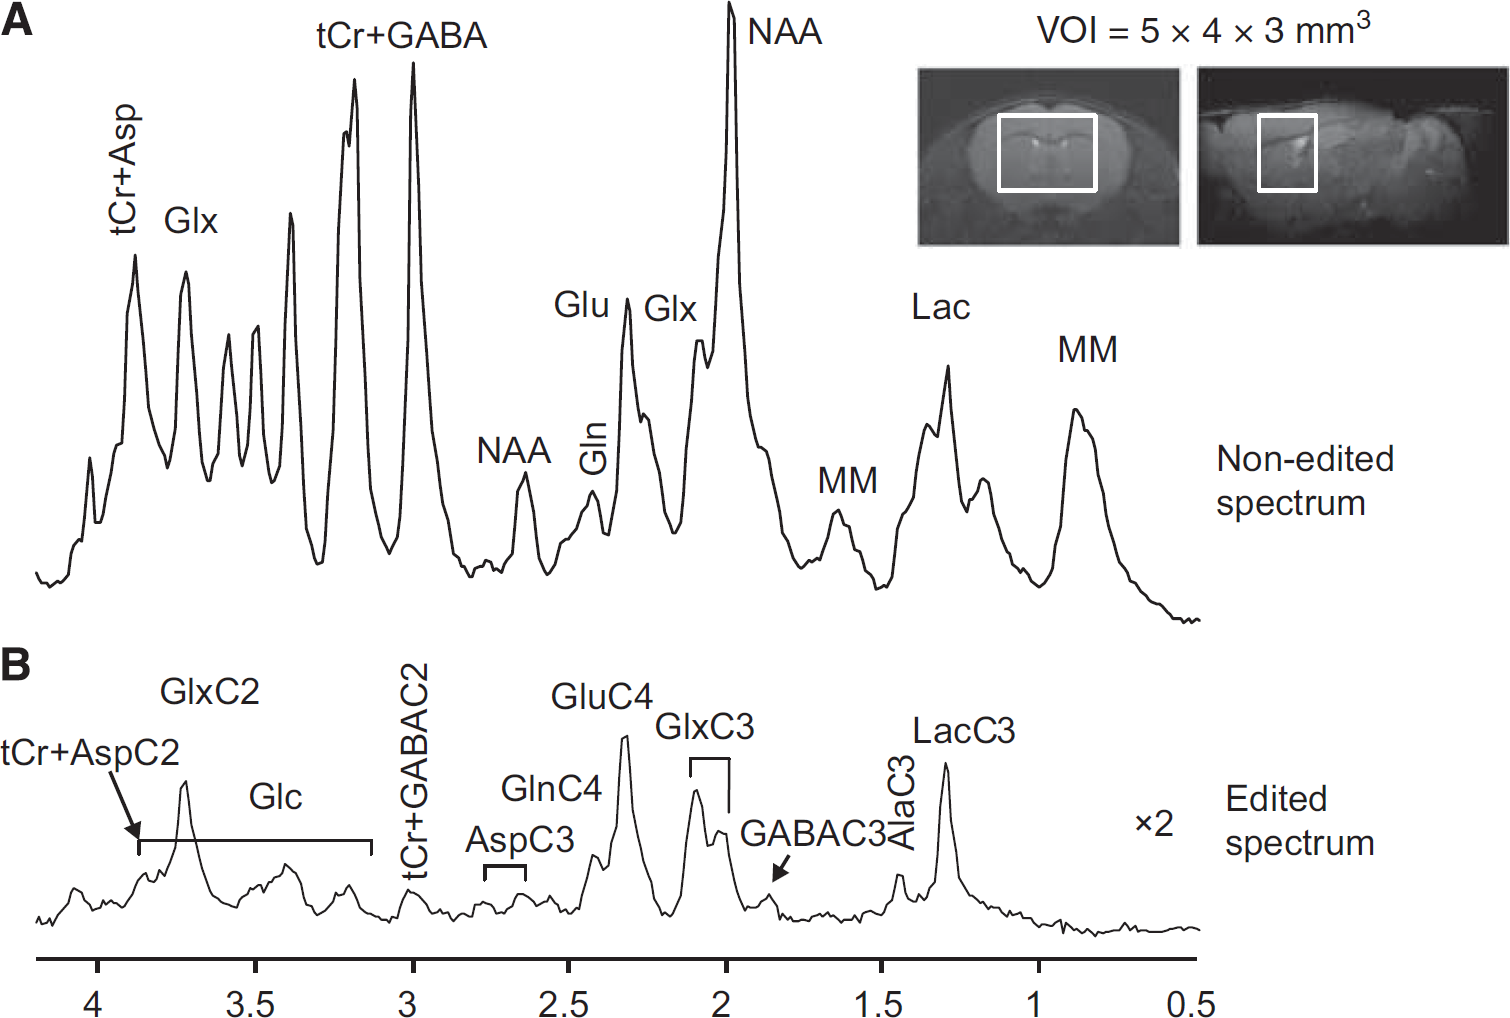
Representative coronal and sagittal fast spin-echo images of the mouse brain with the volume of interest (VOI) for magnetic resonance spectroscopy (MRS) measurement. Averaged nonedited (
Data Analysis
After Fourier transformation and frequency correction, every four blocks (64 averages) of spectra were summed and quantified with LCModel (Stephen Provencher Inc., Oakville, ON, Canada).
21
Nonedited
1
H spectra acquired with
13
C AFP off, which contain
1
H resonances coupled to both
13
C and
12
C nuclei, were quantified with a standard
1
H MRS basis set containing a measured macromolecular baseline
22
and simulated metabolite spectra.
23
Another basis set including simulated metabolite spectra of
1
H resonances coupled to
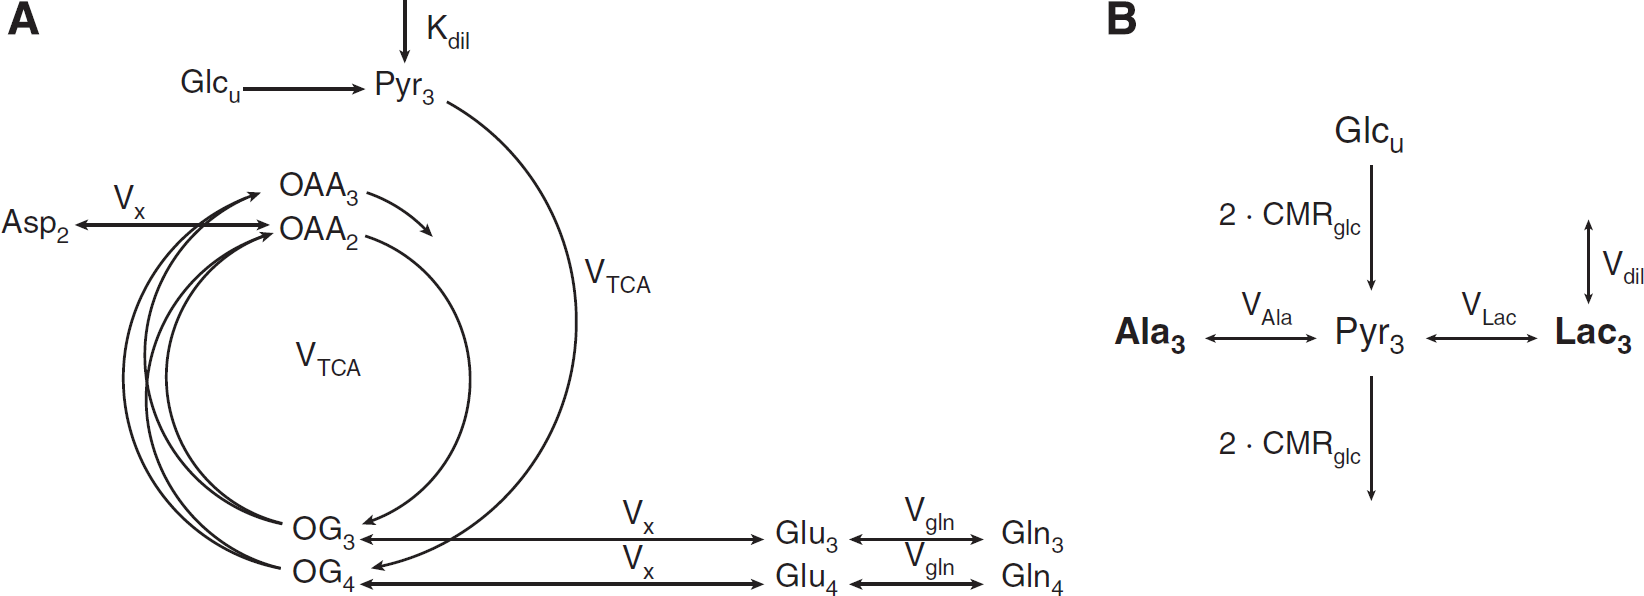
Metabolic Modeling
In the metabolic reaction chain of glucose utilization in brain tissue, pyruvate (Pyr) is the last intermediate of the glycolysis and is not only a precursor for oxidative metabolism in the tricarboxylic acid (TCA) cycle, but also of lactate and alanine. Given the strong activity of lactate dehydrogenase allowing fast exchange between pyruvate and lactate as compared with the TCA cycle rate,25,26 the
13
C turnover of LacC3 closely follows that of PyrC3 in terms of
13
C FE. On the time scale of the
13
C turnover of the amino acids labeled through the TCA cycle, the FE of LacC3 can therefore be used as an input function of the metabolic system, as a substitute to the nonmeasurable pool of pyruvate. The LacC3 turnover curve was thus smoothed by being fitted with an exponential function FE(
(
In a second step, the ratio of lactate conversion rate
The equations describing the mathematical modeling approaches used in this study are reported in appendix, as Supplementary information.
RESULTS
Nonedited (Figure 2A) and edited 1 H MR spectra (Figure 2B) acquired from the volume of interest of 60 μL in the mouse brain using SPECIAL-BISEP show good spectral quality at 14.1 T in this study, such as high spectral resolution, e.g., the separation of GluC4 and GlnC4, and the absence of contamination signal from extraneous lipids, which allows the measurement of lactate and alanine. In the 13 C edited spectra, 13 C labeled 1 H resonances in the mouse brain can be observed in LacC3, AlaC3, GluC4, GlnC4, GlxC3, GlxC2(GluC2+GlnC2), AspC3, AspC2, GABAC3, GABAC2, and Glc(C2-C6) (Figure 2B).
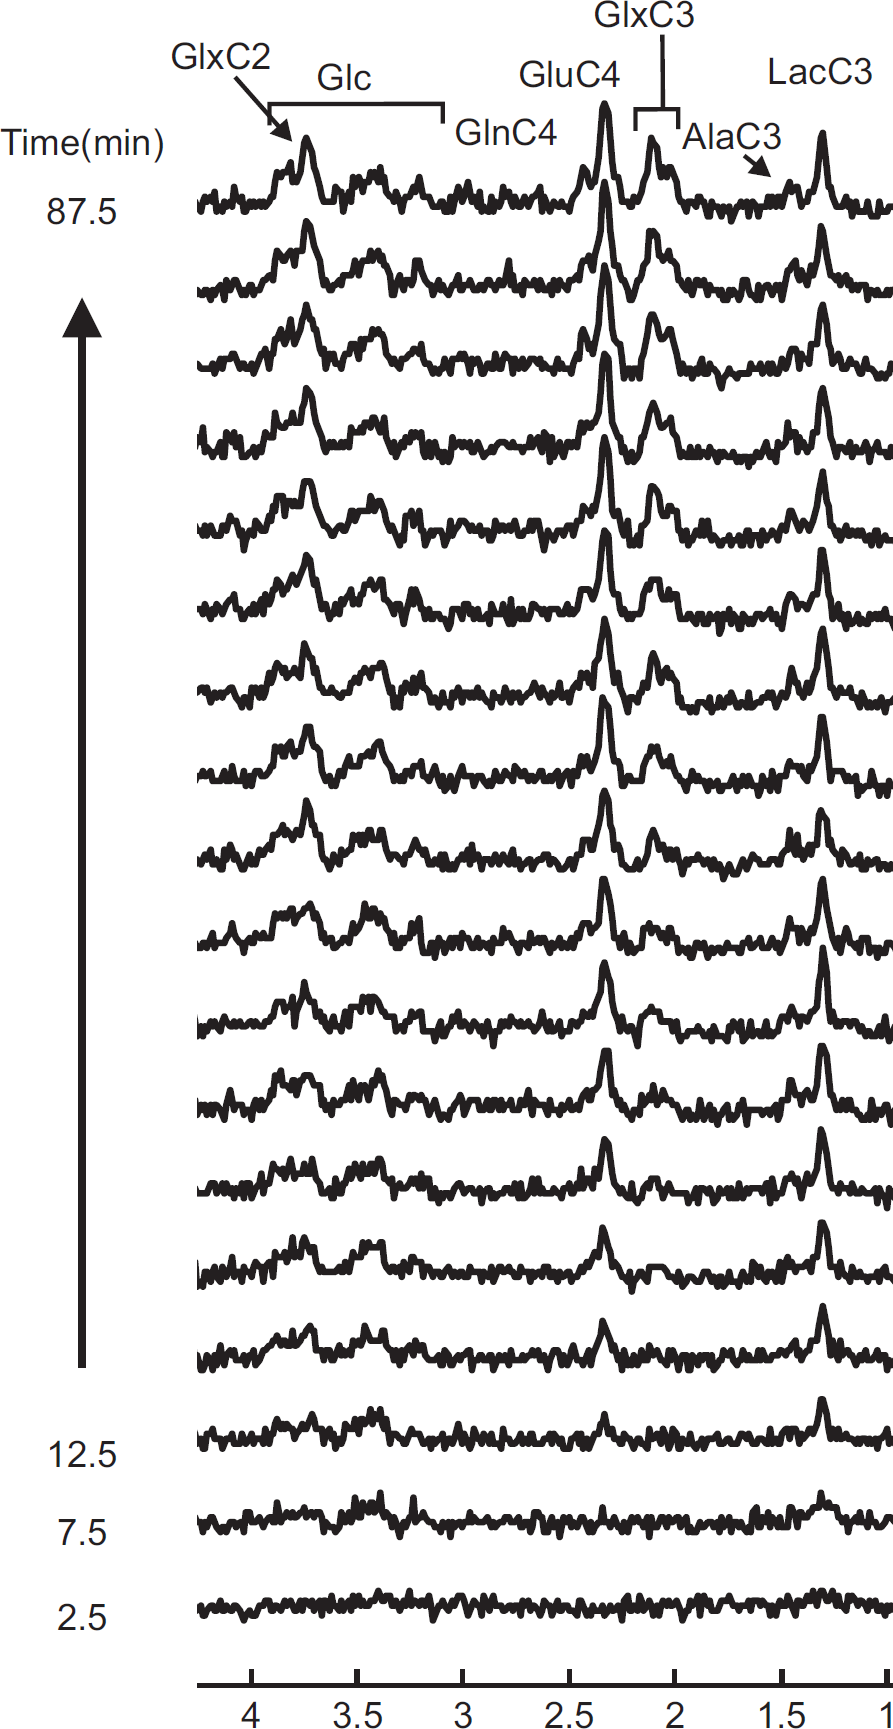
To show the dynamic incorporation of 13 C label into individual carbon positions of metabolites, edited spectra containing 13 C-coupled 1 H resonances were summed over 5 minutes for 90 minutes after the start of [U- 13 C6] glucose infusion (Figure 3). Note that 13 C labeling into Glc and Lac can already be observed during the second 5-minute acquisition after the start of infusion. Subsequently, carbon positions of Ala, Glu, Gln and GABA were labeled, respectively (Figure 3).
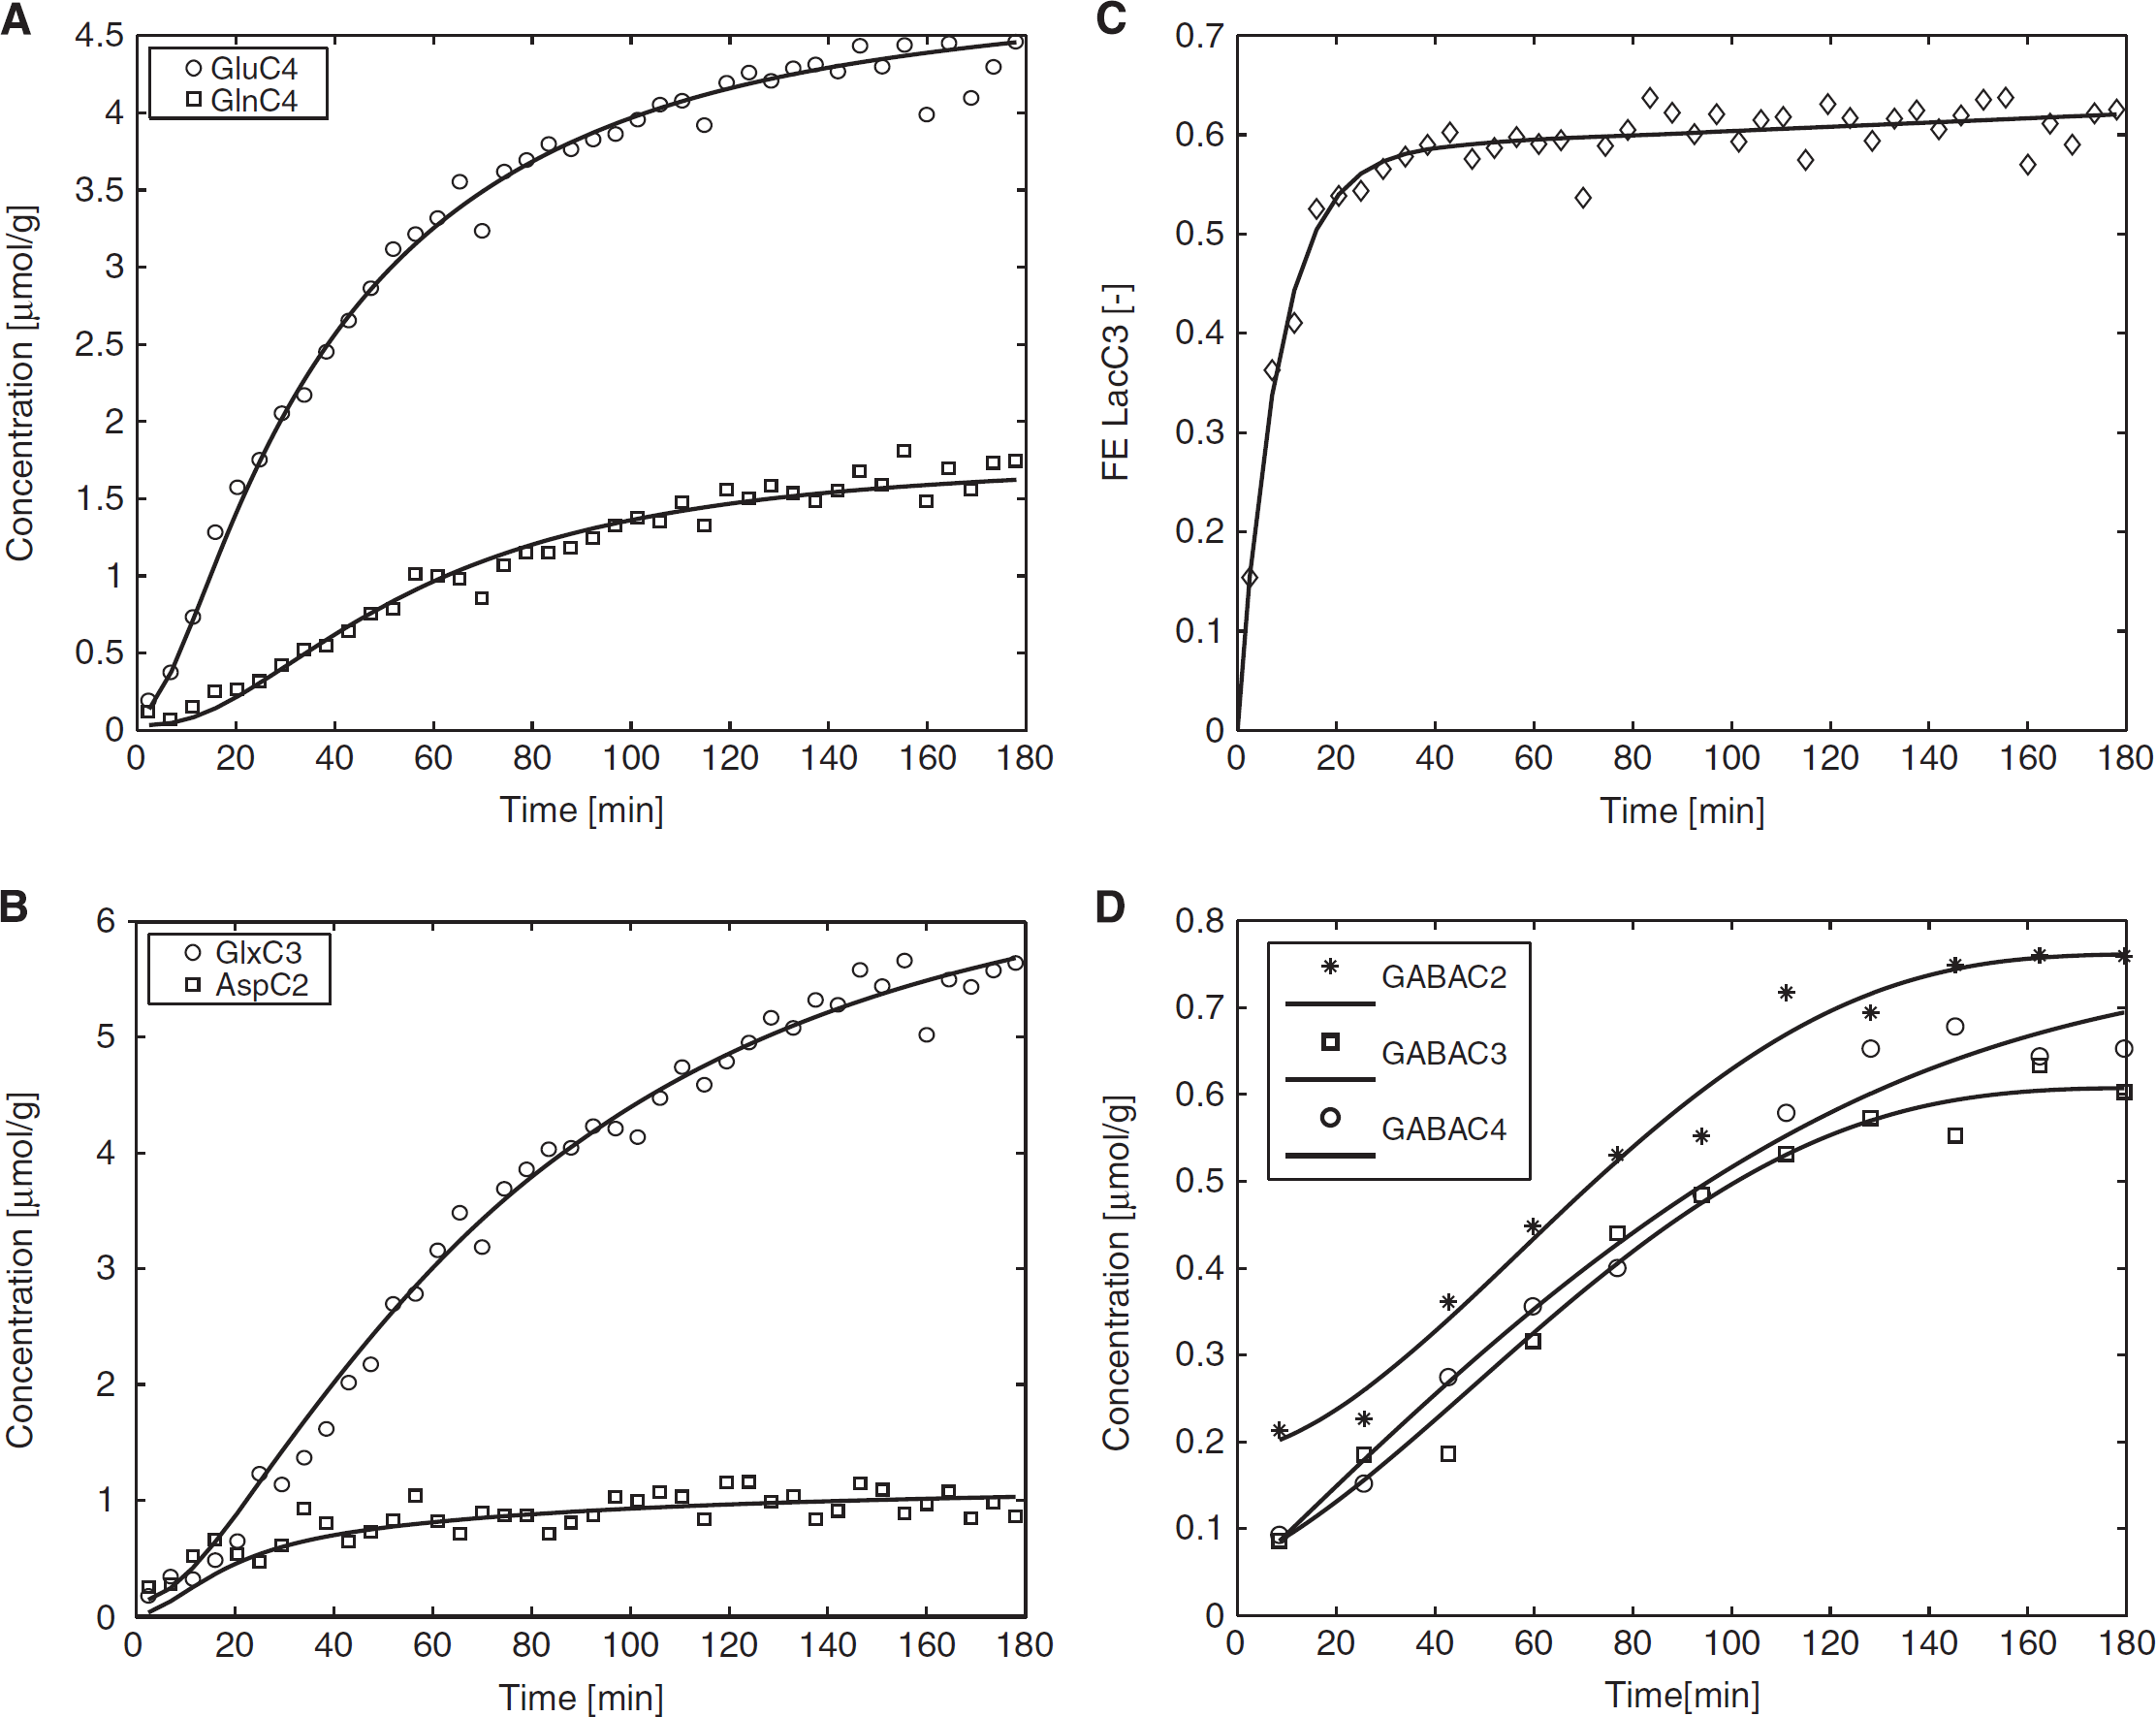
To determine the total concentration of metabolites ( 13 C+ 12 C) and the concentrations of 13 C labeled metabolites, nonedited and edited 1 H spectra were analyzed using LCModel. The pool sizes of glutamate (9.1 ± 0.5 μmol/g, mean ± s.e.m.), glutamine (3.4 ± 0.1 μmol/g), and aspartate (2.1 ± 0.2 μmol/g) were measured simultaneously from the nonedited 1 H spectra. The average time courses of 13 C labeled GluC4, GlnC4, GlxC3, AspC2 and GABA(C2, C3, and C4) concentration were obtained from the edited spectra with a temporal resolution of 4.3 minutes during 180-minute infusion of [U- 13 C6] glucose (Figure 4).
Average time courses of (
To determine the TCA cycle flux (
Metabolic fluxes (
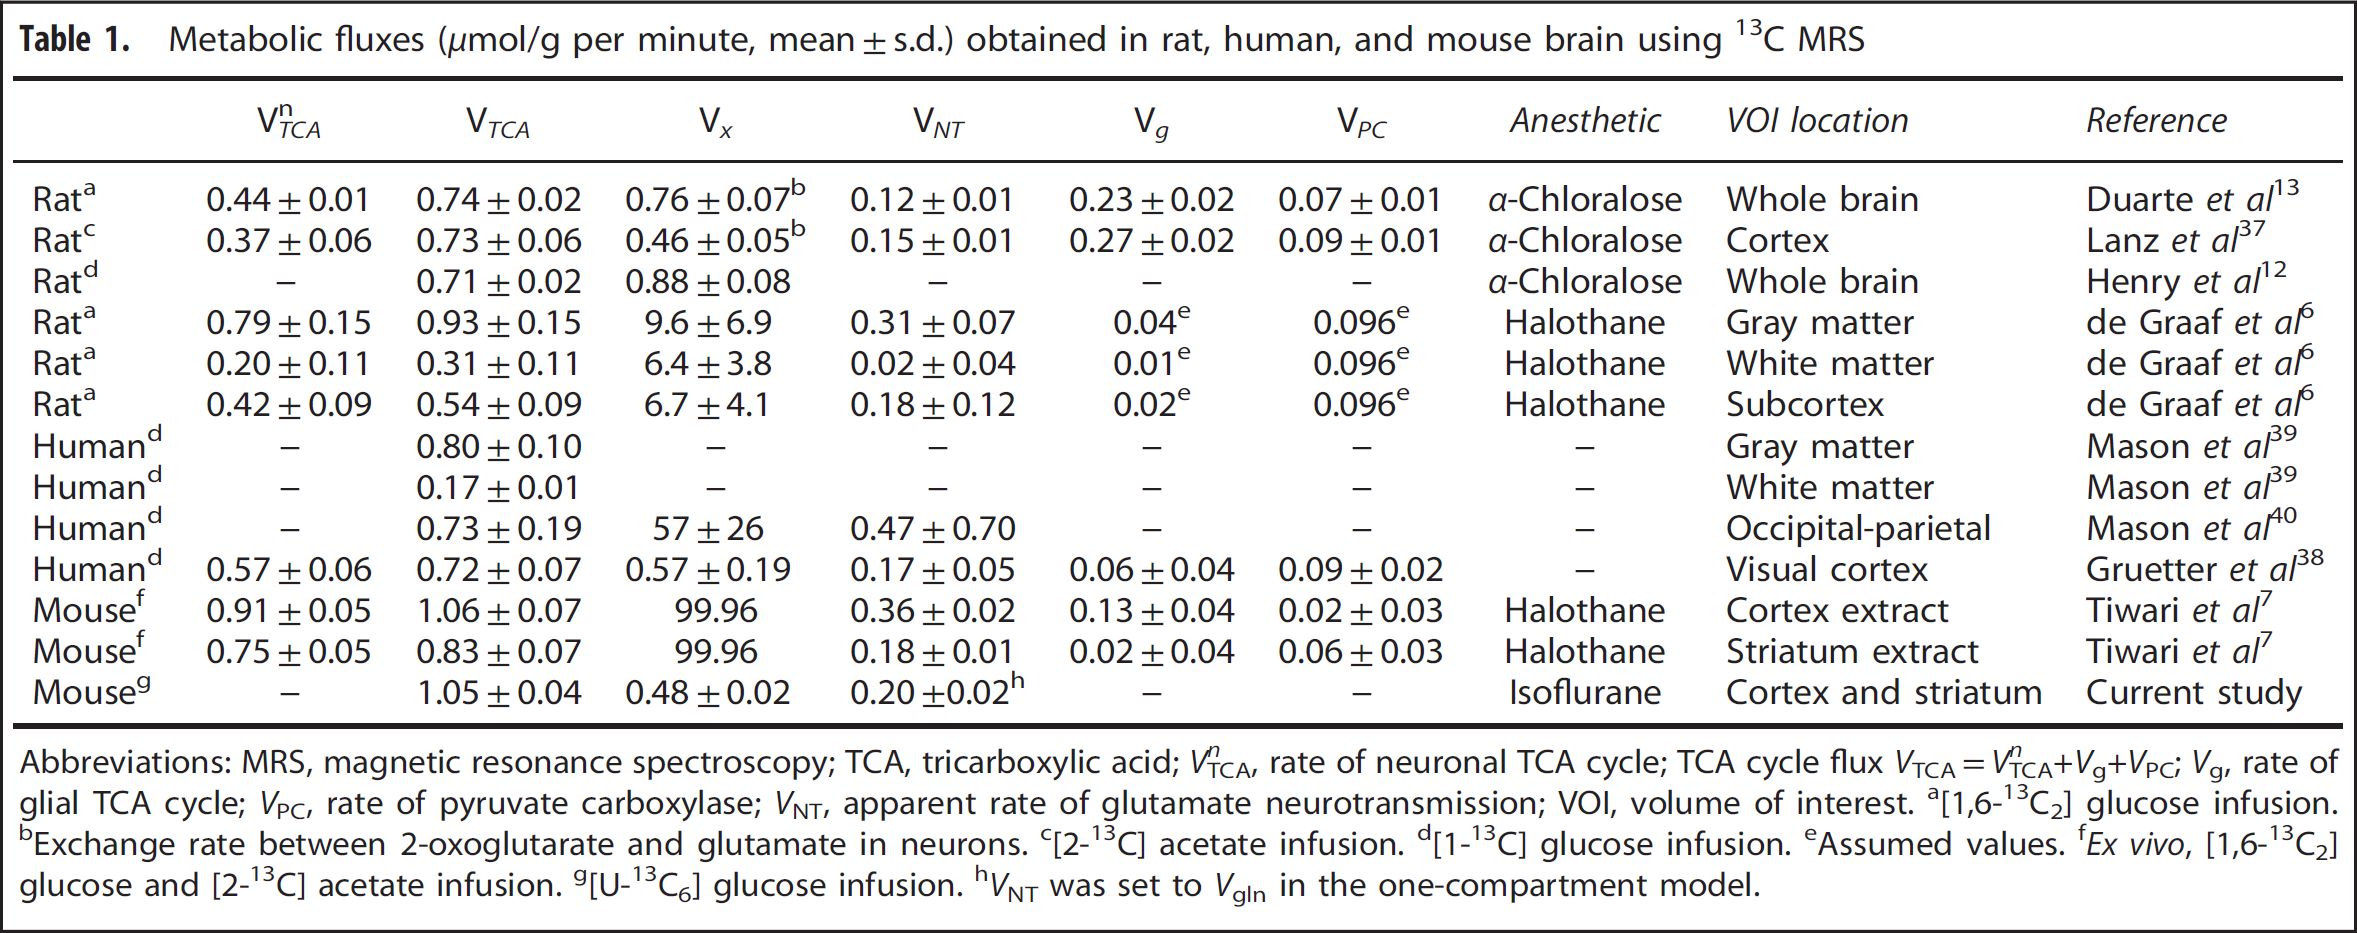
Abbreviations: MRS, magnetic resonance spectroscopy; TCA, tricarboxylic acid;
[1,6-13C2] glucose infusion.
Exchange rate between 2-oxoglutarate and glutamate in neurons.
[2-13C] acetate infusion.
[1-13C] glucose infusion.
Assumed values.
[U-13C6] glucose infusion.
To determine the ratio of VLac/VAla (10 ± 2), the turnover curves of LacC3 and AlaC3 (Figure 5A) were fitted, assuming a glucose utilization CMRglc of 0.5 μmol/g per minute.
7
To investigate the effect of the assumed CMRglc value on the assessment of
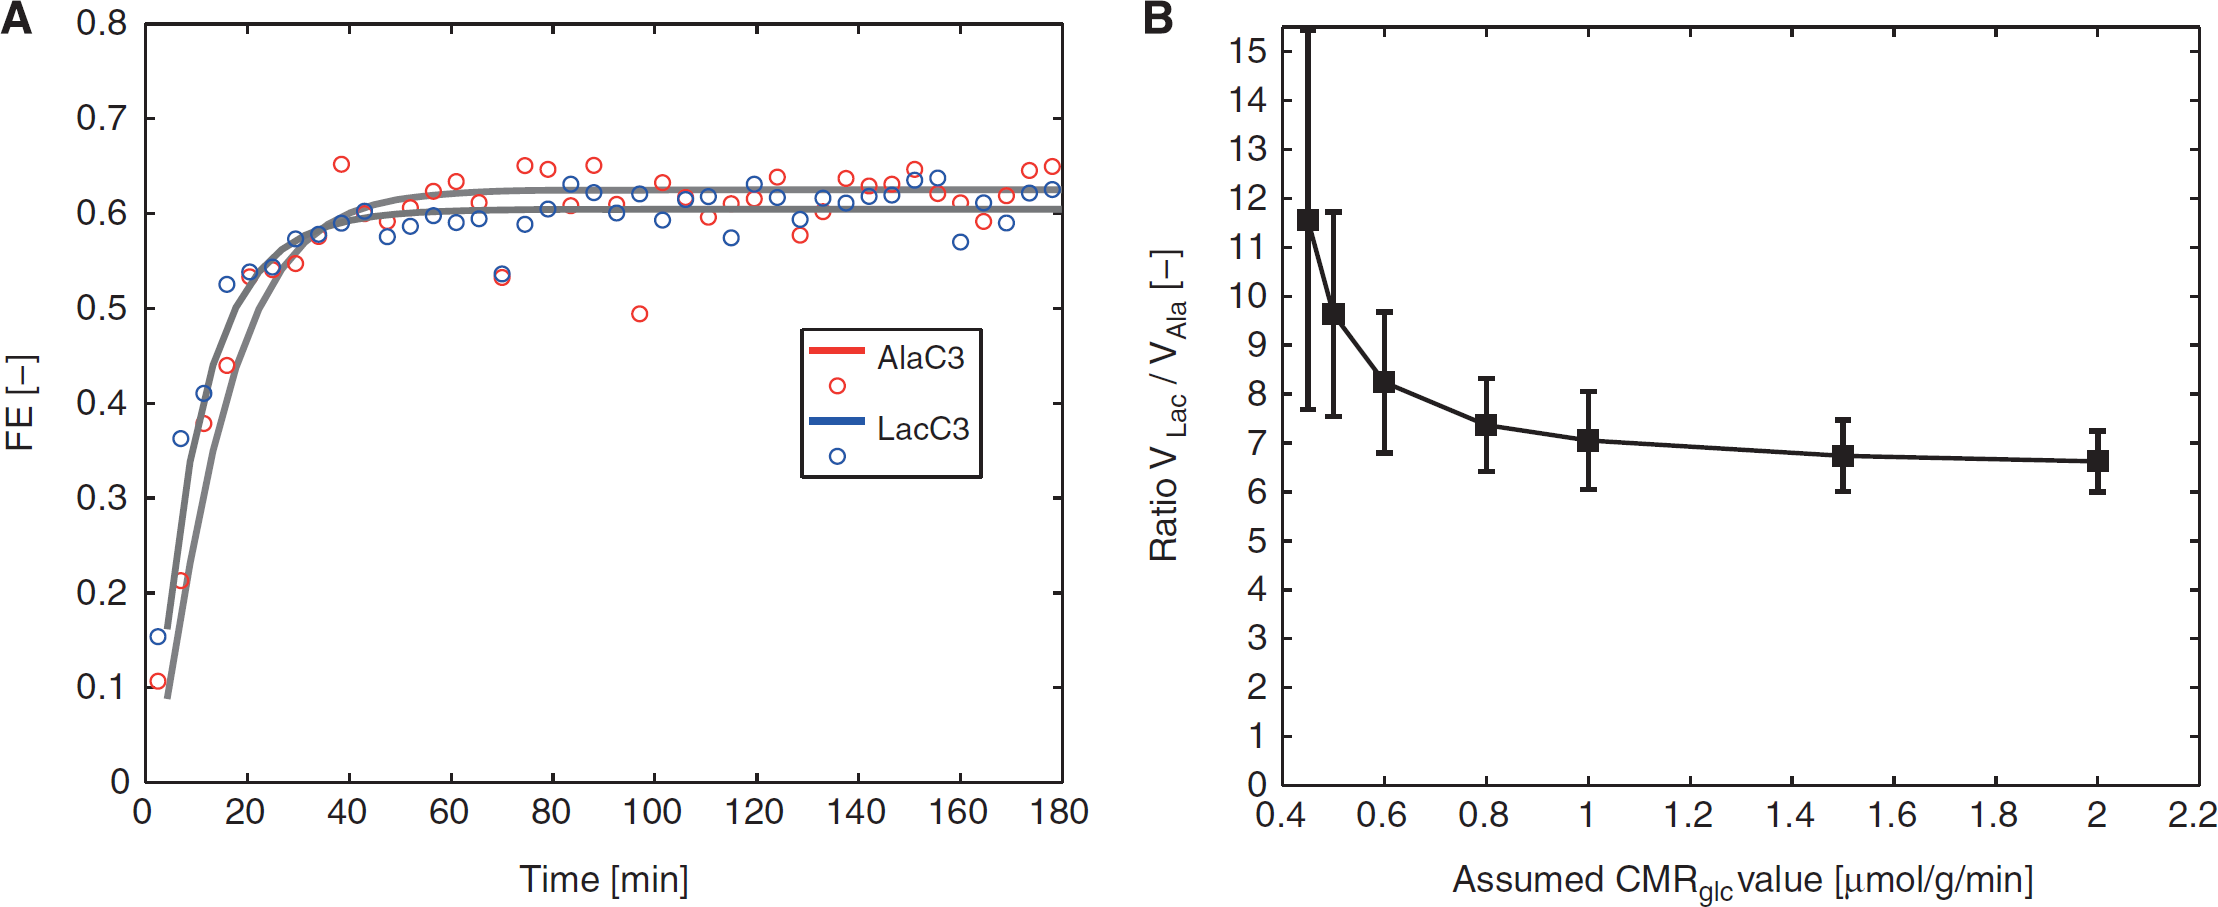
(
DISCUSSION
The present study measures for the first time
1
H-[
13
C] Magnetic Resonance Spectroscopy in the Mouse Brain Due to the small size of the mouse brain and the intrinsic low sensitivity of
13
C MRS, several strategies were used in this study to enhance sensitivity of the measurement. The use of [U-
13
C6] glucose infusion increased the sensitivity of the measurement by two-fold relative to [1-
13
C] glucose by labeling both molecules of [3-
13
C] pyruvate from [U-
13
C6] glucose through glycolysis. In addition, as an alternative to direct-detected
13
C MRS,
9
detection of
13
C labeling through coupled
1
H nuclei intrinsically increased the experimental sensitivity. The application of SPECIAL-BISEP
11
at ultra-high magnetic field of 14.1 T further increased the quality of
Input Function for Metabolic Modeling
As a major energy source of the brain, glucose is first transported into brain across the blood–brain barrier and then degraded into pyruvate by the glycolytic pathway. Pyruvate can then be transported into mitochondria and oxidized in the TCA cycle. It can also be converted to lactate through lactate dehydrogenase, which has a higher activity than that of the pyruvate dehydrogenase. 25
Therefore, following the glucose metabolic pathway, several candidates, e.g., plasma glucose, brain glucose, lactate, and pyruvate could serve as an input function in the mathematic modeling to derive metabolic fluxes. However, due to small pool size of pyruvate, it can only be detected with sensitivity enhancement using dynamic nuclear polarization. 29
To date, when using direct
13
C MRS, it has been hardly feasible to measure the time-resolved FE of metabolic pools such as glucose or lactate
Alternatively, the measure of FE of brain glucose using 1 H-[ 13 C] MRS has been reported in the rat brain; 10 however, this remains challenging as it heavily relies on excellent water suppression and shimming performance. The optimization of field inhomogeneity in mouse brain is highly demanding on shimming capacity because of an increased susceptibility gradient comparing with rat brain 24 and becomes even more challenging at 14.1 T compared with 9.4 T. 32 Therefore, in the current study, the reliable measurement of C1 glucose at 5.2 ppm was not applicable in mouse brain. Other 1 H resonances coupled to C2-C6 of glucose present a number of peaks (3.3 to 3.8 ppm) overlapping with macromolecule baseline and many metabolites. This results in the underestimation of total glucose concentration in the nonedited spectra and overestimation of FE of brain glucose. Therefore, brain glucose might not be best candidate as the input function in this study.
However, the mouse brain contains higher level of lactate (3 to 5 mmol/L)24,33 across four brain regions relative to rats (1 to 2 mmol/L) 34 and human (~1 mmol/L), 35 leading to direct time course measurements of lactate FE using 1 H-[ 13 C] MRS (Figure 4C). Compared with plasma or brain glucose, which is several biochemical steps further from the TCA cycle, the lactate pool is likely to represent closely the FE of pyruvate. In addition, lactate can also be transported into the brain via monocarboxylate transporters and utilized as brain fuel. 36 The use of lactate as an input function could take into account the potential 13 C labeling from the blood. Therefore, the brain lactate signal is the most favourable and straightforward candidate for input function in the mouse brain.
Metabolic Fluxes
The value of TCA cycle flux (
In this study, we applied a one-compartment model analysis of brain energy metabolism based on the turnover curves GluC4, GlnC4, GlxC3, and AspC2. Since brain tissue is composed of many different cell types with distinct roles in energy metabolism, it would be desirable to develop the model into a more complex scheme closer to the tissue biochemical complexity. A next step would be to consider a two-compartment approach1,13,37 to distinguish between neuronal and astrocytic metabolism in the
13
C labeling of glutamate, glutamine and aspartate. However, to characterize properly the activity of astrocytic and neuronal TCA cycles separately, the separate acquisition of the positions C4 and C3 of glutamate and glutamine is at least necessary,
1
when infusing [1,6-
13
C]glucose. The main reason is the different labeling pattern of the position C3 induced in the astrocytic compartment by the astrocytic-specific pyruvate carboxylase. This cell-specific labeling pattern enables to decouple the effects of neuronal and astrocytic TCA activity on the observed turnover curves by a glial-specific dilution of glutamine C3. In the present study using [U-
13
C]glucose and limited to the measurement of GlxC3 due to spectral overlap, this cell-specific labeling pattern was not observed and the use of two-compartment modeling approach leads to strong correlations between the determined metabolic rates in the neuronal and astrocytic compartments (data not shown). This underdetermination can either be solved by fixing some metabolic rates using
Metabolic concentrations, required for the determination of the metabolic fluxes, are commonly varying strongly with cerebral regions as shown in the human
35
, rat,
34
and mouse
24
brains. Therefore, it is crucial to determine the metabolic pool size in the studied volume of interest (VOI). One of the advantages of
1
H-[
13
C] MRS is the simultaneous measurement of metabolic pool sizes from nonedited spectra. The metabolite values measured in the VOI containing mainly cerebral cortex and striatum in this study are in the range of those reported
Metabolic Flux Ratio of V Lac/V Ala
In the present study, we report for the first time the
With the applied glucose infusion protocol, the FE of glucose in blood has been shown to reach steady state within 5 minutes.
13
Blood glucose FE was therefore modeled as a step function. However, the biochemical pathways and intermediates from plasma glucose to cerebral pyruvate are numerous (i.e., glucose transport, phosphorylation, and glycolysis). All these intermediate labeling pools potentially delay the turnover of pyruvate as compared with blood glucose and therefore may affect the kinetics of
13
C uptake in alanine and lactate. Since the glycolytic process is expected to be relatively slow compared with the conversion between pyruvate and lactate or alanine, this effect may not be negligible. Therefore, the separate evaluation of CMRglc and the labeling fluxes
In this study, a representative CMRglc of 0.5 μmol/g per minute
7
was assumed to avoid potential mathematical underdetermination of the metabolic model. Further analysis (Figure 5B) showed that assumed CMRglc in a range of 0.45 to 2 μmol/g per minute resulted in a ratio
We conclude that high quality
1
H-[
13
C] NMR spectra can be acquired from a volume as small as 60 μL in mouse brain
DISCLOSURE/CONFLICT OF INTEREST
The authors declare no conflict of interest.
Footnotes
References
Supplementary Material
Please find the following supplemental material available below.
For Open Access articles published under a Creative Commons License, all supplemental material carries the same license as the article it is associated with.
For non-Open Access articles published, all supplemental material carries a non-exclusive license, and permission requests for re-use of supplemental material or any part of supplemental material shall be sent directly to the copyright owner as specified in the copyright notice associated with the article.