
Abstract
Proton magnetic resonance spectroscopy (1H-MRS) has been used to demonstrate metabolic changes in the visual cortex on visual stimulation. Small (2% to 11%) but significant stimulation induced increases in lactate, glutamate, and glutathione were observed along with decreases in aspartate, glutamine, and glycine, using 1H-MRS at 7 T during single and repeated visual stimulation. In addition, decreases in glucose and increases in
Introduction
Proton magnetic resonance spectroscopy (1H-MRS) is a powerful tool for investigating human metabolism
Given that at 7 T, the principal excitatory and inhibitory neurotransmitters (Glu and
We undertook two studies: the first consisted of 6.6 minutes baseline followed by 13.2 minutes of visual stimulation and 19.8 minutes recovery; the second involved two 9.9 minutes rest periods interleaved with two 9.9 minutes stimulation periods. Our results broadly confirmed the results of Mangia et al (2007a), in particular with respect to possible changes in MAS activity. However, our studies demonstrated a peak in Lac levels followed by a subsequent decline toward baseline during the stimulus, and a failure to rise again on subsequent stimulation. Interestingly, we also observed a highly reproducible but unexpected increase in glutathione (GSH) levels, with an equivalent decrease in glycine (Gly) during stimulation, as well as changes in the relative levels of Gln and the principal neurotransmitters Glu and GABA.
Materials and methods
Human Subjects
Ten healthy subjects (7M, 3F, age=25±3 years) without history of neurologic disorders were involved in the study, which was conducted over a 3-month period. Informed written consent was obtained from all subjects according to the procedures approved by the University of Nottingham Medical School Ethics Committee. Nine subjects participated in each paradigm (single stimulus and double stimulus), including eight who participated in both. Subsequently, the data for one subject was removed from all analyses of the double stimulus paradigm due to significant stimulated echo artifacts affecting the spectral region around 3 to 4 p.p.m. This subject did not participate in the single stimulus paradigm.
Visual Stimulation
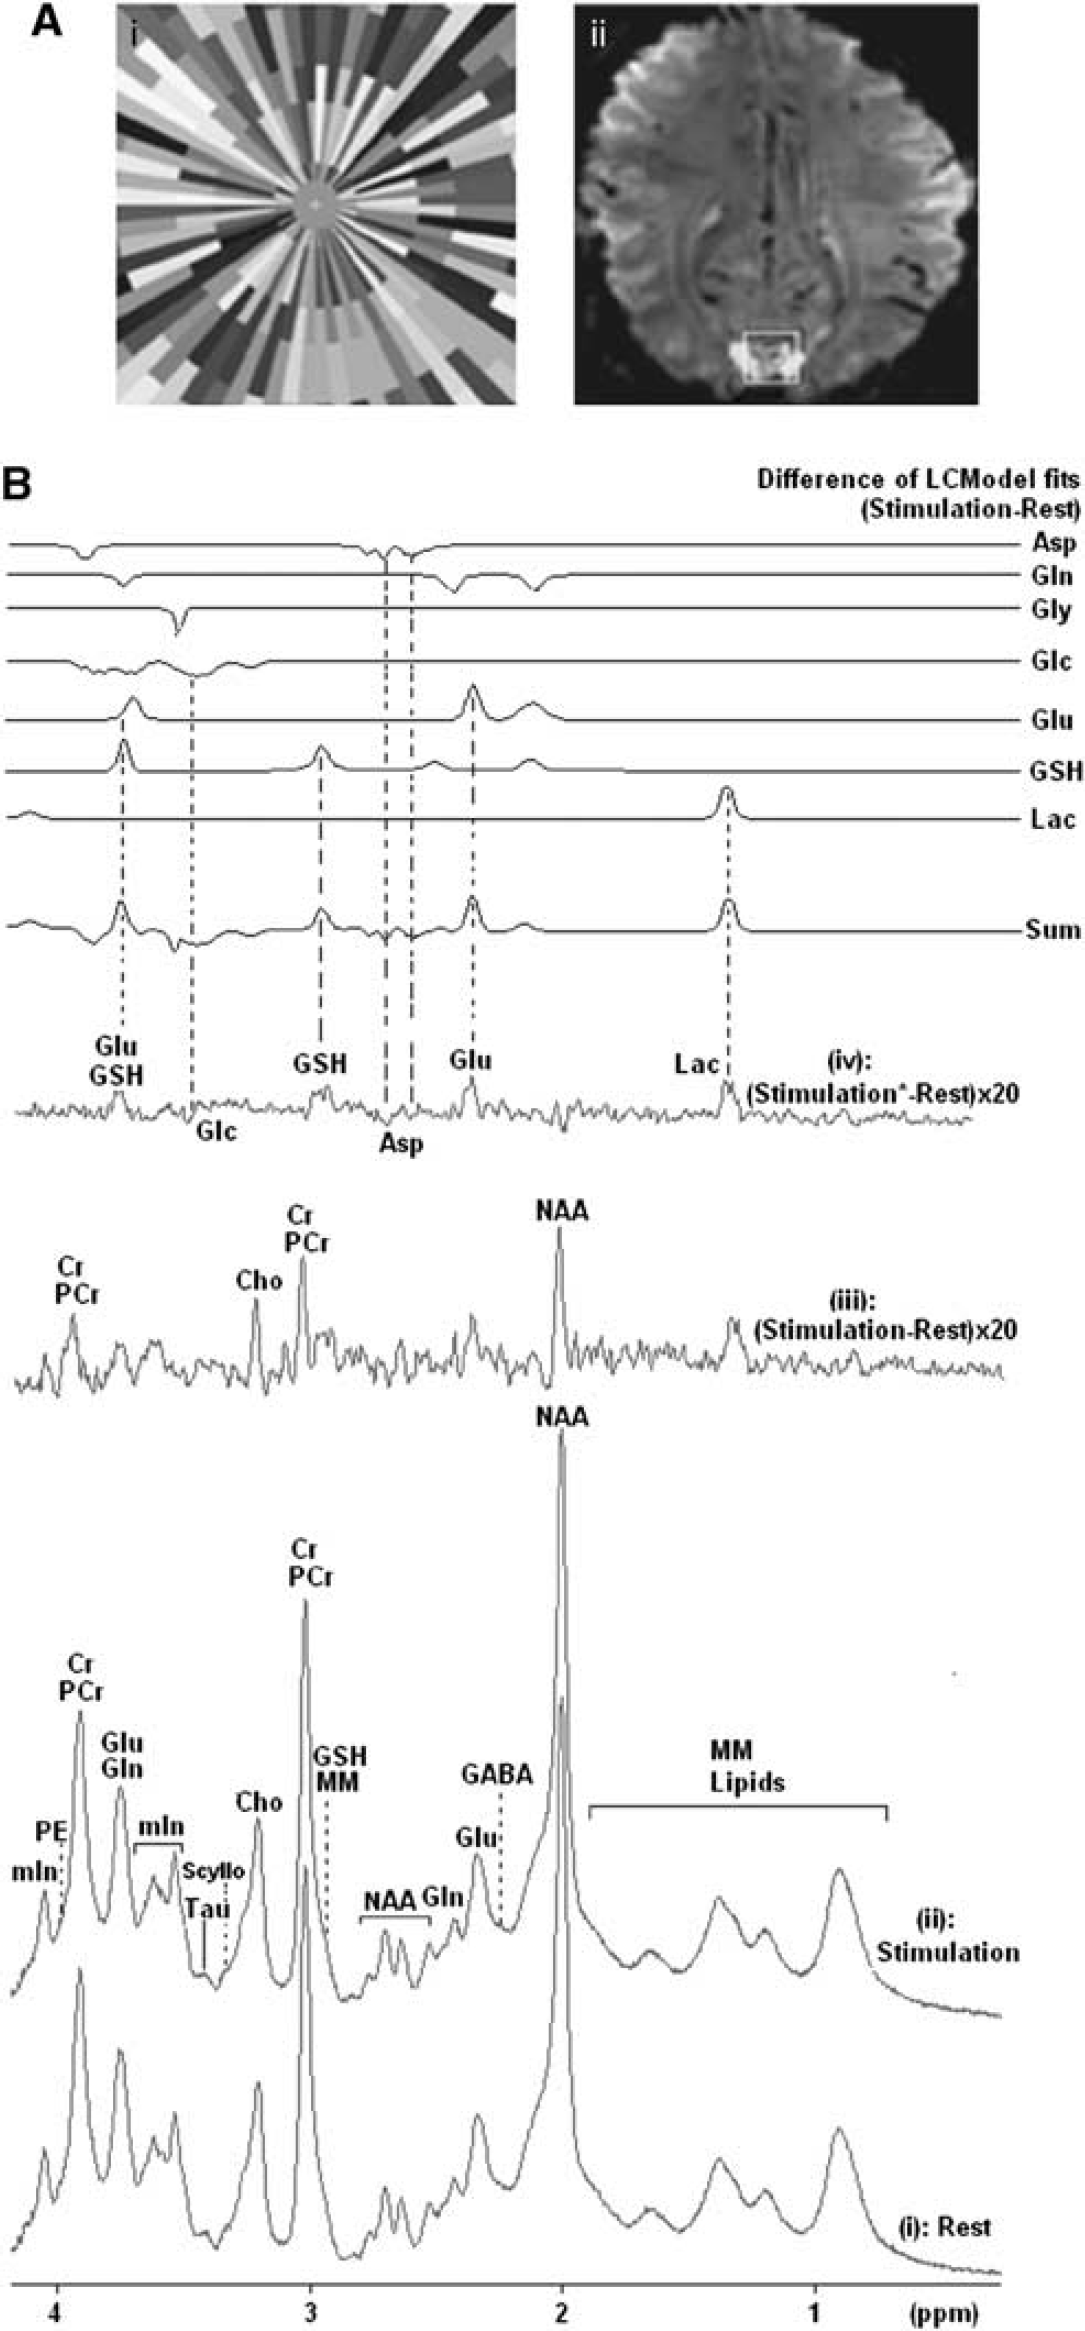
The visual stimulus was projected, with a 7.6° visual angle, onto a screen using a LED projector, coupled to a PC, and was viewed with prism spectacles. A small cross in the center of the field of view was used as fixation point. A median gray background was presented during rest periods and the stimulation paradigm comprised contrast-defined wedges, moving toward or away from the fixation cross and randomized by the computer (see Figure 1A(i)). This stimulation paradigm has been shown to lead to less neural adaptation over time compared with a checkerboard (Wandell et al, 2005).
(
Magnetic Resonance Imaging and Spectroscopy
All MR measurements were acquired using a Philips Achieva 7 T MR system (Philips Healthcare, Best, Netherlands) with reception employing a 16-channel SENSE head coil and transmission a surrounding volume coil. First- and second-order shim terms were automatically adjusted using FASTMAP with EPI readout (Gruetter and Tkáč, 2000). Head movement was minimized by positioning two pieces of foam surrounding the subject's head.
Functional Magnetic Resonance Imaging Measurement
An initial functional magnetic resonance imaging scan (EPI, echo time/repetition time (TE/TR)=26/2,200 milliseconds, spatial resolution=2 × 2 × 2 mm3 isotropic voxels, functional paradigm: 4.4 seconds stimulation and 28.6 seconds rest, eight repeats) was performed before spectroscopic acquisition. Functional magnetic resonance imaging data were analyzed in real-time using IViewBOLD (Philips Healthcare, Best, Netherlands) to determine the region of maximum activation in the visual cortex.
Magnetic Resonance Spectroscopy Measurement
A cubic volume of interest of 2 × 2 × 2 cm3 was positioned inside the region exhibiting significant BOLD (blood oxygen level-dependent) change on stimulation for functional MRS acquisition (see Figure 1A(ii)). A STEAM (STimulated Echo Acquisition Mode) sequence (TE/mixing time/TR=15/17/3,000 milliseconds, spectral width 4,000 Hz, 4,096 time points) was used for acquiring the MRS data. Spectra were collected in blocks of 32 averages with one acquisition without water suppression acquired at the beginning of every block (99 seconds per block). Water suppression was performed using MOIST (Multiply Optimized Insensitive Suppression Train) (Tarasów et al, 2003). Two different visual stimulation protocols were employed. The first functional paradigm comprised a 6.6-minutes resting period, before 13.2 minutes of visual stimulation followed by 19.8 minutes recovery, according to an acquisition protocol: OFF(4 blocks)–ON(8 blocks)–OFF(12 blocks). The second functional paradigm consisted of two 9.9 minutes rest periods interleaved with two 9.9 minutes stimulation periods, according to an acquisition protocol: OFF(6 blocks)–ON(6 blocks)–OFF(6 blocks)–ON(6 blocks). The total duration for each functional session was 39.6 minutes.
Magnetic Resonance Imaging Measurement
A 3D T1-weighted magnetization prepared rapid gradient echo (MPRAGE) image was acquired (field of view=192 × 192 × 52.5 mm3 with 1.5 mm isotropic voxels, TE/inversion time (TI)/TR=1.5/965/14 milliseconds) to allow the tissue content of the MRS voxel to be calculated. The anatomical image was first masked to show only image voxels contained within the MRS voxel. The tissue content was then assessed by segmenting the MRS voxel based on the image intensity (threshold, manually chosen by an observer, set to the upper threshold for cerebrospinal fluid tissue).
Postprocessing
Spectra were saved separately and were frequency aligned to the
A group difference spectrum was generated from the single and double visual stimulation paradigm using spectra from 17 subjects (one subject was excluded due to the noise within the chemical shift range 3.0 to 4.0 p.p.m.). The group averaged stimulation spectrum subtracted from the group averaged rest period spectrum. In all, 0.5 Hz Lorentzian line broadening was added to the group stimulation spectrum to compensate for BOLD changes in linewidth. This resulted in a ‘BOLD-free’ difference spectrum.
Metabolite Quantification
The LCModel (Provencher, 1993) basis data set includes the simulated spectra of 20 metabolites (Mekle et al, 2009): Ala (alanine), Asp, PCho (phosphorylcholine), Cr (creatine), PCr (phosphocreatine), GABA, Gln, Glu, GSH, Gly, Ins (myo-inositol), Lac, NAA, scyllo-Ins (scyllo-inositol), Tau (taurine), Asc (ascorbate), Glc, NAAG (

1H 7 T magnetic resonance spectroscopy (MRS) spectrum (STEAM (STimulated Echo Acquisition Mode) sequence: echo time/mixing time/repetition time (TE/TM/TR)=15/17/3,000 milliseconds, BW 4,000 Hz, 4,096 points, NSA 32) obtained from a 2 × 2 × 2 cm3 volume in the visual cortex (uppermost spectrum), LCModel fit (second spectrum from top) in the range 0.2 to 4.2 p.p.m. and residual (third spectrum from top). The LCModel basis components, macromolecule, and baseline contributions to the fit are shown in the lower traces. Asp, aspartate; GABA,
Statistical Analysis
A Wilcoxon signed rank test was conducted to compare the metabolite changes during different time scales of stimulation versus resting periods for both functional paradigms. Values are presented as mean±s.d. and
Results
Spectral Analysis
Figure 1B depicts the group difference spectrum between rest (Figure 1B(i)) and stimulation (Figure 1B(ii)) obtained from both the single and double stimulation paradigms, using data from 17 subjects (group analysis). The peaks seen at 1.33 p.p.m. (Lac), 2.01 p.p.m. (NAA), 2.35 p.p.m. (Glu), 2.92 and 2.97 p.p.m. (GSH), 3.03 p.p.m. (tCr), 3.21 p.p.m. (Cho), 3.78 p.p.m. (GSH) in the difference spectrum (Figure 1B(iii)) are attributed to linewidth changes due to the BOLD effect as well as concentration changes of metabolites (Mangia et al, 2007a). When the spectrum acquired during stimulation was line broadened by 0.5 Hz to match the linewidth of the spectrum acquired at rest, to eliminate the linewidth changes, only Lac (1.33 p.p.m.), Glu (2.35 p.p.m.), and GSH (2.92/2.97/3.78 p.p.m.) survived the procedure, revealing stimulus-related changes in these metabolites. However, to avoid the uncertainties associated with this procedure, we chose not to use difference spectra for the subsequent analysis, but rather used LCModel on the raw data to determine absolute concentrations and performed statistical tests to determine changes on activation.
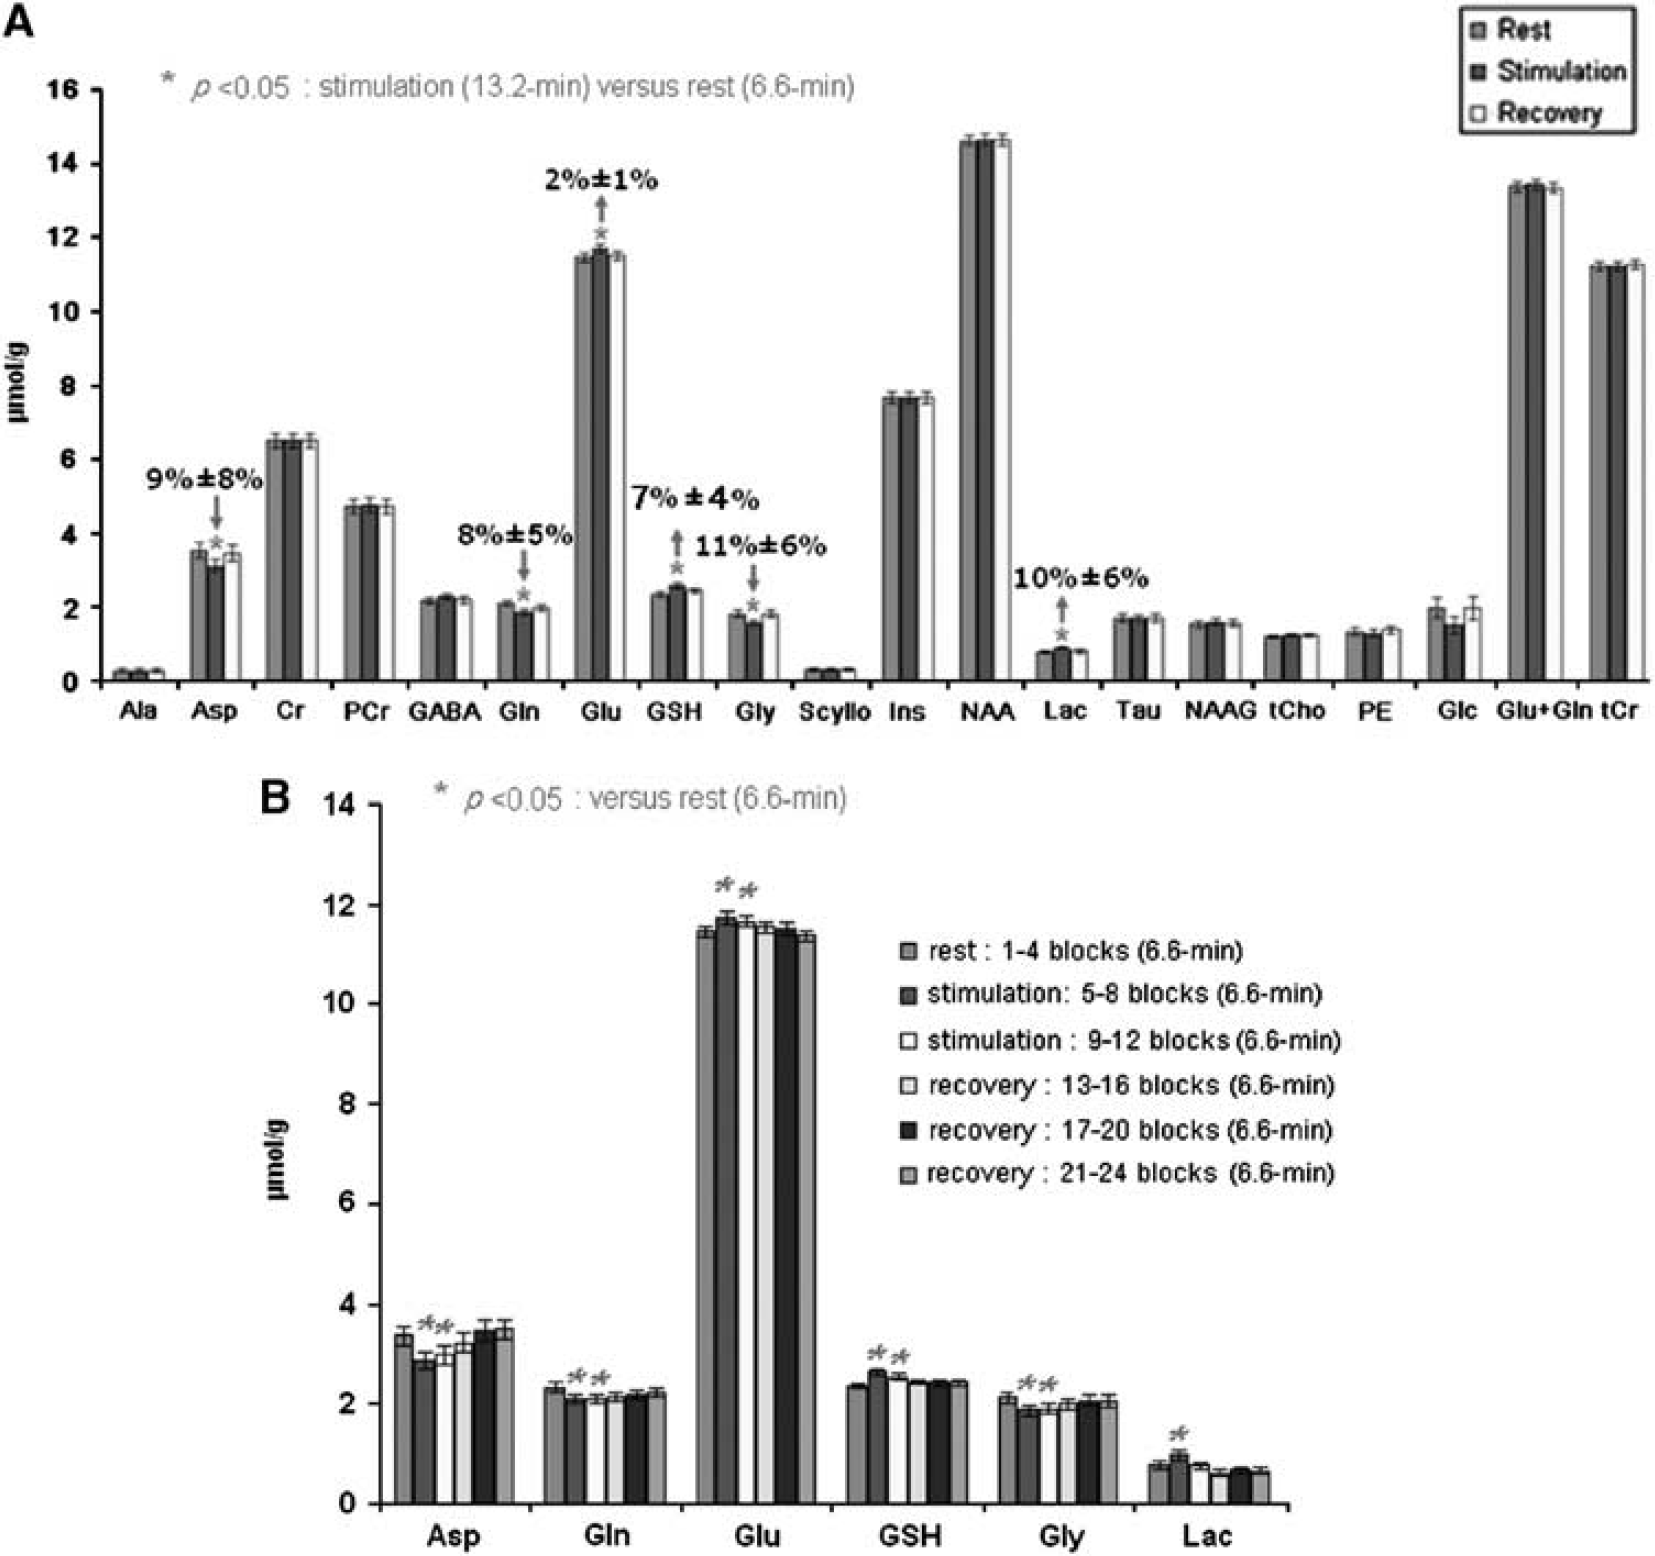
Quantitative Analysis of Metabolites During a Single 13.2-Minute Visual Stimulation
Shimming resulted in typical water linewidths of 10.3 to 11.2 Hz and typical NAA SNR values for a spectrum of 32 averages were between 43 and 58. More than 15 metabolites were reliably quantified from
Absolute concentrations of metabolites and their percentage changes on stimulation
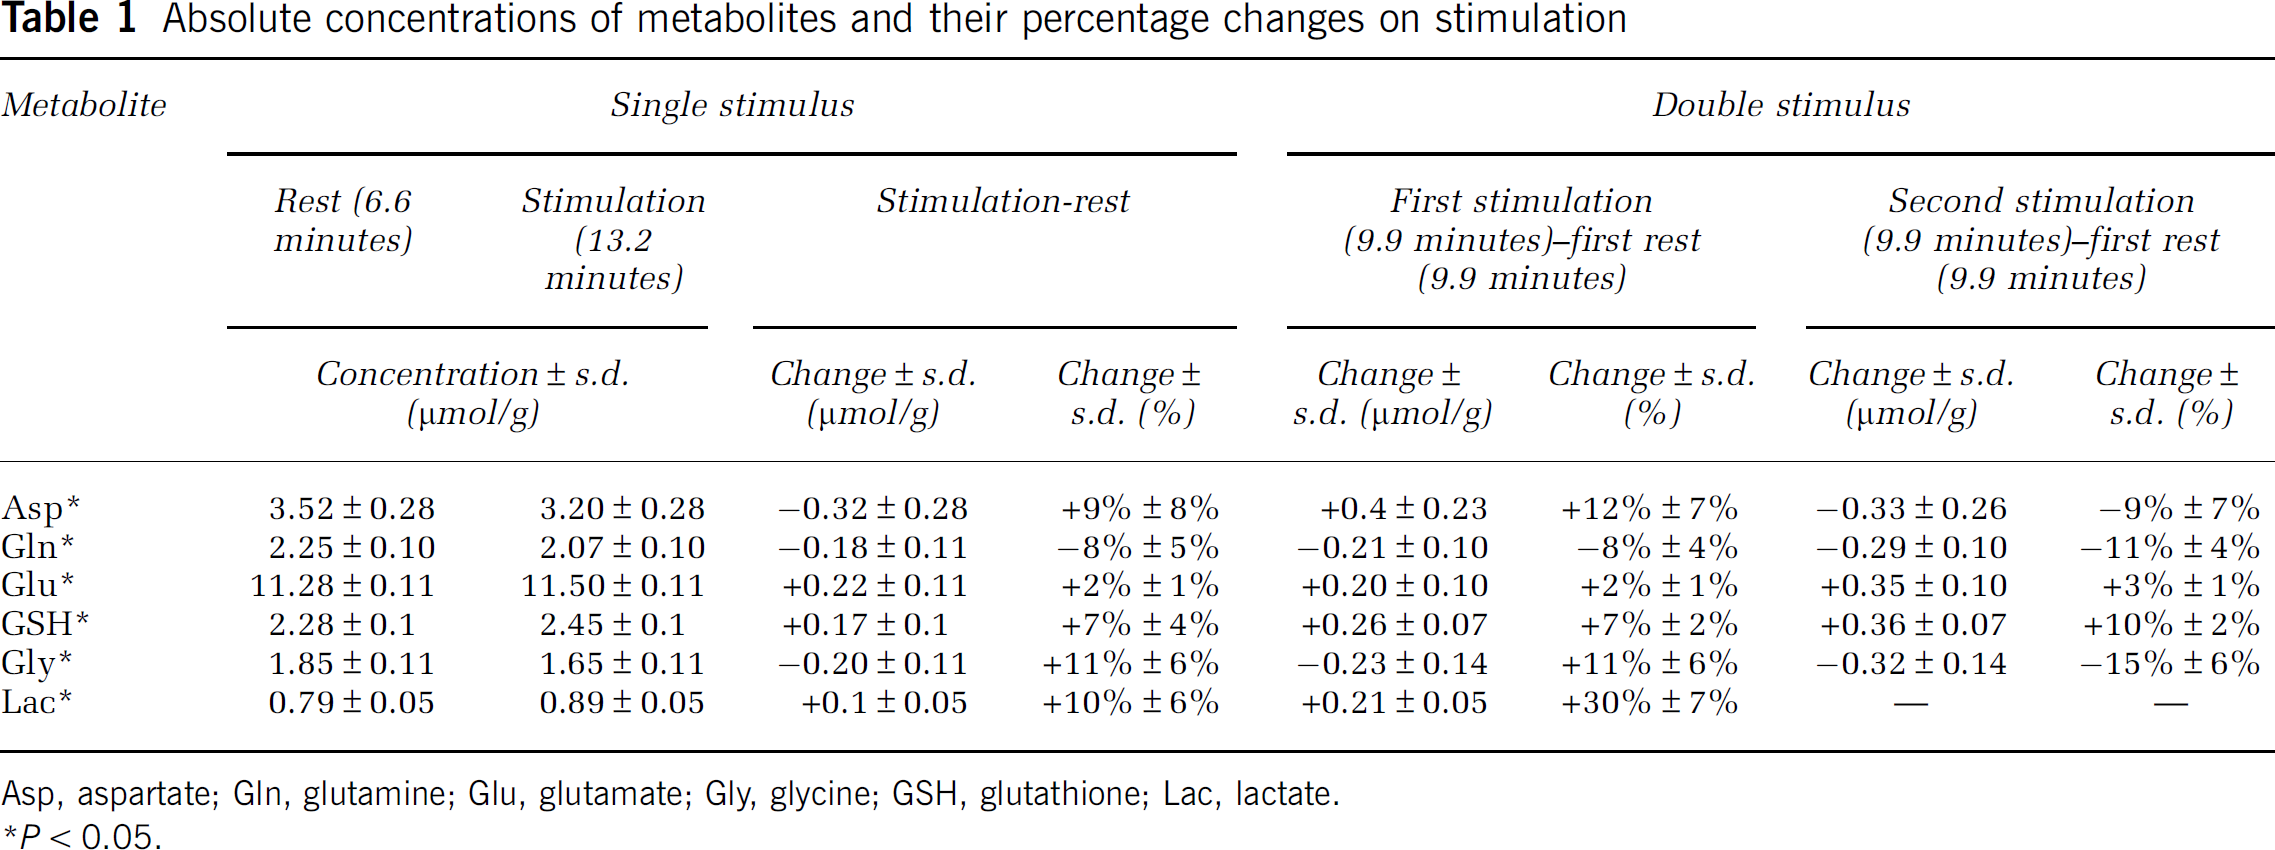
Asp, aspartate; Gln, glutamine; Glu, glutamate; Gly, glycine; GSH, glutathione; Lac, lactate.
(
Quantitative Analysis of Metabolites During Repeated 9.9 Minutes Visual Stimulations
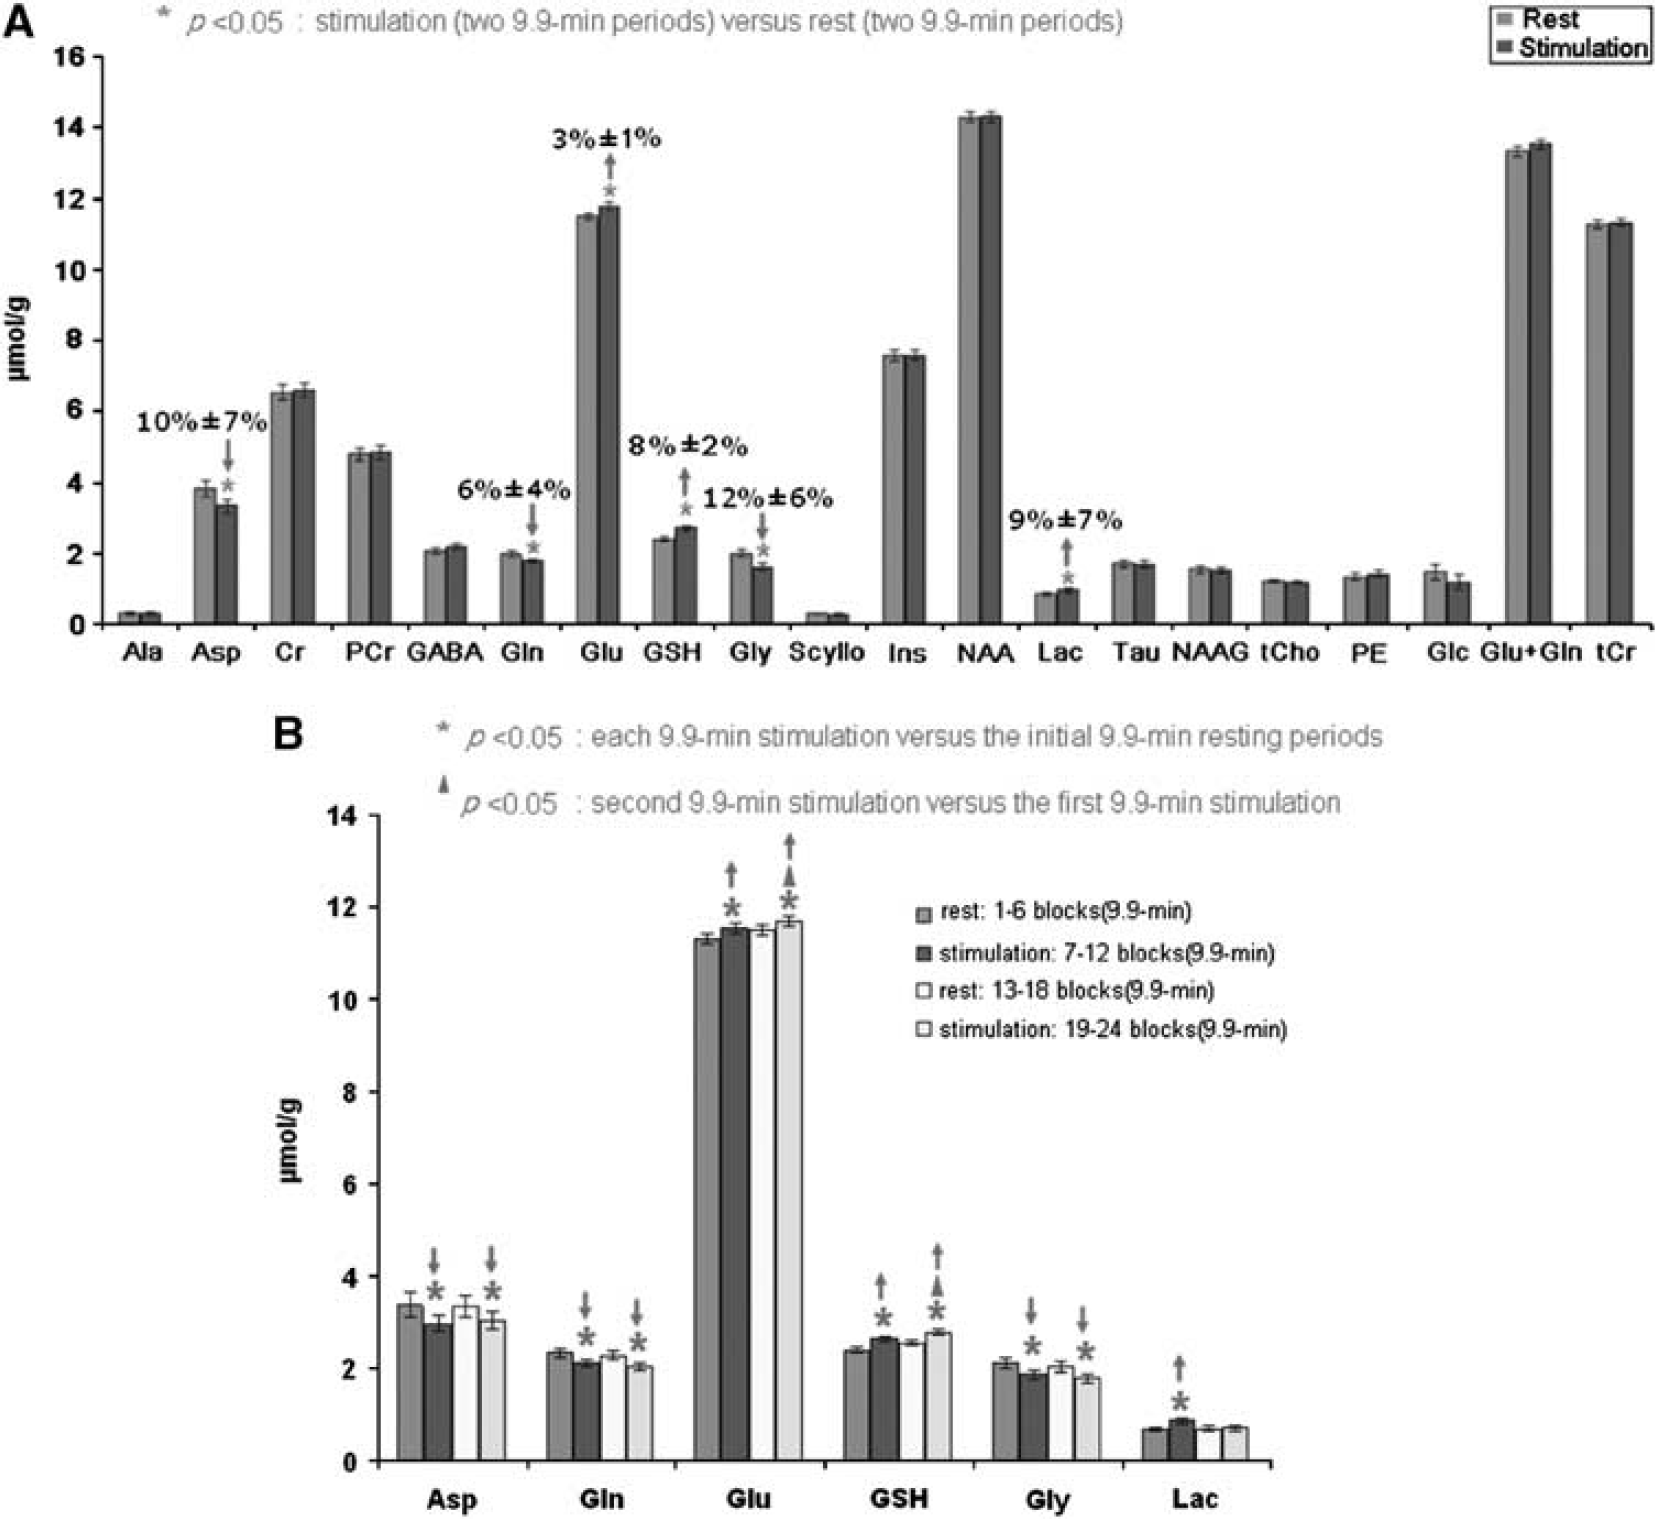
The second experimental paradigm involved two periods of rest (each of 9.9 minutes duration) interleaved with two 9.9-minute stimulation periods. It was undertaken to confirm the pattern of metabolic changes observed in the single 13.2-minute stimulation paradigm, and to investigate whether the responses to repeated periods of stimulation are identical or differ from the initial response. Figure 4A shows the comparison of neurochemical profiles for the 20 metabolites measured (mean±s.d.,
(
Changes in Asp, Glu, Gln, GSH, and Gly during the second 9.9-minute stimulation period were comparable to those found during the first 9.9-minute stimulation period (Figure 4B). However, Lac only showed significant elevation in the first 9.9-minute stimulation (30%±7%, equivalent to 0.21
Metabolic Time Courses
Metabolic time courses with a 99-second time resolution are shown for the single (A) and repeated (B) visual stimulation paradigms in Figure 5. They reveal that Lac increases to a maximum level within the first 99 seconds of activation, followed by a decrease toward the basal level even during ongoing stimulation. After cessation of the first stimulus, the averaged Lac level was slightly below baseline, and interestingly failed to show a response to a second visual stimulus. In contrast, Glc was reduced from baseline levels for the entire duration of both visual stimuli.
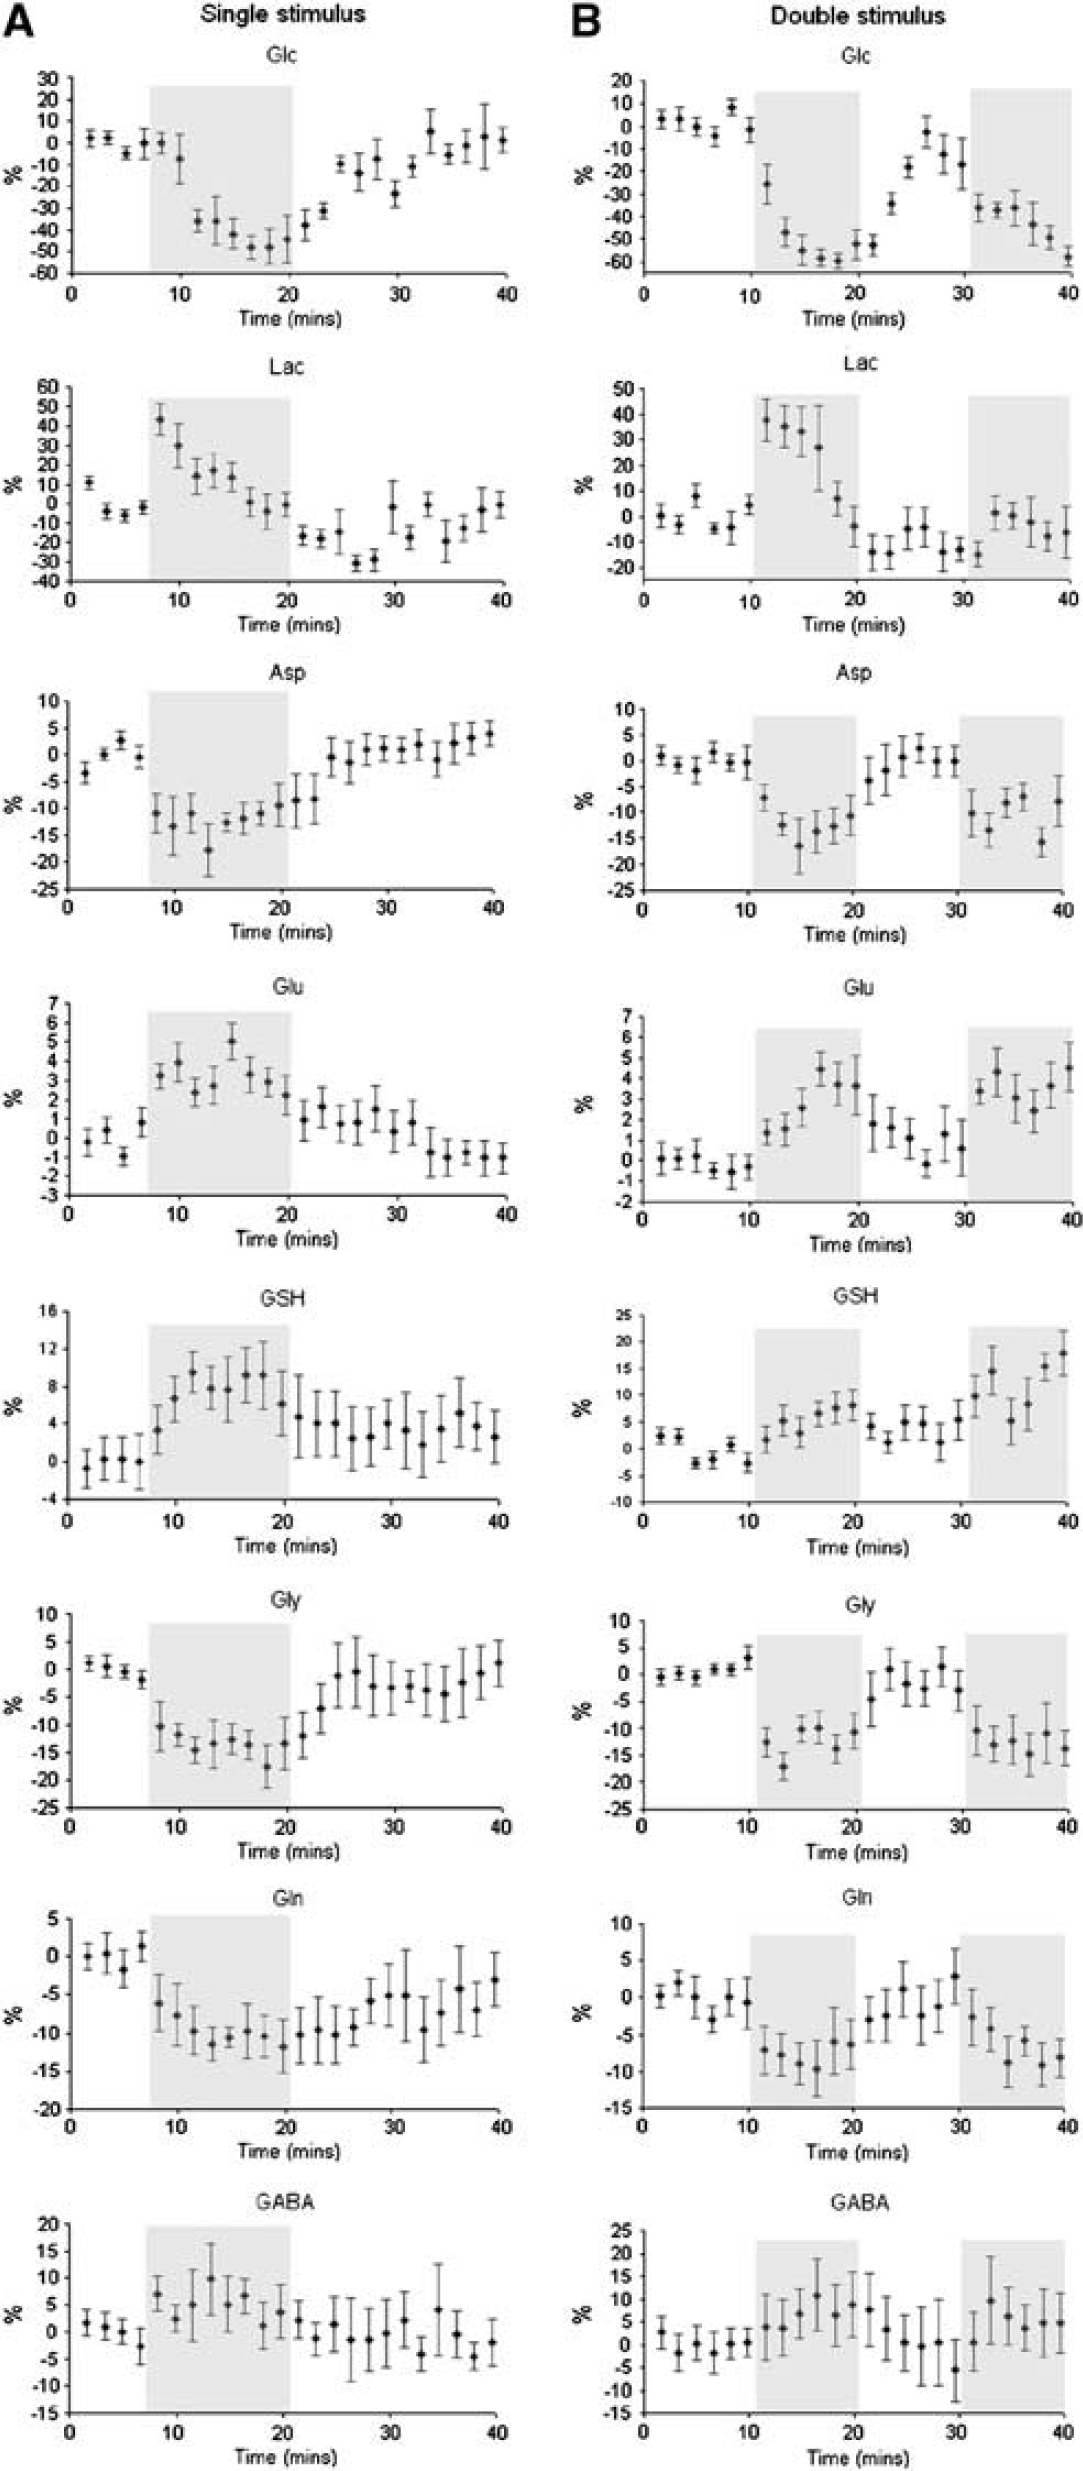
Time courses of metabolites during the single (
During stimulation, there was a small but statistically significant increase in Glu. Recovery toward baseline levels was relatively slow and was incomplete at the time of a second stimulus, which resulted in a significantly higher Glu level as noted above. Glutathione levels followed a similar time course to Glu. Changes in Gln, Gly, and Asp were opposite to those of Glu and GSH, that is, decreased in response to the stimuli. Asp and Gly showed a response to both stimuli, recovering during the resting periods, whereas Gln recovered more slowly, remaining below baseline levels for a significant period poststimulation.
Discussion
Spectral Acquisition at 7 T
This study shows that reliable metabolite quantification can be achieved with reasonable temporal resolution using a 16-channel SENSE head coil. This is significant because it demonstrates that similar studies are possible in subcortical regions of the brain and in those cortical areas less amenable to surface coil study. A penalty is, of course, paid in SNR; see for comparison, the surface coil study of Mangia et al (2007a). However, in future studies, this could be mitigated by appropriately weighting the signal contributions of the individual coil elements, effectively synthesizing the most appropriate coil for the region of interest selected. The expected increase in spectral resolution at 7 T, relative to lower field strengths, is realized, enabling many more metabolites to be quantified (Figures 1, 2, 3, 4, 5), including those associated with energy metabolism (Glc, Lac, Asp), neurotransmitter activity (Glu, GABA, and Gln), and neuroprotection (GSH). As previously reported, the BOLD effect, due to the decreased susceptibility effects resulting from the local hyperoxygenation of blood during activation, increases the T2∗ of both water and metabolite signals during stimulation. The observed line narrowing effect is small (∼0.5 Hz at 7 T) and is easily discernible only for the strongest singlets in the spectrum (NAA and tCr, see Figure 1B(iii)). Subtraction of the resting spectrum from the spectrum acquired during stimulation results in small peaks in the difference spectrum at 2.01 p.p.m., 3.03 p.p.m. and 3.12 p.p.m., bordered by negative sidelobes. This effect is largely removed by adding 0.5 Hz line broadening to the spectrum acquired during stimulation to match the linewidth of the spectrum acquired at rest. This reveals stimulus-related changes in several metabolites, including Lac (1.33 p.p.m.), Glu (2.35/3.75 p.p.m.), and GSH (2.92/2.97/3.78 p.p.m.) (Figure 1B(iv)). It is to be expected that the BOLD-induced T2∗ changes should have little effect on quantification if a short TE sequence is used, and indeed, no change is observed between rest and stimulation for NAA concentration (Figures 3 and 4), lending confidence to this assertion. It also suggests that the TR we have chosen (3 seconds) is sufficiently long for any stimulation-induced changes in T1 values to be negligible. There is one proviso, namely, that if stimulation leads to movement of metabolites between compartments with substantially different relaxation behaviors, this may not be the case.
Stimulation-Induced Changes in Brain Energy Metabolism
The brain's energy requirement is met primarily by Glc, delivered from plasma via the Glc transporter, which is reversible (Gruetter et al, 1998). The increased Glc consumption, required to meet the increased energy demand during visual stimulation, leads to a decrease in brain Glc concentration, slowing down reverse transport until a new steady state is reached, in which net Glc influx is equal to CMRglc (Mangia et al, 2007a). In our experiments, basal Glc levels in the visual cortex (1.7±0.3
Although the trends in the Glc time courses are clear, the changes did not reach statistical significance. This is a result of a higher s.d. associated with the Glc quantitation, probably because >80% of the signal intensity of Glc is in the 3.2 to 3.9 p.p.m. spectral region (Gruetter et al, 1992), where there is overlap with the much stronger resonances of Glu, Gln, Ins, and Tau. The observed decrease in Glc under stimulation in our experiments is in good agreement with previous reports (Mangia et al, 2007a), lending weight to the idea that decreased tissue Glc does indeed reflect increased CMRglc during visual stimulation.
While there is general agreement with the increase in CMRglc on visual stimulation, there has been considerable debate as to whether this increase is primarily aerobic or anaerobic. Early PET (positron emission tomography) studies by Fox et al (1988) found an uncoupling between oxygen and Glc consumption, suggesting that, whereas basal metabolism is primarily aerobic, the stimulus-related increase is essentially anaerobic. However, studies using 13C-MRS (Chen et al, 2001; Chhina et al, 2001) have found large (tens of %) increases in TCA cycle activity, suggesting that the increase is primarily in aerobic metabolism. Later PET studies have suggested a greater role for aerobic metabolism, but a discrepancy remains and it is therefore of interest to know whether there is accumulation of Lac, suggestive of anaerobic metabolism.
Several 1H-MRS studies have reported elevated brain Lac during visual stimulation and we too observe increases above baseline of up to 0.2
The initial increase in Lac during the early stimulation period most probably reflects an increase in anaerobic glycolysis. It also implies an increase in Pyr (because of the dynamic equilibrium between Lac and Pyr mediated by Lac dehydrogenase (LDH)). This rise in Pyr has been suggested to stimulate activation of pyruvate dehydrogenase, leading to an increased flux into the oxidative pathway (Hawkins et al, 1973). Mangia et al (2007a) argue that a new steady state of increased Lac sustains this increased flux into the TCA cycle. However, it could also be argued that an increased flux through pyruvate dehydrogenase could lead to a decrease in Lac as we observe. Because of the permeability of the blood–brain barrier to Lac, the increased brain Lac concentration during stimulation could also lead to an increased Lac efflux to blood, accounting for the decreased brain Lac level we observe in the later stages of the visual stimulation. Lac export to the extracellular compartment is believed to occur ∼30 seconds to 1 minute after the start of stimulation (Boer et al, 1991). The observed peak in the brain Lac then represents a balance between production and efflux, which is likely to depend strongly on the nature of the stimulation paradigm. It is possible that the changes in Lac we observe reflect changes in its utilization as energy substrate by neurons as suggested by several authors (Hu and Wilson, 1997). However, as noted by Mangia et al (2007a), modeling of this Lac shuttle hypothesis suggests that activation should result in a sustained increase in Lac, rather than a transient increase as noted above (Frahm et al, 1996). It is also possible, though unlikely in our case, that the changes we see reflect movement of Lac between compartments with radically different relaxation times.
Of great interest is the lack of Lac response to a second period of visual stimulation (Figures 4B and 5B). Although an attenuated Lac response due to repeated stimuli has been previously reported (Mangia et al, 2007b), we believe this study is the first to demonstrate complete suppression. We suggest that processes, such as increased Lac efflux, switched on during the first period of visual stimulation, remain active or ‘primed’ during the ensuing rest period. This observation is reminiscent of previously reported ischemic conditioning effects (Niemann et al, 2005), and merits further investigation regarding its origin and longevity. This is the subject of further studies in our laboratory.
Our findings of decreased Asp and increased Glu during single and repeated periods of visual stimulation are in good agreement with Mangia et al (2007a), who interpreted them as an increase in the activity of the MAS, which has an important role in maintaining the cytosolic redox potential NADH/NAD+ (NADH and NAD+ are the reduced and oxidized forms of nicotinamide adenine dinucleotide), required for the oxidative metabolism of Glc and for synthesis of brain neurotransmitters (McKenna et al, 2006). The rate-limiting step in this shuttle is the Glu–Asp antiporter located in the inner mitochondrial membrane (Mangia et al, 2007a) and an increase in shuttle activity would therefore be expected to lead to the changes observed by Mangia et al (2007a) and confirmed in our studies.
Glutathione and Its Response to Visual Stimulation
To the best of our knowledge, no prior 1H-MRS studies have reported GSH responses to visual stimulation, whereas a significant activation induced increase of 7% to 8% is a clear finding in this work (Figures 3, 4, 5; Table 1). This difference may be due to the nature of our stimulus, which is intense, prolonged, and designed to minimize adaptation. Despite its lower concentration, the Cramer-Rao lower bound (CRLB) of GSH was much lower than that of Gln (Table 1). This can be ascribed to the fact that the spin system of GSH includes a singlet at 3.77 p.p.m.—the ‘Gly moiety’—which does not experience signal loss due to J-modulation.
The human brain constitutes only 2% of the body's weight yet consumes 20% of the oxygen utilized by the body (Clarke and Sokoloff, 1999). Further, visual stimulation leads to large increases (approaching 50%) in the cerebral metabolic rate in the visual cortex, and though still a matter of contention, this increase is likely to be primarily aerobic (Chhina et al, 2001). The increase in mitochondrial respiration is inevitably accompanied by an increase in the generation of ROS (reactive oxygen species), such as the superoxide anion (O2−), peroxynitrite (ONOO−), and hydrogen peroxide, which cause oxidative damage of nucleic acids, lipids, carbohydrates, and proteins (Dringen, 2000). The body's mainline of defense against ROS is GSH (Muller, 2000), and so it is reasonable to expect that GSH would be present in significant amounts in the brain, and also that prolonged periods of visual stimulation might result in an increase in its level in visual cortex as we observe. During detoxification, GSH is oxidized to GSH disulfide (GSSG). However, GSSG does not accumulate, because it is rapidly reduced back to GSH by GSH reductase, and in normal brain, GSSG constitutes only ∼1% of total GSH. Maintenance of a highly reduced GSH pool is important to protect against excessive free radical formation. Glutathione is a tripeptide, made up of the amino acids Glu, Cys (cysteine), and Gly. It is interesting to note that the increase in GSH during visual stimulation is mirrored by a decrease in Gly, one of its metabolic precursors, as might be expected.
An alternative hypothesis for the observed increase in GSH during stimulation relates to the clearance of the increased Glu generated during the intense neuronal activation (Glu is also a metabolic precursor of GSH). Further, activation of the Glu NMDA (
Stimulus-Driven Changes in Neurotransmitter Cycling
The principal excitatory neurotransmitter in the cortex of the human brain is Glu. It is released from synaptic vesicles in the presynaptic terminal into the synaptic cleft where it activates receptors in the postsynaptic membrane. Glutamate is then transported, mainly into surrounding astrocytes, where it is first converted into Gln before being returned to the neurons and converted back into Glu. This Glu/Gln cycle sustains neural activity, and the flux through it would be expected to increase on neural stimulation—something that has been demonstrated in animal studies using 13C-MRS (Sibson et al, 1997) but is difficult to measure in humans (Morris and Bachelard, 2003). The concomitant changes in Glu and Gln levels depend on the rate-limiting processes in the cycle, but we might surmise that an increased rate of cycling could lead to an increase in neurotransmitter Glu, mirrored by a decrease in Gln. The improved spectral dispersion at 7 T allows clear separation and quantification of Glu and Gln resonances, and, on visual activation, we do indeed observe a modest increase in Glu (2% to 3%) and decrease (6% to 8%) in Gln. In addition to sustaining brain activity, the increased Glu/Gln neurotransmitter cycling flux may have an important role in preventing extracellular Glu levels from reaching excitotoxic levels as the blood–brain barrier is impermeable to Glu, even at high concentrations (Hawkins, 2009). Several factors other than increased Glu/Gln cycling may contribute to a change in the concentration of Glu on stimulation, including, as discussed above, an increased activity of the MAS and synthesis of GSH, as well as increased synthesis via anaplerosis or loss through oxidation. The concentration changes reported in Table 1 are quantitatively consistent (within the quoted errors) with the suggested changes in Glu/Gln cycling, MAS activity, and GSH synthesis (based on the changes in associated metabolites (Gln, Asp, GSH). There is thus no evidence for a significant anaplerotic flux, but given the small size of the changes observed, and the proportionately large errors, this remains a possibility.
The inhibitory neurotransmitter GABA is formed by decarboxylation of Glu and is recycled via Gln in a Gln/Glu/GABA. Again we might surmise that stimulation would lead to an increase in flux through this cycle. In our experiments, GABA, like Glu, exhibited a tendency to increase throughout both the single (Figure 5A) and double (Figure 5B) stimulation periods. However, we emphasize that this change did not reach statistical significance.
Conclusions
Using a novel visual stimulation paradigm and 1H-MRS at 7 T, we have been able to observe the time course of the metabolic response to activation. In agreement with previous findings (Mangia et al, 2007a), we observed changes in Glc and Lac consistent with increased energy metabolism due to neuronal activation, and this is supported by the changes in Glu and Asp indicative of an increase in MAS activity. However, the changes we observed in Lac were transient in nature and muted in response to a second stimulus. Our observation of increased Glu with decreased Gln during stimulation can be interpreted as a stimulus driven increase in excitatory neurotransmitter cycling. We also observed similar changes in GABA, but these did not achieve significance. The elevated GSH in the visual cortex in response to visual stimulation is a new observation. Possible explanations for this include detoxification of ROS or clearance of the increased Glu generated during the intense neuronal activation. Glycine, a precursor of GSH, shows a significant decrease on activation, which is consistent with increased GSH synthesis.
Footnotes
Acknowledgements
The authors are grateful to Sam Wharton and Olivier E Mougin for their assistance in MATLAB programming, to Denis Schluppeck for providing the visual stimulus and to the Centre d'Imagerie BioMédicale (CIBM) of the UNIL, UNIGE, HUG, CHUV, and EPFL, Switzerland, for making available to us their LCModel basis data set. The authors also gratefully acknowledge the Medical Research Council for Programme Grand Support and for a Dorothy Hodgkin Postgraduate Award (YL) in partnership with GlaxoSmithKline.
Disclosure/conflict of interest
The authors declare no conflict of interest.