
Abstract
At the moment, there is no direct in vivo evidence of the relative amount of glucose taken up and metabolized by glial cells and neurons, respectively. Therefore, we developed a specific high cellular resolution β-trajectory approach that allows recording and identification of individual tracks of electrons emitted during disintegrations of 14C. We used [14C]2-deoxyglucose (2DG), which is an analog of glucose and is not metabolized further than the first phosphorylation by hexokinase; this property allows localization of the tracer within the cell type where it is phosphorylated. The present technical approach associated a method of cellular trajectography mainly characterized by the high thickness of the emulsion (15 μm), which permits following of the trajectory of individual electrons. This technique was improved to preserve the in vivo label of diffusible compounds such as 2DG and 2DG-6P and associated with immunohistochemical detection of neurons and astrocytes. β-Track counting of labeled compounds was performed in 5 μm glial fibrillary acidic protein (GFAP)- and microtubule-associated protein (MAP)2-immunolabeled paraffin adjacent sections. Of 3,075 counted β-tracks, 53.0% were localized in astrocytes on GFAP-labeled sections and 60.1% in neurons on MAP2-labeled sections. These data represent the first in vivo evidence of the compartmentation of uptake and metabolism of glucose in neurons and astrocytes.
For numerous decades, the uptake of glucose followed by its oxidative degradation was considered to occur in and provide energy to neurons (Sokoloff, 1960; Siesjö, 1978). The classic approach to measure cerebral glucose metabolism in vivo uses an analog of glucose, [14C]2-deoxyglucose (2DG), which is not metabolized further than the first phosphorylation of glycolysis and the product, [14C]2DG-6P, accumulates where it is formed (Sokoloff et al., 1977). However, the spatial resolution of the [14C]2DG autoradiographic technique does not allow identification of the nerve cell type that is using glucose. High-resolution techniques for the autoradiographic localization of glucose or 2DG labeled with 14C or 3H, either alone (Duncan et al., 1986, 1987; McCasland and Woolsey, 1988; Shimada et al., 1989) or combined with immunohistochemistry (McCasland, 1996), have been developed. Although cell layer resolution was achieved showing most often the highest amount of label in the neuropil rich in synapses and astrocytes, no approach was able to reach cellular resolution. Thus, there is still no direct in vivo demonstration of the type of cells, astrocytes, or neurons that take up blood-borne glucose in resting conditions. A recent work on the vagus nerve reported that upon activation, 78% of the glucose is taken up in vivo by Schwann cells and the rest by the axons (Véga et al., 2003).
Oxygen and glucose consumption are coupled in resting conditions in rodent and human brain (Raichle et al., 1976; Yarowski and Ingvar, 1981; Baron et al., 1982; Fox et al., 1986, 1988; Clarke and Sokoloff, 1994). During physiologic activation, some data report a good correlation between cerebral blood flow or glucose utilization and oxygen consumption (Leniger-Follert and Hossmann, 1979; Yarowski and Ingvar, 1981; Baron et al., 1982; Clarke and Sokoloff, 1994), whereas others reveal that transient increases in neural activity lead to disproportionate increase of glucose compared to oxygen utilization that may or may not correlate with lactate accumulation (Fox and Raichle, 1986; Fox et al., 1988; Ackerman and Lear, 1989; Pritchard et al., 1991; Sappey-Marinier et al., 1992; Fellows et al., 1993; Hedera et al., 1995; Madsen et al., 1999). In vitro approaches hypothesized that physiologic activation increases extracellular glutamate, whose uptake by glia stimulates Na+-K+-ATPase and glutamine synthetase activity. This in turn is proposed to stimulate anaerobic glycolysis in glial cells that release lactate, which is transferred to neurons where it is oxidized by the tricarboxylic acid cycle (Tsacopoulos and Magistretti, 1996; Magistretti and Pellerin, 1996, 1999; Pellerin et al., 1998a; Sibson et al., 1998; Magistretti, 2000). According to this astrocyte-neuron lactate shuttle hypothesis, neurons use glial-derived lactate in preference to glucose. However, stimulation of lactate production by glutamate was not observed by all authors in cultured astrocytes (Hertz et al., 1998). Glutamate was even shown to stimulate oxygen consumption (Eriksson et al., 1995) and to be a good substrate for cultured astrocytes (McKenna et al., 1996). In the latter study, glutamate was shown to be more actively metabolized through the tricarboxylic acid cycle when its concentration increased, which suggests that the concentration of glutamate is a major factor determining its metabolic fate in astrocytes (McKenna et al., 1996). At the moment there is still no direct in vivo evidence of the metabolic compartmentation of energy supply between glial cells and neurons, as suggested by the astrocyte–neuron lactate shuttle hypothesis. In addition, although it is clear that lactate is produced during neural activity, the latter hypothesis has been recently challenged. The direct use by neurons of glial-produced lactate as energy substrate during activation has not been shown experimentally, and the kinetic properties of the glycolytic enzymes and extracellular lactate during activation are rather in favor of the direct use of glucose by neurons (Chih et al., 2001; Chih and Roberts, 2003). Finally, it also appears necessary for lactate overproduced upon activation to be rapidly cleared out of the brain to the circulating blood in order to maintain the intracellular redox state supporting lactate production in the presence of normal oxygen levels (Dienel and Hertz, 2001).
To try to gain further insight in this debate and to define the cell type using glucose in the brain in vivo, we developed a specific microautoradiographic imaging procedure to identify individual tracks of electrons emitted during the disintegration of [14C]2DG with improved preservation of in vivo labeling during sample preparation. This approach was coupled to the immunohistochemical characterization of cell types to precisely locate the origin of electron tracks within astrocytes or neurons. The classic 2DG method was used to allow most of the injected tracer to be metabolized to [14C]2DG-6P. Thus, the presence of a β-track within a given cell type indicates that the cell has taken up free [14C]2DG and metabolized it to [14C]2DG-6P. Because 2DG and 2DG-6P are soluble compounds, usually about 90% to 99% of the label is washed out during the fixation procedure (Duncan et al., 1987; McCasland and Woolsey, 1988; Shimada et al., 1989) and it appears difficult to localize the radioactive tracer unambiguously in different cell types by conventional autoradiographic techniques. Therefore, we used a specifically designed discrete electron track procedure for very high precision microscopic detection of radioactive signals (Wittendorp-Rechenmann and Thellier, 1993; Wittendorp-Rechenmann, 1994; Wittendorp-Rechenmann et al., 1998). Part of this work was previously published as a meeting abstract (Wittendorp-Rechenmann et al., 2001) and as a postmeeting technical report (Wittendorp-Rechenmann et al., 2002).
MATERIALS AND METHODS
Animals and [14C]2-deoxyglucose labeling
The experiments were performed on a total of 13 adult male Sprague-Dawley rats (Center d'Elevage René Janvier, Le Genest-St-Isle, France) weighing 280 to 330 g. The animals were kept in uncrowded facilities in a light dark cycle of 12/12 hours (lights on at 7:00 a.m.) with food and water available ad libitum. The [14C]2DG experiments were carried out following a modification of the protocol described by Sokoloff et al. (1977). Briefly, a femoral venous catheter was inserted under light isoflurane anesthesia. The animals were allowed to recover from anesthesia for at least 3 to 4 hours before injection of 2DG to conscious, freely moving animals. Two different trace amounts of [14C]2DG were injected in the animals through the femoral catheter. Eleven rats received 125 μCi/kg [14C]2DG, corresponding to the reference dose used for the 2DG quantitative macroautoradiographic studies (Sokoloff et al., 1977) and 2 rats received a dose of 50 μCi/kg. No blood samples were taken during the experiments, as usually performed in a classic quantitative [14C]2DG experiment where plasma and brain [14C]2DG specific integrated activities need to be calculated. The animals were killed 5 minutes (2 rats) or 45 minutes (11 rats) after [14C]2DG injection. All animal experimentation was performed in accordance with the rules of the European Committee Council Directive of November 24, 1986 (86/609/EEC) and the French Department of Agriculture (license number 67–97).
Tissue processing
Different techniques of labeled brain processing were successively tried to achieve an improved retention of the [14C]2DG labeling within 5-μm-thick brain sections subjected to specific immunohistochemical staining procedures to be compatible with low label [14C]2DG localization at very high cellular resolution.
In the first set of experiments, immediately after decapitation, brains were removed quickly, directly immersed in 4% formaldehyde, fixed for 24 to 48 hours, dehydrated in graded ethanol solutions, i.e., 80% and 90% ethanol containing 0.1% eosin (3 times for 60 minutes followed by an overnight immersion) and 100% ethanol (3 times for 60 minutes). They were then immersed in toluene twice for 5 to 15 minutes, in paraffin at 60°C 3 times for 60 minutes and embedded in paraffin at 60°C overnight. In the second set of experiments, animals were perfusion-fixed with 4% paraformaldehyde in phosphate-buffered saline (PBS) and processed by the formaldehyde-paraffin protocol described above for the nonperfused brains.
Two other experimental series were fixed with microwave irradiation. Microwave fixation appears to be very effective for fixing soluble peptides and proteins and is compatible with autoradiography and immunohistochemistry (Mizuhira and Kasegawa, 1996). In this procedure, the animals were killed in a microwave oven (6 kW, 1.8 seconds) at 45 minutes after the [14C]2DG injection. Then the brains were removed and processed by the standard protocol for paraffin embedding described above starting at the ethanol step. In the fourth set of experiments, the use of graded ethanol solutions during paraffin embedding was replaced by 3 steps of dehydration in 100% ethanol containing 0.1% eosin in the first 2 steps.
Then the 5-μm-thick sections of the brains subjected to the different tissue processing techniques described above were cut with a Leica RM microtome (Leica Microsystèmes, Rueil-Malmaison, France) and mounted onto gelatin-coated glass slides. The paraffin sections were dewaxed for 2 × 1 minute with toluene followed by 2 × 1 minute with 100% ethanol.
Immunohistochemistry
To identify brain cell types, sections obtained under the conditions detailed above were treated either with antibodies against glial fibrillary acidic protein (GFAP) to label the astrocytes, or against microtubule-associated protein (MAP2) to characterize neurons and dendrites. The two immunohistochemical procedures were always performed on adjacent sections that were picked up on slides in such a way that the same cut side of each of the two adjacent sections was exposed to the antibodies, which afterwards allowed the precise localization of the subregions where counting of β tracks was performed. After saturation of unspecific sites performed as previously described (Dubé et al., 1998), sections were incubated for 60 minutes (GFAP) or 150 minutes (MAP2) at 20°C with rabbit polyclonal antibody for GFAP (Dako, Santa Cruz, CA, dilution 1:2,000 in PBS containing goat serum) or a polyclonal mouse antibody for the detection of MAP2 (F. Lasbennes, personal gift, dilution 1:20,000 in PBS containing rabbit serum), respectively. Sections were rinsed twice in PBS containing the appropriate serum and were incubated for 1 hour at 20°C with the secondary antibody, biotinylated goat anti-rabbit antibody, dilution 1:1,000 for GFAP (Vector) and biotinylated anti-mouse antibody, dilution 1:1,000 for MAP2 (Vector) in the corresponding serum/Triton-X100/bovine serum albumin/PBS mixture. Sections were rinsed twice in the latter medium and covered with the ABC reagent (Vectastain Kit, Vector) for 1 hour at 20°C. Sections were rinsed twice in PBS and revealed in PBS with diaminobenzidine, enhanced with nickel chloride. To avoid strong positive chemography resulting from pouring the emulsion on sections coming directly out of the immunohistochemical procedure, preparations were washed in a buffered PBS-Tween-80 solution.
Cellular 14C-immuno-β-trajectography
The autoradiographic procedures that allow localization at the microscopic level of both high- and low-energy β-emitters with a good resolution and a very high recording efficiency have been described in detail previously (Rechenmann and Wittendorp, 1972; Wittendorp-Rechenmann and Thellier, 1993; Wittendorp-Rechenmann, 1994; Wittendorp-Rechenmann et al., 1998). Briefly, a melted Ilford K5 or K2 emulsion (Ilford Photo, Saint-Priest, France) was poured onto the brain sections, previously treated by GFAP and MAP2 immunohistochemistry procedures, to obtain a 15-μm-thick emulsion layer. After an exposure time varying from 1 to 10 days at 4°C, the preparations underwent a 5-minute specific signal enhancement treatment by gold (Wittendorp-Rechenmann and Thellier, 1993) followed by a development with amidol for 15 minutes at 15°C. In some cases, the immunostained [14C]2DG cellular trajectographs were counterstained for 15 minutes with Harris hematoxylin.
The β-trajectography technique uses the ability of sensitive nuclear emulsions to register the passage of ionizing particles such as electrons in the present case. Because the emulsion layer is thick, it allows at least part of the path of the particle to be recorded within the emulsion, and the individual trajectories of charged particles (including electrons) can be materialized by trails of silver grains, called “tracks,” which correspond to the silver halide crystals crossed successively by the incident particle. After development of the emulsion and strictly controlled photographic treatment, easily recognizable three-dimensional images of single electron pathways can be produced. It is easy to discriminate between the silver grains because of chemical fog or artefacts and the developed grains that form the materialized trajectory of an electron. Very low radioactive signals can be detected, down to one disintegration of the incorporated radioisotope, and quantitative estimates of the amount of tracers present in the specimen can be performed at the microscopic level (Wittendorp-Rechenman and Thellier, 1993).
Control of the recovery of labeling after fixation and immunohistochemistry
Nonradioactive sections of rat brain, processed in parallel with radioactive samples, served as controls for positive or negative chemography. The retention of the [14C]2DG label within brain sections was systematically explored by β-scintillation counting for the different types of tissue processing and subsequent immunohistochemical characterization. The results were compared to those of cryostat sections in which the preservation of the in vivo [14C]2DG label corresponds to 100%.
Microscopic analysis
The scanning of the [14C]2DG immuno-β-trajectographs was performed with an optical microscope (Leitz Orthoplan equipped with a Zoom system) using x40, x50, x100 immersion objectives and x12.5 GF oculars, and with a Biocom image processing system (Visiolab, Les Ulis, France). For the quantitative assessment of the number of [14C]2DG tracks located within astrocytes or neurons, adjacent sections treated with GFAP and MAP2, respectively, were examined for each set of experiments. The β-track countings were performed in the hippocampus, auditory cortex, medial geniculate body, and substantia nigra pars reticulata by 2 independent observers directly in the field of the microscope with a calibrated 10 × 10 eyepiece reticule grid (used at a magnification of x625) corresponding to a tissue area of 33,500 μm2. The materialized individual trajectories of the electrons emitted by [14C]2DG are easily recognizable, and their discrimination from the grains because of the chemical fog presents no particular difficulty. For the present investigations, only the β-tracks materialized by a trail of at least four silver grains were taken into account. All other traces or individuals dots were considered as background activity.
RESULTS
Recovery of radioactivity
The β-scintillation counts obtained from the sections prepared with the four different processing protocols were compared to the reference data corresponding to cryostat sections obtained with the standard protocol of the 2DG technique, where the retention of 14C label corresponds to 100% (Fig. 1). Procedures one and two, which consisted of classic treatment for paraffin sections, did not allow preservation of a substantial quantity of the label within the tissue. Indeed, in the case of nonperfused formaldehyde–paraffin brain sections, 99% of label was already washed out during sample processing before immunostaining (data not shown). When brain tissue was perfused before classic paraffin fixation and embedding, the rate of recovery of label was slightly improved but still very low (10% retention of the label), especially after immunostaining procedures (6.5% label retained).
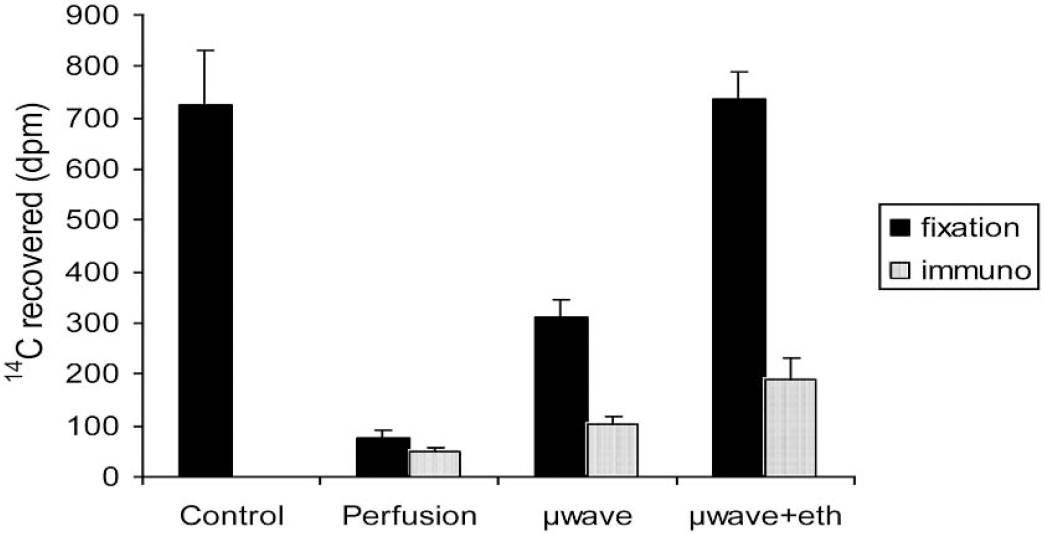
Recovery of 14C label measured by β-scintillation in brain sections after different fixation procedures and immunohistochemistry. Black bars correspond to the recovery after brain fixation and embedding and gray bars represent recovery after fixation, embedding, and immunohistochemistry. The control bar represents the reference label measured in regular macroautoradiographic standard cryostat sections (n = 21). The perfusion bars represent the amount of label in perfusion-fixed brain sections (n = 15), the μwave bars represent brain sections treated with microwave irradiation followed by classic paraffin embedding (n = 15) and the μwave+eth bars correspond to brain sections treated with microwave irradiation followed by 100% ethanol-modified paraffin embedding (n = 15).
The use of a microwave fixation of cerebral tissues, followed by standard paraffin inclusion, allowed recovery of 43% of the label. Lastly, microwave fixation associated with a 3-step dehydration in 100% ethanol, where the solubility of sugars is known to be very low, followed by classic paraffin embedding, allowed retention of 100% of the label before immunostaining. However, subjecting the microwave-fixed sections to an immunohistochemical treatment for GFAP or MAP2 detection induced a further loss of label. Thus, only 14% of label remained after microwave-standard paraffin histology, and 26% of the 14C label could be retained within the microwave-100% ethanol samples after the immunohistochemical procedures.
In the standard surface of 33,500 μm2 defined by our grid reticule, we were able to count a mean of 27.5 tracks (total number including tracks found in GFAP- and MAP 2-positive cells) in sections undergoing a classic treatment for paraffin embedding. The perfusion of brain tissue before classic paraffin embedding raised this number by 2.6-fold (mean of 70.9 tracks). The microwave fixation followed by classic paraffin embedding did not greatly improve the recovery, which rose to a mean of 85.3 per surface unit, thus representing a 20% improvement over the perfusion-fixation procedure. Finally, the microwave-ethanol 100% fixation procedure allowed increase in the recovery of tracks by 73% compared to the regular microwave fixation and by 5.4-fold compared to a standard paraffin fixation technique (mean of 147.6 tracks by surface unit).
Regional variation in the number of β-tracks
Although we improved the retention of radioactive label within brain tissue, we were not able to avoid a large loss of label during the immunohistochemical procedures. Because we used two different immunostaining procedures, we could not know whether or not they would both lead to the same radioactivity loss. Therefore, we counted the number of β-tracks in the same standard surface in sections treated with GFAP or MAP2. The difference between the density of β-tracks after both procedures never differed by more than a factor of 3% to 11% (tested in 15 different assays).
Finally, we also controlled whether the loss of radioactivity would depend on the quantity of [14C]2DG accumulated in the different brain regions and mainly, whether the loss would be more marked in metabolically active compared to metabolically less active regions. Therefore, we performed counts in four different brain regions accumulating various amounts of [14C]2DG in a standard experiment. We compared metabolically active regions such as the auditory cortex and the medial geniculate body, which are among the most active in the brain, to less active regions such as the substantia nigra pars reticulata and the hippocampus (Sokoloff et al., 1977). As can be seen in Table 1, although auditory cortex and medial geniculate body retained the highest amount of label, the number of β-tracks found in the same surface area of substantia nigra pars reticulata and hippocampus was proportionally higher than what could be expected from their known level of glucose utilization. The ratio of track numbers over mean glucose utilization varied by a factor of two between the highly active auditory cortex and the much less active substantia nigra. This most likely indicates that regions with high metabolic activity and hence high concentration of β-tracks are losing more label than less active regions.
Comparison between local cerebral metabolic rates for glucose (LCMRglc) and the number of β-tracks in various areas of the rat brain
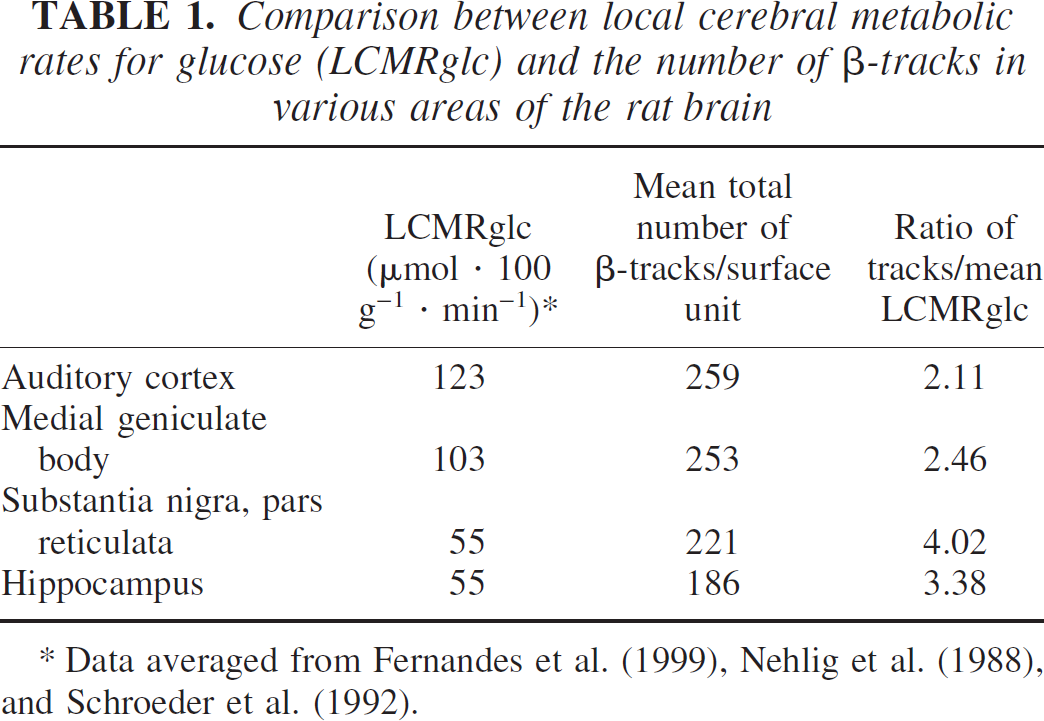
Data averaged from Fernandes et al. (1999), Nehlig et al. (1988), and Schroeder et al. (1992).
Cellular localization of 14C by β-trajectography
In the present study, the best cellular imaging by [14C]2DG immuno-β-trajectography was obtained with the following protocol that associated: (1) in vivo administration of 125 μCi/kg [14C]2DG in adult rats, (2) 45 minutes incorporation time, (3) microwave-100% ethanol paraffin processing, (4) 5-μm-thick adjacent sections subjected to immunohistochemical staining with GFAP and MAP2, (5) micro-imaging by β-trajectography using a 15-μm-thick K5 emulsion, (6) 7 days exposure and (8) an activated development for radioactive signal enhancement. The short duration of the exposure, because of the detection efficiency of the method, lowers the number of parasitic particle tracks to a negligible level. In addition, no washing out of the label was observed outside the sections on the autoradiographic preparations.
We tested a 5-minute [14C]2DG experiment in 2 rats and a 50 μCi [14C]2DG dose in 2 rats. This short time and low dose of tracer were used to avoid problems possibly linked to a too large abundance of tracks within brain tissue after running a classic [14C]2DG experiment with 125 μCi of tracer. However, given the loss of radioactivity that we had to face during the immunohistochemical procedures, we found that the best procedure was to use the standard [14C]2DG protocol as originally defined by Sokoloff et al. (1977), i.e., the injection of 125 μCi [14C]2DG and a 45-minute experiment.
In these conditions, the origin of a significant number of 14C electron tracks could be located with high accuracy within immunohistochemically identified astrocytes and neurons (Figs. 2 and 3). To assess the respective percentage of labeled cells in astrocytes or neurons, β-track counting of labeled GFAP- and MAP2-positive cells was performed in different sets of 14C cellular trajectographs. A total of 3,075 tracks were counted in 6 animals and in 17 sections taken at different levels of the hippocampus (strata pyramidale, radiatum, and oriens), cerebral cortex, and midbrain, each region corresponding to at least 5 different tissue areas of 33,500 μm2 each. Within the 1,725 β-tracks counted within areas selected on the GFAP-treated brain autoradiographs, a mean of 53.0% tracks were localized in GFAP-positive cells, whereas on a total of 1,350 tracks counted within the areas selected on the MAP2-stained brain sections, 60.1% of the β-tracks were localized in MAP2-positive cells (Table 2). These percentages were similar whatever the tissue fixation procedure used, even in sections prepared with standard paraffin histology where the washout of radioactivity reached 99%. Thus, the variable washout of the label did not seem to significantly affect the cellular distribution of the 14C label. Likewise, the percentage of β-tracks counted in GFAP- and MAP2-stained sections was not influenced by a high or low basal level of glucose utilization. It must be noted, however, that because the boundaries of MAP2-labeled neurons are somewhat difficult to precisely delineate, a slight overestimation of the number of β-tracks in neurons cannot be excluded.
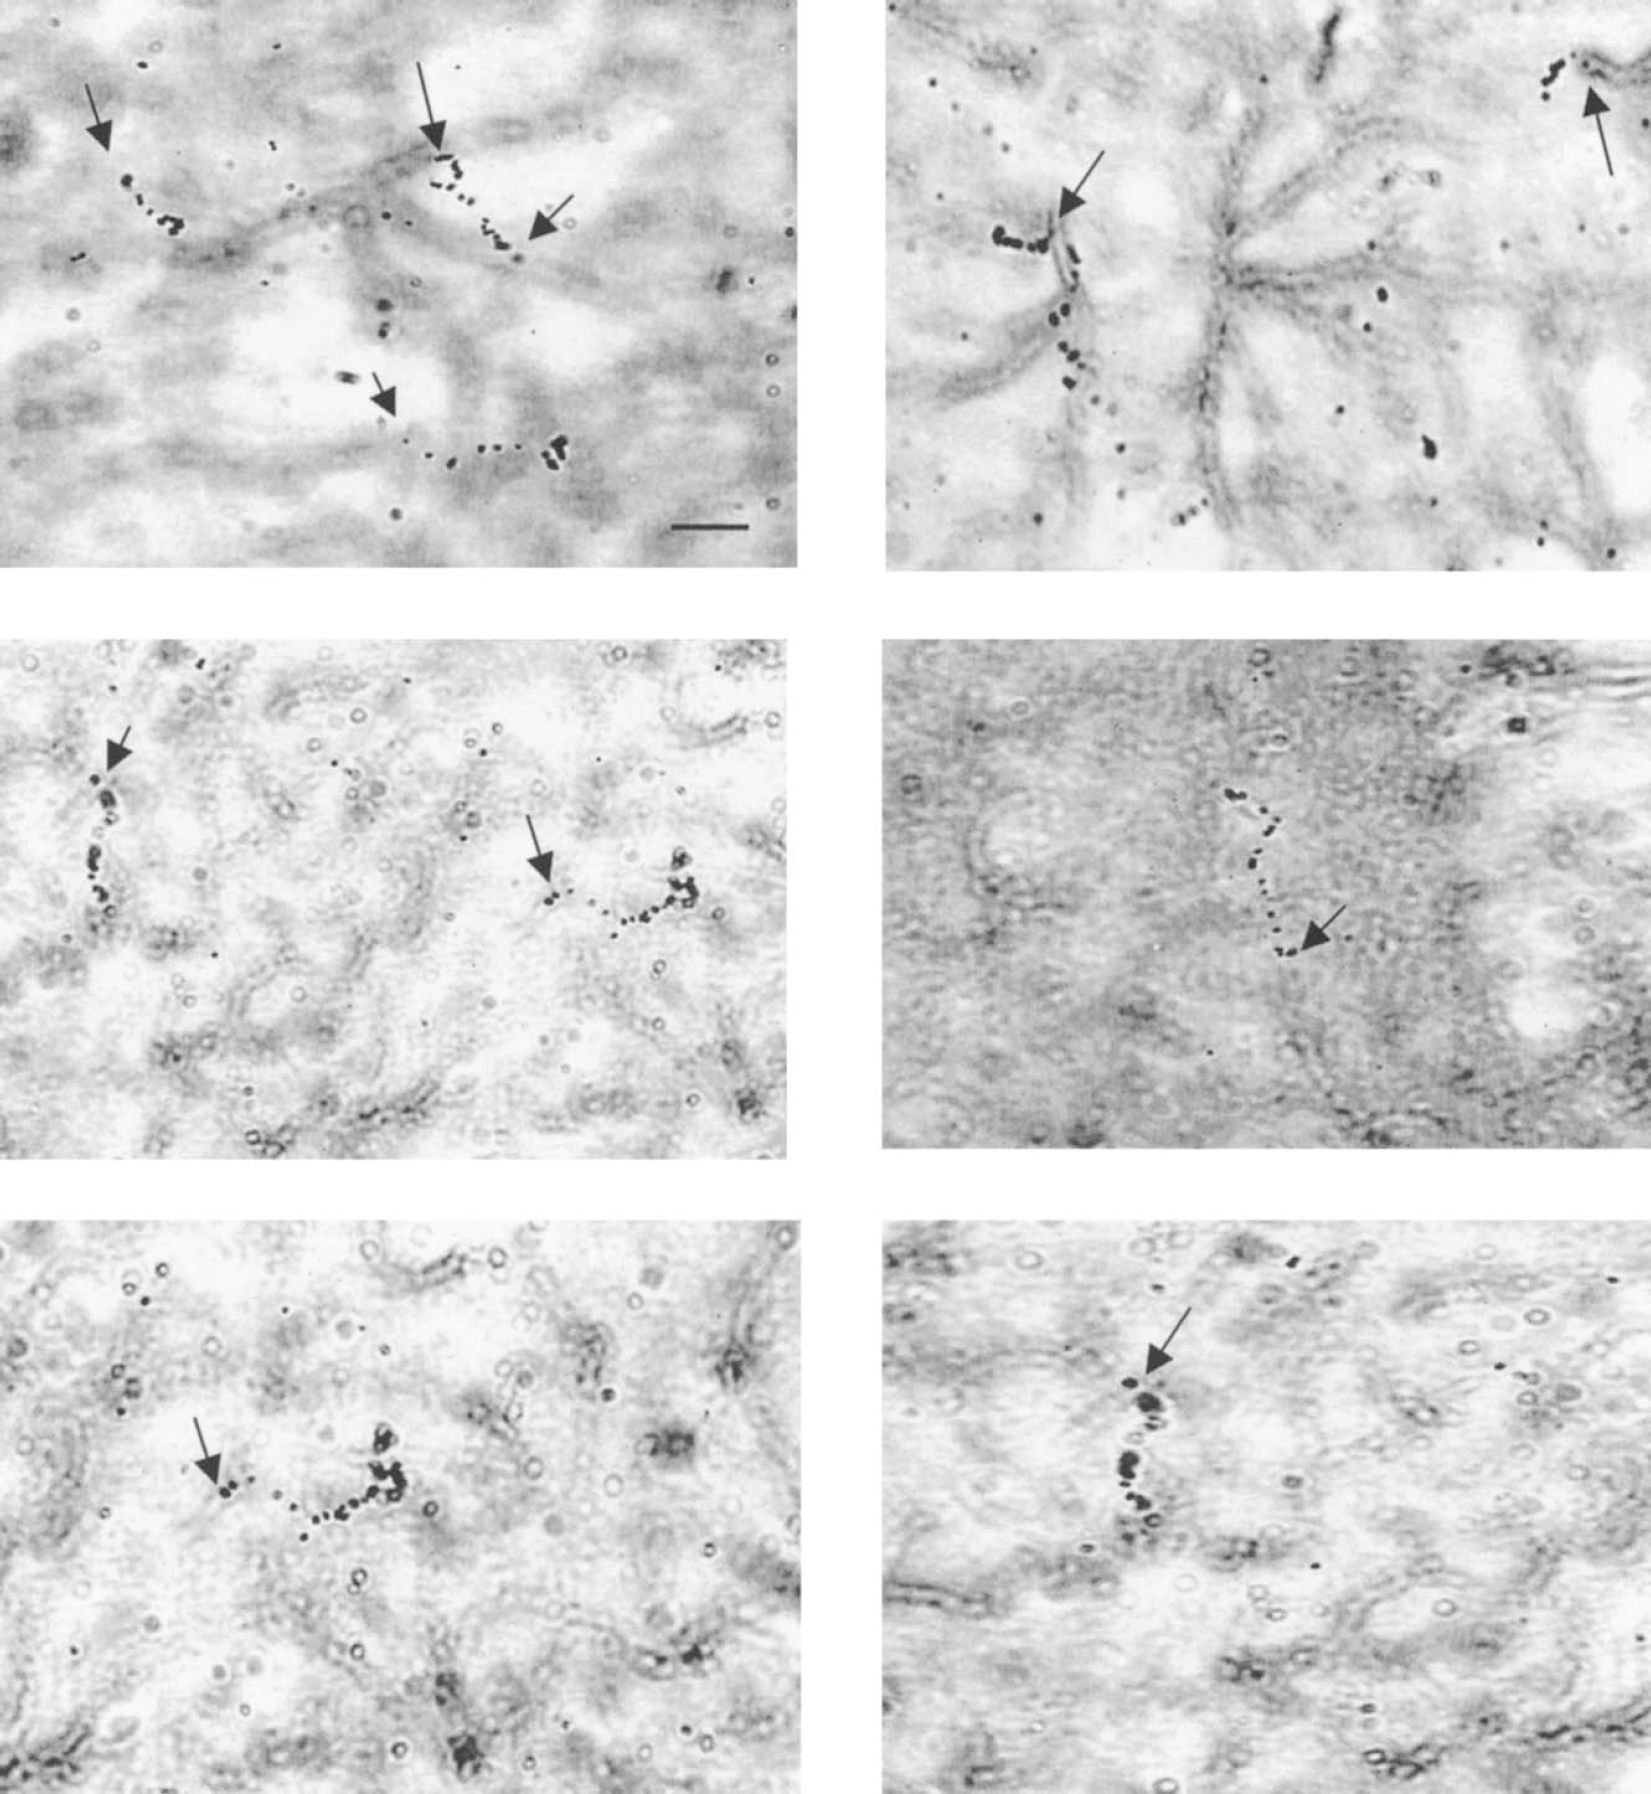
Examples of [14C]2-deoxyglucose β-tracks seen at the microscopic level by β-trajectography in glial fibrillary acidic protein–stained astrocytes. Typical electron tracks emitted by 14C, and represented and materialized by a trail of at least four silver grains can be clearly located, mainly at the level of astrocytic endfeet. Emulsion: Ilford K5. Exposure: 7 days. The arrows indicate the origin of the electron track. Scale bar = 10 μm.
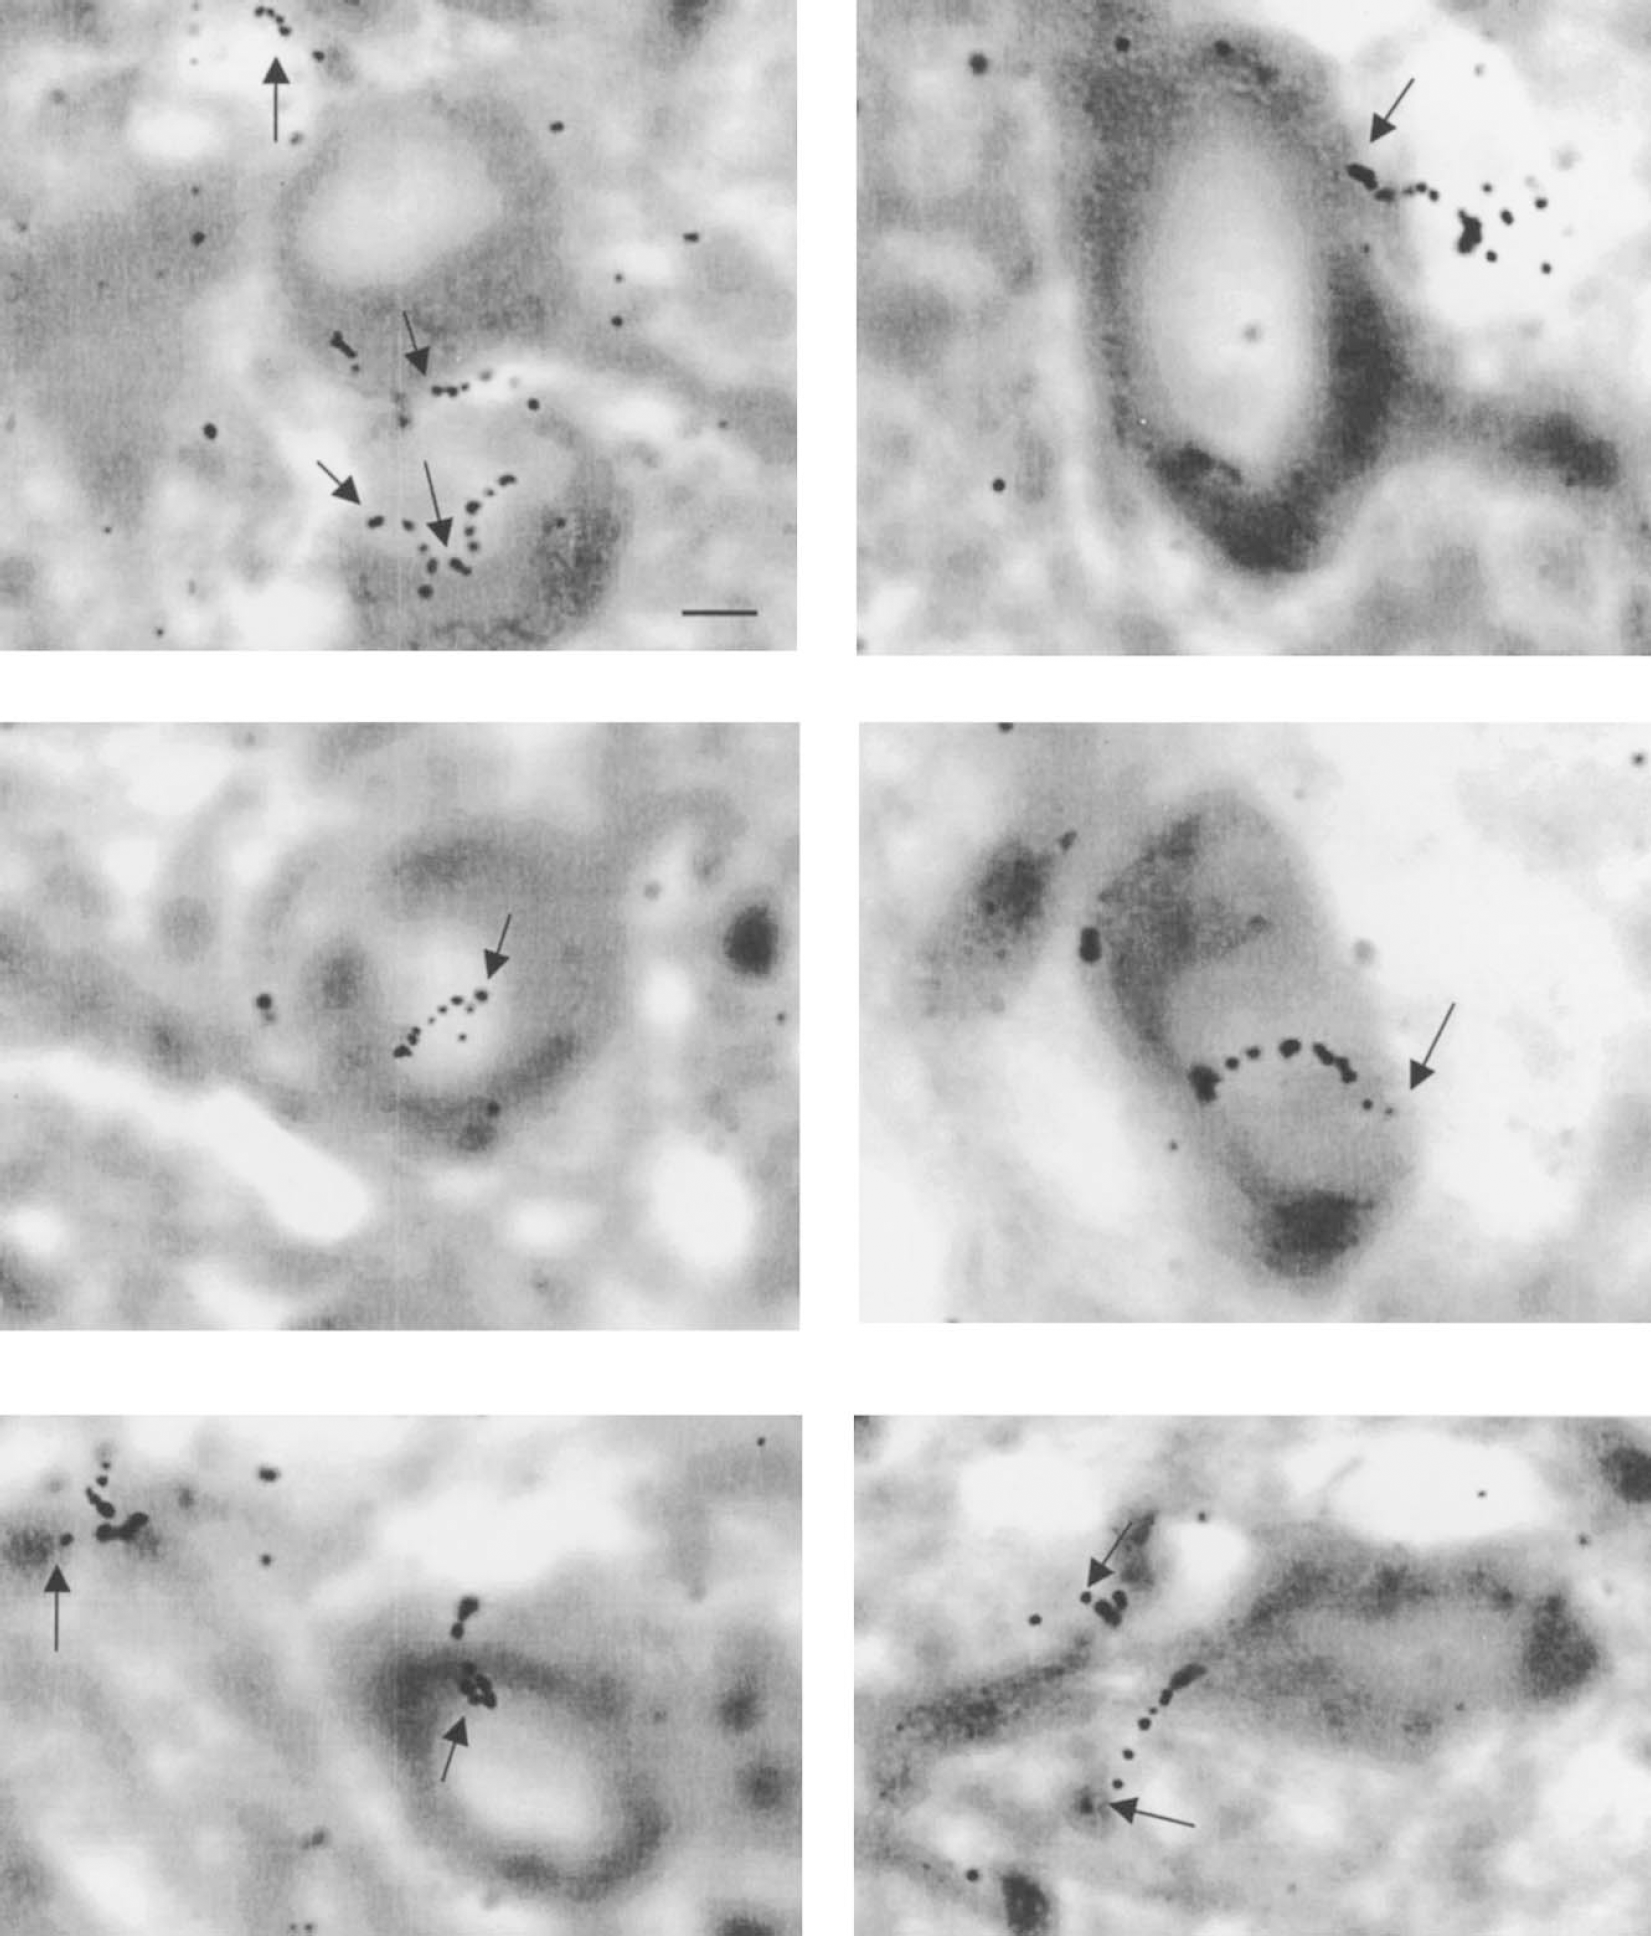
Examples of [14C]2-deoxyglucose β-tracks seen at the microscopic level by β-trajectography in microtubule-associated protein 2–stained neurons. Typical electron tracks emitted by 14C, and represented and materialized by a trail of at least four silver grains can be clearly located, mainly at the level of neuronal cell bodies. Emulsion: Ilford K5. Exposure: 7 days. The arrows indicate the origin of the electron track. Scale bar = 10 μm.
Percentage of β-tracks found in glial fibrillary acidic protein (GFAP)- and microtubule-associated protein (MAP)2-positive cells from the total number of β-tracks present in calibrated brain tissue areas from rat brain sections after various fixation procedures
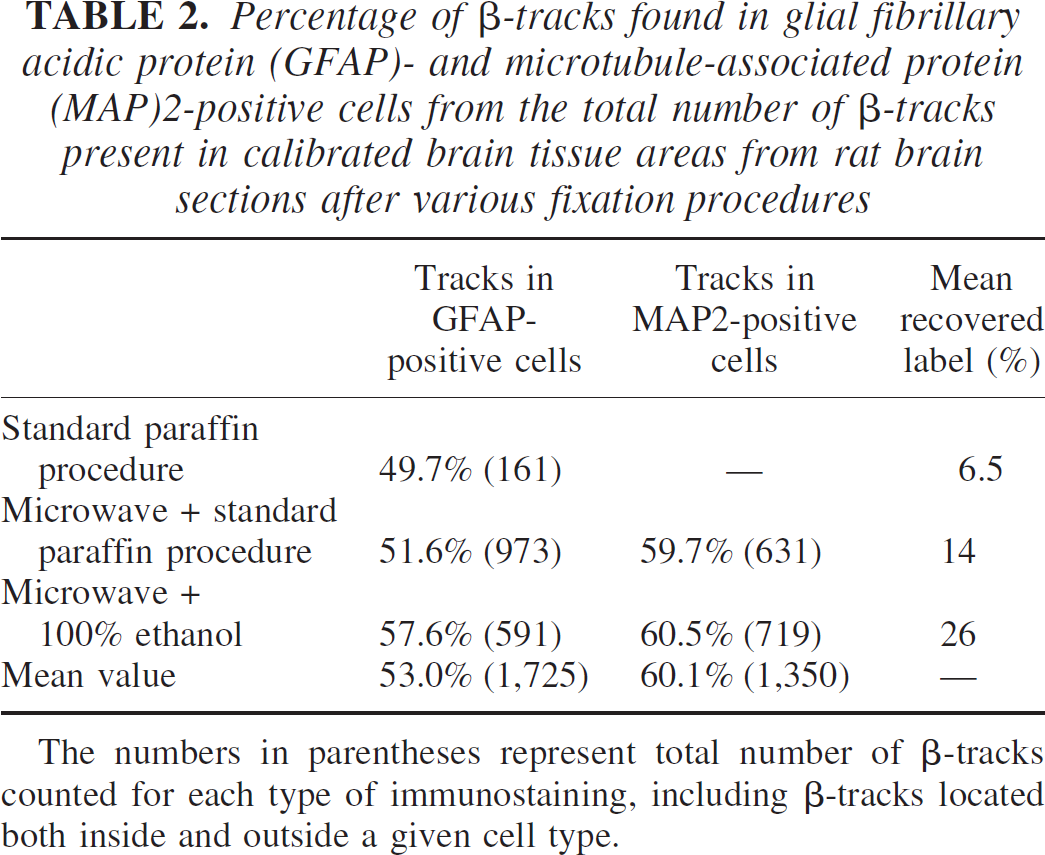
The numbers in parentheses represent total number of β-tracks counted for each type of immunostaining, including β-tracks located both inside and outside a given cell type.
DISCUSSION
The goal of this study was to develop a novel approach allowing precise and efficient tracer targeting of [14C]2DG-labeled brain cells at high cellular resolution. The present data demonstrate the advantage of combining microautoradiographic imaging by cellular β-trajectography with immunohistochemistry for the accurate localization of the uptake of trace amounts of [14C]2DG.
Technical limitations and improvements
The attempt to locate radioactive 2DG uptake at the cellular level dates back to the beginning of the 1980s. Many authors have used [3H]2DG to obtain cellular resolution. However, the main difficulty has been the loss of label from brain cells during tissue processing because [14C]2DG and [14C]2DG-6P are soluble compounds. Many groups used liquid fixation before embedding into resin or paraffin, like the periodate-lysine-paraformaldehyde fixative developed by McLean and Nakane (1974) to improve the resolution of the [3H]2DG traces (Durham et al., 1981; Hammer and Herkenham, 1984; Durham and Woolsey, 1985). Although the regional labeling pattern was close to that of the original method (Sokoloff et al., 1977), label retention was very low. This technique was further modified to increase 2DG incorporation into glycogen and to reduce postmortem glycogenolysis (McCasland and Woolsey, 1988). This improved the retention of label by 10-fold, but retention was still lower than 10% of the original level. This approach was excluded in the present study because it might bias the amount of label recovered in astrocytes since they are the major cells containing glycogen and the macromolecule would resist washout. Other authors mounted frozen sections onto nuclear emulsion–coated slides at low temperatures (Pilgrim and Wagner, 1981; Sharp, 1976) or glued frozen sections dipped in mounting medium that were dried and exposed to paraformaldehyde vapors before being covered with emulsion (Hökfelt et al., 1983). Finally, freeze-drying substitution was also used (Buchner et al., 1979; Buchner and Buchner, 1980; Sejnowski et al., 1980); however, the latter technique can only be used with small pieces of tissue and not with the whole brain. All the above techniques have poor to very poor retention rates ranging from 1% to 9% at most. Moreover, many techniques cannot avoid a translocation of 2DG and 2DG-6P from their in vivo locations. To avoid contact of the tissue with liquids, one group used the dry-mount technique (Stumpf, 1976), but the recovery of label was still low (Duncan et al., 1987, 1988). More recently, a high-resolution [3H]2DG technique was associated with immunostaining for glutamate decarboxylase (McCasland, 1996). The author reported a dramatic improvement of label retention without giving any quantitative value of the percentage of recovery of label.
In the present work, although we were able to largely improve the level of retention of the label, in the best conditions, i.e., microwave irradiation followed by 100% ethanol, we were not able to prevent about 75% label loss during the immunohistochemical procedure. The loss of label has a double origin. First, the repeated incubations in water baths necessary to achieve the binding of the antibody to the protein and its visualization lead necessarily to loss of label. Second, the only available techniques allowing the discrimination between astrocytes and neurons are based on the label of intracellular proteins, which need the antibody to cross a permeated cell membrane to reach the target protein and hence increase further the loss of label from intracellular sites. However, we were able to achieve a label retention of 26%, which is 3 to 25 times higher than all techniques used previously by other authors. In addition to the dramatic improvement in the retention of tissue label achieved by the present approach, the use of 14C- instead of 3H-labeled 2DG usually used by the authors allows significant reduction of the exposure time from 4 to 9 months (Duncan et al., 1987, 1988; McCasland, 1996) to a duration as short as 7 days (the present study).
Because the incubation for GFAP- and MAP2-positive cells is performed on different sections and the β-tracks in neurons and astrocytes are counted in different sections, we checked for the difference in loss of label between the two procedures. The loss of label appears quite consistent and is mostly independent of the immunostaining procedure. However, the incubation procedures may lead to translocation of 2DG-6P from one cell type to another one. In vivo, 2DG-6P, which is a polar compound, does not cross cell membranes and stays in the cell compartment in which the 2DG is phosphorylated. In slices, some parts of the cell membranes are cut and the periods of incubation may allow part of the label to be translocated, but there is no direct way to control for this potential possibility or its extent. Finally, we also controlled whether the loss of label was similar in all brain areas, comparing metabolically active to less active regions. Our data reflect that there seems to be a somewhat larger loss from highly labeled compared to moderately labeled areas. However, the larger loss from highly metabolically active brain regions does not seem to affect differently the sections incubated with GFAP or MAP2. Another bias that may affect the present data is that all the cells of a given type may not be labeled by the antibody, which may lead to an underestimation of the percentage of tracks associated with that cell type.
Finally, it appears that the label was found mostly in astrocytic processes and in neuronal cell bodies. Given the fact that most metabolic activity is taking place in synapse-enriched neuropil, one might expect to find more neuronal tracks near synapses. This is most likely caused by a resolution problem, because the density of astrocytic endfeet is very high in those regions and may have masked tracks from synapses. To clarify this issue, it might be necessary to use a synaptic marker such as synaptophysin to locate the synapse-specific tracks, which was not performed in the present approach.
Cellular Uptake of [14C]2-Deoxyglucose
These data show for the first time that in basal conditions, about half of the blood-borne 2DG is taken up in vivo by neurons, whereas a slightly lower amount appears to be taken up and, at least partly metabolized in astrocytes. Because of their localization close to the capillary wall, astrocytes are the first cell type that blood-borne glucose crosses when entering the brain. Astrocytes are equipped to use glucose and to synthesize amino acids related to the tricarboxylic acid cycle. The present study shows that about 50% of the glucose entering the brain is taken up by and phosphorylated in astrocytes, whereas the other half of the 2DG entering the brain is directly metabolized by neurons.
Thus, the present data are in good accordance with the use of glucose by the two nerve cell populations, and compatible with the astrocyte–neuron lactate shuttle hypothesis (Tsacopoulos and Magistretti, 1996; Magistretti and Pellerin, 1996, 1999; Pellerin et al., 1998a; Sibson et al., 1998; Magistretti, 2000) as well as with the conventional hypothesis, suggesting that glucose is the major substrate during brain activation (Chih et al., 2001; Chih and Roberts, 2003). However, the present study does not allow favoring either of the two hypotheses. Indeed, although the use of 2DG allows us to know precisely in which cell type the substrate is phosphorylated, the exact metabolic fate of the substrate is unknown. Indeed, from the present data, it is impossible to know whether or not the proportion of glucose taken up and phosphorylated by the two cell types will be entirely oxidized or what proportion of the glucose entering astrocytes will be metabolized to lactate to possibly become a metabolic substrate for neurons.
Our approach that uses high-resolution microscopic imaging does not allow taking into account the relative volumes occupied by neurons and astrocytes because we are working at too large magnification and we relate each track to a cellular marker, independently of the volume occupied by each cell type. The current assumption is that neurons represent 50% and astrocytes 33% of the volume of the cerebral cortex in vivo (Norenberg, 1994) and that glial energy needs range from 5% to 20% (Attwell and Laughlin, 2001; Gjedde et al., 2002; Rothman et al., 2003), whereas 80% to 95% of the energy needs concern the neuronal population. Our figures representing about equal amounts of 2DG taken up by the two cell populations are quite far from these assumptions. However, the use of 2DG does not allow one to know the exact metabolic fate of the glucose taken up beyond the first step of the glycolysis mediated by hexokinase. It has been shown that astroglial cell cultures metabolize glucose preferentially to lactate, whereas neuronal cultures readily oxidize glucose to CO2 (McKenna et al., 1993; Itoh et al., 2003). The latter data are also in agreement with the activity of cytochrome oxidase which, in glial cells, may account only for up to 15% of oxidative cerebral glucose utilization (Kageyama and Wong-Riley, 1982). Moreover, the flux values through the tricarboxylic acid cycle determined by stable isotope magnetic resonance techniques in vivo have been calculated to be 2.5-fold lower in astrocytes than in neurons (Cruz and Cerdan, 1999). In cell cultures, [14C]glucose oxidation to CO2 decreases inversely with lactate concentration in the medium, particularly in neurons, whereas the addition of unlabeled glucose to the medium inhibits lactate oxidation to CO2 only in astrocytes but not in neurons, indicating the preference of neurons for extracellular over intracellular lactate arising from neuronal glycolysis (Itoh et al., 2003). According to our data, 53% of the total 2DG entering the brain is taken up by astrocytes, whereas their calculated energy needs only represent up to 20% of the total brain energy needs (Attwell and Laughlin, 2001; Gjedde et al., 2002; Rothman et al., 2003). Therefore, the discrepancy between our results and the studies concerning neuronal and glial energy needs may reflect the fact that the major part of glucose used by astrocytes is only metabolized via anaerobic glycolysis, which provides 18 times less energy than the full oxidative degradation of glucose and will necessarily lead to a higher uptake of glucose than the one based only on calculations of energy needs for this cell population. Conversely, according to our data, neurons take up 60% of the 2DG entering the brain but are considered to meet 80% to 95% of the energy needs of the brain (Attwell and Laughlin, 2001; Gjedde et al., 2002; Rothman et al., 2003). This discrepancy may be accounted for by the use of alternate substrates to glucose such as lactate formed by astrocytes, as repeatedly shown in in vitro studies (Tsacopoulos and Magistretti, 1996; Magistretti and Pellerin, 1996, 1999; Sibson et al., 1998; Itoh et al., 2003). A recent study performed on the desheathed rat vagus nerve reported that 78% of the uptake of 2DG occurs in Schwann cells, suggesting that a metabolic substrate is transferred from Schwann cells to axons (Véga et al., 2003). The difference between the latter study and the present one is that ours was performed in basal conditions, whereas that of Véga et al. (2003) was performed under stimulation. The larger uptake of 2DG by glial cells measured in the latter study compared to the present one is in favor of activation-related stimulation of glucose uptake by the glial cells and transfer of a substrate to neurons when axonal energy needs are increased by conduction of action potentials.
The present study clearly confirms the direct active use of glucose by both neurons and astrocytes. Glucose enters the brain via two main facilitative glucose transporters, GLUT1 and GLUT3. The glucose transporter GLUT1 is located at the blood–brain barrier endothelium (55 kDa isoform) and in the perivascular endfeet of astrocytes (45-kDa isoform) (Gerhart et al., 1989; Vannucci et al., 1997). GLUT1 density correlates well with capillary density, which is a major determinant of GLUT1 density in the brain (Duelli and Kuschinsky, 2001). GLUT3 is found in neurons (Vannucci, 1994; Vannucci et al., 1997) and its density is regulated by nutritional and environmental factors. A positive correlation can be found between GLUT1 and GLUT3 local densities and local rates of cerebral glucose utilization, which outlines that local cerebral glucose utilization determines the glucose transporter densities (Duelli and Kuschinsky, 2001). The regional increase in the density of neuronal GLUT3 transporter occurring during postnatal development (Vannucci, 1994; Vannucci et al., 1998) parallels the increase in cerebral glucose utilization in specific brain regions (Nehlig et al., 1988). Moreover, the transport of glucose by GLUT3 in neurons is about seven times faster than the transport by GLUT1, the main glial glucose transporter (Vannucci et al., 1997). GLUT1 density and hexose transport have been shown to increase upon stimulation by glutamate in cultured astrocytes. This phenomenon occurs over the range of a few seconds, which represents the fastest stimulation of mammalian glucose transport yet known (Loaiza et al., 2003). This rapid regulation of GLUT1 renders glucose readily available for active brain areas and would be concurrent with increased cerebral glucose utilization and blood flow in activated areas (Sokoloff, 1981; Macrae et al., 1993; Waschke et al., 1996) and mainly in astrocytes (Zonta et al., 2003). Furthermore, the regional density of MCT1, the monocarboxylate transporter that is located at the blood–brain barrier, but also in astrocytes and neurons (Gerhardt et al., 1997; Pellerin et al., 1998b), is correlated with both the regional density of GLUT1 (Maurer et al., 2004) and with rates of local cerebral glucose utilization (Duelli et al., 2000). This implies that regions with high glucose uptake and utilization are also able to transport increased amounts of monocarboxylates (Maurer et al., 2004).
In conclusion, the data of the present study report for the first time a quantitative in vivo measurement of the amount of 2DG used by neurons and astrocytes in the resting brain. They show that about half of the glucose uptake takes place in neurons and the other half in astrocytes. However, these proportions do not fit the predictions based upon estimated energy needs of the two cell populations; thus, our current concepts on brain energy metabolism at the cellular and molecular levels still need further investigation.
Footnotes
Abbreviations used
Acknowledgments:
The excellent technical assistance of Estelle Koning is gratefully acknowledged.