
Abstract
Potential roles for lactate in the energetics of brain activation have changed radically during the past three decades, shifting from waste product to supplemental fuel and signaling molecule. Current models for lactate transport and metabolism involving cellular responses to excitatory neurotransmission are highly debated, owing, in part, to discordant results obtained in different experimental systems and conditions. Major conclusions drawn from tabular data summarizing results obtained in many laboratories are as follows: Glutamate-stimulated glycolysis is not an inherent property of all astrocyte cultures. Synaptosomes from the adult brain and many preparations of cultured neurons have high capacities to increase glucose transport, glycolysis, and glucose-supported respiration, and pathway rates are stimulated by glutamate and compounds that enhance metabolic demand. Lactate accumulation in activated tissue is a minor fraction of glucose metabolized and does not reflect pathway fluxes. Brain activation in subjects with low plasma lactate causes outward, brain-to-blood lactate gradients, and lactate is quickly released in substantial amounts. Lactate utilization by the adult brain increases during lactate infusions and strenuous exercise that markedly increase blood lactate levels. Lactate can be an ‘opportunistic’, glucose-sparing substrate when present in high amounts, but most evidence supports glucose as the major fuel for normal, activated brain.
Glucose is the major fuel for the brain, and its metabolism by different pathways has important functions related to energetics, neurotransmission, oxidation–reduction (redox) reactions, and biosynthesis of essential brain components (Figure 1). For many decades, lactate production in the brain was viewed as a consequence of inadequate oxygen delivery, disruption of oxidative metabolism, or mismatch between glycolytic and oxidative rates (Siesjö, 1978), but more recently, the conceptual role of lactate metabolism and function in the normal brain have undergone major changes, shifting from developmental fuel and glycolytic waste product to include its use as a supplemental fuel and signaling molecule. Starting in the 1970s to 1980s studies carried out in different laboratories with diverse experimental interests related to brain function brought attention to upregulation of glycolysis, lactate production, lactate release into the blood, the possibility of lactate shuttling among cell types within the brain, lactate fueling adult brain during exercise, and roles of lactate in the regulation of blood flow; some of these topics are controversial and highly debated. The experimental paradigm and physiologic status of subjects are critical for interpretation of data, and this review first presents a brief historical overview of studies related to brain lactate transport and metabolism, then compares sets of data to provide a perspective and context within which the consistency of similar experiments and their
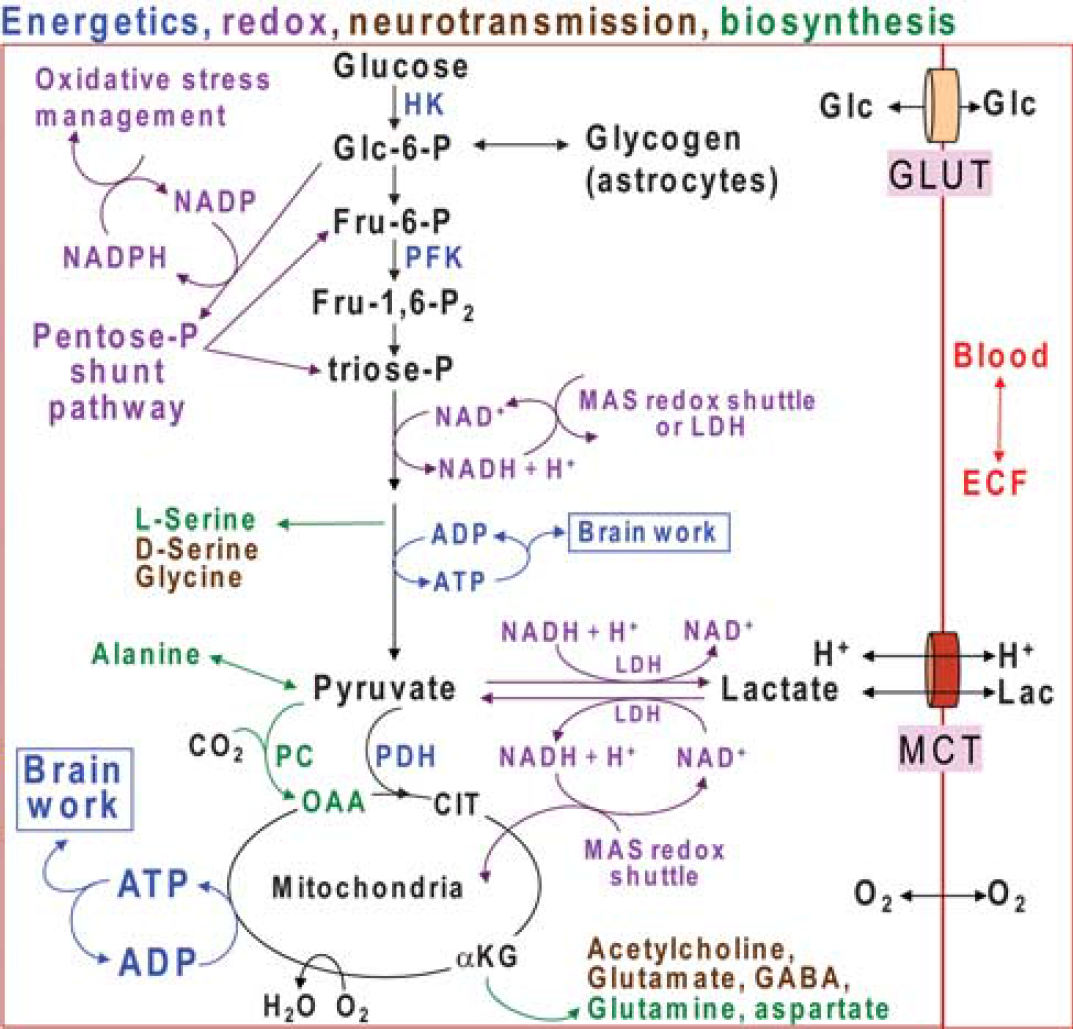
Multifunctional roles of glucose metabolism. Color coding denotes different functional roles of pathways of glucose metabolism. Glucose (Glc) and lactate (Lac) plus H+ are transported into brain cells from blood or extracellular fluid (ECF) by equilibrative transporters, GLUTs and MCTs (monocarboxylic acid transporters), respectively, whereas oxygen diffuses into brain cells. Energetics (blue) involves ATP production by the glycolytic (glucose to pyruvate; Fru=fructose) and oxidative (pyruvate to CO2 + H2O) pathways. Glycolytic rate is modulated by regulation of hexokinase (HK), phosphofructokinase (PFK), and other enzymes. Glucose is stored as glycogen, mainly in astrocytes. Pyruvate enters the oxidative pathway of the mitochondrial tricarboxylic acid cycle, with formation of 3 CO2 and regeneration of oxaloacetate (OAA). Neurotransmitters and neuromodulators (brown) are synthesized through the glycolytic and oxidative pathways. Other biosynthetic pathways produce amino acids (green) and sugars (not shown) used to synthesize complex carbohydrates for glycoproteins and glycolipids. Net synthesis of a ‘new’ four- or five-carbon compound (aspartate, glutamate, glutamine, GABA) requires pyruvate carboxylase (PC), which is only located in astrocytes. CO2 fixation by PC converts pyruvate to OAA. OAA is transaminated to form aspartate or it condenses with acetyl CoA derived from a second pyruvate molecule by the action of pyruvate dehydrogenase (PDH) to form citrate (CIT). Decarboxylation of this ‘new’ six-carbon compound forms
Brief Thematic and Historical Perspective of Brain Lactate Metabolism and Trafficking
Compartmentation of Lactate Metabolism in the Brain
During the 1960 to 1970s,
Rapid Lactate Release from the Brain into the Blood
Hawkins et al (1973) showed that an ammonia injection increases the rate of cerebral glucose utilization (CMRglc) and oxygen consumption (CMRO2) in the rat brain and increases lactate release to blood from 3.5% (as glucose equivalents) of glucose uptake at rest to 15% after ammonia. The brain lactate level was less than that in blood, suggesting sites with locally high lactate levels from which lactate diffused into blood. In humans, positron emission tomographic imaging studies using [11C]glucose detected release of 11C-acidic metabolites into blood within 4 minutes (Blomqvist et al, 1990). During spreading cortical depression, release of 14C-lactate was detectable within 2 minutes after pulse labeling of the rat brain with [6-14C]glucose; maximal lactate efflux equaled 20% of glucose uptake, and [14C]lactate accounted for nearly all of the 14C discharged into the blood (Cruz et al, 1999). In humans given stressful mental testing, lactate release corresponded to 7% of glucose uptake (Madsen et al, 1995). The above studies show that the resting brain also releases small amounts of lactate (∼3% to 7% of glucose uptake), and that lactate efflux quickly increases by 3- to 4-fold during activation. A recent positron emission tomographic study in a resting young adult human brain revealed regional heterogeneity in the mismatch between local rates of glucose and oxygen utilization (Vaishnavi et al, 2010), suggesting that lactate release from various brain structures probably differs under basal conditions.
Lactate Release from Brain Cells
Lactate is released in larger quantities from ‘resting’ cultured astrocytes than neurons, but both cell types produce lactate under various conditions (Walz and Mukerji, 1988). Dringen et al (1993) discovered that lactate, not glucose, is released from cultured astrocytes during glycogenolysis, and suggested that lactate may function as fuel for neighboring cells. These and related
Underestimation of Metabolic Activation with Labeled Glucose and Lactate Release from the Brain
Functional metabolic brain imaging studies in conscious rats (Collins et al, 1987; Ackermann and Lear, 1989; Adachi et al, 1995; Cruz et al, 2007) and humans (Blomqvist et al, 1990) found that the magnitude of increased CMRglc evoked by sensory stimulation, seizures, spreading depression, and voluntary finger tapping was greatly underestimated (by approximately 50%) with labeled glucose compared with labeled deoxyglucose, suggesting upregulation of glycolysis and rapid lactate release (Collins et al, 1987; Lear and Ackermann, 1989; Lear, 1990). Studies that our laboratory designed to understand the neurobiology underlying the above discrepant results obtained with glucose and deoxyglucose showed that brain lactate is quickly labeled by blood glucose, lactate is readily diffusible, and rapid lactate efflux to the blood causes loss of labeled products from the brain (Adachi et al, 1995; Cruz et al, 1999; Dienel and Cruz, 2009). Focal label retention in activated structures is enhanced by blockade of lactate transporters and astrocytic gap junctions (Cruz et al, 2007), and astrocytes have a much higher rate and capacity for lactate uptake from extracellular fluid and for dispersion within the astrocytic syncytium compared with lactate shuttling from astrocytes to neurons (Gandhi et al, 2009). Most lactate derived from glucose microinfused into interstitial fluid is not locally oxidized, and extracellular metabolites are released through perivascular flow into the lymphatic drainage systems (Ball et al, 2010). Taken together, these findings indicate that increased glycolysis during activation is associated with substantial loss of lactate from the brain through vascular and perivascular drainage systems within 5 minutes in normal subjects with low blood lactate levels (∼0.5 to 1 mmol/L) and modest (∼2-fold) or large (>3- to 8-fold) increases in brain lactate level.
‘Uncoupling’ of Cerebral Blood Flow, Oxygen Consumption (CMRO2), and CMRglc During Sensory and Mental Stimulation
In the resting brain, nearly all of the glucose metabolized is oxidized, and many, but not all, studies report that the resting CMRO2/CMRglc ratio is close to the theoretical maximum of 6.0 (i.e., 6 O2 are required to oxidize 1 glucose). However, during activation, disproportionately larger increases in cerebral blood flow (CBF) and CMRglc compared with CMRO2 were reported by Fox and Raichle (1986) and Fox et al (1988), and confirmed in humans (Madsen et al, 1995) and rats (Madsen et al, 1999). The CMRO2/CMRglc ratio falls in most, but not all, activation studies by a variable magnitude, showing that nonoxidative metabolism usually increases much more than oxidative metabolism, which can be either unchanged or increased somewhat (∼10% to 25%), depending on the paradigm and brain structures involved (Dienel and Cruz (2008) and cited references). The basis for this phenomenon (sometimes called aerobic glycolysis) remains to be elucidated, and it contrasts the brain's capacity to increase CMRO2 by 2- to 3-fold during seizures and maintain the increase for 2 hours (Meldrum and Nilsson, 1976; Borgström et al, 1976). The activation-induced CMRO2–CMRglc mismatch is consistent with increased glycolysis without local oxidation of the lactate equivalents generated.
Lactate and Neuronal Function in Brain Slices
Levels of lactate transporters at the blood–brain barrier and enzymes that metabolize ketone bodies decrease drastically after weaning (Cremer, 1982; Vannucci and Simpson, 2003), and blood lactate and ketones are not major fuels for the adult brain unless their concentrations increase markedly. However, during hypoxia/ischemia, glucose/glycogen-derived lactate accumulates in brain tissue. The notion that lactate may ‘jump start’ neuronal recovery after restoration of blood flow and oxygen delivery was proposed after the discovery that lactate supported electrically evoked action potentials in brain slices (Schurr et al, 1988; Schurr, 2006). However, other investigators previously found that lactate and other alternative substrates cannot substitute for glucose, and evoked action potentials fail even though ATP levels are maintained (see Figure 4 and related text in Dienel and Hertz (2005)). The ability of lactate to support evoked action potentials depends on the speed of slice preparation and other technical issues that are not fully understood (Okada and Lipton, 2007). Moreover, lactate cannot prevent anoxic depolarization in slices from P12 and P28 rats when glycolysis is completely inhibited (Allen et al (2005) and discussion therein). These findings indicate that lactate oxidation can support cellular functions or contribute to brain energetics under specific experimental conditions. However, glycolytic metabolism of glucose satisfies critical functions (Figure 1) that cannot be fulfilled by lactate or mitochondrially generated ATP, and maintenance of specific brain function requires glucose, not lactate, under many experimental conditions.
Extracellular Lactate Levels Increase During Activating and Pathophysiologic Conditions
Microdialysis (Korf and de Boer, 1990) and microelectrode (Hu and Wilson, 1997a, ) technology enabled monitoring of extracellular glucose and lactate levels. Many investigators have reported ∼2-fold increases in extracellular lactate levels during various behaviors or stresses, and these findings are often used to support the idea that glycolytic flux increases. However, lactate concentration changes must be interpreted with caution (Veech, 1991) because metabolite concentration is the net result of input to and output from a pool, and it does not report flux through the pool.
Lactate and Excitatory Neurotransmission
In 1994, Pellerin and Magistretti (1994) reported that glutamate stimulated CMRglc and lactate release in cultured astrocytes, and proposed that glutamate uptake stimulates astrocytic glycolysis and the lactate serves as fuel for nearby neurons. This concept, the astrocyte–neuron lactate shuttle hypothesis, posits that (1) the two ATP required by astrocytes to dispose of the Na+ taken up with glutamate and to convert glutamate to glutamine are satisfied by glycolysis and (2) there is a predominant cellular compartmentation of glycolytic and oxidative metabolism in astrocytes and neurons, respectively, during excitatory neurotransmission, with lactate shuttling to neurons and neuronal oxidation of lactate as major fuel (Hyder et al, 2006; Pellerin et al, 2007; Pellerin, 2008; Magistretti, 2009; Jolivet et al, 2010).
Cerdán et al (2006) proposed a different mechanism and role for astrocyte–neuron lactate trafficking, i.e., redox shuttling in which reducing equivalents are hypothesized to be transferred from astrocytes to neurons. In this model, lactate release from astrocytes and its uptake and oxidation to pyruvate in neurons transfers NADH to neurons. However, the pyruvate is not retained and oxidized in the neurons. Instead, pyruvate is released, taken up by astrocytes, and reduced to lactate to regenerate NAD+ in the astrocyte. This mechanism could thereby support glycolytic metabolism in astrocytes by means of a transcellular redox shuttle cycle instead of the intracellular, malate–aspartate shuttle (MAS) that transfers reducing equivalents from cytoplasmic NADH to the mitochondria for oxidation and ATP generation (Figure 1).
Discordant metabolic effects of glutamate on cultured astrocytes, complex biochemical and cellular responses to activation, oxidation of lactate by both neurons and astrocytes
A contrasting transport-metabolism model that emphasizes concentrations and kinetic properties of cellular glucose and lactate transporters predicts that neurons take up most glucose during activation and release lactate to astrocytes, i.e., a neuron-to-astrocyte lactate shuttle (Simpson et al, 2007; Mangia et al, 2009b, 2011; DiNuzzo et al, 2010a, ). A mechanism that may explain, in part, increased neuronal lactate production during activation comes from
To sum up, the role of lactate during activation has been a difficult, controversial topic owing, in part, to technical difficulties associated with comprehensive, quantitative
Lactate is Fuel for the Human Brain when Exercise Increases Blood Lactate Levels
During strenuous physical work, human plasma lactate increases from ∼0.5 to 1 mmol/L to 20 to 30 mmol/L, and whole-brain studies of metabolic activity during exercise reveal progressive increases in brain lactate uptake and metabolism as work load and plasma lactate levels increase (Ide et al, 1999, 2000). Blood lactate is oxidized in the brain and more glucose is also consumed during exhaustive exercise, but there is also a decline in the oxygen/(glucose+½ lactate) utilization ratio from ∼6 to as low as 1.7, and there is a large, unexplained excess carbohydrate taken up into brain that is not accounted for by oxidative metabolism or tissue metabolite accumulation or release (Dalsgaard, 2006; Quistorff et al, 2008; van Hall et al, 2009).
Lactate can Stimulate Vasodilation
Gap junction-coupled astrocytes can avidly take up lactate from extracellular fluid and are poised to discharge it from their endfeet into perivascular fluid where pulsatile pressure can drive the lactate along the vasculature (Gandhi et al (2009); Ball et al (2007, 2010) and cited references). Several studies have reported that lactate increases vasodilation by different mechanisms (Hein et al, 2006; Yamanishi et al, 2006; Gordon et al, 2008), and continuous lactate release from the activated brain may serve a signaling function to increase blood flow and fuel delivery to the brain. As glucose delivery to the brain exceeds demand for glucose over a wide range of CMRglc (Cremer et al, 1983; Hargreaves et al, 1986), lactate release and its use as a blood flow regulator need not be a ‘waste’ of fuel, because lactate can be used by peripheral tissues as fuel or as a gluconeogenic substrate.
Summary
Evidence for increased glycolysis and lactate release from the brain to the blood during brain activation in normal subjects with low plasma glucose levels during normal and pathophysiological conditions has accumulated since the 1970s. Strenuous exercise increases blood lactate levels and floods the brain with an alternative substrate that is oxidized in increased amounts. Flooding experiments in cultured cells and brain slices also show lactate oxidation and reduced glucose utilization, and these assays mimic strenuous exercise, not sedentary subjects. Lactate is generated and oxidized by neurons and astrocytes, but the magnitude and direction of cell-to-cell lactate shuttling coupled to its oxidation or release from the brain remains to be established
Aspects of Experimental Systems Relevant to Interpretation of Lactate as Brain Fuel
The lactate literature is very extensive and involves many different experimental systems. Experiments often focus on specific aspects of a more complex system, and comparative data interpretation requires a broad perspective, context, and attention to experimental details.
Properties and Physiology of the Experimental System
Assessment of all studies must take into account age, nutritional status, anesthesia, and physiologic state. Brain growth and metabolic and functional development have enormous spurts between 10 and 21 days, with slower increases thereafter (Baquer et al, 1975). Particular care must be taken when translating findings obtained in cells or tissue from prenatal, early postnatal, and weanling subjects to the adult brain owing to downregulation of specific transport and metabolic activities after weaning and to continued brain grown for weeks after weaning. Brain slices obtained from immature or adult brains have cell–cell interactions acquired through normal development, but they are damaged by preparative procedures and postmortem ischemia and have lower metabolic rates than
Lactate Concentration and Utilization Rates
Brain lactate concentration in normal, carefully handled resting subjects is ∼0.2 to 1
Fractional Contribution of Lactate to Overall Metabolism
Lactate is sometimes called a ‘preferred substrate’ compared with glucose. Within this context, the notion of ‘equi-caloric’ concentrations of glucose and lactate (1 glucose=2 lactate) is sometimes used as a framework for testing relative concentrations of each substrate. However, this is a specious concept because glycolysis is highly regulated (by activation and inhibition) at many steps, whereas lactate dehydrogenase (LDH)-mediated formation of pyruvate from lactate is an equilibrative reaction (lactate + NAD+ ↔ pyruvate + NADH + H+) that is not governed by metabolic demand nor fine-tuned by intricate regulation. Lactate concentration is influenced by pyruvate level, pH, NADH/NAD ratio, and other reactions coupled to the NADH–NAD redox system (Veech, 1991). Lactate cannot fulfill many functions of glucose metabolism (Figure 1) and elevated concentrations of lactate reduce glucose utilization in a concentration-dependent manner in cultured astrocytes (Swanson and Benington, 1996; Rodrigues et al, 2009), cultured neurons (Bouzier-Sore et al, 2006), and brain
Transport of glucose and of lactate plus H+ is equilibrative, and unidirectional uptake rates will increase with substrate concentration until the transporters are saturated. Brain glucose levels are typically ∼20% to 25% that of arterial plasma, and once hexokinase is saturated (its
Different monocarboxylic acid transporter (MCT) and LDH isoforms are present in neurons and astrocytes. These isoforms can influence the concentration dependence of the proportion of lactate taken up and metabolized by either cell type because of differences in their
Many investigators have used high-lactate flooding experiments, and a critical issue that is not always addressed in competitive substrate assays is dilution of labeled pyruvate when labeled glucose or lactate is the tracer. This is important because pyruvate concentration is 10- to 13-fold lower than lactate owing to the LDH equilibrium constant. To interpret inhibition of metabolism of pyruvate derived from glucose compared with that derived from lactate, the specific activity or fractional enrichment of pyruvate (i.e., the ratio of the labeled to unlabeled pyruvate) must be determined and used to calculate the effects of different concentrations of lactate or glucose added to the assay. For example, if labeled glucose generates pyruvate with a specific activity of 1, and addition of unlabeled lactate reduces pyruvate specific activity to 0.5 and the amount of glucose oxidized by 50%, then lactate had no effect on glucose oxidation. In other words, lactate only depressed pyruvate specific activity and, therefore, reduced the fraction of labeled pyruvate that entered the oxidative pathway. Increasing the level of unlabeled lactate will overwhelm labeling of pyruvate by glucose, whereas increasing glucose concentration will not have much effect on pyruvate labeled by lactate because of regulated metabolism of glucose.
Summary
High levels of extracellular lactate can ‘flood the system’ and provide a nonregulated source of pyruvate, thereby influencing glucose utilization. However, a ‘preference’ for lactate that arises from fine-tuned regulation glycolytic enzyme activities by many metabolites is not the same as preferring one of different candies of identical composition and caloric content. If brain-derived lactate was highly ‘preferred’ over blood-borne glucose as fuel, why would any lactate be released from the brain? Other factors must be involved in substrate utilization. The apparent simplicity of brain lactate metabolism and trafficking during brain activation
Unexplained Discordant Results Underlie Lactate-Related Controversies
When viewed in isolation, various studies may seem to support or oppose a model for brain lactate metabolism, but when evaluated within a broad context of different data sets related to the same issue, each set can ‘speak for itself’ and trends or anomalies are easily recognized.
Glutamate Transport-Evoked Glycolysis is not a Robust, Intrinsic Property of all Cultured Astrocytes
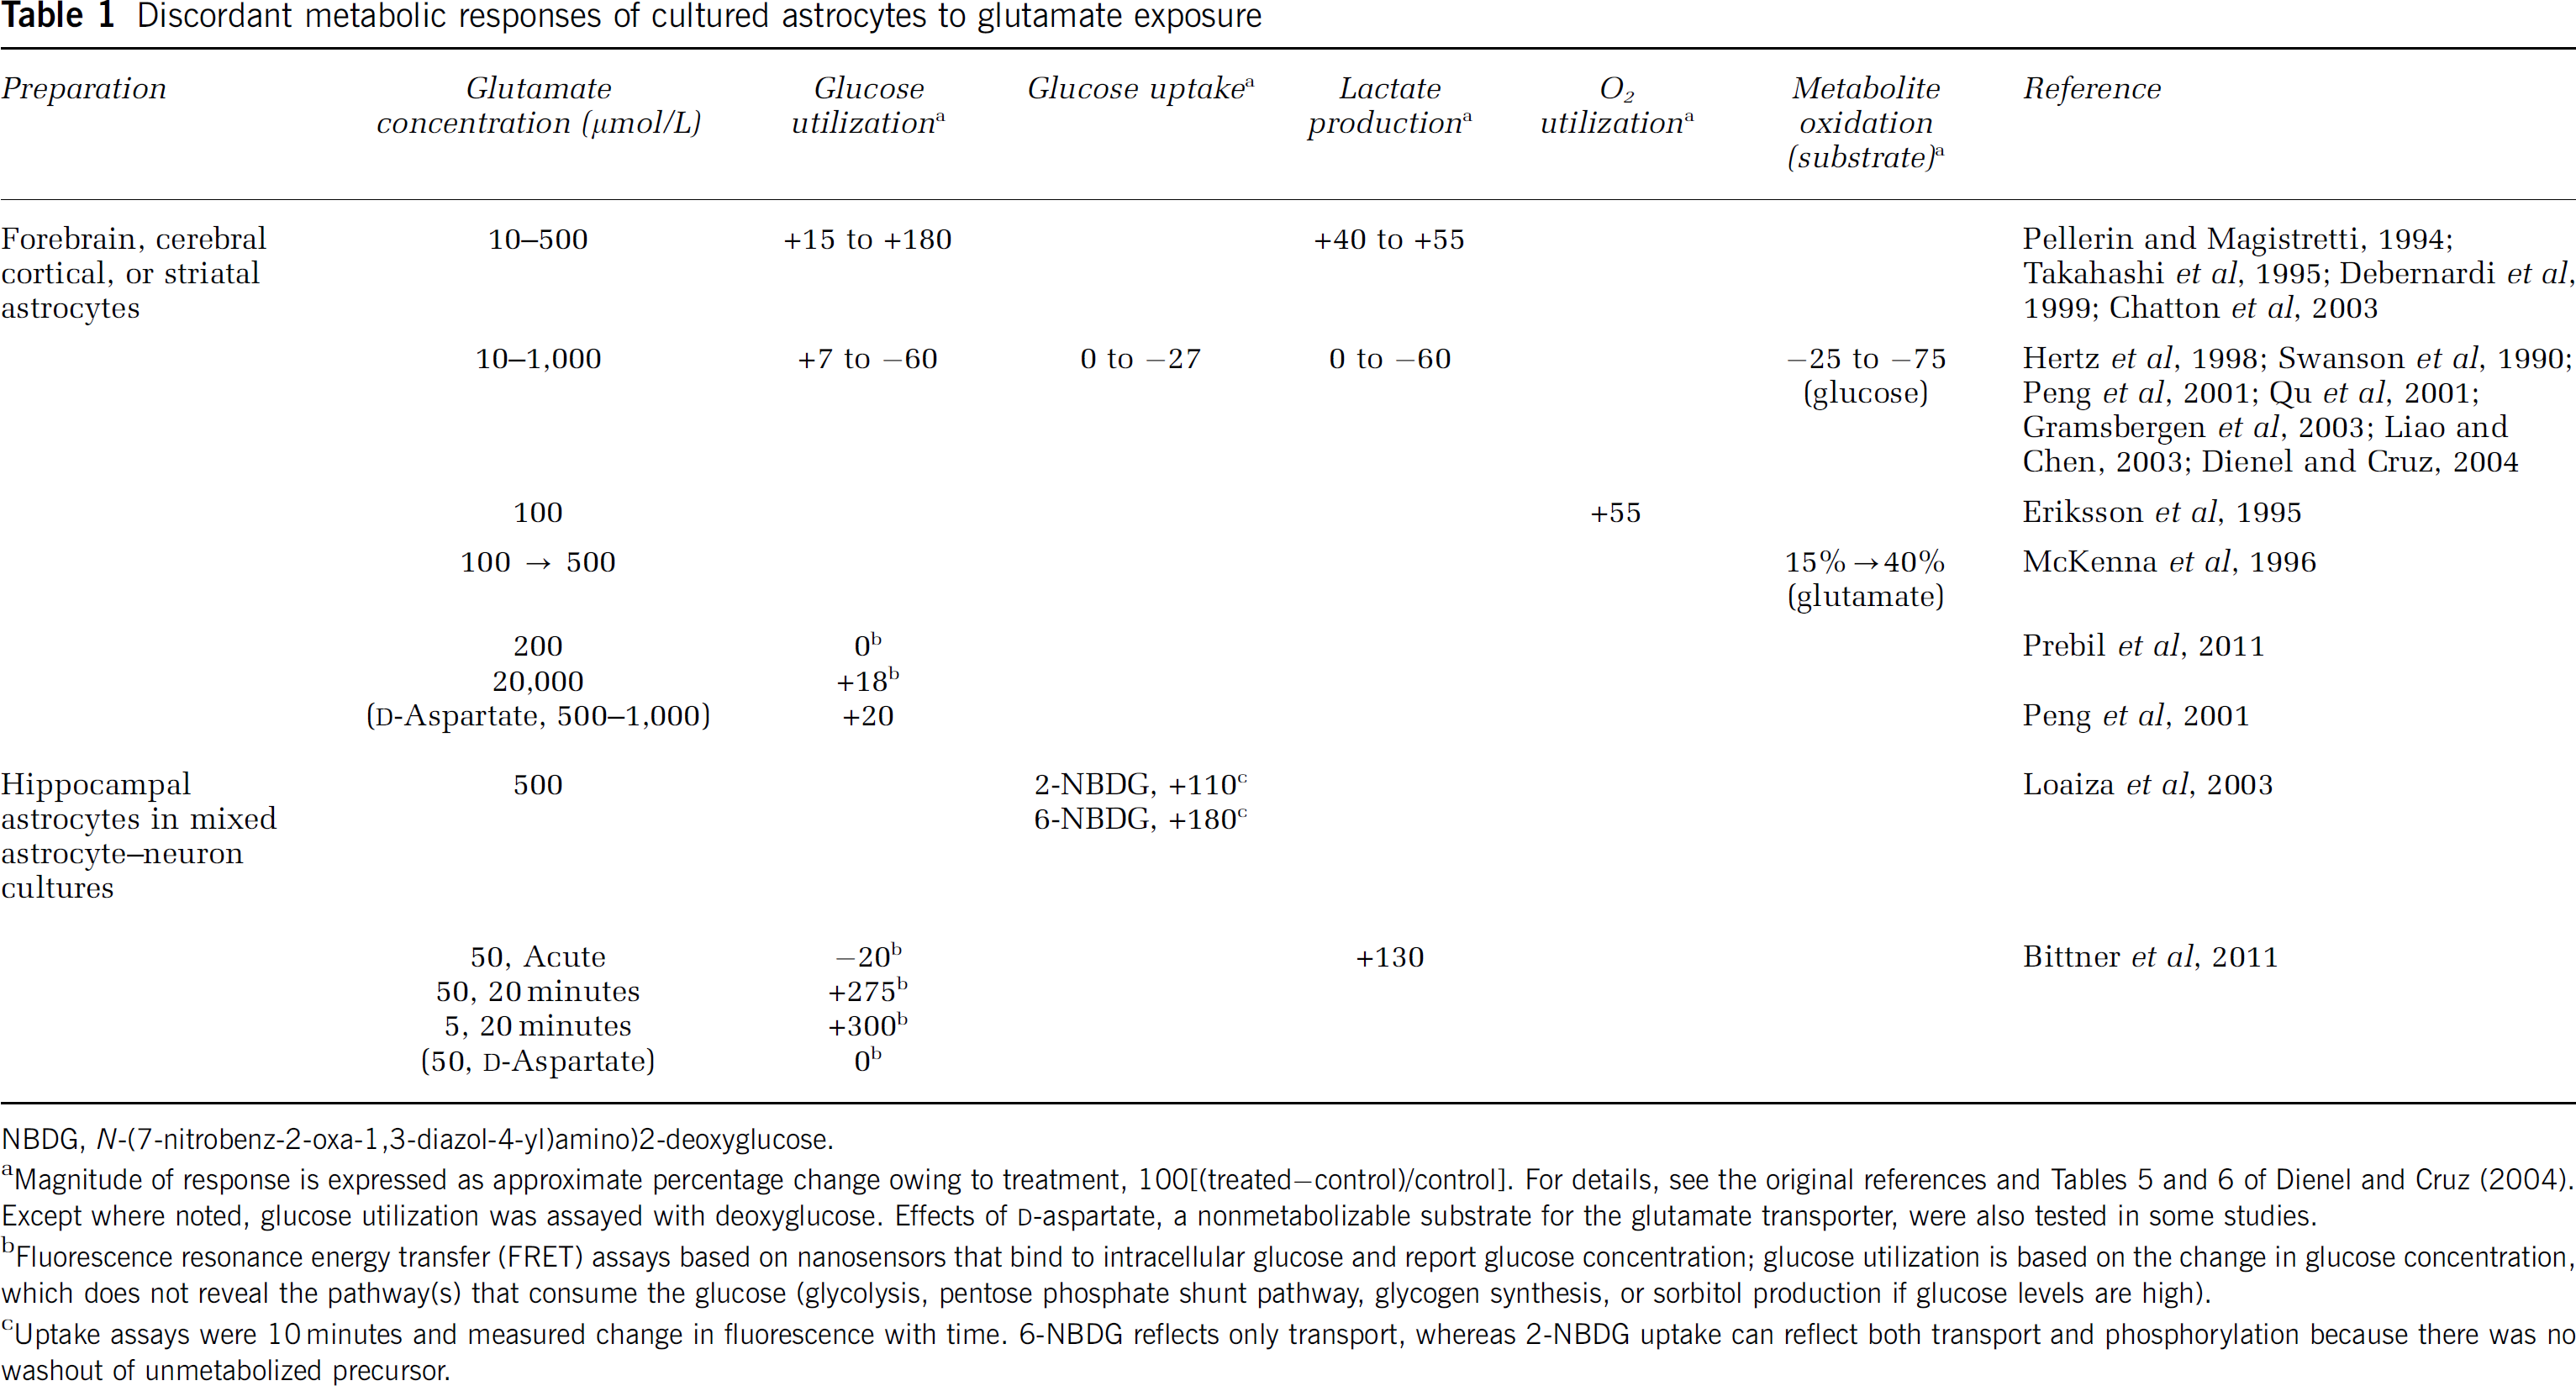
Increased CMRglc and lactate production by cultured astrocytes exposed to glutamate in the culture medium is reproducibly observed in some laboratories but not in many others (Table 1). Responsive pure astrocyte cultures have different temporal responses to glutamate compared with astrocytes in mixed astrocyte–neuron cultures (Table 1). The basis for the presence or absence of a glycolytic response to glutamate is unknown (Hertz et al, 1998), but may be related to oxidative metabolism of glutamate, which stimulates astrocytic respiration and is oxidized in greater amounts with increasing extracellular level (Table 1). Use of ATP generated from glutamate oxidation to extrude sodium is consistent with the increase in CMRglc evoked by nonmetabolizable
Discordant metabolic responses of cultured astrocytes to glutamate exposure
NBDG,
Magnitude of response is expressed as approximate percentage change owing to treatment, 100[(treated−control)/control]. For details, see the original references and Tables 5 and 6 of Dienel and Cruz (2004). Except where noted, glucose utilization was assayed with deoxyglucose. Effects of
Fluorescence resonance energy transfer (FRET) assays based on nanosensors that bind to intracellular glucose and report glucose concentration; glucose utilization is based on the change in glucose concentration, which does not reveal the pathway(s) that consume the glucose (glycolysis, pentose phosphate shunt pathway, glycogen synthesis, or sorbitol production if glucose levels are high).
Uptake assays were 10 minutes and measured change in fluorescence with time. 6-NBDG reflects only transport, whereas 2-NBDG uptake can reflect both transport and phosphorylation because there was no washout of unmetabolized precursor.
Brain Activation In Vivo Activates Glycogenolysis and Oxidative Metabolism in Astrocytes
Glycogen turnover is very slow under resting conditions, but astrocytes have significant resting oxidative activity, calculated to be ∼15% to 38% of total oxidative metabolism of glucose (Hyder et al, 2006; Duarte et al, 2011; Hertz, 2011). The astrocytic filopodial processes that surround and interact with synaptic structures contain mitochondria (Lovatt et al, 2007; Pardo et al, 2011; Lavialle et al, 2011) and have the potential to oxidize glucose, glycogen, and glutamate during activation. If brain activation stimulated only glycolysis in astrocytes, it would be reasonable to assign the ATP derived from this pathway toward the energetics of glutamate uptake. However, this is not the case.
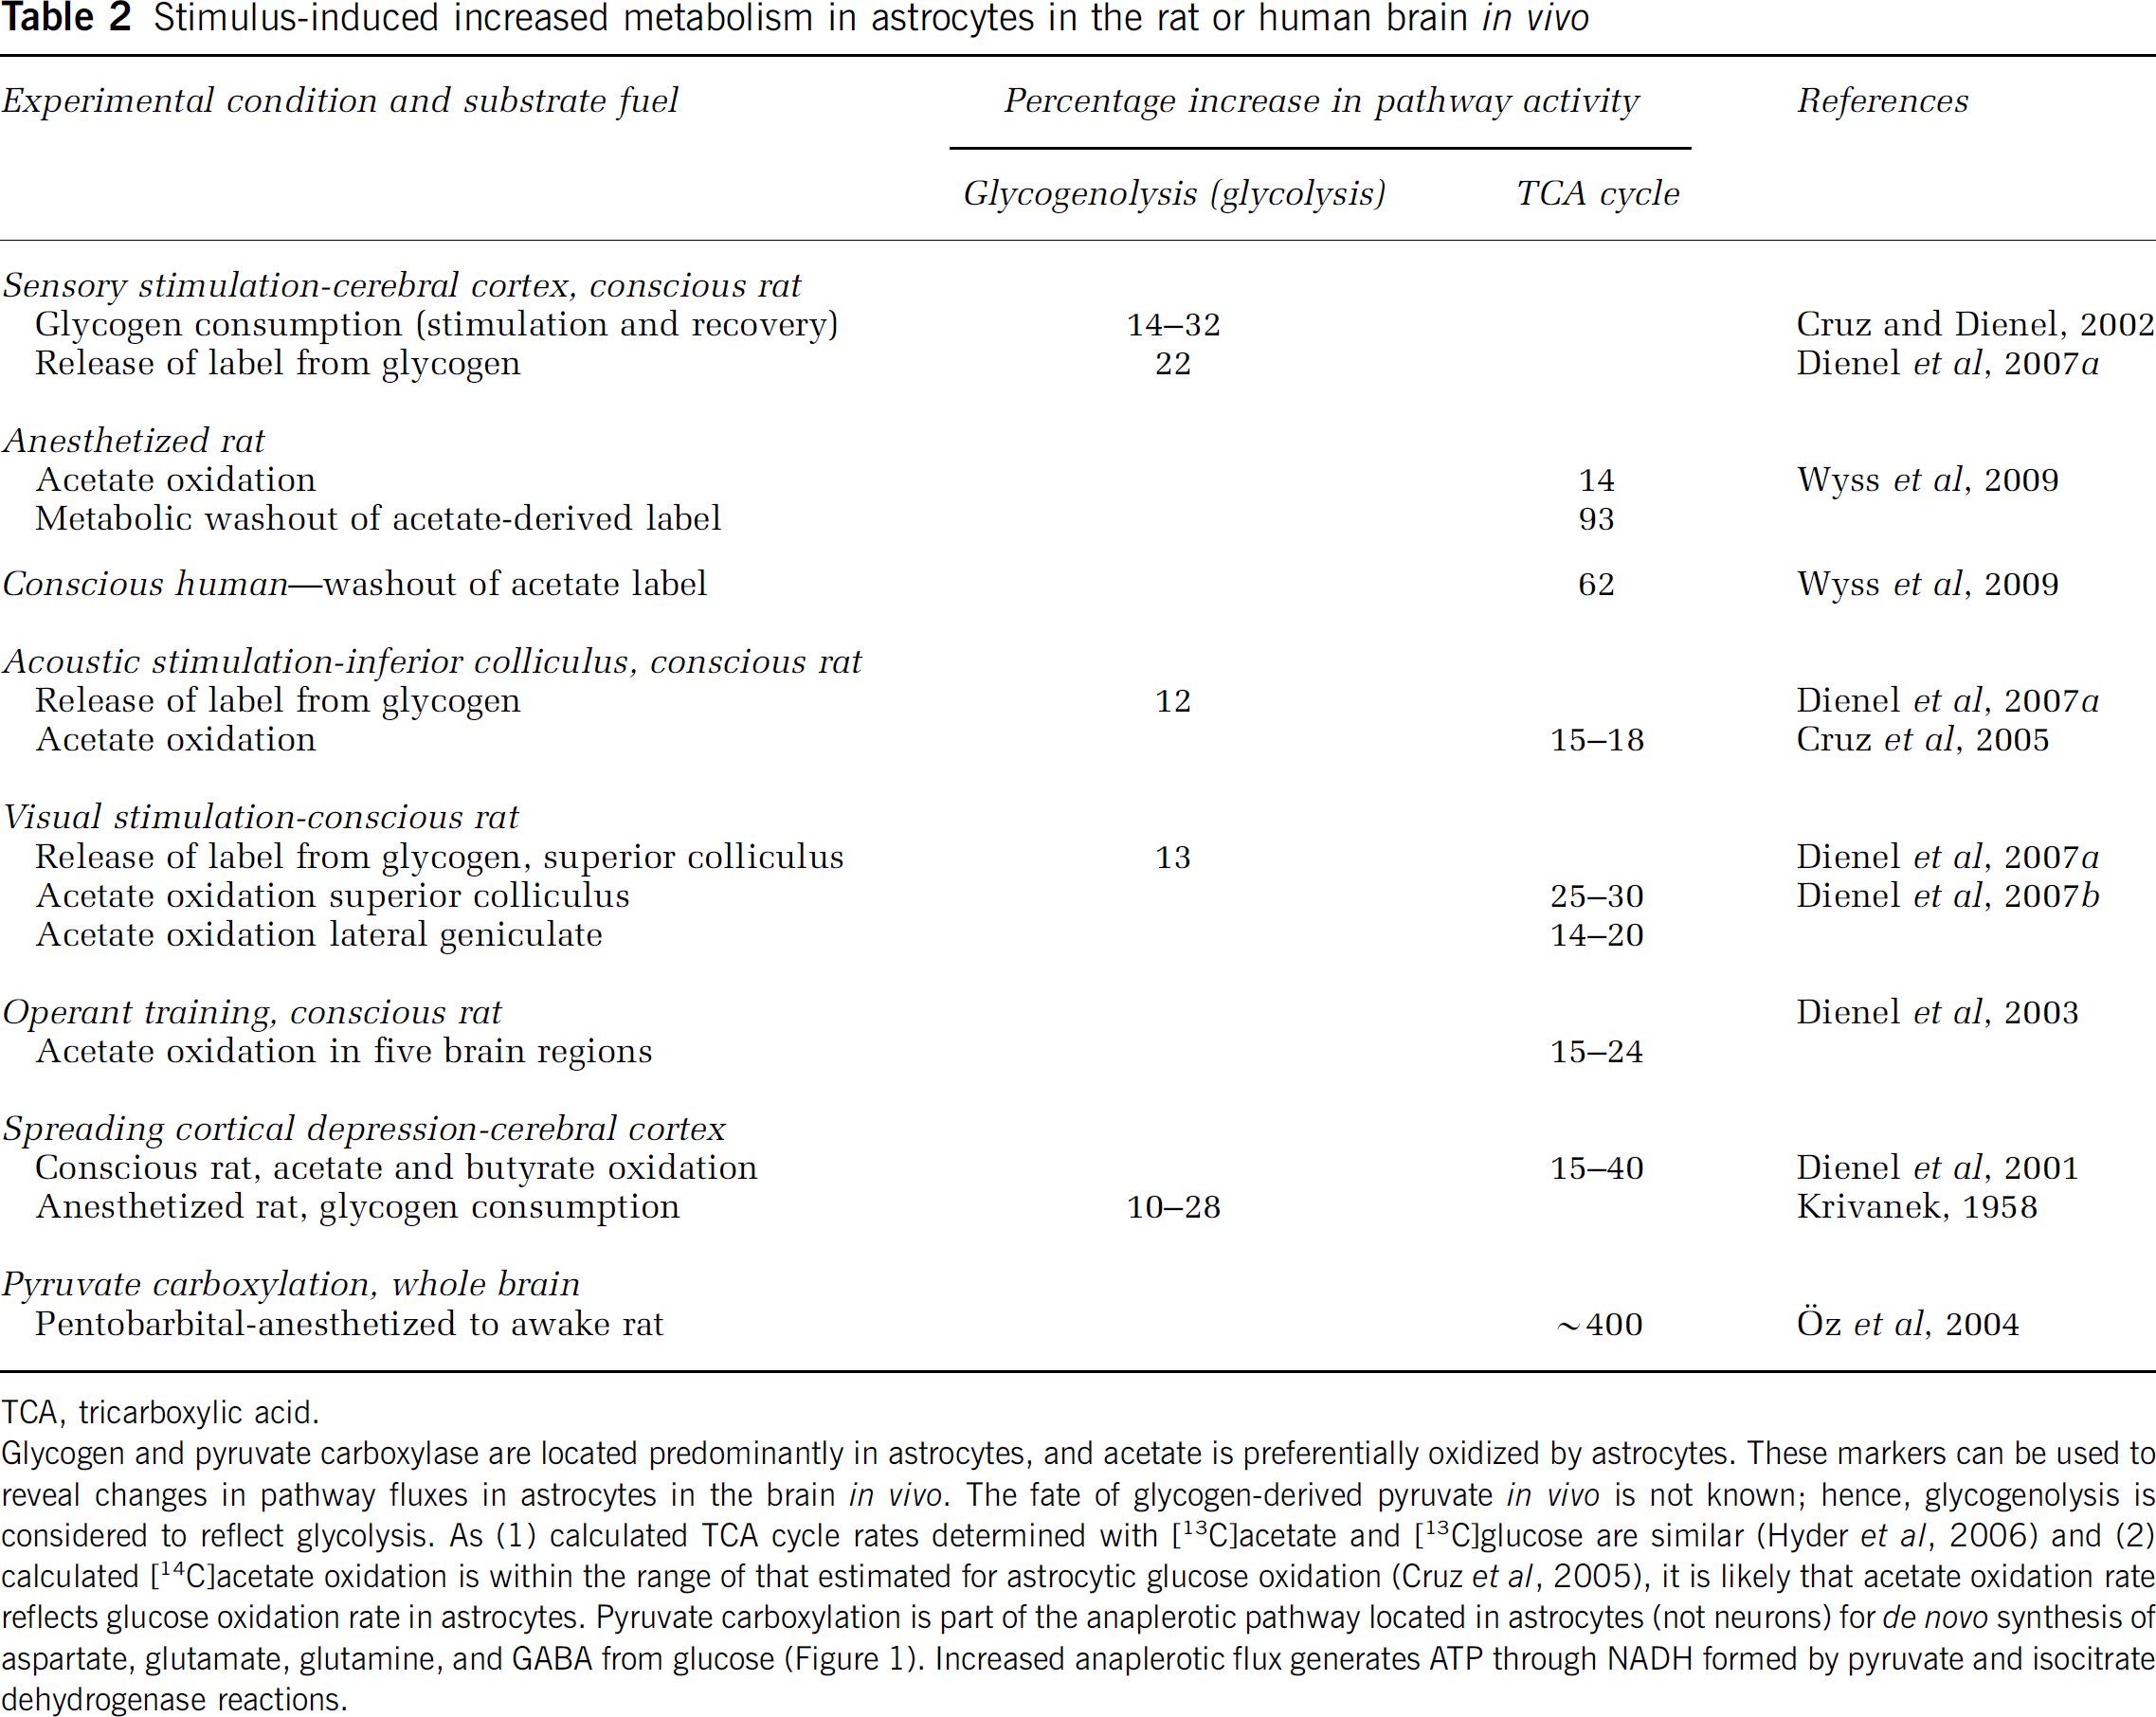
Stimulus-induced increased metabolism in astrocytes in the rat or human brain
TCA, tricarboxylic acid.
Glycogen and pyruvate carboxylase are located predominantly in astrocytes, and acetate is preferentially oxidized by astrocytes. These markers can be used to reveal changes in pathway fluxes in astrocytes in the brain
In our studies of acoustic stimulation of conscious rats that assayed both glucose utilization by all cells and acetate oxidation by astrocytes in the inferior colliculus
Cultured Neurons and Presynaptic Endings from the Adult Brain Increase Glucose Utilization
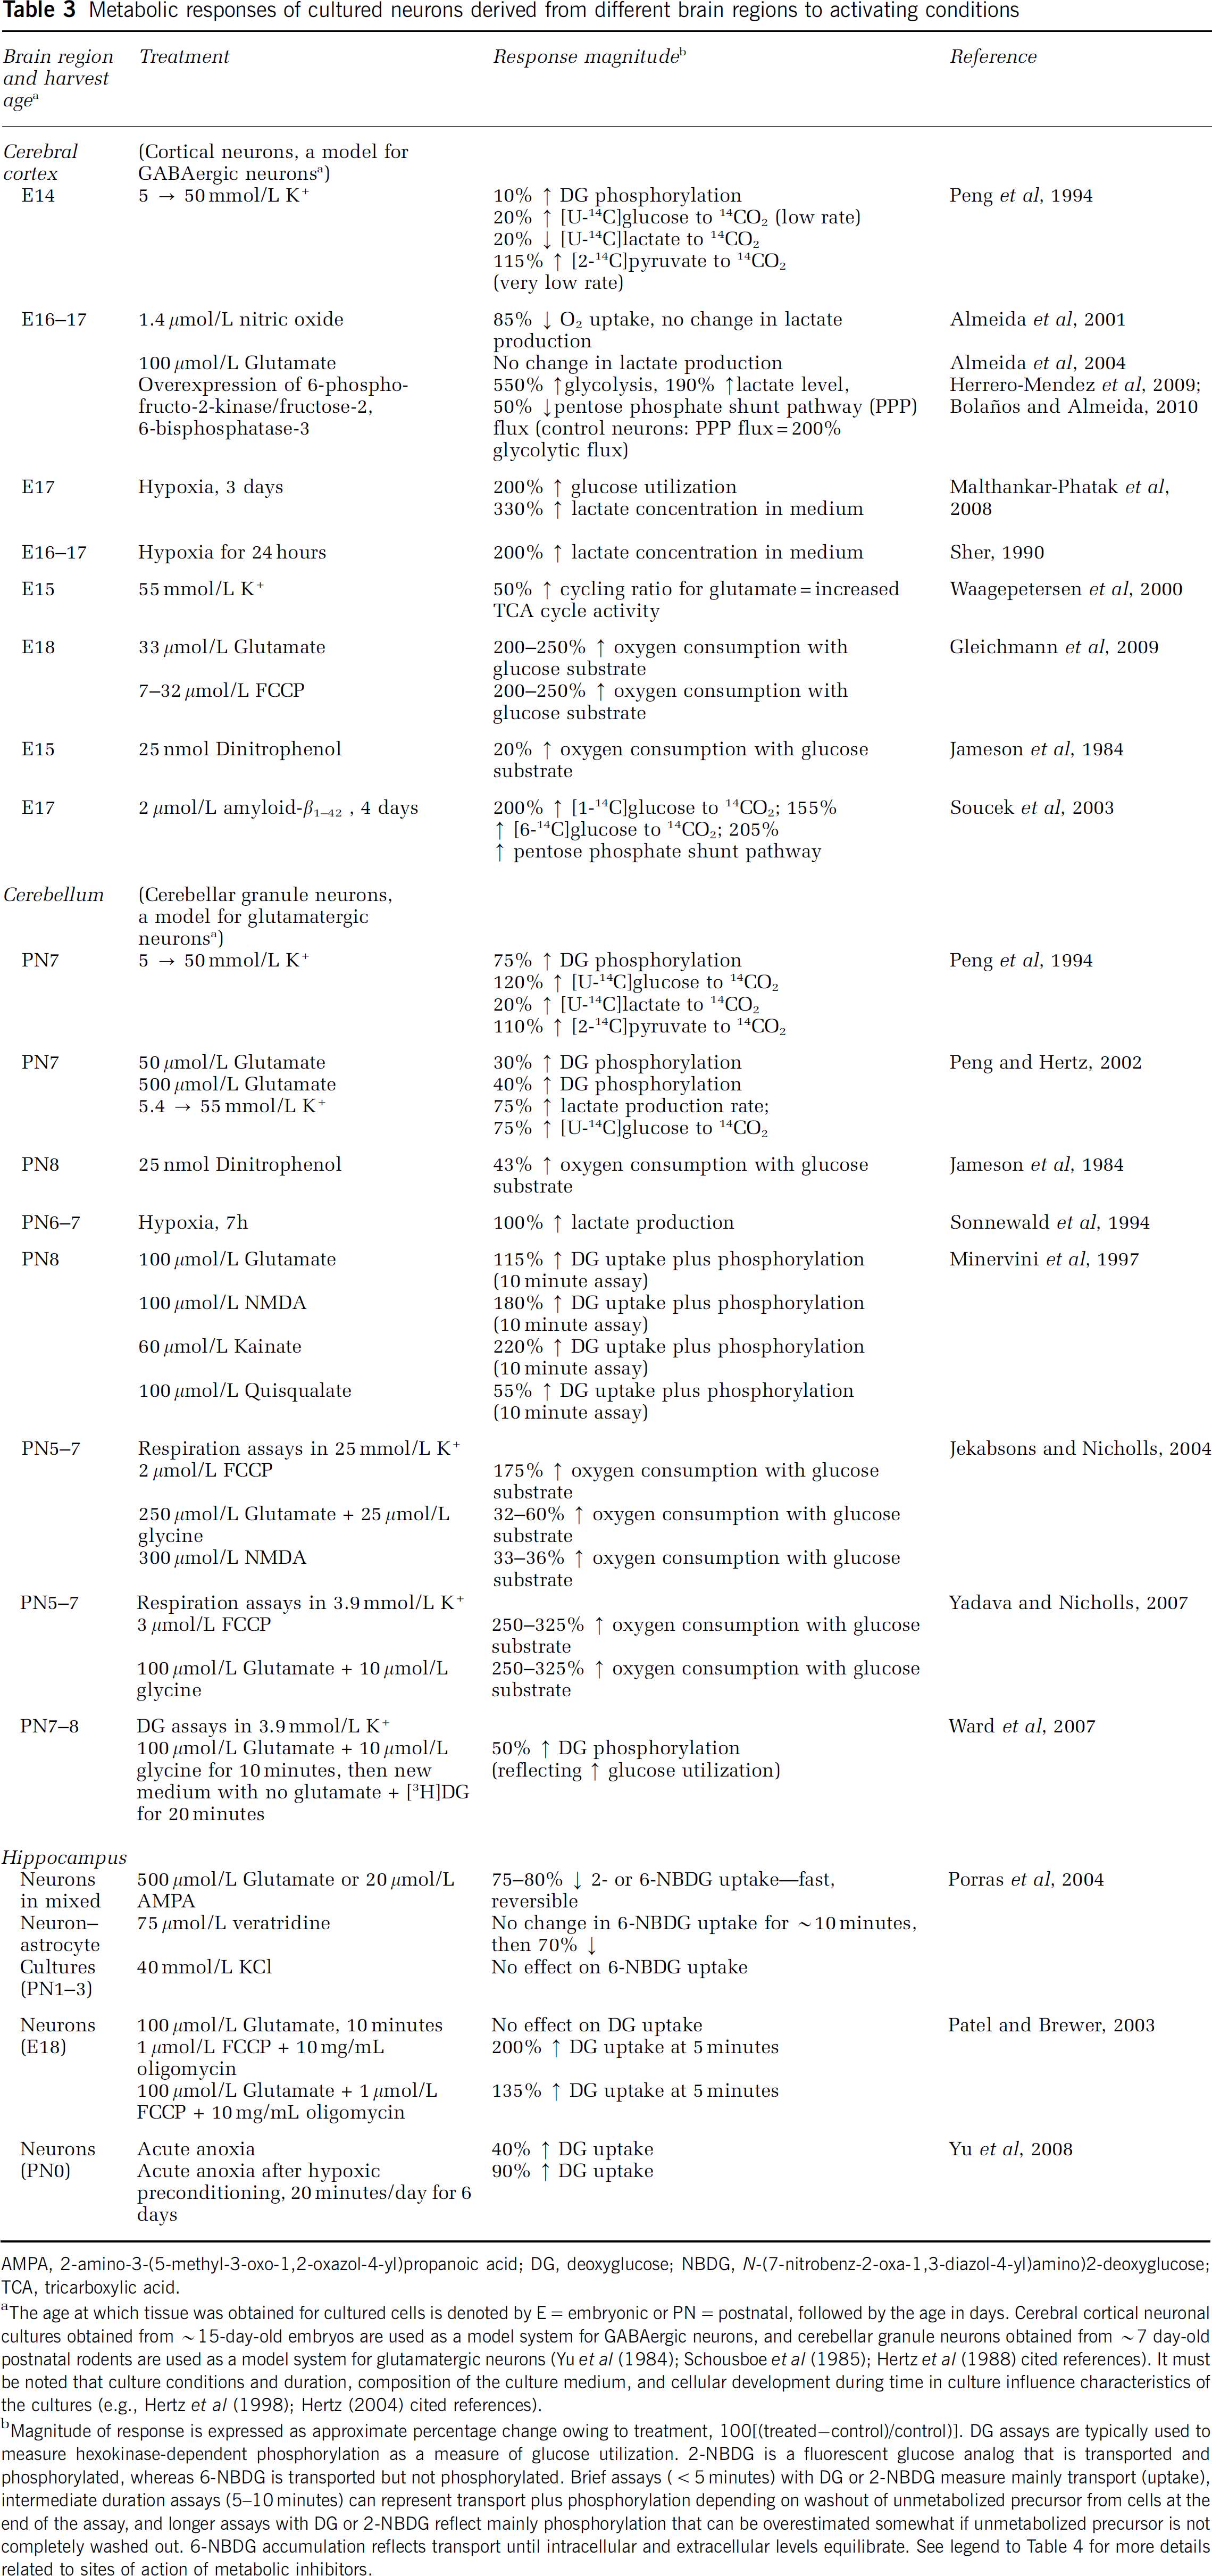
Arguments used by Jolivet et al (2010) in support of the need of neurons for lactate as fuel during activation include inability of neurons to increase glucose transport (citing Porras et al (2004) and a few other studies) and glycolysis (citing Herrero-Mendez et al (2009)). The Bolaños–Almeida–Moncada group has carried out an elegant series of studies (reviewed by Bolaños and Almeida (2010)) designed to elucidate the basis for high sensitivity of cultured cerebral cortical neurons to respiratory inhibition by nitric oxide (NO) and neuronal inability to increase glycolysis when treated with NO (Table 3). In brief, they showed that the enzyme 6-phosphofructo-2-kinase/fructose 2,6-bisphosphatase isoform 3 (Pfkfb3) that makes a potent allosteric activator of 6-phosphofructo-1-kinase (i.e., PFK, see Figure 1) is constantly degraded in cultured cortical neurons but not in cultured cortical astrocytes. Their cortical neurons have a lower glycolytic rate than do astrocytes, and neurons divert glucose-6-phosphate into the pentose phosphate shunt pathway to produce NADPH for management of oxidative stress (Figure 1). The study by Herrero-Mendez et al (2009) extended these findings by showing upregulation of neuronal Pfkfb3 confers to neurons the ability to increase glycolysis and lactate production at the expense of glucose-6-P flux into the pentose shunt pathway (Table 3). Bolaños and Almeida (2010) stated that different regulatory mechanisms may operate in other preparations and brain regions.
Metabolic responses of cultured neurons derived from different brain regions to activating conditions
AMPA, 2-amino-3-(5-methyl-3-oxo-1,2-oxazol-4-yl)propanoic acid; DG, deoxyglucose; NBDG,
The age at which tissue was obtained for cultured cells is denoted by E=embryonic or PN=postnatal, followed by the age in days. Cerebral cortical neuronal cultures obtained from ∼15-day-old embryos are used as a model system for GABAergic neurons, and cerebellar granule neurons obtained from ∼7 day-old postnatal rodents are used as a model system for glutamatergic neurons (Yu et al (1984); Schousboe et al (1985); Hertz et al (1988) cited references). It must be noted that culture conditions and duration, composition of the culture medium, and cellular development during time in culture influence characteristics of the cultures (e.g., Hertz et al (1998); Hertz (2004) cited references).
Magnitude of response is expressed as approximate percentage change owing to treatment, 100[(treated−control)/control)]. DG assays are typically used to measure hexokinase-dependent phosphorylation as a measure of glucose utilization. 2-NBDG is a fluorescent glucose analog that is transported and phosphorylated, whereas 6-NBDG is transported but not phosphorylated. Brief assays (<5 minutes) with DG or 2-NBDG measure mainly transport (uptake), intermediate duration assays (5–10 minutes) can represent transport plus phosphorylation depending on washout of unmetabolized precursor from cells at the end of the assay, and longer assays with DG or 2-NBDG reflect mainly phosphorylation that can be overestimated somewhat if unmetabolized precursor is not completely washed out. 6-NBDG accumulation reflects transport until intracellular and extracellular levels equilibrate. See legend to Table 4 for more details related to sites of action of metabolic inhibitors.
In fact, many laboratories have shown that different types of cultured neurons can substantially upregulate glucose metabolism, whereas a few preparations have no or small responses. Many cerebral cortical neuron preparations (a model for GABAergic neurons) do respond to many treatments (e.g., depolarization, hypoxia, exposure to glutamate, treatment with uncouplers or amyloid-
Synaptosomes embody the metabolic capabilities of nerve endings from the mature brain, although their capacity may be reduced by losses of soluble enzymes, ATP, Pi, and phosphocreatine during preparative procedures. Synaptosomes isolated from adult brain regions, including the hippocampus and cerebral cortex from different species, have high metabolic capacity and respond with large increases in glucose-supported respiration to depolarization, uncouplers, anoxia, enhanced ion fluxes, and NO donors (Table 4). Inhibition of MAS with aminooxyacetate reduces uncoupler-evoked respiration (Table 4). Glycolysis and glucose-supported respiration in hippocampal and cortical synaptosomes are enhanced by K+ and veratridine (Table 4), sharply contrasting the responses of hippocampal neurons in mixed cultures (Table 3). The magnitude of response to Na+-stimulated glucose oxidation increases with developmental age, and is much higher in synaptosomes isolated from adult compared with the immature brain (Table 4).
Metabolic responses of synaptosomes to activating conditions
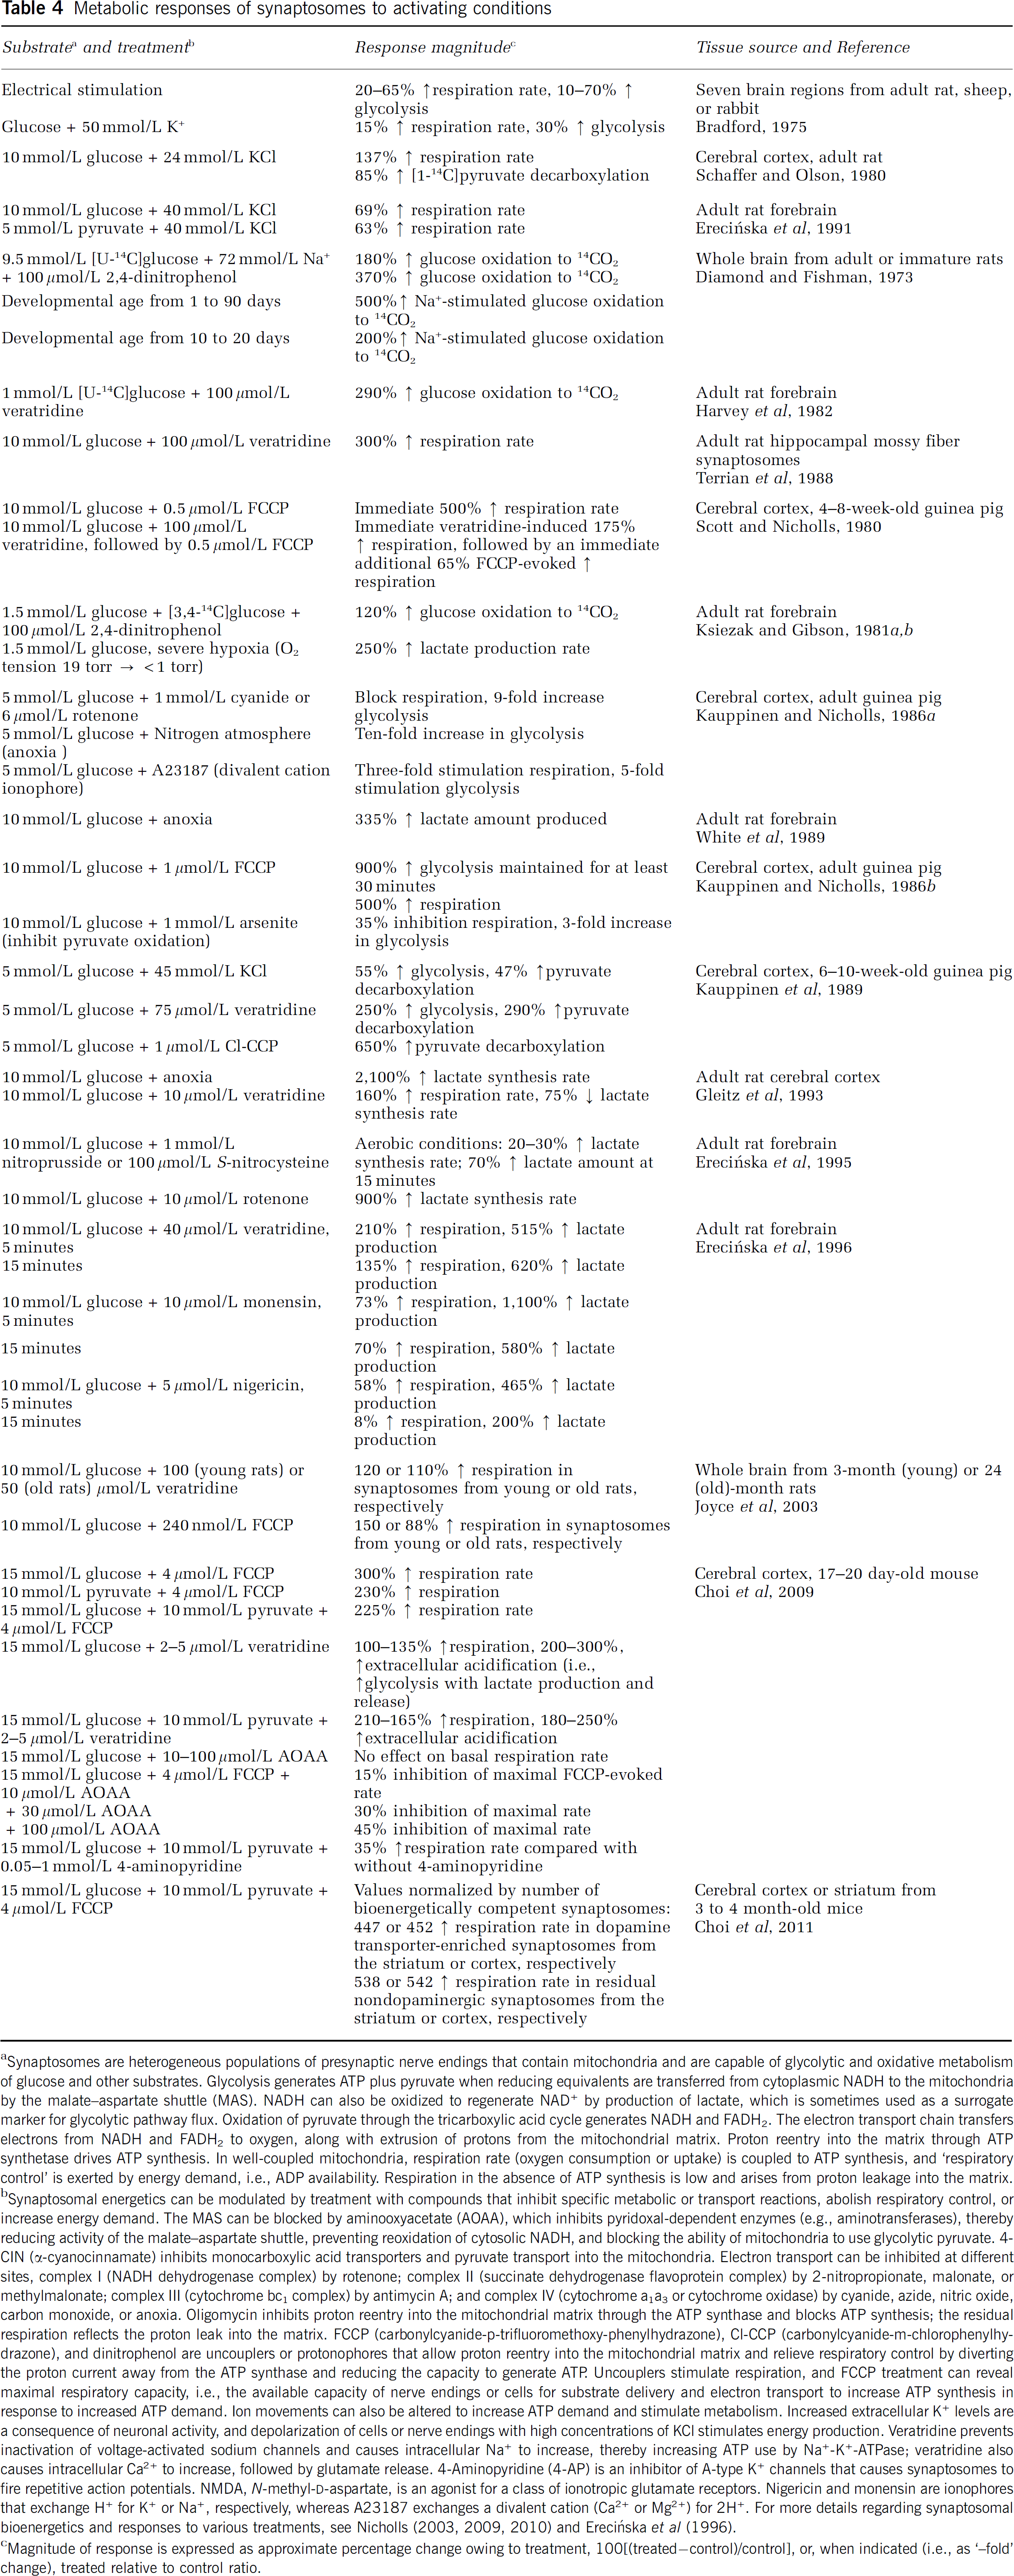
Synaptosomes are heterogeneous populations of presynaptic nerve endings that contain mitochondria and are capable of glycolytic and oxidative metabolism of glucose and other substrates. Glycolysis generates ATP plus pyruvate when reducing equivalents are transferred from cytoplasmic NADH to the mitochondria by the malate–aspartate shuttle (MAS). NADH can also be oxidized to regenerate NAD+ by production of lactate, which is sometimes used as a surrogate marker for glycolytic pathway flux. Oxidation of pyruvate through the tricarboxylic acid cycle generates NADH and FADH2. The electron transport chain transfers electrons from NADH and FADH2 to oxygen, along with extrusion of protons from the mitochondrial matrix. Proton reentry into the matrix through ATP synthetase drives ATP synthesis. In well-coupled mitochondria, respiration rate (oxygen consumption or uptake) is coupled to ATP synthesis, and ‘respiratory control’ is exerted by energy demand, i.e., ADP availability. Respiration in the absence of ATP synthesis is low and arises from proton leakage into the matrix.
Synaptosomal energetics can be modulated by treatment with compounds that inhibit specific metabolic or transport reactions, abolish respiratory control, or increase energy demand. The MAS can be blocked by aminooxyacetate (AOAA), which inhibits pyridoxal-dependent enzymes (e.g., aminotransferases), thereby reducing activity of the malate–aspartate shuttle, preventing reoxidation of cytosolic NADH, and blocking the ability of mitochondria to use glycolytic pyruvate. 4-CIN (α-cyanocinnamate) inhibits monocarboxylic acid transporters and pyruvate transport into the mitochondria. Electron transport can be inhibited at different sites, complex I (NADH dehydrogenase complex) by rotenone; complex II (succinate dehydrogenase flavoprotein complex) by 2-nitropropionate, malonate, or methylmalonate; complex III (cytochrome bc1 complex) by antimycin A; and complex IV (cytochrome a1a3 or cytochrome oxidase) by cyanide, azide, nitric oxide, carbon monoxide, or anoxia. Oligomycin inhibits proton reentry into the mitochondrial matrix through the ATP synthase and blocks ATP synthesis; the residual respiration reflects the proton leak into the matrix. FCCP (carbonylcyanide-p-trifluoromethoxy-phenylhydrazone), Cl-CCP (carbonylcyanide-m-chlorophenylhydrazone), and dinitrophenol are uncouplers or protonophores that allow proton reentry into the mitochondrial matrix and relieve respiratory control by diverting the proton current away from the ATP synthase and reducing the capacity to generate ATP. Uncouplers stimulate respiration, and FCCP treatment can reveal maximal respiratory capacity, i.e., the available capacity of nerve endings or cells for substrate delivery and electron transport to increase ATP synthesis in response to increased ATP demand. Ion movements can also be altered to increase ATP demand and stimulate metabolism. Increased extracellular K+ levels are a consequence of neuronal activity, and depolarization of cells or nerve endings with high concentrations of KCl stimulates energy production. Veratridine prevents inactivation of voltage-activated sodium channels and causes intracellular Na+ to increase, thereby increasing ATP use by Na+-K+-ATPase; veratridine also causes intracellular Ca2+ to increase, followed by glutamate release. 4-Aminopyridine (4-AP) is an inhibitor of A-type K+ channels that causes synaptosomes to fire repetitive action potentials. NMDA,
Magnitude of response is expressed as approximate percentage change owing to treatment, 100[(treated−control)/control], or, when indicated (i.e., as ‘–fold’ change), treated relative to control ratio.
To summarize, many preparations of cortical, cerebellar, and hippocampal neurons and synaptosomes upregulate various pathways of glucose metabolism under many different conditions. However, cultured neurons derived from different brain regions may not have the same metabolic capacities or responses to the same treatment. Synaptosomes are one structure of adult brain neurons that is readily isolated, and these nerve terminals can increase glycolysis and respiration by 5- to 10-fold
Neurons can Quickly Upregulate Glucose Transport Capacity During Activation
Glutamate inhibits NBDG transport into cultured neurons (Porras et al, 2004; Table 3) and stimulates glucose transport into cultured astrocytes (Loaiza et al, 2003; Table 1). These findings have been interpreted by Pierre et al (2009) as rerouting of glucose from neurons to astrocytes during glutamatergic neurotransmission, so neurons would depend on astrocyte-derived lactate as a fuel, in accordance with the astrocyte-neuron lactate shuttle hypothesis. However, these results sharply contrast those from other neuronal cultures that exhibit glutamate-induced increases in CMRglc and 2- to 3-fold stimulation of glucose-supported respiration by glutamate in cultured cerebral cortical neurons and cerebellar granule neurons (Table 3). Moreover, nerve endings isolated from both immature and adult brains are capable of large increases in glycolysis and glucose-supported respiration (Table 4). Therefore, neuronal glucose transport must increase simultaneously with stimulation of its utilization.
Neuronal glucose transport capacity is enhanced within minutes by treatment of cultured neurons with glutamate, bicuculline, and a NO donor by increasing cell-surface expression of the neuronal glucose transporter (GLUT)3 throughout the neuronal processes and soma (Table 5). Upregulation of the GLUT3 protein level is slower than cell-surface translocation, and is stimulated
Neuronal glucose transporter GLUT3: treatment-evoked changes in cell surface expression and total protein level, and functional abnormalities in mice with GLUT3 deficiency
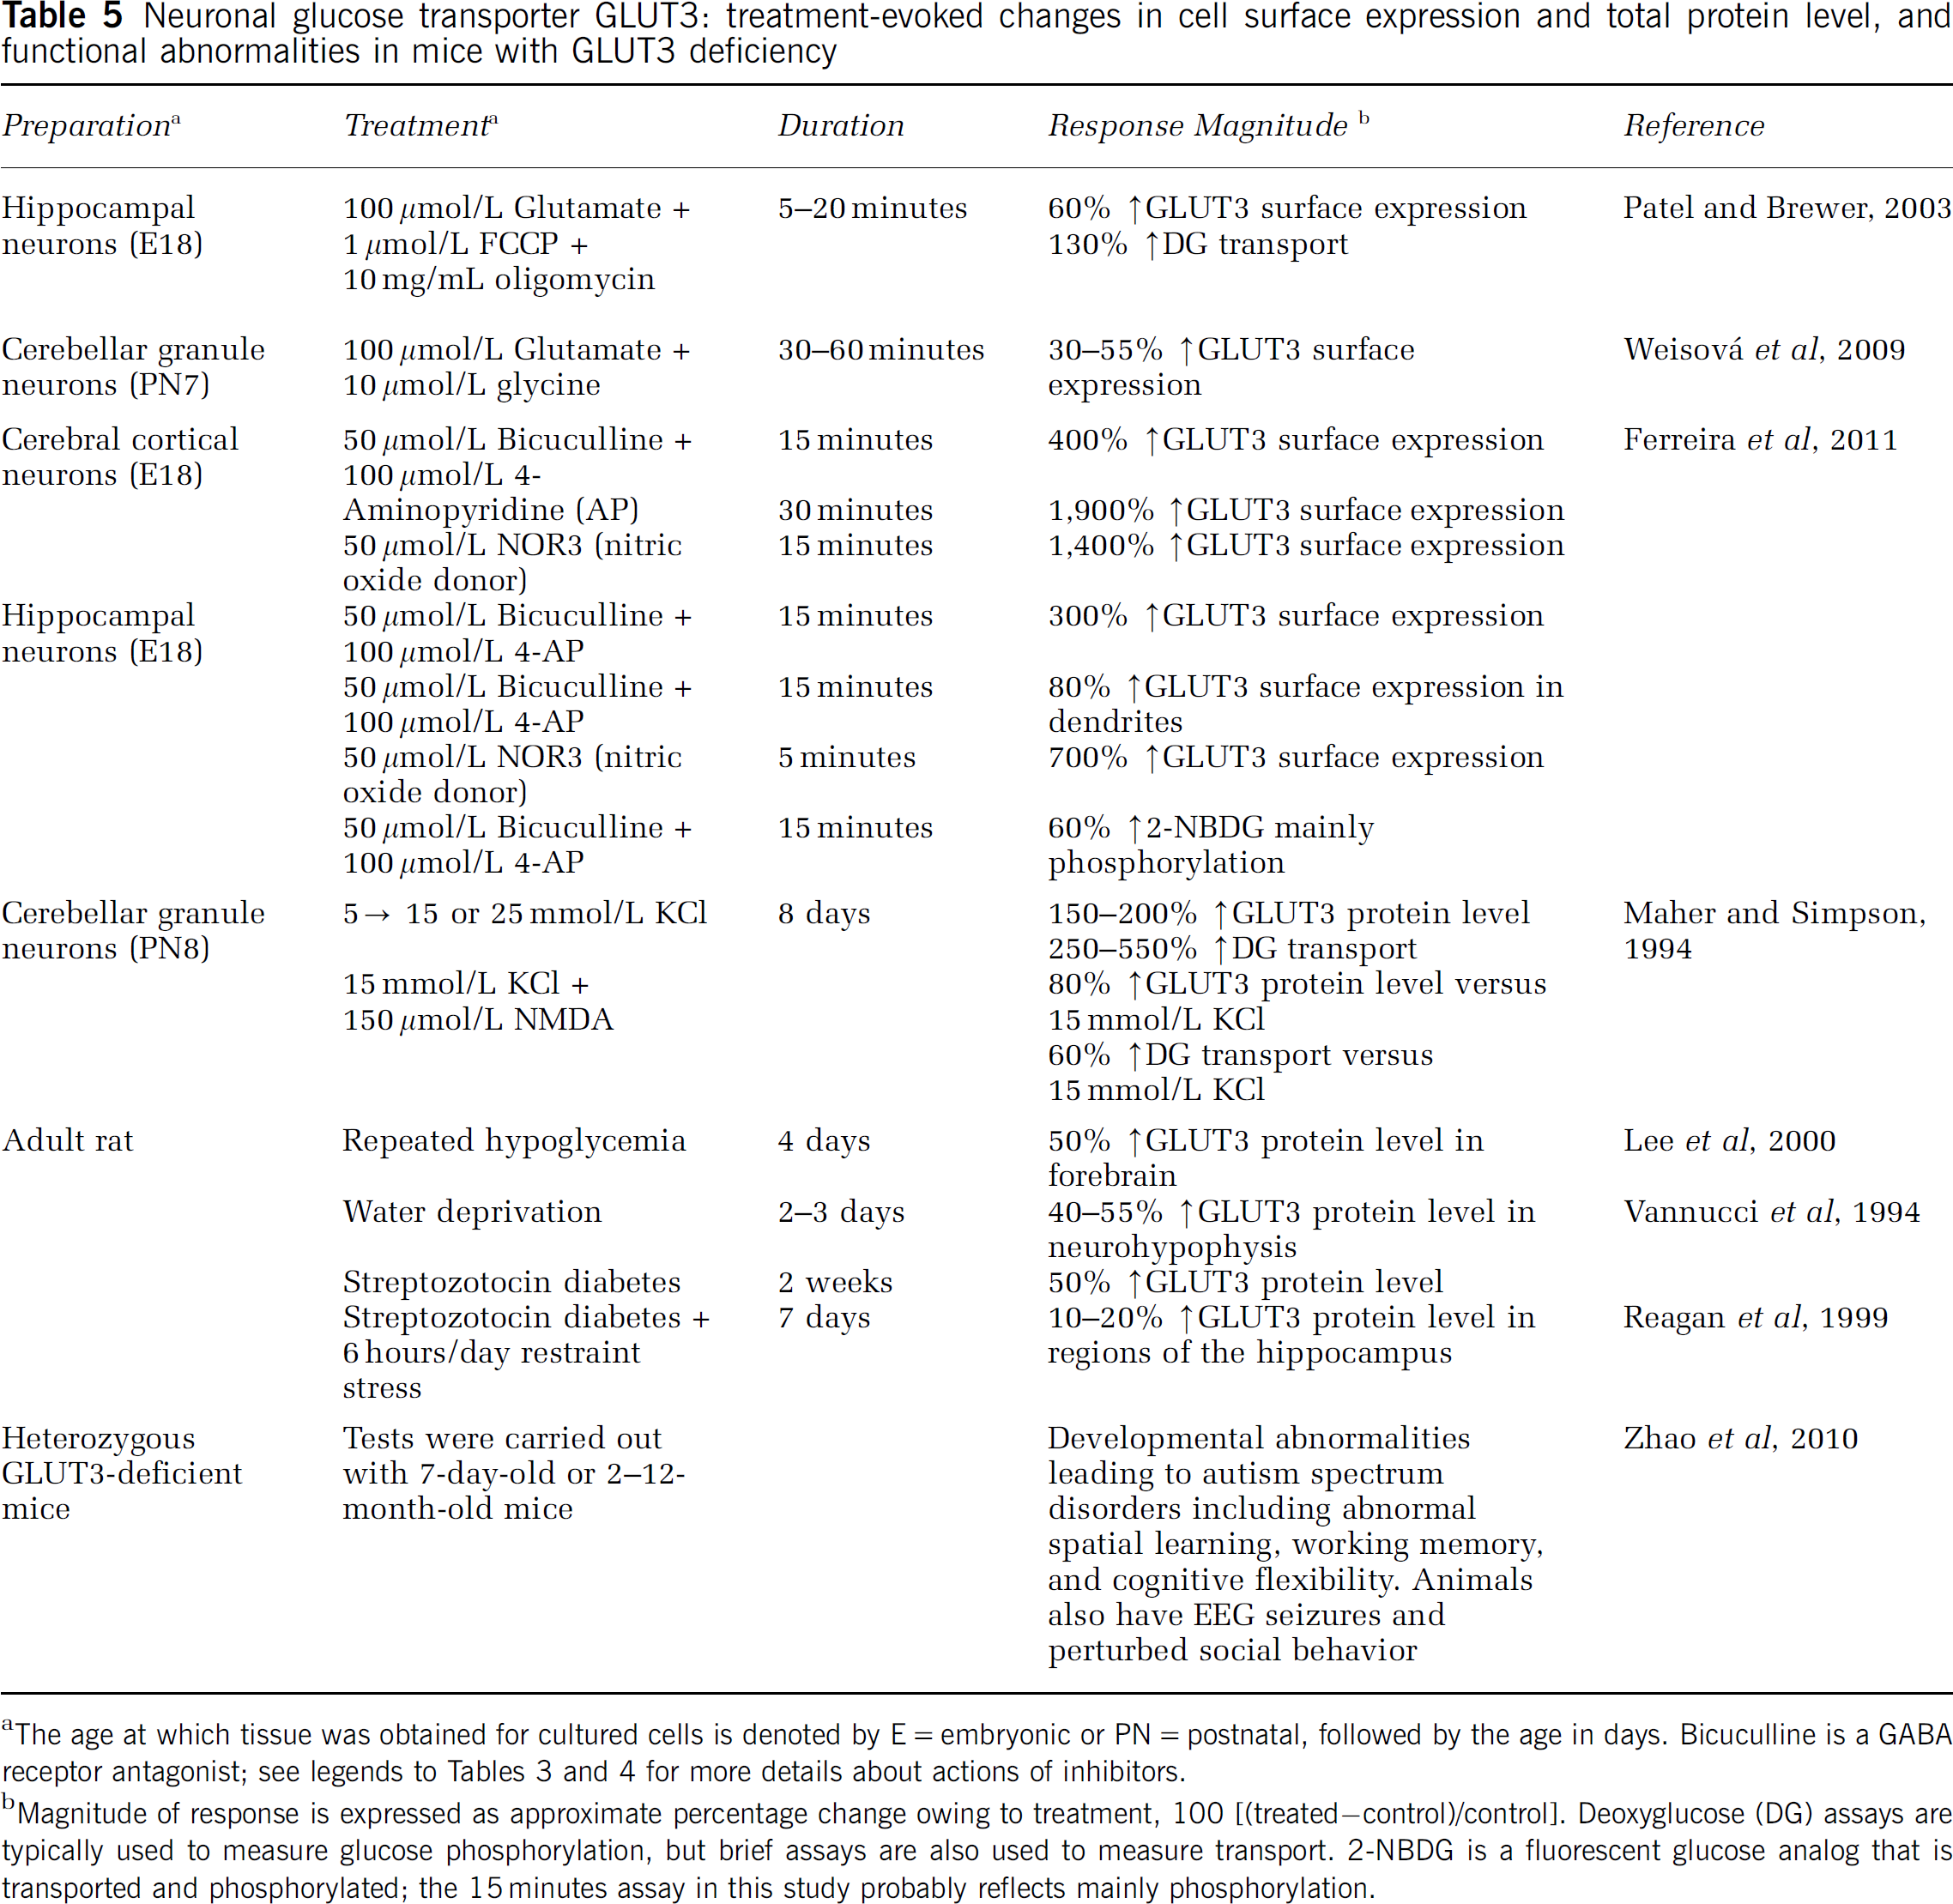
The age at which tissue was obtained for cultured cells is denoted by E=embryonic or PN=postnatal, followed by the age in days. Bicuculline is a GABA receptor antagonist; see legends to Tables 3 and 4 for more details about actions of inhibitors.
Magnitude of response is expressed as approximate percentage change owing to treatment, 100 [(treated−control)/control]. Deoxyglucose (DG) assays are typically used to measure glucose phosphorylation, but brief assays are also used to measure transport. 2-NBDG is a fluorescent glucose analog that is transported and phosphorylated; the 15 minutes assay in this study probably reflects mainly phosphorylation.
Dendritic Spine Energetics: Is Monocarboxylic Acid Transporter-2 used for Lactate Release?
Neuronal MCT2 and AMPA receptor GluR2/3 are colocalized in postsynaptic densities of glutamatergic synapses between parallel fibers and Purkinje cells in the cerebellum (Bergersen et al, 2001, 2005), and these two proteins are translocated to the cell surface from intracellular stores in parallel under activating conditions (Pierre et al, 2009). Monocarboxylic acid transporter-2 localization and trafficking are claimed to facilitate uptake of astrocyte-derived lactate as oxidative fuel for these glutamatergic spines (Bergersen et al, 2005, 2007; Pierre et al, 2009). However, spines do not contain the mitochondria (Bergersen et al, 2001, 2002); hence, lactate, ADP, and phosphate must diffuse through the spine neck to the mitochondria in the dendritic shaft, followed by lactate oxidation and synthesis of ATP, then diffusion of ATP back to postsynaptic density for its utilization. This scenario does not include glucose transport and metabolism in spines, and to understand the energetics of dendritic structures more fully, it is important to know the relative levels of GLUT3 compared with MCT2 in presynaptic and postsynaptic structures and to evaluate glucose and lactate metabolism in these structures.
Most dendritic spines have very few mitochondria, in contrast to the shafts (Li et al, 2004; Bourne and Harris, 2008). Postsynaptic densities contain glycolytic enzymes that synthesize ATP (Wu et al, 1997), and GLUT3 is localized in synaptic endings and postsynaptic structures (Leino et al, 1997). Calcium clearance in activated cultured cerebellar granule neurons and in Purkinje cells in brain slices relies on glycolysis to power the plasma membrane Ca2+-ATPase in the soma, dendrites, and spines, and inhibition of mitochondrial ATP generation does not affect operation of this pump (Ivannikov et al, 2010). These findings underscore the importance of glycolysis in neuronal dendritic spines and show that diffusion of ATP from the dendritic shaft into the spine cannot support calcium pumping at the plasma membrane of spines. Therefore, trafficking of MCT2 might be required to release lactate generated by glycolysis in the spine into extracellular fluid, so that high glycolytic flux can be maintained within the spine at the site of the postsynaptic density. Avid lactate uptake by nearby astrocytes could then oxidize or disperse and discharge the lactate to more remote locations (Gandhi et al, 2009).
Net Transport of Lactate Across the Blood–Brain Barrier In Vivo
Arteriovenous differences are used to evaluate brain uptake and release of compounds, but limited access to venous drainage systems restricts these assays to the whole brain, cerebral cortex, and eye. Small amounts of lactate (∼5% of glucose uptake) are released from resting brain, and during activation, lactate release increases to 15% to 22% of glucose influx (Tables 6A and 6B). Importantly, lactate release can occur even when global brain lactate levels are lower than blood (Table 6A), presumably owing to locally high brain lactate levels. Krebs (1972) noted that the eye is highly glycolytic, and lactate release from the eye exceeds that from the brain, ranging from ∼20% to 100% of glucose uptake (Table 6C). Lactate is also released from the human brain during stressful cognitive testing (Table 6E). When blood lactate levels increase during sensory stimulation (Table 6D) or graded exercise (Table 6E), lactate enters the brain in progressively increasing amounts. Activation is associated with lactate release, but strenuous physical activity increases blood lactate level and brain uptake.
Lactate release from the brain and eye during activation and lactate uptake during exercise
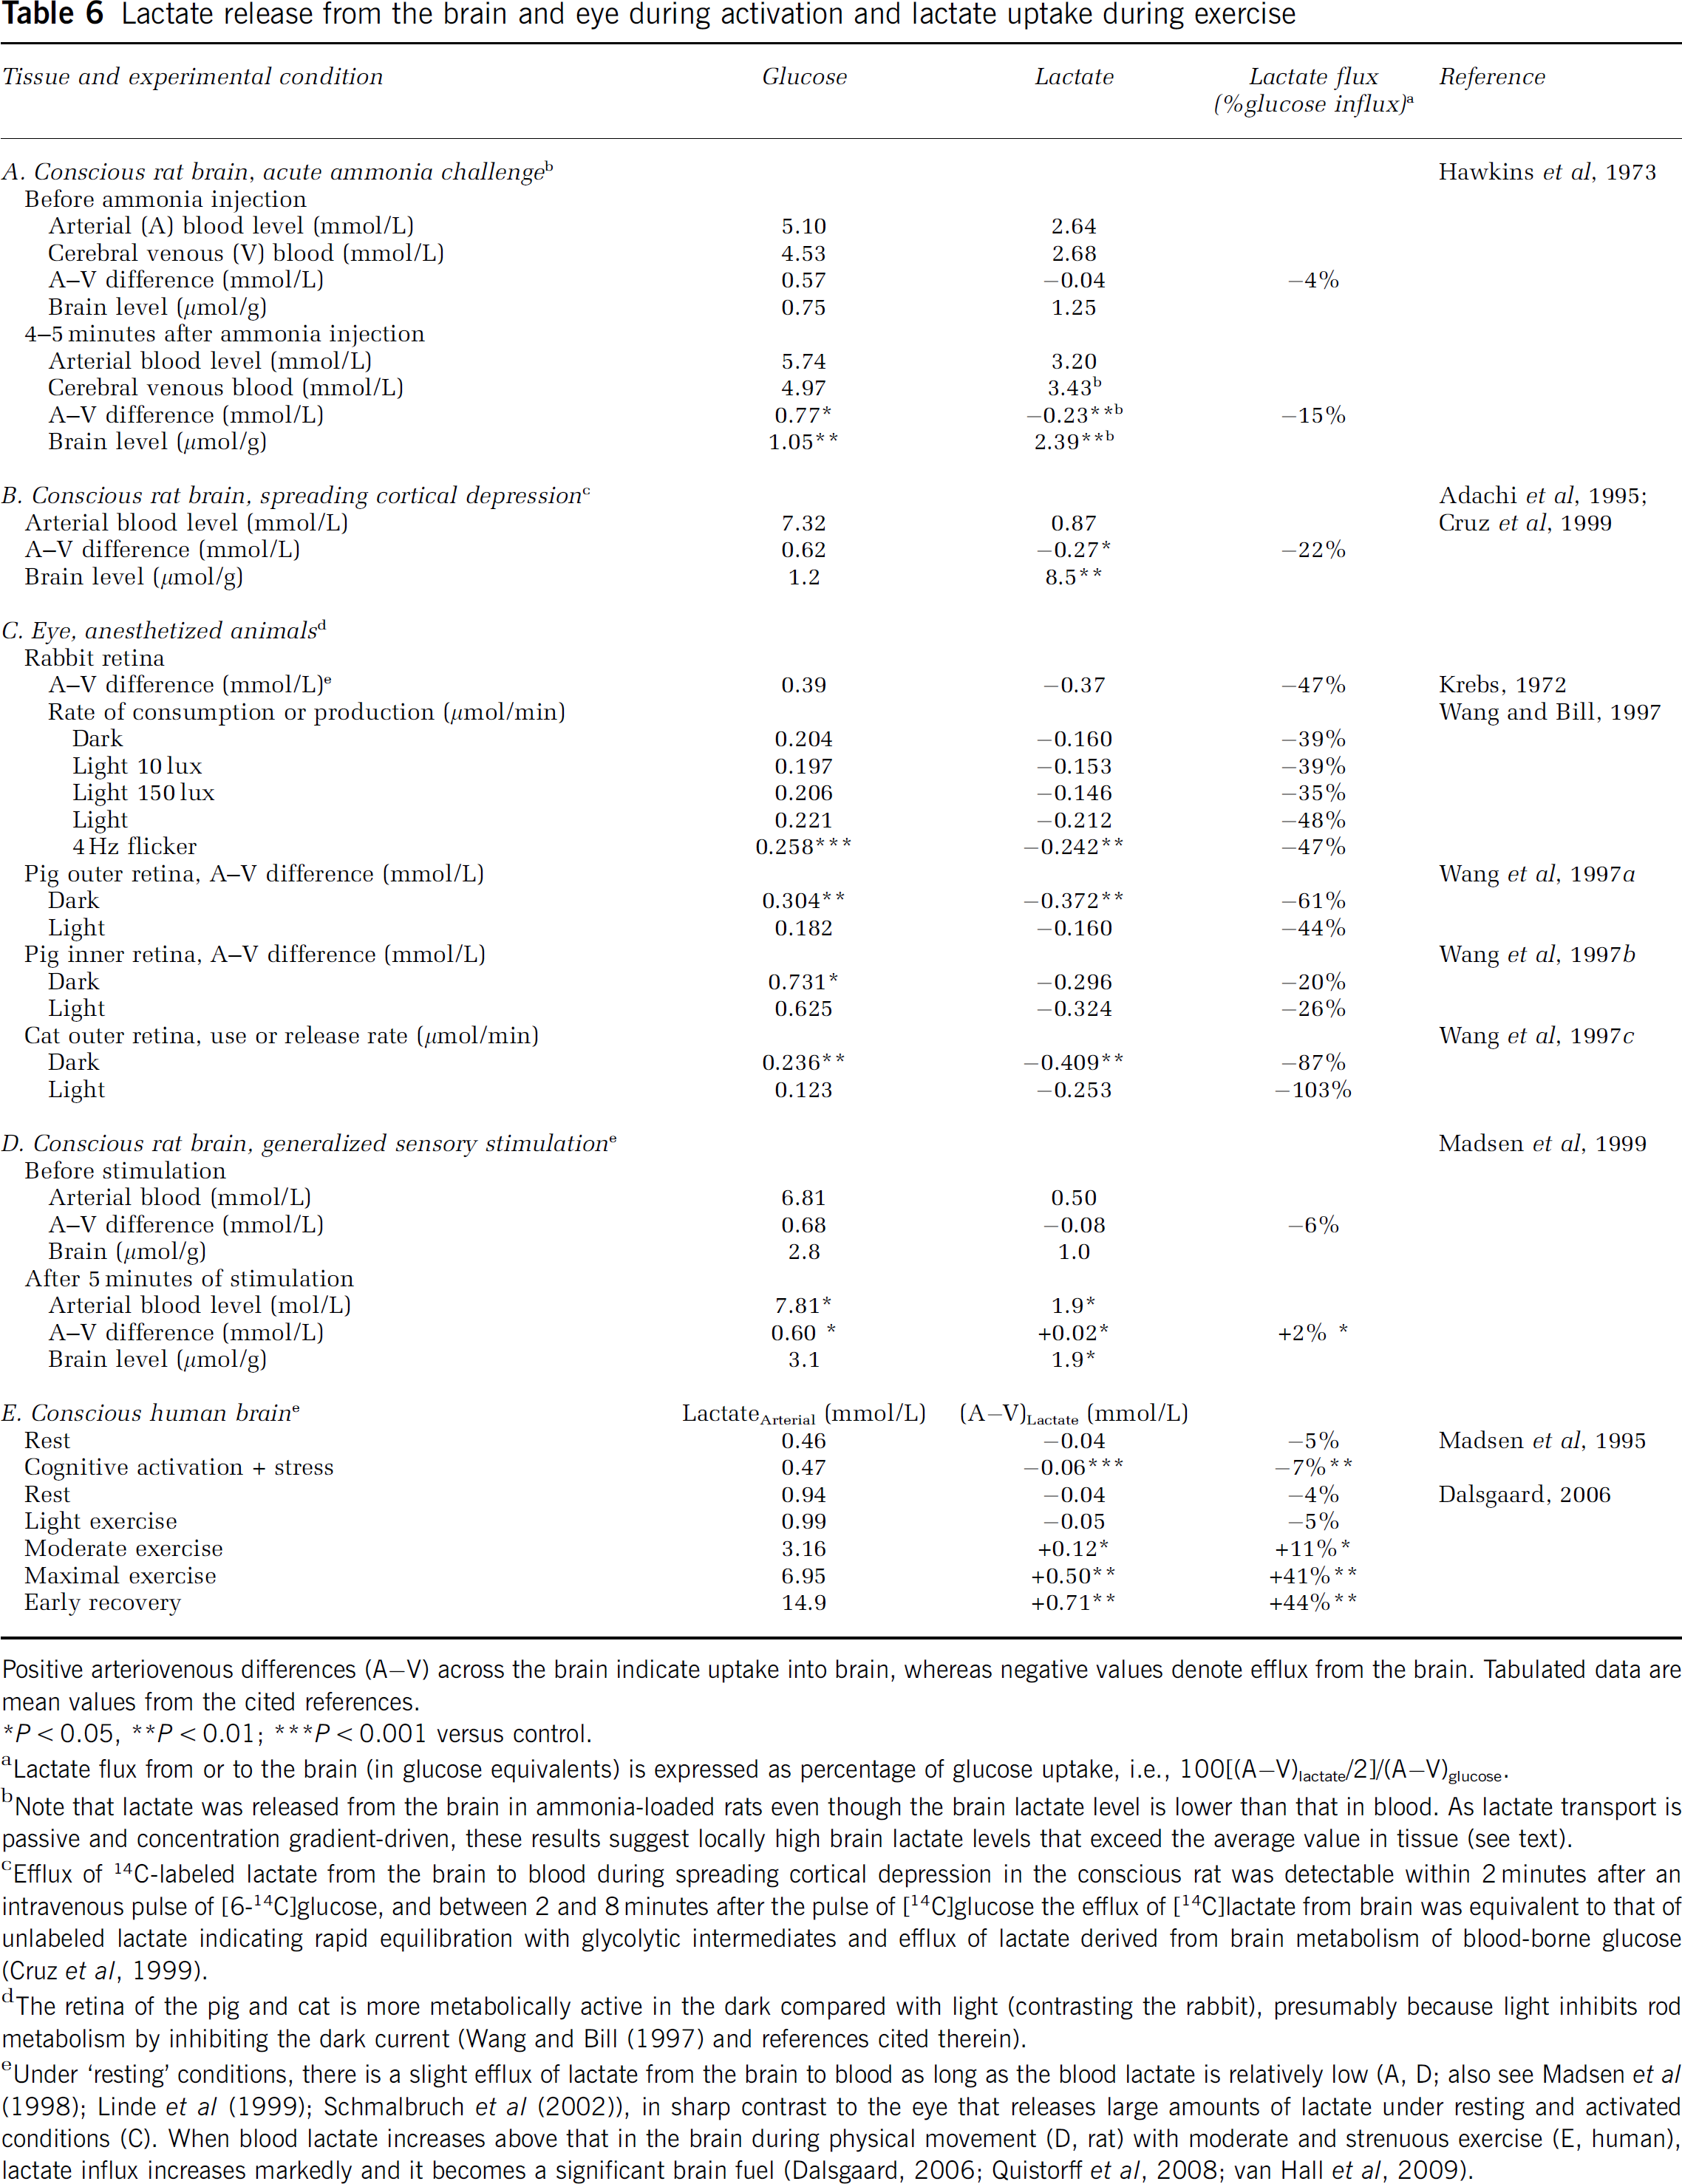
Positive arteriovenous differences (A−V) across the brain indicate uptake into brain, whereas negative values denote efflux from the brain. Tabulated data are mean values from the cited references.
∗
Lactate flux from or to the brain (in glucose equivalents) is expressed as percentage of glucose uptake, i.e., 100[(A−V)lactate/2]/(A−V)glucose.
Note that lactate was released from the brain in ammonia-loaded rats even though the brain lactate level is lower than that in blood. As lactate transport is passive and concentration gradient-driven, these results suggest locally high brain lactate levels that exceed the average value in tissue (see text).
Efflux of 14C-labeled lactate from the brain to blood during spreading cortical depression in the conscious rat was detectable within 2 minutes after an intravenous pulse of [6-14C]glucose, and between 2 and 8 minutes after the pulse of [14C]glucose the efflux of [14C]lactate from brain was equivalent to that of unlabeled lactate indicating rapid equilibration with glycolytic intermediates and efflux of lactate derived from brain metabolism of blood-borne glucose (Cruz et al, 1999).
The retina of the pig and cat is more metabolically active in the dark compared with light (contrasting the rabbit), presumably because light inhibits rod metabolism by inhibiting the dark current (Wang and Bill (1997) and references cited therein).
Under ‘resting’ conditions, there is a slight efflux of lactate from the brain to blood as long as the blood lactate is relatively low (A, D; also see Madsen et al (1998); Linde et al (1999); Schmalbruch et al (2002)), in sharp contrast to the eye that releases large amounts of lactate under resting and activated conditions (C). When blood lactate increases above that in the brain during physical movement (D, rat) with moderate and strenuous exercise (E, human), lactate influx increases markedly and it becomes a significant brain fuel (Dalsgaard, 2006; Quistorff et al, 2008; van Hall et al, 2009).
Extracellular Lactate as Fuel During Activation
Changes in extracellular metabolite levels can be measured with high temporal resolution using enzyme-linked sensors. Decreases in extracellular lactate level evoked by electrical stimulation (Hu and Wilson, 1997a, 1997b) are assumed to be caused by neuronal lactate metabolism and are cited as evidence supporting the astrocyte-neuron lactate shuttle hypothesis (Bergersen, 2007; Pellerin et al, 2007). Metabolite levels reported by Hu and Wilson (1997b) are expressed as percentage of basal level, and percentage data hinder quantitative comparisons between glucose and lactate utilization because percentage changes do not account for differences in substrate concentration and delivery. Interpretation of percentage data in terms of relative consumption rates can be quite misleading, and these values were, therefore, converted to concentrations and used to calculate utilization rates (Table 7). Stimulation for 1, 2, 3, or 4 seconds had no or little effect on extracellular glucose and lactate levels, and only 5-second stimuli evoked changes (Hu and Wilson, 1997b). Minimal CMRglc was calculated based on glucose delivered to the resting brain (hyperemic responses to activation are rapid but not quantified in this study; hence, the additional glucose delivered during a stimulus was not included in calculated CMRglc) plus extracellular glucose consumed during the stimulus. The resulting rate during the first stimulus is ∼5-fold higher than resting CMRglc (Table 7). This value is much higher than those evoked by strong physiologic stimuli (∼50% to 100%), raising the possibility of seizure-like activity. Maximal lactate utilization rate during the first stimulus was only 4% of glucose plus lactate utilization. During subsequent stimuli, the extracellular lactate level increased and percentage decreases were larger, contrasting the lower baseline for extracellular glucose and lower percentage decreases during stimulation. Minimal CMRglc increased 4.5- to 6-fold during subsequent stimuli, and maximal lactate utilization was ∼20% to 30% of the total (Table 7). Maximal lactate utilization contributed a trivial fraction to metabolism during the first episode and <1/3 of the total (ignoring upregulation of glucose delivery and utilization) during ensuing stimulus events.
Glucose utilization increases 5–6-fold and greatly exceeds lactate utilization after electrical stimulation of hippocampal dentate gyrus
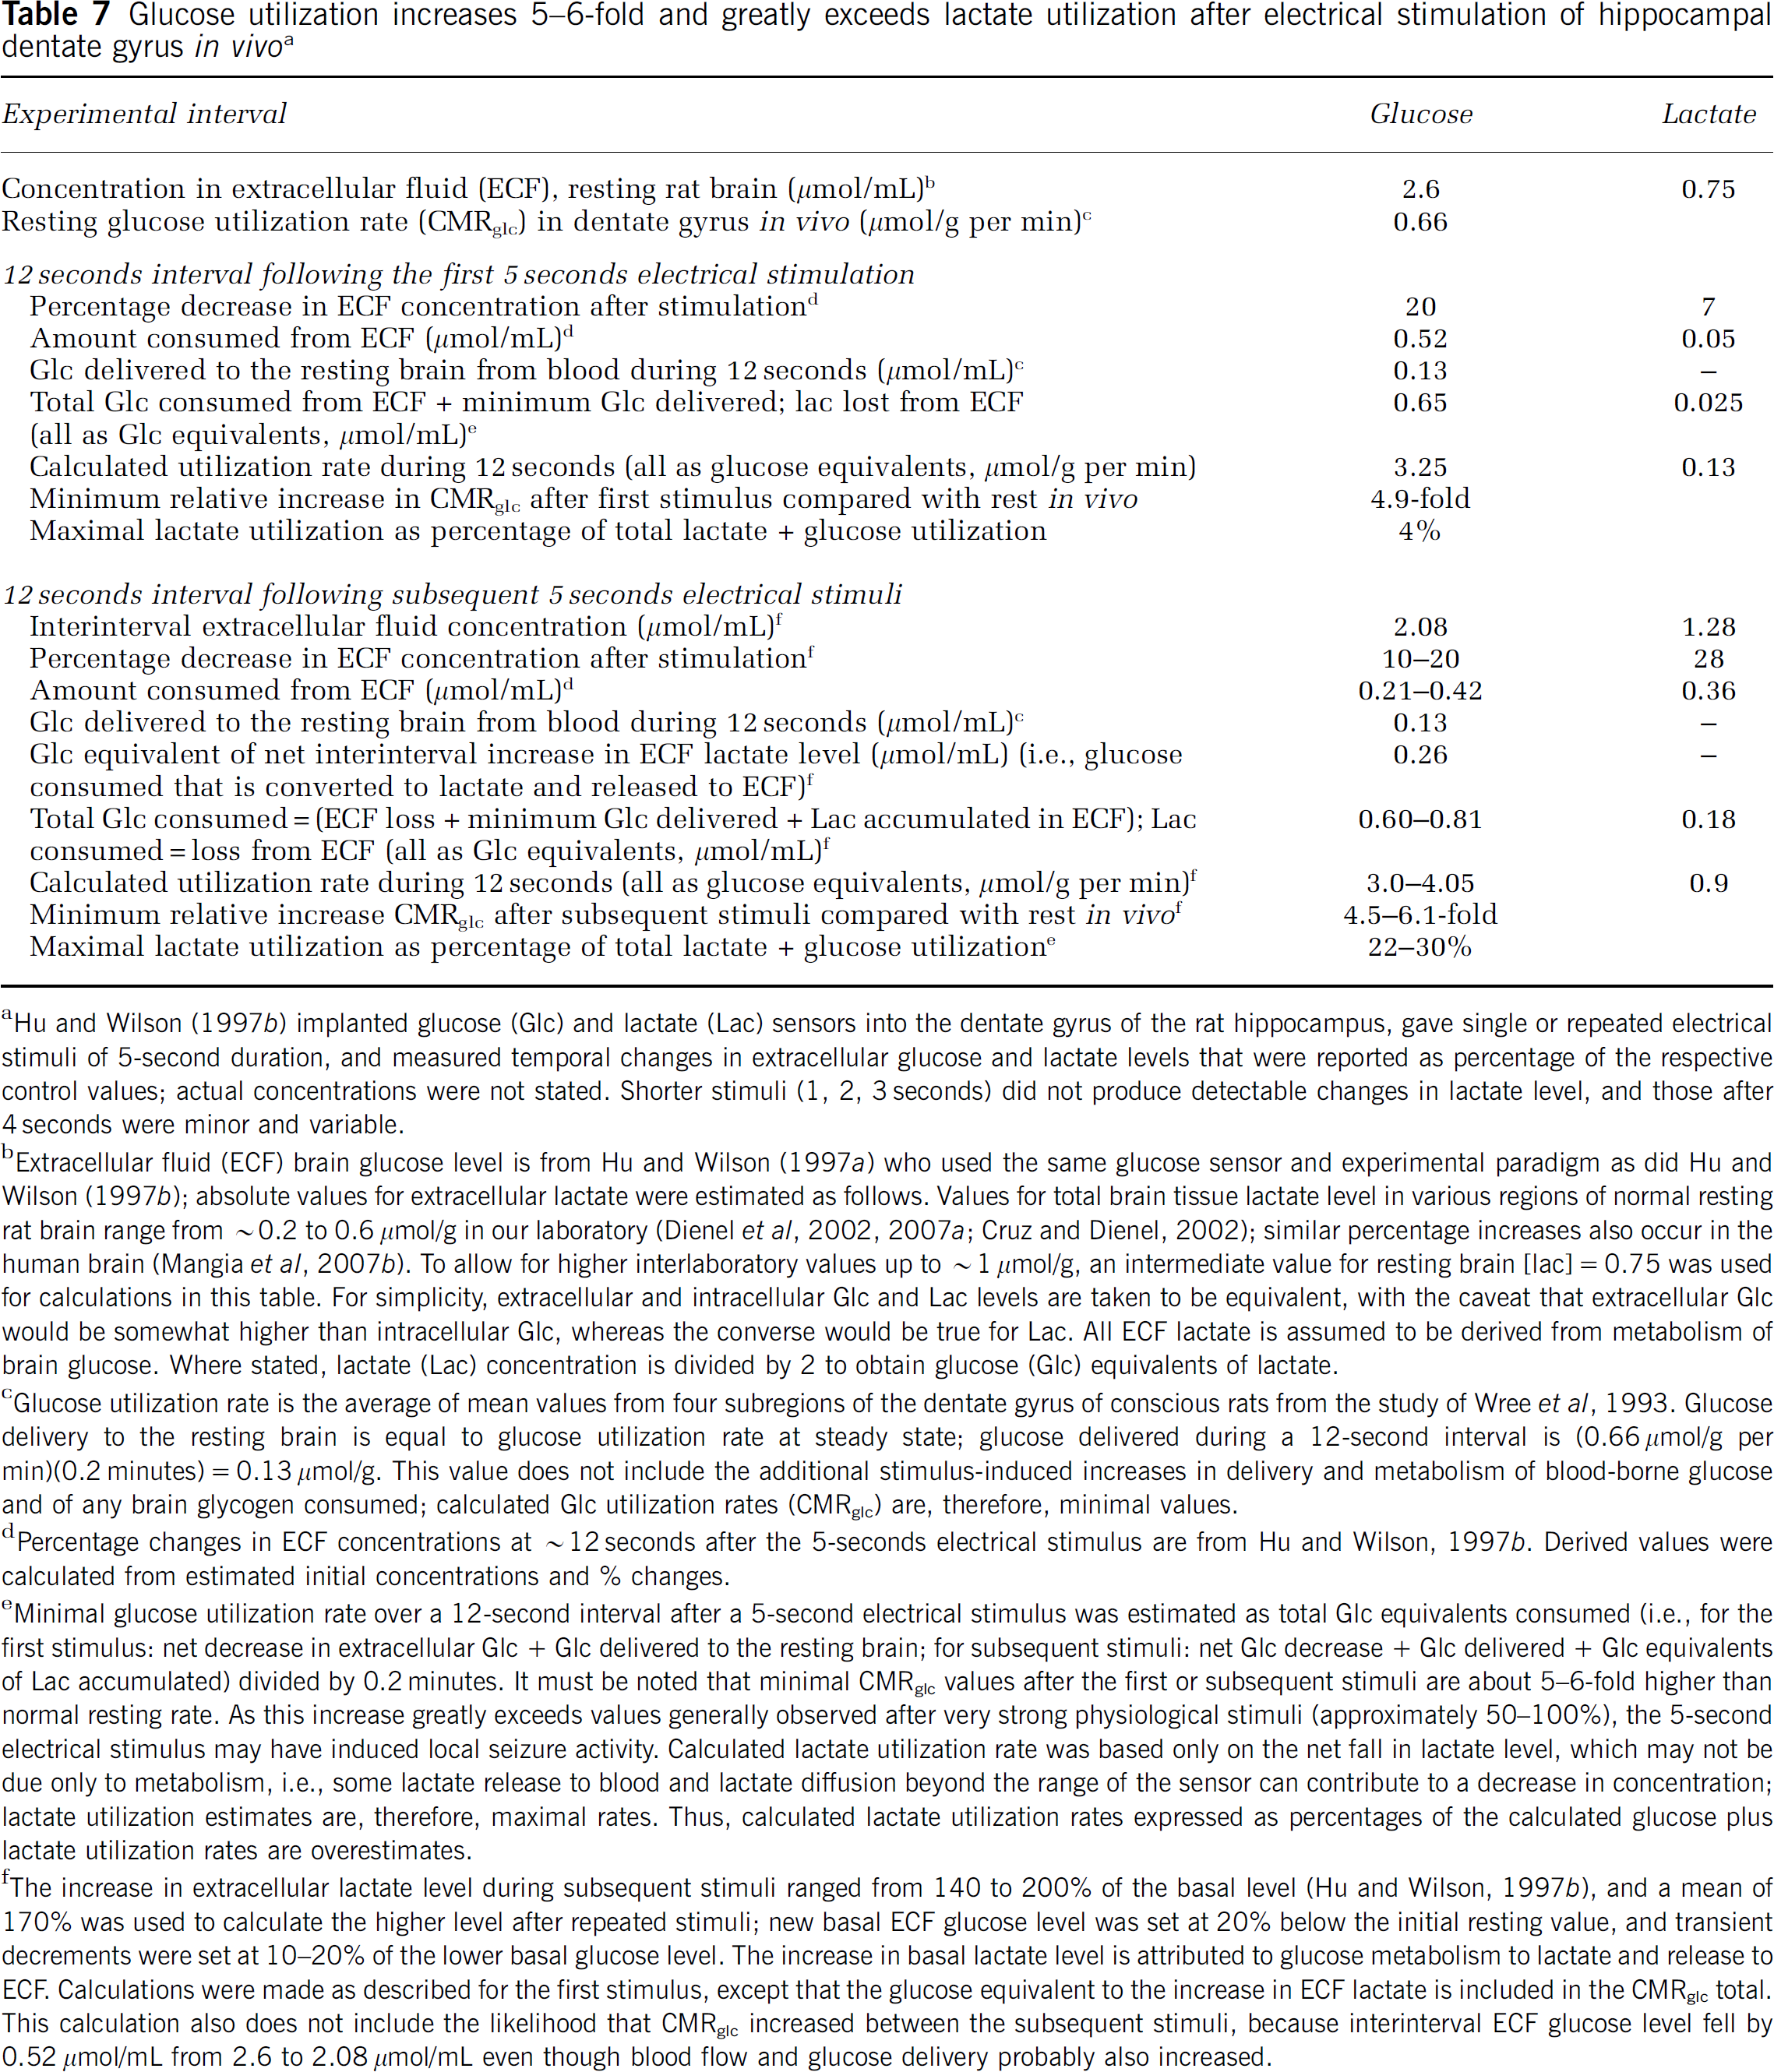
Hu and Wilson (1997b) implanted glucose (Glc) and lactate (Lac) sensors into the dentate gyrus of the rat hippocampus, gave single or repeated electrical stimuli of 5-second duration, and measured temporal changes in extracellular glucose and lactate levels that were reported as percentage of the respective control values; actual concentrations were not stated. Shorter stimuli (1, 2, 3 seconds) did not produce detectable changes in lactate level, and those after 4 seconds were minor and variable.
Extracellular fluid (ECF) brain glucose level is from Hu and Wilson (1997a) who used the same glucose sensor and experimental paradigm as did Hu and Wilson (1997b); absolute values for extracellular lactate were estimated as follows. Values for total brain tissue lactate level in various regions of normal resting rat brain range from ∼0.2 to 0.6
Glucose utilization rate is the average of mean values from four subregions of the dentate gyrus of conscious rats from the study of Wree et al, 1993. Glucose delivery to the resting brain is equal to glucose utilization rate at steady state; glucose delivered during a 12-second interval is (0.66
Percentage changes in ECF concentrations at ∼12 seconds after the 5-seconds electrical stimulus are from Hu and Wilson, 1997b. Derived values were calculated from estimated initial concentrations and % changes.
Minimal glucose utilization rate over a 12-second interval after a 5-second electrical stimulus was estimated as total Glc equivalents consumed (i.e., for the first stimulus: net decrease in extracellular Glc + Glc delivered to the resting brain; for subsequent stimuli: net Glc decrease + Glc delivered + Glc equivalents of Lac accumulated) divided by 0.2 minutes. It must be noted that minimal CMRglc values after the first or subsequent stimuli are about 5–6-fold higher than normal resting rate. As this increase greatly exceeds values generally observed after very strong physiological stimuli (approximately 50–100%), the 5-second electrical stimulus may have induced local seizure activity. Calculated lactate utilization rate was based only on the net fall in lactate level, which may not be due only to metabolism, i.e., some lactate release to blood and lactate diffusion beyond the range of the sensor can contribute to a decrease in concentration; lactate utilization estimates are, therefore, maximal rates. Thus, calculated lactate utilization rates expressed as percentages of the calculated glucose plus lactate utilization rates are overestimates.
The increase in extracellular lactate level during subsequent stimuli ranged from 140 to 200% of the basal level (Hu and Wilson, 1997b), and a mean of 170% was used to calculate the higher level after repeated stimuli; new basal ECF glucose level was set at 20% below the initial resting value, and transient decrements were set at 10–20% of the lower basal glucose level. The increase in basal lactate level is attributed to glucose metabolism to lactate and release to ECF. Calculations were made as described for the first stimulus, except that the glucose equivalent to the increase in ECF lactate is included in the CMRglc total. This calculation also does not include the likelihood that CMRglc increased between the subsequent stimuli, because interinterval ECF glucose level fell by 0.52
To sum up, the static extracellular lactate content is unlikely to be a major brain fuel owing to its low level (∼0.5 to 2
Changes in Metabolite Concentrations Need not Predict Flux Magnitude or Direction
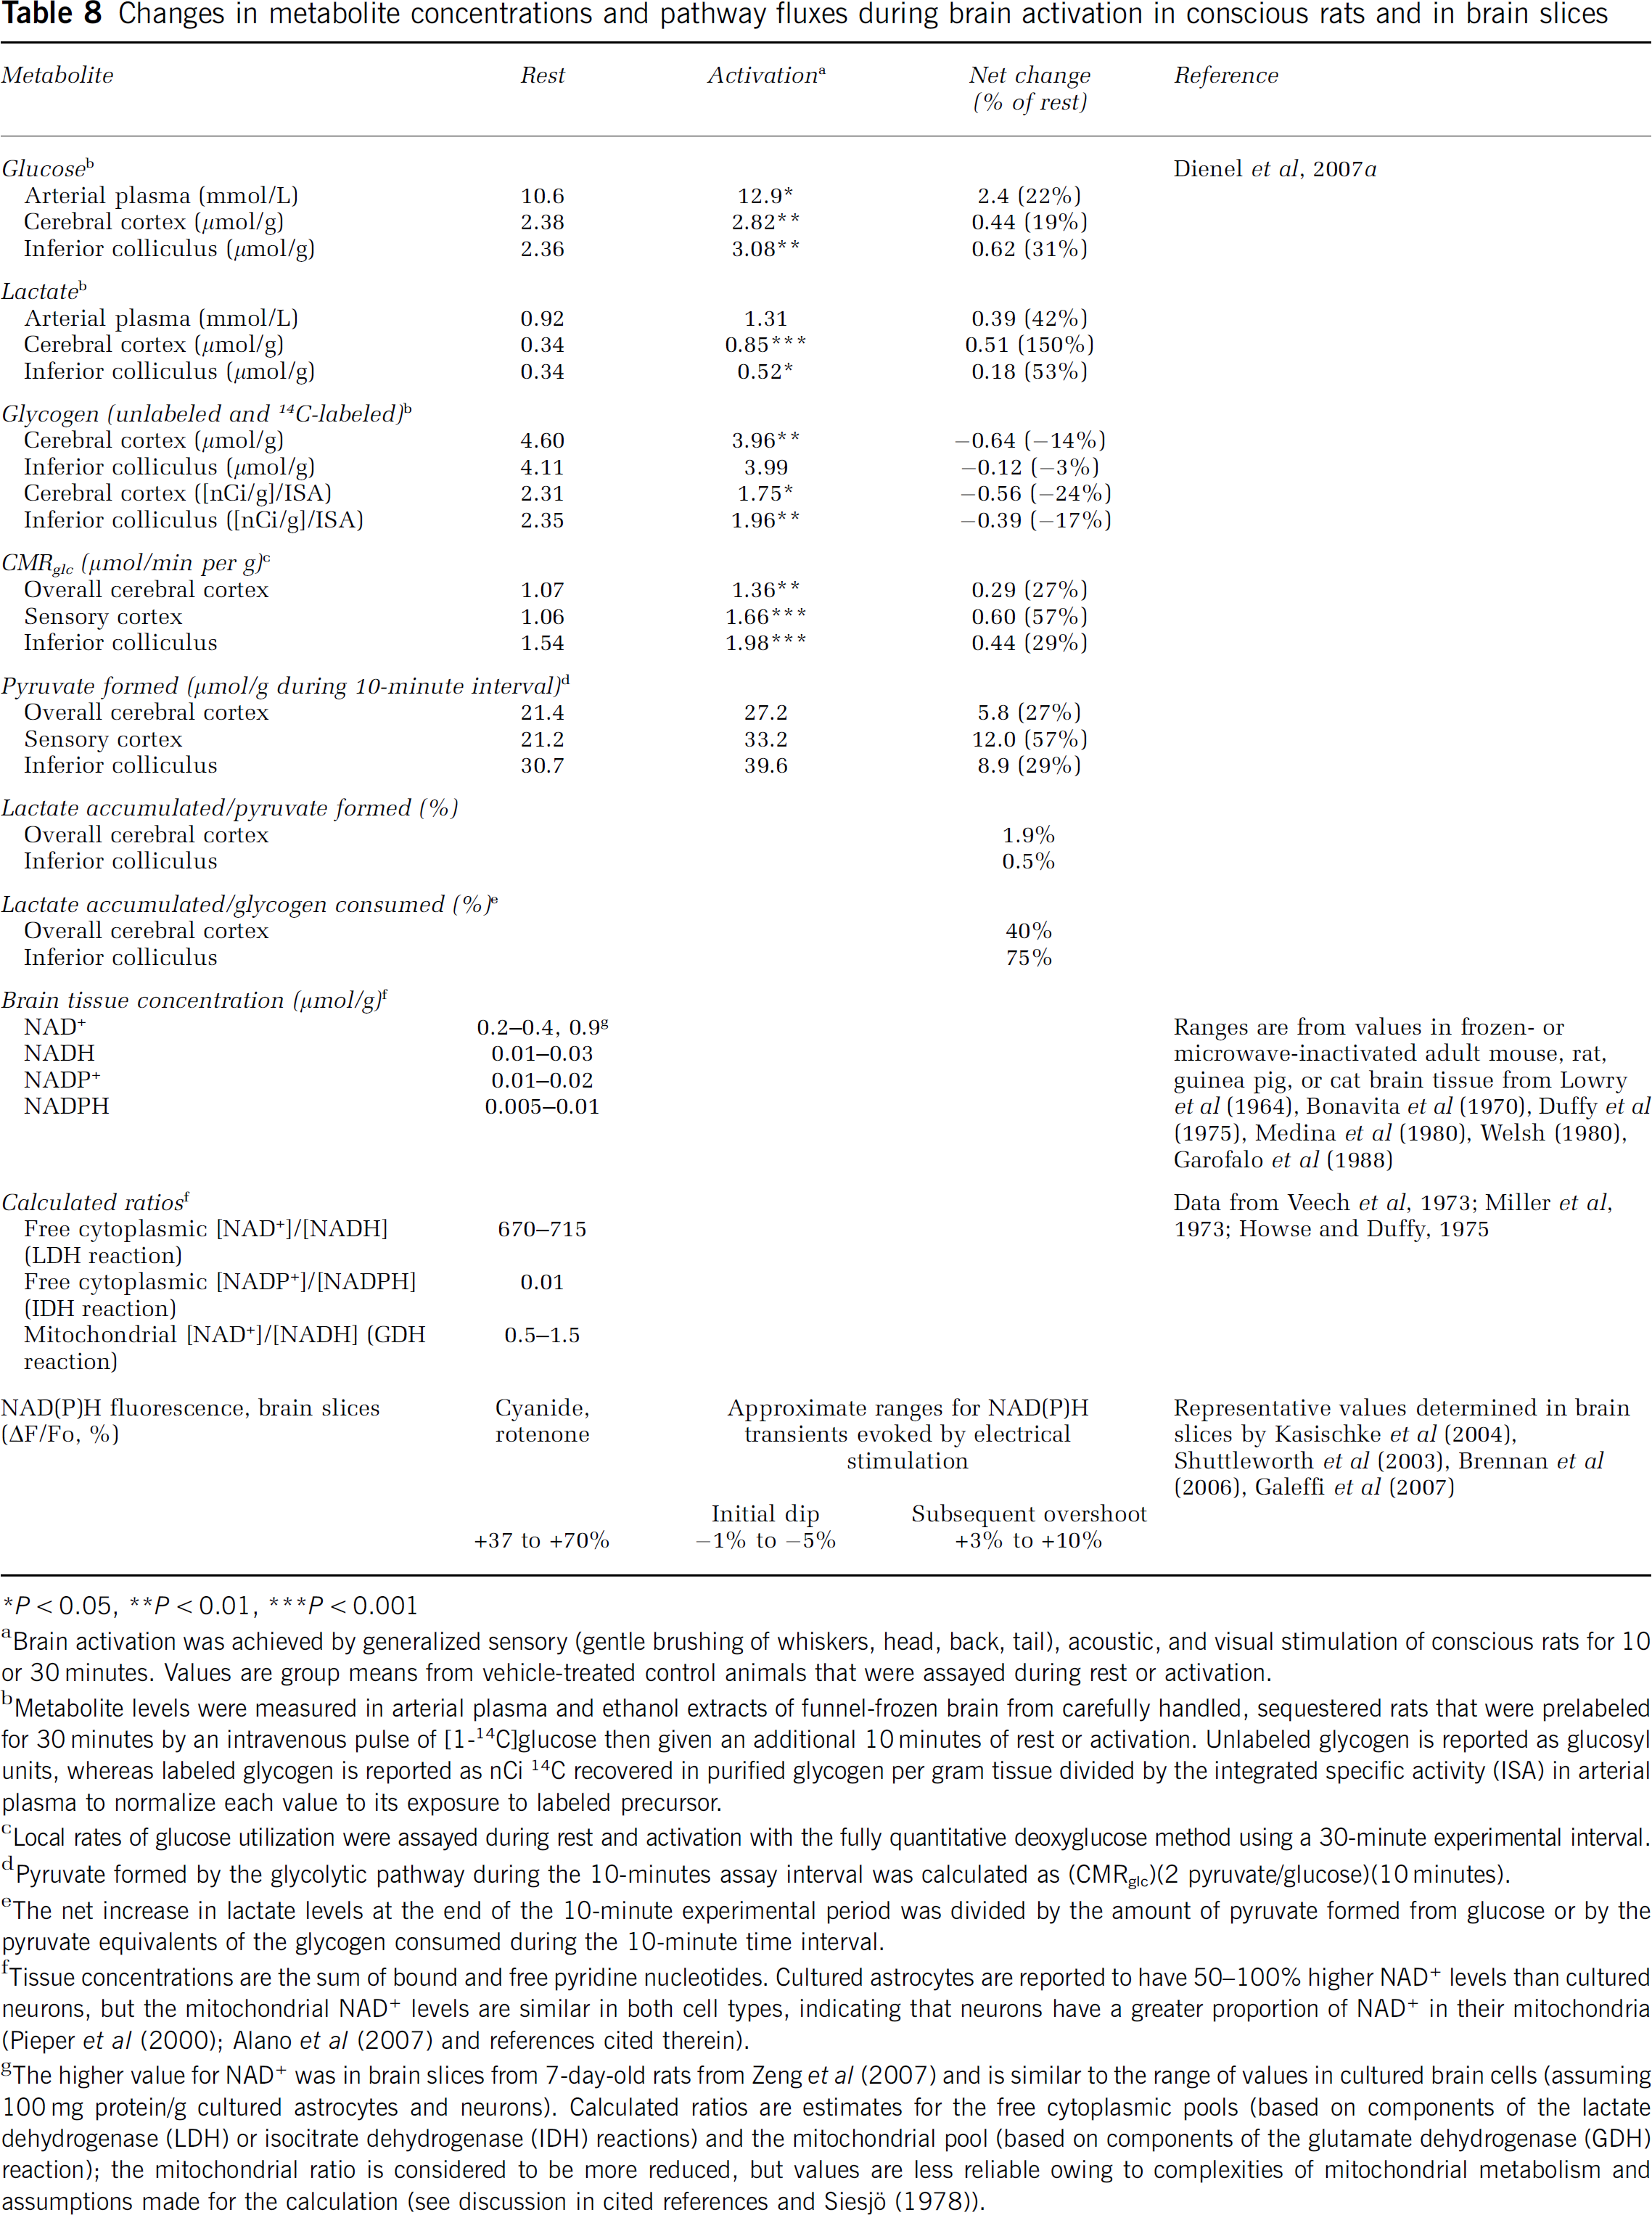
Concentration changes arise from input–output differences, and without further information they cannot be used to evaluate shifts in metabolic rate. For example, during studies of sensory stimulation of nonfasted, conscious rats, the animals moved around, causing arterial plasma glucose and lactate levels to increase. These changes were accompanied by increases in brain glucose and lactate concentrations, presumably owing to transport down their concentration gradients (Table 8). Interpretation of increased brain glucose level as reflecting reduced CMRglc would be wrong, because CMRglc increased by 27% to 57% and glycogen turnover increased. Net accumulation of lactate in the brain corresponded to <2% of the pyruvate produced from glucose, and some lactate could be derived from glycogen (Table 8). To summarize, the large percentage changes in lactate concentration reflect small quantities and do not reflect glucose flux through the pyruvate pool.
Changes in metabolite concentrations and pathway fluxes during brain activation in conscious rats and in brain slices
∗
Brain activation was achieved by generalized sensory (gentle brushing of whiskers, head, back, tail), acoustic, and visual stimulation of conscious rats for 10 or 30 minutes. Values are group means from vehicle-treated control animals that were assayed during rest or activation.
Metabolite levels were measured in arterial plasma and ethanol extracts of funnel-frozen brain from carefully handled, sequestered rats that were prelabeled for 30 minutes by an intravenous pulse of [1-14C]glucose then given an additional 10 minutes of rest or activation. Unlabeled glycogen is reported as glucosyl units, whereas labeled glycogen is reported as nCi 14C recovered in purified glycogen per gram tissue divided by the integrated specific activity (ISA) in arterial plasma to normalize each value to its exposure to labeled precursor.
Local rates of glucose utilization were assayed during rest and activation with the fully quantitative deoxyglucose method using a 30-minute experimental interval.
Pyruvate formed by the glycolytic pathway during the 10-minutes assay interval was calculated as (CMRglc)(2 pyruvate/glucose)(10 minutes).
The net increase in lactate levels at the end of the 10-minute experimental period was divided by the amount of pyruvate formed from glucose or by the pyruvate equivalents of the glycogen consumed during the 10-minute time interval.
Tissue concentrations are the sum of bound and free pyridine nucleotides. Cultured astrocytes are reported to have 50–100% higher NAD+ levels than cultured neurons, but the mitochondrial NAD+ levels are similar in both cell types, indicating that neurons have a greater proportion of NAD+ in their mitochondria (Pieper et al (2000); Alano et al (2007) and references cited therein).
The higher value for NAD+ was in brain slices from 7-day-old rats from Zeng et al (2007) and is similar to the range of values in cultured brain cells (assuming 100 mg protein/g cultured astrocytes and neurons). Calculated ratios are estimates for the free cytoplasmic pools (based on components of the lactate dehydrogenase (LDH) or isocitrate dehydrogenase (IDH) reactions) and the mitochondrial pool (based on components of the glutamate dehydrogenase (GDH) reaction); the mitochondrial ratio is considered to be more reduced, but values are less reliable owing to complexities of mitochondrial metabolism and assumptions made for the calculation (see discussion in cited references and Siesjö (1978)).
Endogenous fluorescent compounds, NADH, NADPH, and FAD, are commonly used in microscopic studies to localize and evaluate redox changes during activation (Shuttleworth, 2010). Activation-induced changes in fluorescence (ΔF/F) are generally very small (<10%) and are far below the responses to metabolic inhibitors (Table 8). The total concentrations of these redox compounds are quite low and the calculated cytoplasmic NAD+/NADH ratio is very high, indicating that most of this total cofactor pool is not fluorescent (Table 8). Thus, the baseline fluorescence (F) and the induced response (ΔF) correspond to only to a small fraction of the total amount of NAD++NADH. Owing to low cofactor concentration and high glucose metabolic rates, cofactor oxidation-reduction turnover that accompanies pathway fluxes is high. Glycolytic or oxidative rate information cannot be obtained from ΔF/F.
Glucose-Sparing Action of Alternative Substrates that Increase in Blood During Abnormal or Specific Conditions
In the 1960s, studies of human brain metabolism during prolonged starvation revealed that ketone body oxidation could account for ∼60% of the oxygen consumed. Ketone bodies spared glucose oxidation while permitting glycolysis and release of lactate and pyruvate from the brain (Table 9). Glucose-sparing effects of ketone bodies in different organs have been attributed, in part, to increased citrate levels and inhibition by citrate of phosphofructokinase, causing reduced glucose oxidation and release of lactate as gluconeogenic substrate (Robinson and Williamson, 1980). High levels of ketone bodies (2.5 to 17 mmol/L) and lactate (4 to 8 mmol/L) also reduce glucose oxidation in brain slices and in infused, starved, or fat-fed rats (Table 9). Some studies report that exercising humans with elevated lactate levels (4 to 14 mmol/L) have reduced brain CMRglc, whereas other studies find increased glucose and lactate metabolism during strenuous exercise (Table 9). Rats exercising at 85% of maximal respiratory rate had heterogeneous regional increases in CMRglc and no decreases (Table 9). High levels of three oxidative substrates, lactate, glutamine, and pyruvate, in tissue culture media reduce glucose utilization in astrocytes and neurons in a dose-dependent manner (Table 9). When cultured forebrain neurons were incubated with lactate and glucose (1 mmol/L of each substrate), lactate was calculated to contribute 75% to total oxidative metabolism (Bouzier-Sore et al, 2006; Table 9). This conclusion sharply contrasts the quite small, 4% to 8%, contribution of lactate to oxidative metabolism in the brain of humans infused with lactate to achieve plasma and brain lactate levels of ∼0.6 to 4.1 mmol/L and ∼0.4 to 3
Utilization of alternative fuel and inhibition of glucose utilization by high concentrations of ketone bodies and lactate
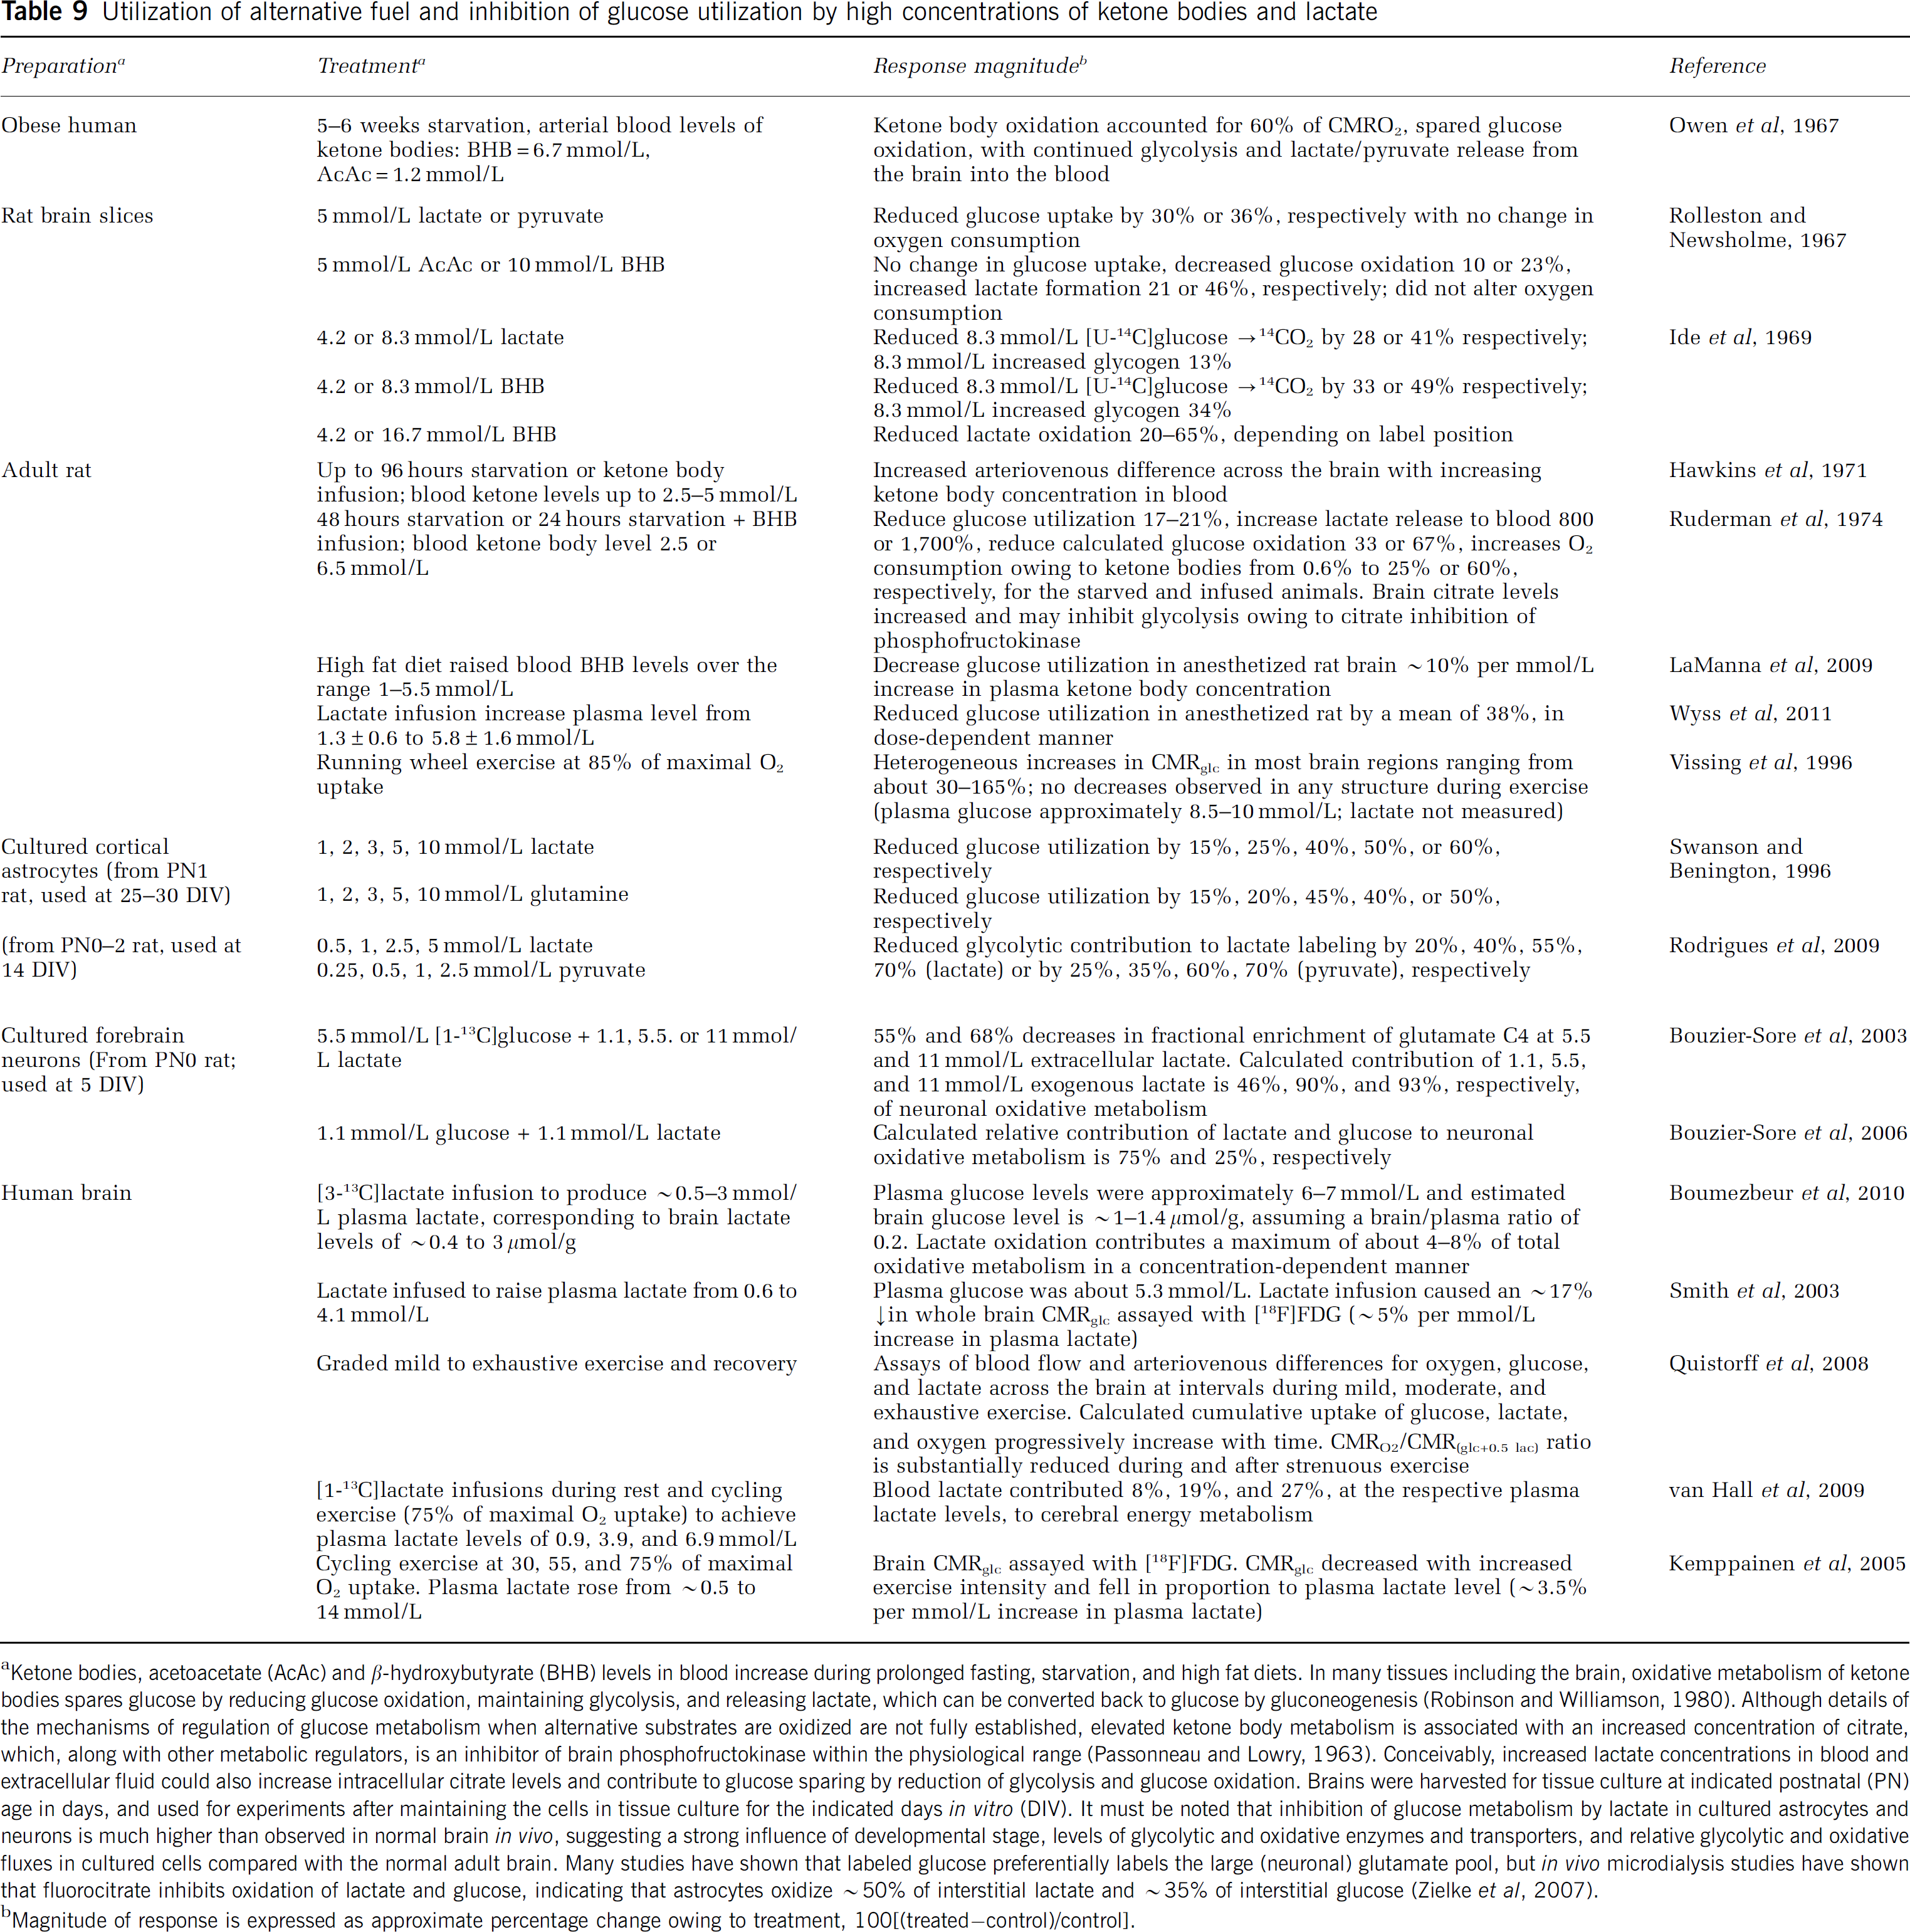
Ketone bodies, acetoacetate (AcAc) and
Magnitude of response is expressed as approximate percentage change owing to treatment, 100[(treated−control)/control].
Evaluation of Roles of Lactate by Monocarboxylic Acid Transporter Inhibition
As lactate shuttling among brain cells is very difficult to evaluate, an MCT inhibitor (e.g., α-cyano-4-hydroxycinnamate or 4-CIN) is often used to assess effects of extracellular lactate on neuronal function, and decrements caused by transport blockade are inferred to reflect insufficient lactate fuel. However, these types of studies are difficult to interpret because low levels of 4-CIN severely inhibit pyruvate transport into the mitochondria from the rat heart and liver (<10
Effects of
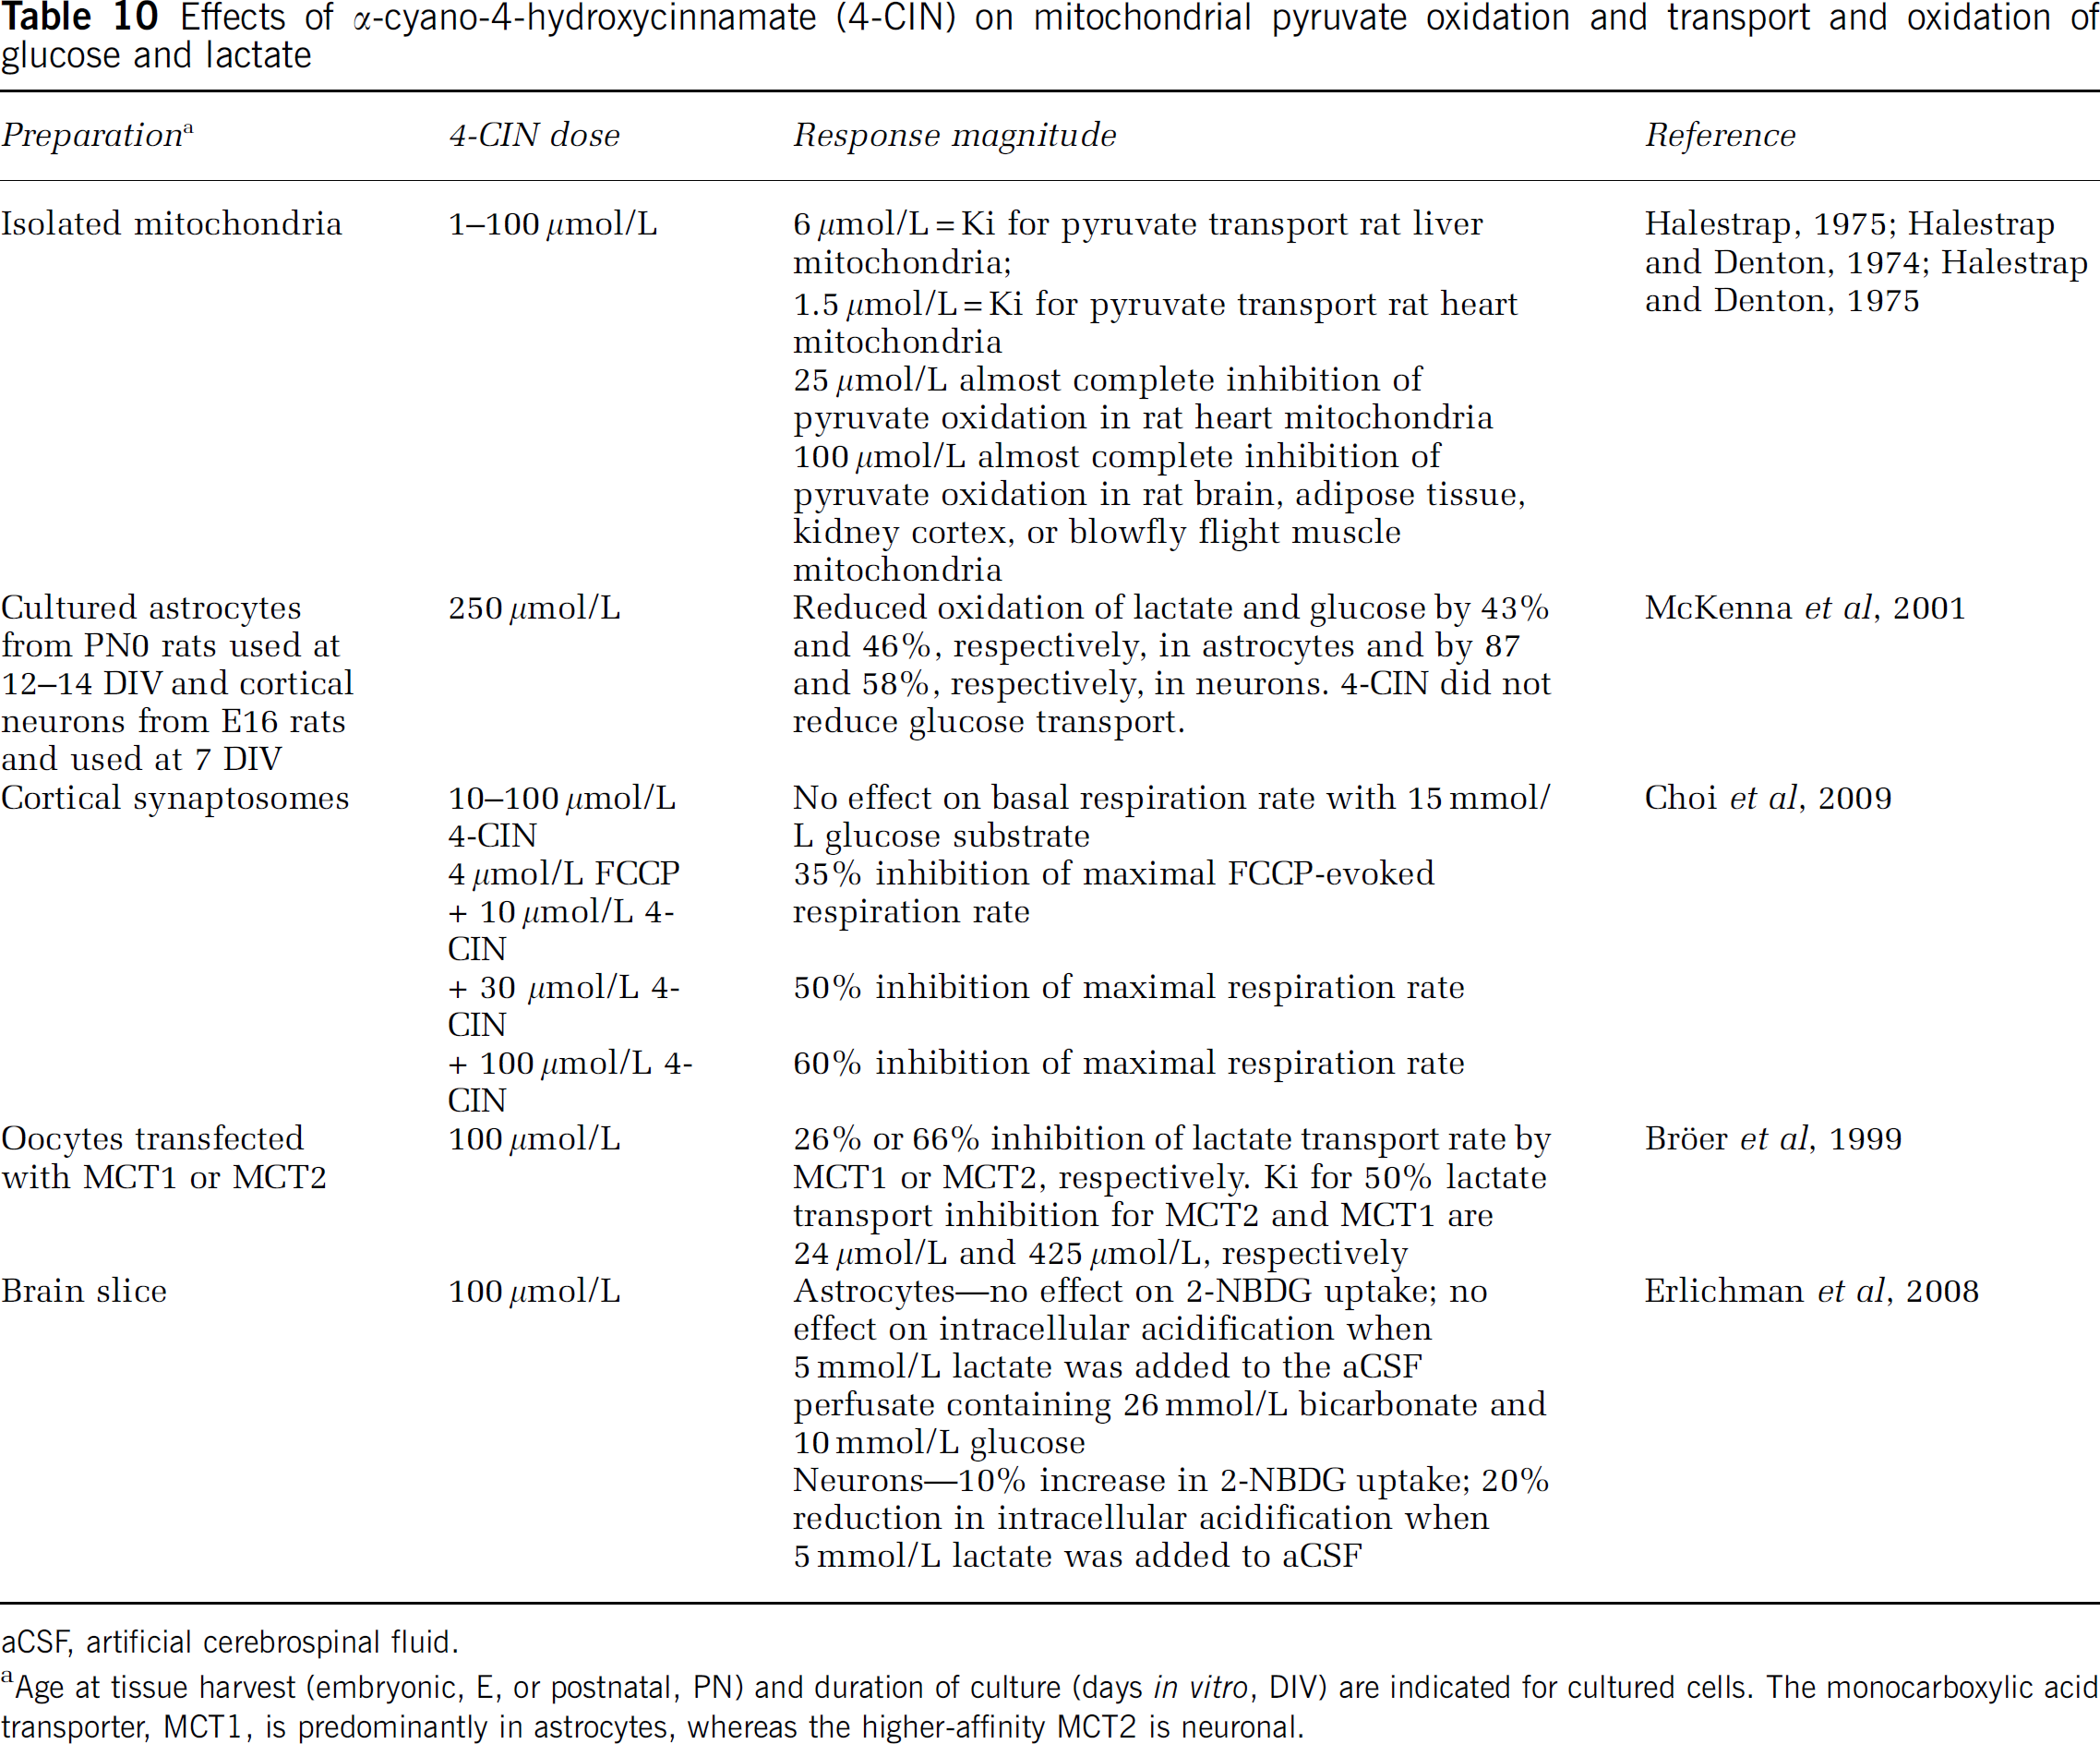
aCSF, artificial cerebrospinal fluid.
Age at tissue harvest (embryonic, E, or postnatal, PN) and duration of culture (days
Metabolic Modeling and Simulation Studies
Metabolic modeling is necessary to calculate glucose utilization and glucose oxidation rates from labeling studies carried out
In their revised, more comprehensive model for coupling of glucose metabolism with synaptic activity, Hyder et al, 2006 predict (see their Figure 5) that most of the glucose consumed during activation is used glycolytically by astrocytes, with significant lactate shuttling to neurons and lactate oxidation by neurons. This model also predicts very little (a few percent) lactate release from the brain, contrasting the much greater label release (∼50%; see above, ‘Underestimation of metabolic activation with labeled glucose’) based on autoradiographic and biochemical studies of brain activation in conscious rats assayed in parallel with [6-14C]glucose and [14C]deoxyglucose (Collins et al, 1987; Ackermann and Lear, 1989; Adachi et al, 1995; Cruz et al, 1999, 2007). The basis for the quantitative differences in the fate of lactate in the 14C- and 13C-magnetic resonance spectroscopic assays remains to be established. Assays of total glucose metabolized and rates of glycolytic, glycogenolytic, oxidative, and anaplerotic (i.e., biosynthetic) pathways are required to have a fuller understanding of brain metabolic activation and roles of lactate.
Metabolic modeling and computer-based simulations are also very useful to predict pathway fluxes in neurons and astrocytes under various test conditions. Calculated rates and predicted outcomes are critically influenced by model assumptions that define the metabolic capabilities and energetic demands of neurons and astrocytes and their subcellular compartments, the magnitude of metabolic activation, cellular concentrations of glucose and lactate transporters, kinetic properties of the endothelial, neuronal, and astrocytic nutrient transporters, and other factors. Model assumptions govern the predicted cellular consumption of glucose, the cellular origin of lactate, and the direction of lactate shuttling (i.e., the astrocyte to neuron or neuron to astrocyte), and the magnitude and duration of lactate concentration changes. Different models, modeling principles, and model assumptions underlie discordant conclusions related to the roles of lactate and glucose in brain activation derived from computer-based simulation studies. Interested readers are referred to studies by Aubert et al (2005, 2007), Aubert and Costalat (2007), Simpson et al (2007), DiNuzzo et al (2010a,2010b), Mangia et al (2009b), Barros and Deitmer (2010), Occhipinti et al (2010), and Calvetti and Somersalo (2011) and commentaries by Jolivet et al (2010) and Mangia et al (2011) for detailed discussions of assumptions and limitations of transport and metabolic models and of simulations derived from them.
Concluding Comments
A wealth of data obtained over several decades in many laboratories shows that cultured neurons and synaptosomes are capable of greatly increasing glucose transport, glycolysis, and glucose-supported respiration under many experimental conditions that increase energy demand. The emphasis of this review is on measured data that directly or indirectly relate to brain lactate metabolism. Modeling and simulation studies are also very useful to predict outcomes, as well as to suggest and design critical experiments. Data in Tables 1 to 10 identify strong trends and some discordant findings, and elucidation of the basis for apparently discrepant results will help understand important characteristics of brain cells. Incorporation of results from
Outwardly Directed Lactate Concentration Gradient from the Activated Brain to Blood in Physically Inactive Subjects with Low Plasma Lactate Levels
Brain activation usually causes disproportionately greater increases in CBF and CMRglc compared with CMRO2 (Dienel and Cruz, 2004, 2008). Glycolytic activation increases intracellular lactate concentration, causing lactate to diffuse down its concentration gradient to extracellular fluid. Lactate can then be avidly taken up into astrocytes (Gandhi et al, 2009), channeled through the astrocytic syncytium through gap junctions, and discharged from astrocytic endfeet to perivascular fluid and the vasculature, where it may serve as a signaling molecule for blood flow regulation. Rapid efflux of labeled lactate from the brain during activation contributes to the ∼50% underestimates of CMRglc by labeled glucose in autoradiographic and positron emission tomographic studies. Generation and release of unlabeled lactate contributes to the decrease in CMRO2/CMRglc ratio during activation. It must be noted that the small increases in CMRO2, if any, during activation reflect oxygen consumed by oxidation of all compounds. As lactate utilization must consume oxygen, the maximal contribution of any increase in lactate shuttling to total oxidation during activation cannot exceed the ΔCMRO2. For example, if CMRglc increases by 50% and CMRO2 increases 20%, this increase in CMRO2 corresponds to oxidation of the additional pyruvate derived from glucose, glycogen, and lactate, and oxidation of any other compounds in neurons and astrocytes. If neurons account for half of the additional oxygen consumed by direct metabolism of glucose-derived pyruvate, then lactate shuttling cannot exceed half of the net increase in CMRO2, or 10% in this example.
Inwardly Directed Lactate Concentration Gradient from the Blood to the Entire Brain in Subjects with High Blood Lactate Levels
Lactate flooding during lactate infusions and strenuous exercise (and
Cell-Type Specific Production of Lactate, Cell-to-Cell Lactate Shuttling, and Lactate Oxidation or Release
Many studies carried out in different laboratories over several decades show the high glycolytic and respiratory capacity of nerve endings and cultured neurons. These findings are consistent with high neuronal glucose utilization
Taken together, many independent lines of evidence obtained
Failure of glutamate transport blockade to reduce stimulus-evoked lactate increases, and metabolic activation in the cerebellum (as does an AMPA receptor blocker; Caesar et al (2008)) is consistent with the low predicted ATP cost for astrocytic participation in glutamate–glutamine cycling compared with postsynaptic and other signaling events (Attwell and Laughlin, 2001). Astrocytes increase glycogenolysis and oxidative metabolism during activation, besides their presumed use of blood glucose. Glycogenolysis generates glucose-6-phosphate that serves as fuel for astrocytes and can also inhibit astrocytic hexokinase activity, providing a mechanism to divert blood-borne glucose for use by neurons (DiNuzzo et al, 2010b). Small increases in astrocytic oxidative metabolism during activation
Release of lactate from the resting and activated brain even though it can serve as an oxidative fuel is an important, unresolved issue that probably involves many factors, including the following: (1) the rapid-onset hyperemic response delivers more fuel to the brain; (2) glucose supply to brain exceeds demand by a factor of at least 1.5 in normoglycemic subjects over a wide range of CMRglc and glucose levels in rats (Cremer et al, 1983; Hargreaves et al, 1986) and humans (Shestov et al (2011) and references cited therein); (3) lactate release to perivascular fluid may enhance the hyperemic response during activation by causing vasodilation; (iv) spatial–temporal interactions of increased energy demand (e.g., plasma membrane ion pumps) during activation may preferentially depend on glycolysis and channeling of lactate, with its discharge from astrocytic endfeet to perivascular space. Excess glucose delivery and high-capacity neuronal glucose transport and metabolism support the conclusion that neurons do not need lactate as supplemental fuel under normal activating conditions. In contrast, lactate flooding of the brain owing to elevated blood levels would normally occur when whole-body glycolytic metabolism may exceed overall oxidative metabolism, such as during strenuous physical work, exercise, and hypoxia. High blood lactate levels abolish brain lactate efflux gradients and can evoke glucose-sparing responses in brain and other organs. Alternative substrates can also substantially contribute to brain energetics when glucose supply is inadequate, e.g., during hypoglycemia or intense brain activity. Most
In conclusion, detailed studies of brain energy metabolism and neurotransmission and their interrelationships during the past 40 years have substantially increased our understanding of the cellular contributions to brain function, imaging, and spectroscopic studies. Development of new approaches to resolve discordant results and extend current technologies is expected to have a high impact on the use of metabolic imaging techniques to assess cellular functions
Footnotes
Acknowledgements
The author thanks Dr David Attwell for his critical review of the manuscript and valuable suggestions. The content is solely the responsibility of the author and does not necessarily represent the official views of the National Institute Of Diabetes And Digestive And Kidney Diseases, National Institute of Neurological Diseases and Stroke, or the National Institutes of Health.
Disclosure/conflict of interest
The author declares no conflict of interest.