
Abstract
Glucose transport into nonneuronal brain cells uses differently glycosylated forms of the glucose transport protein, GLUT1. Microvascular GLUT1 is readily seen on immunocytochemistry, although its parenchymal localization has been difficult. Following ischemia, GLUT1 mRNA increases, but whether GLUT1 protein also changes is uncertain. Therefore, we examined the immunocytochemical distribution of GLUT1 in normal rat brain and after transient global forebrain ischemia. A novel immunocytochemical finding was peptide-inhibitable GLUT1 immunoreactive staining in parenchyma as well as in cerebral microvessels. In nonischemic rats, parenchymal GLUT1 staining co-localizes with glial fibrillary acidic protein (GFAP) in perivascular foot processes of astrocytes. By 24 h after ischemia, both microvascular and nonmicrovascular GLUT1 immunoreactivity increased widely, persisting at 4 days postischemia. Vascularity within sections of brain similarly increased after ischemia. Increased parenchymal GLUT1 expression was paralleled by staining for GFAP, suggesting that nonvascular GLUT1 overexpression may occur in reactive astrocytes. A final observation was a rapid expression of inducible heat shock protein (HSP)70 in hippocampus and cortex by 24 h after ischemia. We conclude that GLUT1 is normally immunocytochemically detectable in cerebral microvessels and parenchyma and that parenchymal expression occurs in some astroglia. After global cerebral ischemia, GLUT1 overexpression occurs rapidly and widely in microvessels and parenchyma; its overexpression may be related to an immediate early-gene form of response to cellular stress.
Keywords
The brain depends upon a continuous delivery of glucose from the bloodstream to fuel the energy requirements associated with synaptic activity, bio-synthetic functions, and other fuel needs. Because the brain has only modest glycogen stores and cannot synthesize glucose, it must import this fuel. Glucose transport into brain, as into other tissues, is accomplished by members of a family of proteins named GLUT1-7, in order of their discovery (Gould and Holman, 1993). GLUT1 is the primary brain endothelial glucose transport protein (Boado and Pardridge, 1990). This protein has also been found in cultured brain cells [in which its presence might represent an artifact of culture conditions (Hiraki et al., 1988) that induce GLUT1 expression]. GLUT1 mRNA has been reported to be localized by in situ hybridization in some nonvascular parenchymal brain cells, including astrocytes (Bondy et al., 1992). Although this protein is readily visualized in the cerebral microvasculature and the choroid plexus, where it is highly concentrated, immunocytochemical studies have failed to disclose its presence in parenchymal cells of the brain (Harik et al., 1990; Farrell and Pardridge, 1991).
During cerebral ischemia, the brain's fuel supply becomes interrupted. In experimental stroke, glucose availability to the brain may modify the extent of brain damage from ischemia (Lundgren et al., 1990b). It is arguable that altered glucose transport protein concentrations may be the biological equivalent of altered glycemia (Simpson et al., 1994). In this regard, a disorder with brain GLUT1 deficiency, which leads to seizures and developmental delay, has been described (De Vivo et al., 1991). Only a few studies, however, have examined glucose transport (Betz et al., 1974; Betz et al., 1983) or glucose transporters (Gerhart et al., 1991) after brain ischemia. Lee and Bondy (1993) reported a marked increase in GLUT1 mRNA and a modest increase in GLUT3 mRNA after focal cerebral ischemia. Similar findings were reported in an animal (gerbil) model for global ischemia (Gerhart et al., 1994). Despite these observations on GLUT mRNA, no evidence of altered GLUT1 expression has been found (in the gerbil model of global forebrain ischemia or other ischemic models) to explain the previously observed downregulation of glucose transport at the blood–brain barrier (BBB) (Gerhart et al., 1991). In the present study, we determined whether parenchymal GLUT1 may be immunocytochemically visualized in normal conditions and whether experimental global cerebral ischemia affects the expression of GLUT1, the major nonneuronal glucose transporter in brain.
METHODS AND MATERIALS
Animals
Male Sprague-Dawley rats (250–350 g), (Harlan Sprague-Dawley, Indianapolis, IN, U.S.A.) were exposed to light between 0600 and 1800 h and were provided ad libitum access to food (Purina Rodent Laboratory Chow 5001) and water. Animals were housed in our animal care facility for at least 1 week prior to experiments. All experiments received prior approval by the Animal Care Committee of the Oregon Health Sciences University or the Portland Veterans Administration Animal Care committee and were in keeping with American Association for Accreditation of Laboratory Animals guidelines.
Ischemia model
The model of global ischemia was the two-vessel occlusion-hypotensive model of global forebrain ischemia that has been extensively characterized by Siesjö and coworkers (Lundgren et al., 1990b; Lundgren et al., 1990a; Kozuka et al., 1989; Inamura et al., 1988) and that we have described elsewhere (McCall et al., 1995). Animals were divided into groups (including sham-operated controls) according to the duration of time after ischemia (24 h or 4 days). All animals were fasted the night before surgery. Forebrain ischemia was produced by clamping the common carotid arteries bilaterally, after abruptly lowering the mean arterial pressure to 25 torr by rapid withdrawal of 4–10 ml of blood. Arterial pressure was kept at 25 torr for the duration of the ischemic period by addition or removal of small amounts of blood. After 15 min, the carotid arteries were undamped and the blood reinfused. Rats received tracheal intubation for administration of halothane, nitrous oxide, and oxygen anesthesia with a tidal volume of 2–2.5 ml at a rate of 80 ± 2 respirations per min. Animals were routinely monitored by electrocardiography (ECG), electroencephalography (EEG), blood pressure by indwelling arterial catheter and arterial blood gas concentrations, the latter of which were kept in the normal range of pH (7.30–7.40) and Pco2 (30–40 torr) by adjustments of the mechanically controlled rodent ventilator (Harvard Apparatus, South Natick, MA, U.S.A.). Temperature was monitored through a rectal probe and maintained at 36.5–37.5°C with a heating pad. For sham-operated controls, the animals were treated identically save that the carotid arteries were not clamped, and no blood was withdrawn from the jugular catheter. After ischemia, animals were observed for anesthesia recovery, behavioral manifestations of neurologic injury, and health. Ischemic lesions were subjected to routine histology using acid fuchsin, thionin stains, and estimations of injury using OX-42.
Perfusion and immunocytochemistry
We used a special secondary immunization procedure (Van Bueren et al., 1993) to generate a high titer antiserum against the 14 carboxyl terminal amino acids (PEELFHDLGADSQV) of GLUT1. The native peptide was conjugated to keyhole limpet hemocyanin (KLH) by an amino terminal cysteine. This antiserum was used for immunolocalization of GLUT1 in parenchyma and microvessels. Animals were anesthetized and perfused for immunocytochemistry, which was performed as previously described (Van Bueren et al., 1993; Ju et al., 1989; McCall et al., 1995). Sections were incubated and washed in phosphate-buffered saline (PBS) and incubated overnight in blocking solution containing 2% normal goat serum (NGS), Triton X-100 (0.3%) in 0.02 M potassium phosphate-buffered saline (KPBS), followed by overnight incubation at 4°C with the primary antibodies, e.g., the polyclonal rabbit anti-GLUT1 antibody, ALM1-K, 1:5,000 (Van Bueren et al., 1993) diluted in 0.02 M KPBS with 2% NGS. This was followed by incubation with a biotinylated goat anti-rabbit IgG using the ABC kit (Vector Labs). The peroxidase reaction was carried out with diaminobenzidine (DAB) (0.3 mg/ml) in the presence of hydrogen peroxide (0.03%). Specificity of immunocytochemistry was assessed regularly by peptide competition (10 μg/ml of GLUT1 immunogen; see Figs. 1D and 3D–F and preimmune serum controls. Glial fibrillary acidic protein (GFAP) immunoreactivity was assessed using a mouse monoclonal antibody SMI-26 (Sternberger Monoclonals Inc.). It was visualized with a biotinylated goat anti-mouse IgG (Organon Teknika, Darham, NC, U.S.A.) or a goat anti-mouse IgG conjugated to Texas red (Vector Laboratories, Inc., Burlingame, CA, U.S.A.). Inducible heat shock protein (HSP 70) was visualized with the peroxidase reaction as previously described using commercially available antibodies (Kinouchi et al., 1993).
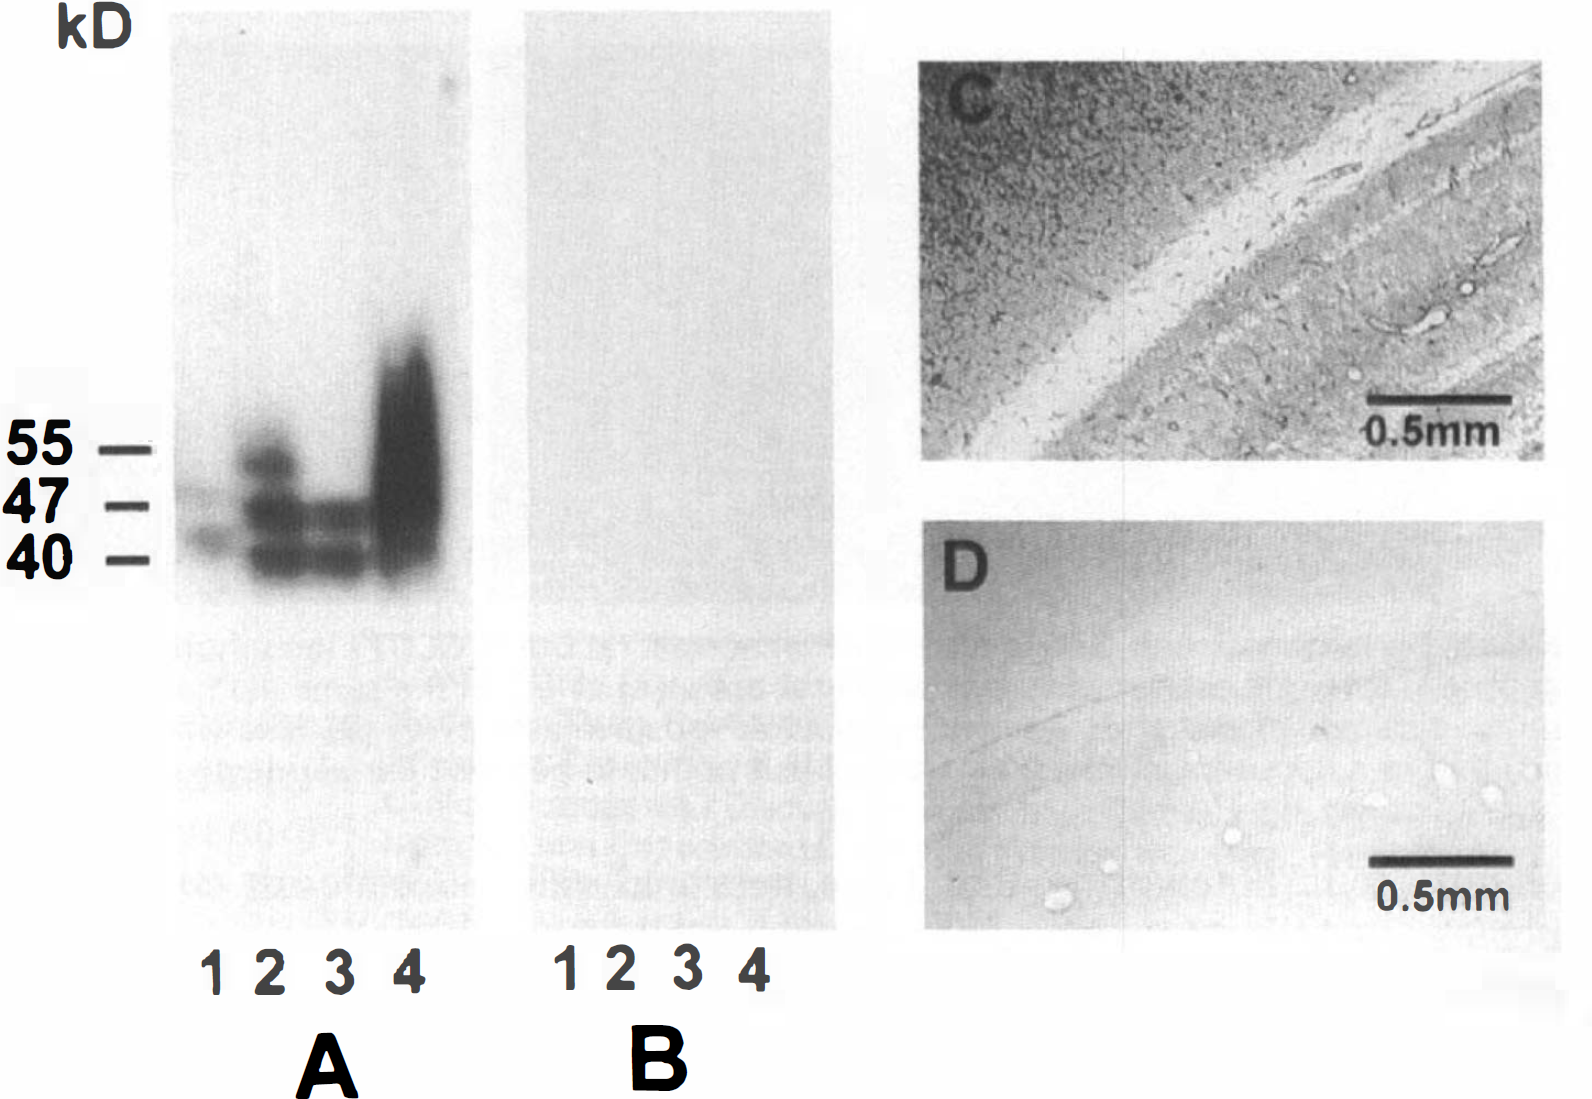
Specificity of GLUT1 immunoreactivity shown by Western blot analysis of rat brain membranes and immunoreactive staining with anti GLUT1 serum (ALM1-K). GLUT1 immunoreactivity
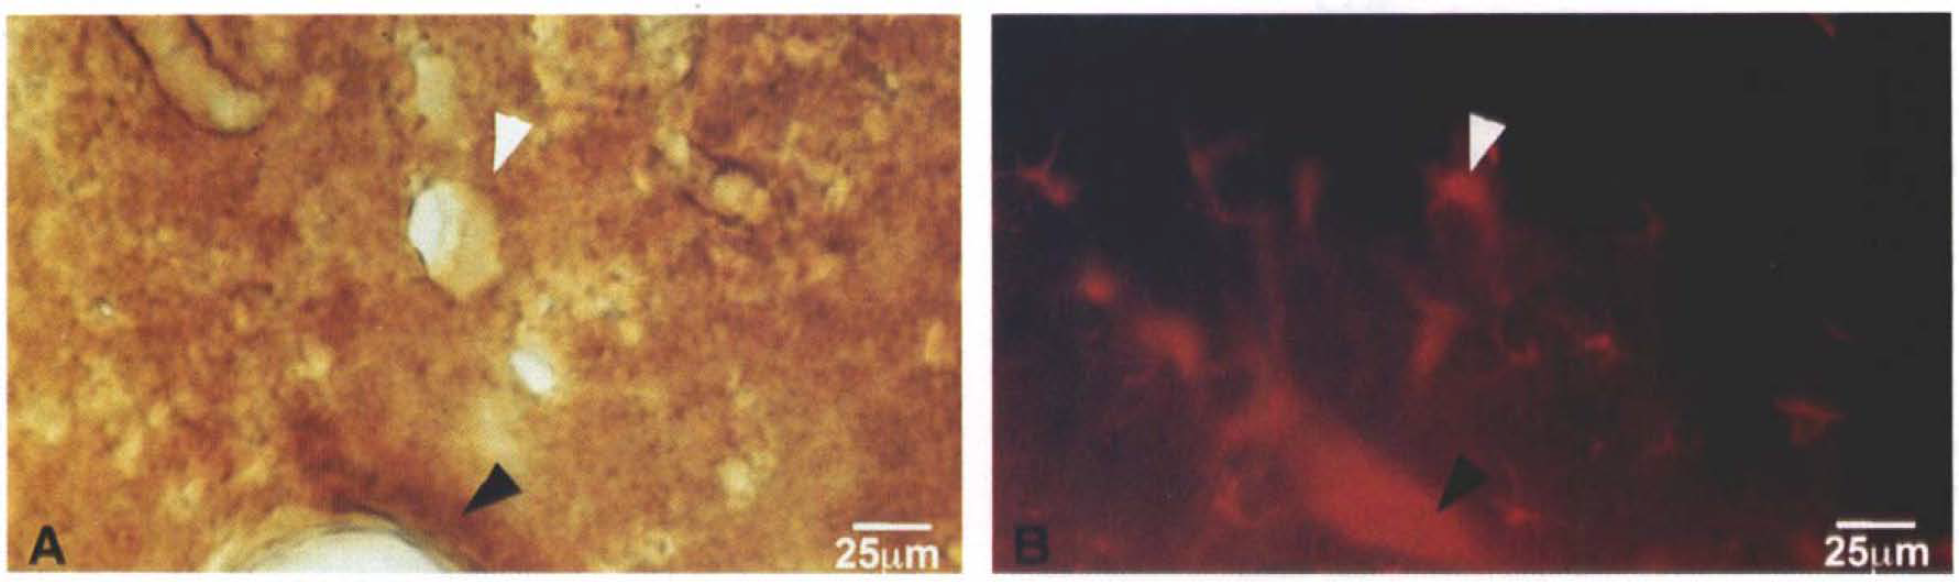
Co-localization of GLUT1 and GFAP in normal rat brain. GLUT1 immunoreactivity with ALM1-K (1:5,000) by light microscopy is shown in a section of normal adult rat brain
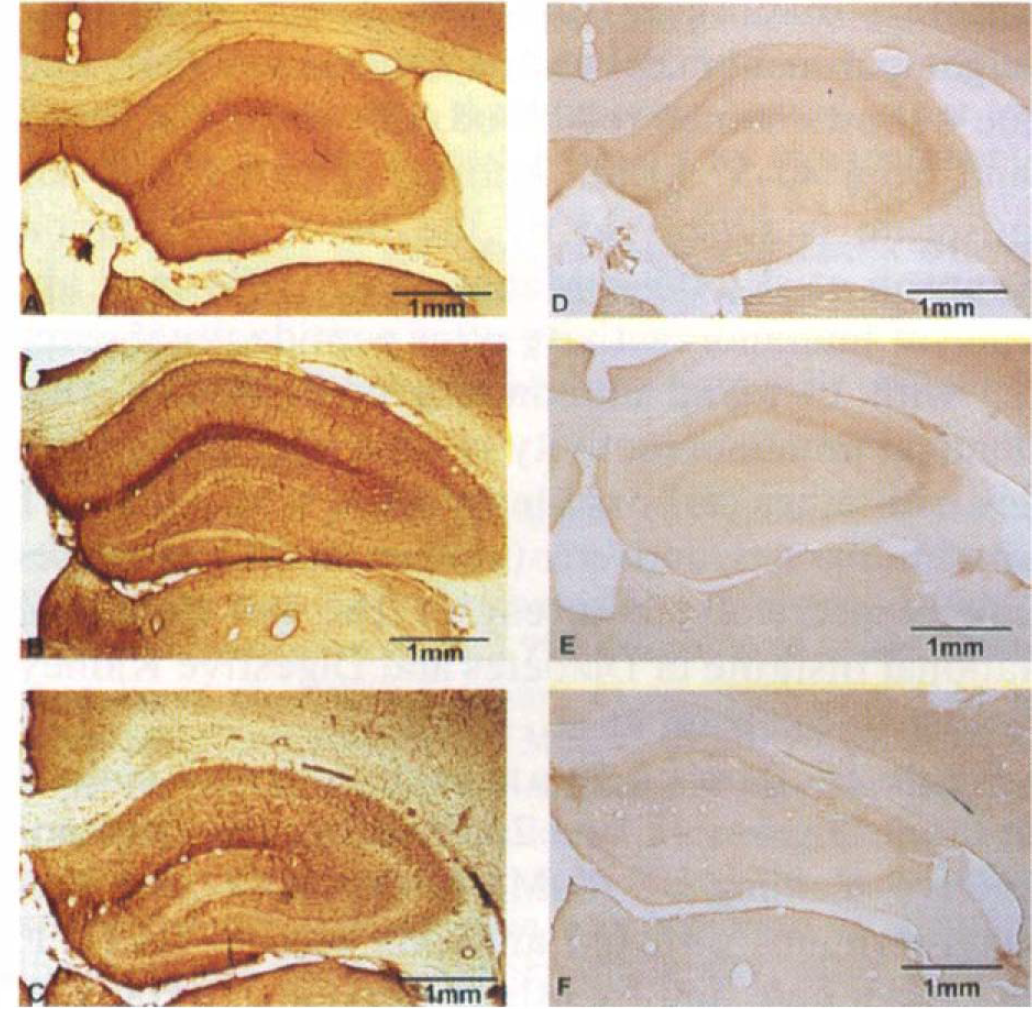
Ischemia increases GLUT1 staining by immunocytochemistry. Sections taken at the level of the anterior hippocampus were immunocytochemically stained for GLUT1 (ALM1-K: 1:5,000) without
To provide estimates of increases in optical density for nonvascular GLUT1 in brain sections, we measured densitometry for GLUT1 immunoreaction density in five readings per field each in sham-operated control rats (n = 2) and groups of postischemic rats at 24 h (n = 4) and 4 days (n = 2) in four hippocampal areas: molecular layer of the dentate gyrus, stratum oriens and stratum radiatum in the CA1 regions of the hippocampal formation, and hilus (also known at the CA4 region) of the dentate. These density measures were summed (numbers of observations; n = 2 for control, n = 4 for 24 h, and n = 2 for 4 days postischemic) to give an index of overall GLUT1 staining. These density measurements represent only nonvascular GLUT1 immunoreactive staining. Using a freehand cursor tracing, all microvascular GLUT1 staining was excluded prior to making densitometric calculations.
In order to assess the GLUT1 overexpression in relation to vascularity, we counted the number of microvessel segments in sections through the anterior hippocampus in four high powered fields of cortex (two on left, two on right) and hippocampus from each animal.
Western blot analysis
Rat forebrains were dissected and the pia mater removed. Brains were homogenized with a Dounce homogenizer and the microvessels isolated on 1.5 and 1.0 M sucrose density gradients as previously described (Sussman et al., 1988). The remaining homogenate represented a microvessel-depleted filtrate. Choroid plexus was dissected from 10 rat forebrains using coronal sections through the anterior hippocampus. Samples were lysed and separated on a 10% SDS-PAGE gel and immunoblotted as previously described (Van Bueren et al., 1993). For primary antibody, ALM1-K at 1:5,000 dilution was used. Molecular weights were estimated on immunoblots using Amersham rainbow standards.
Data presentation and statistical analyses
Data are expressed as means ± SD except for measures of hippocampal GLUT1 density, which are expressed as a scatter plot (Fig. 4) of summed optical densities from four hippocampal areas. Comparisons of the optical density of GLUT1 immunoreactive staining and vascularity between groups were assessed by Spearman rank order nonparametric correlation analysis and one way analysis of variance (ANOVA) respectively. Post hoc multiple comparisons were performed using a Newman-Keuls test.
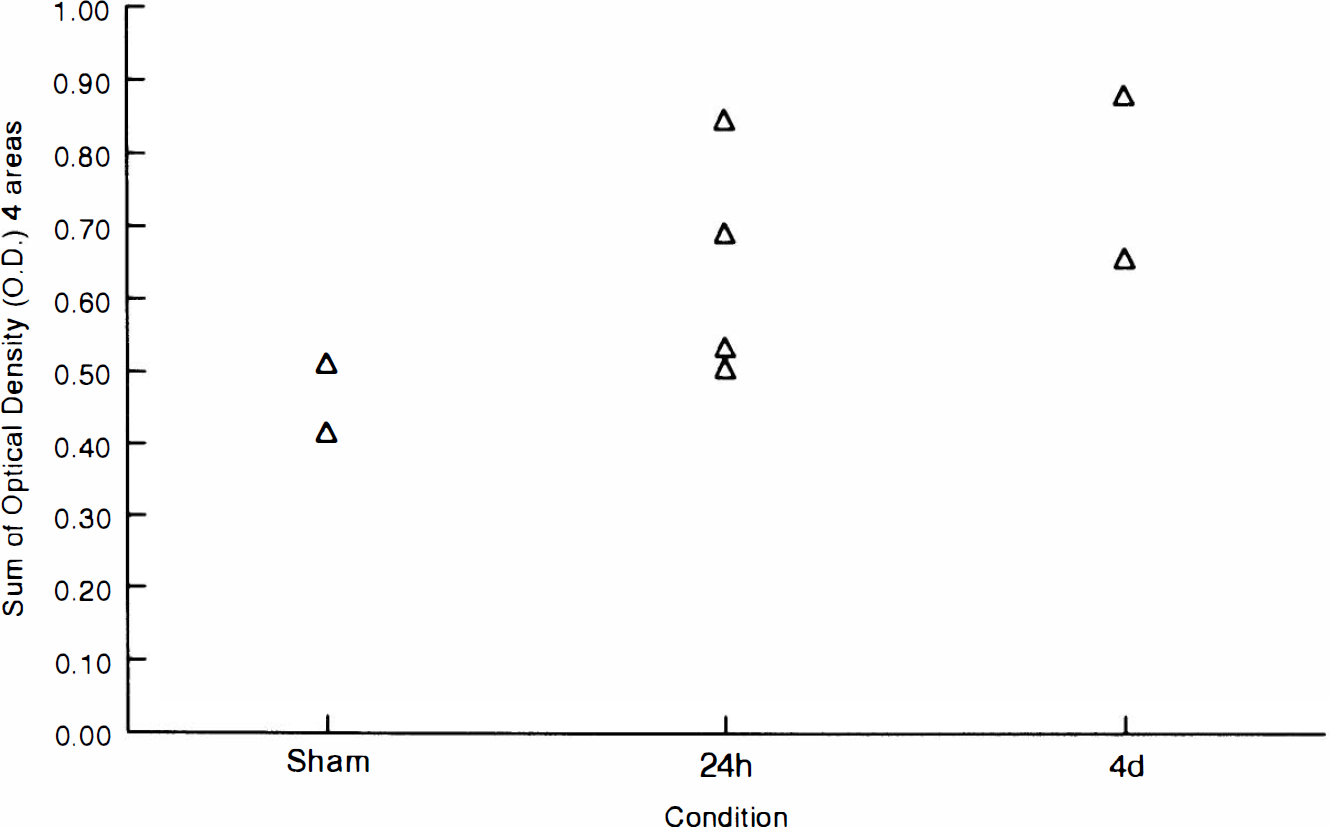
Densitometric quantitation of GLUT1 immunocytochemistry. Sections from four hippocampal regions were assessed for density of GLUT1 immunoreactive staining in sham-operated controls and rats at 24 h and 4 days after global forebrain ischemia. Sums of density measures for these four areas are shown for individual animals.
RESULTS
Figure 1A shows a Western blot analysis of GLUT1 using the carboxyl-terminal directed antiserum, ALM1-K (1:5,000) in different membrane fractions from normal rat brain. Lane 1 shows membranes from choroid plexus (10 μg protein by Lowry assay) with two bands of ∼45 and 48 kDa; lane 2 shows rat forebrain homogenate membranes (20 μg protein) with a micro vessel GLUT1 band at ∼55 kDa and parenchymal bands at 47 and 40 kDa; lane 3 shows microvessel-depleted (Sussman et al., 1988) rat forebrain homogenate membranes (20 μg protein), displaying only the lower molecular weight parenchymal bands (Vannucci, 1994); and lane 4 shows human red blood cells (0.5 μg; a broad band from 40–57 kDa). Antigen specificity of our antiserum is suggested by the tissue distribution (Simpson et al., 1994; Maher et al., 1994) and absence of immunoreactivity after peptide preabsorption with 10 μg/ml immunizing peptide (Fig. 1B). Identical immunoreactivity is seen with these samples with other carboxyl-terminal or whole GLUT1 protein-directed antisera (antiserum 379 or H-se-rum, respectively, courtesy of Dr. Ian Simpson, National Institute of Diabetes and Digestive Kidney Diseases) (Simpson et al., 1994).
Figure 1C shows a 50 (xm section from a control rat brain. Figures 1C and 2A illustrate the immunoreactive staining of ALM1-K (1:5,000), our carboxyl-terminus directed antibody against GLUT1. As shown here and by others previously (Harik et al., 1990), immunoreactivity is visible within the cerebral vasculature. Both small and larger blood vessels, which appear as tubular structures that are on a bias within these relatively thick (50 μm) sections, are seen. Also visible in this section, but not previously demonstrated is diffuse staining of the parenchyma. It is noteworthy that large neuronal cell bodies, visible, e.g., within the pyramidal cell layer of the hippocampus or in its granule cell layer, appear devoid of staining (Fig. 3A). GLUT3, the neuron-specific transporter, exhibits a similar pattern but there appears to be no cross reaction between GLUT1 and GLUT3 as assessed by peptide competition and tissue distribution (McCall et al., 1994). Evidence for the specificity of staining of the antiserum is illustrated by peptide competition with 10 μg/ml of GLUT1 peptide (Fig. 1D).
Figure 2 shows immunoreactive co-localization of GLUT1 with GFAP in a section from a nonischemic rat cortex. The left panel shows GLUT1 localization with ALM1-K (1:5,000) visualized by light microscopy with biotinylated goat anti-rabbit IgG and DAB. The right panel shows the same section visualized under darkfield illumination with a Texas-red conjugated goat anti-mouse antibody. GFAP immunoreactivity is prominently visible in several cells in this section. Several perivascular GFAP reactive cells, i.e., astrocytic foot processes, have clear co-localization of GLUT1 and GFAP, as noted by arrowheads.
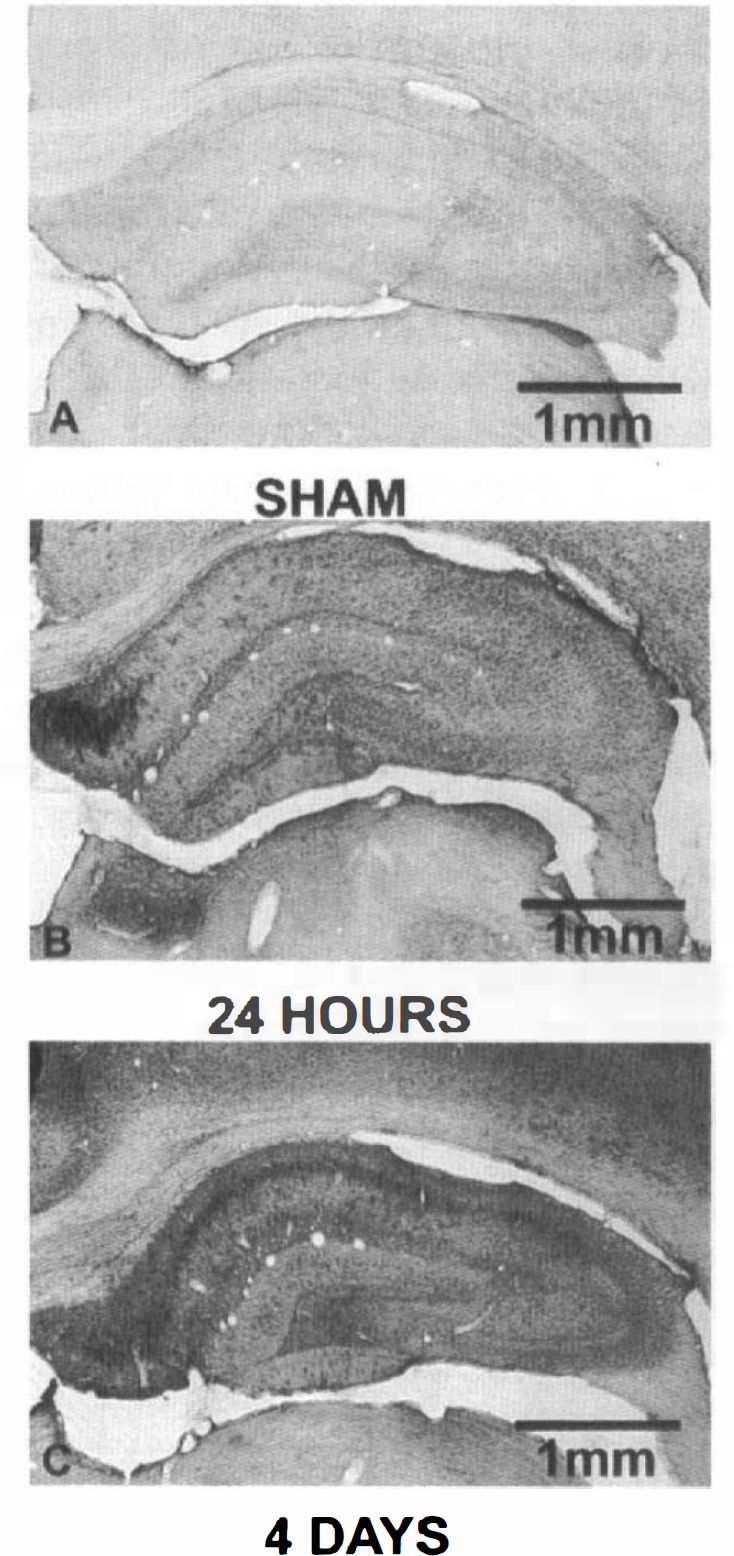
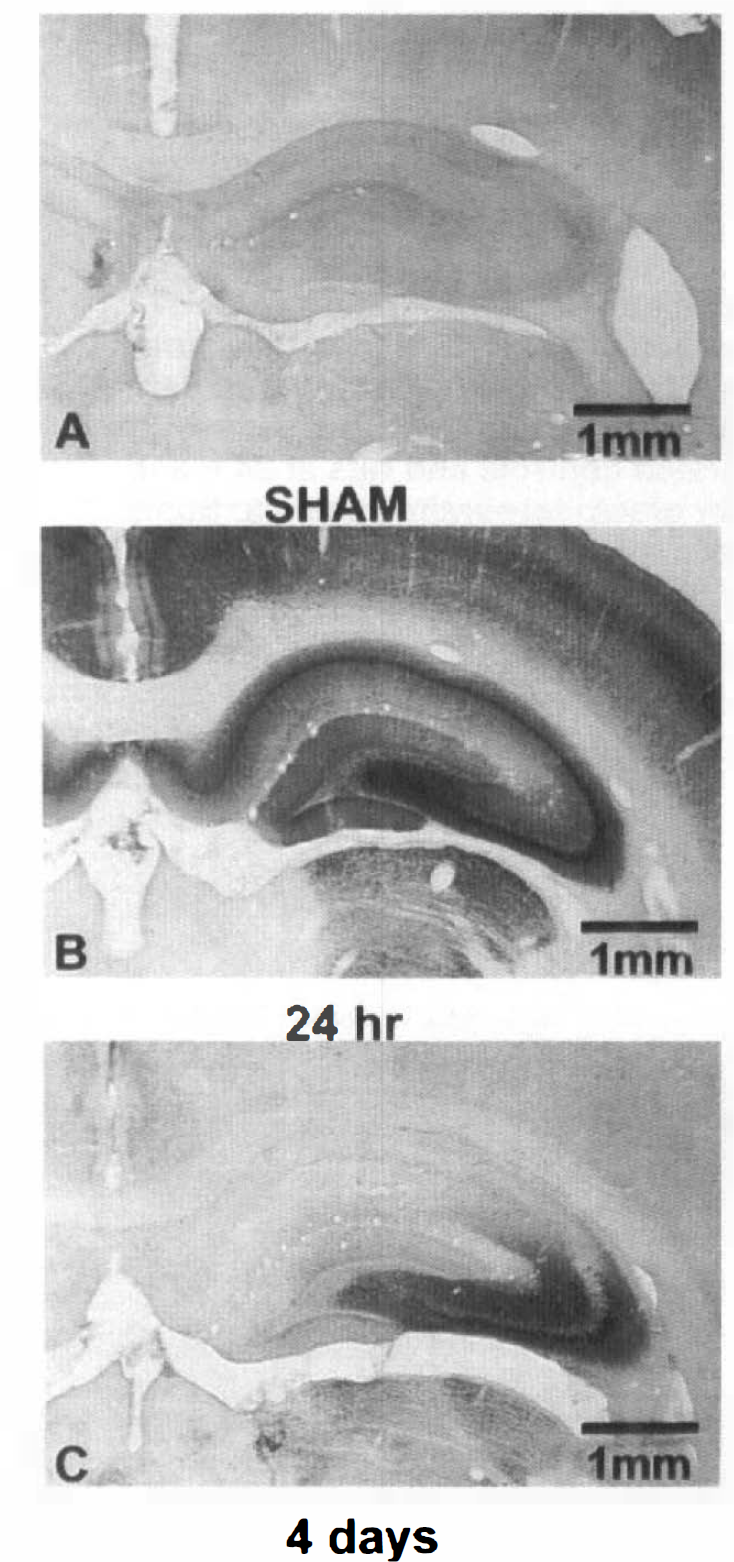
Figure 3 illustrates the GLUT1 staining in sham, 24 h post-ischemic, and 4-day post ischemic rats with sections taken at the level of the anterior hippocampus. The left panels show uncompeted GLUT1 immunoreactivity (ALM1-K; 1:5,000) from sham-operated control rats (A) and animals either 1 (B) or 4 days (C) after exposure to global forebrain ischemia. The right panels show the respective peptide competition controls (10 μg/ml preincubation with ALM1-K for 2 h). As shown here, a diffuse increase in the expression of GLUT1 occurs in both parenchymal cells and in the microvasculature of the brain at 24 h and 4 days after ischemia. There is no significant nonspecific immunoreactive staining in either sham-operated or ischemic animals.
In Fig. 4, the summed densitometric measurements are shown for four hippocampal areas. Data are shown as a scatter plot of the sums of the densities in four hippocampal areas for each animal. As assessed by the Spearman rank order correlation test, the groups show a progressive rise in nonvascular GLUT1 immunoreactivity after ischemia (p < 0.05).
Figure 5 shows a higher power magnification of sections of cerebral cortex from sham-operated (A), 24-h postischemic (B), and 4-day postischemic (C) rats to exemplify the altered vascularity seen after global ischemia. As is shown in this figure, the increase in GLUT1 staining seen in the microvasculature occurs within a context of increased vascularity, i.e., within sections, there are more microvessels with longer, more contiguous segments within the plane of the section, and the brain capillaries exhibit a more tortuous appearance.
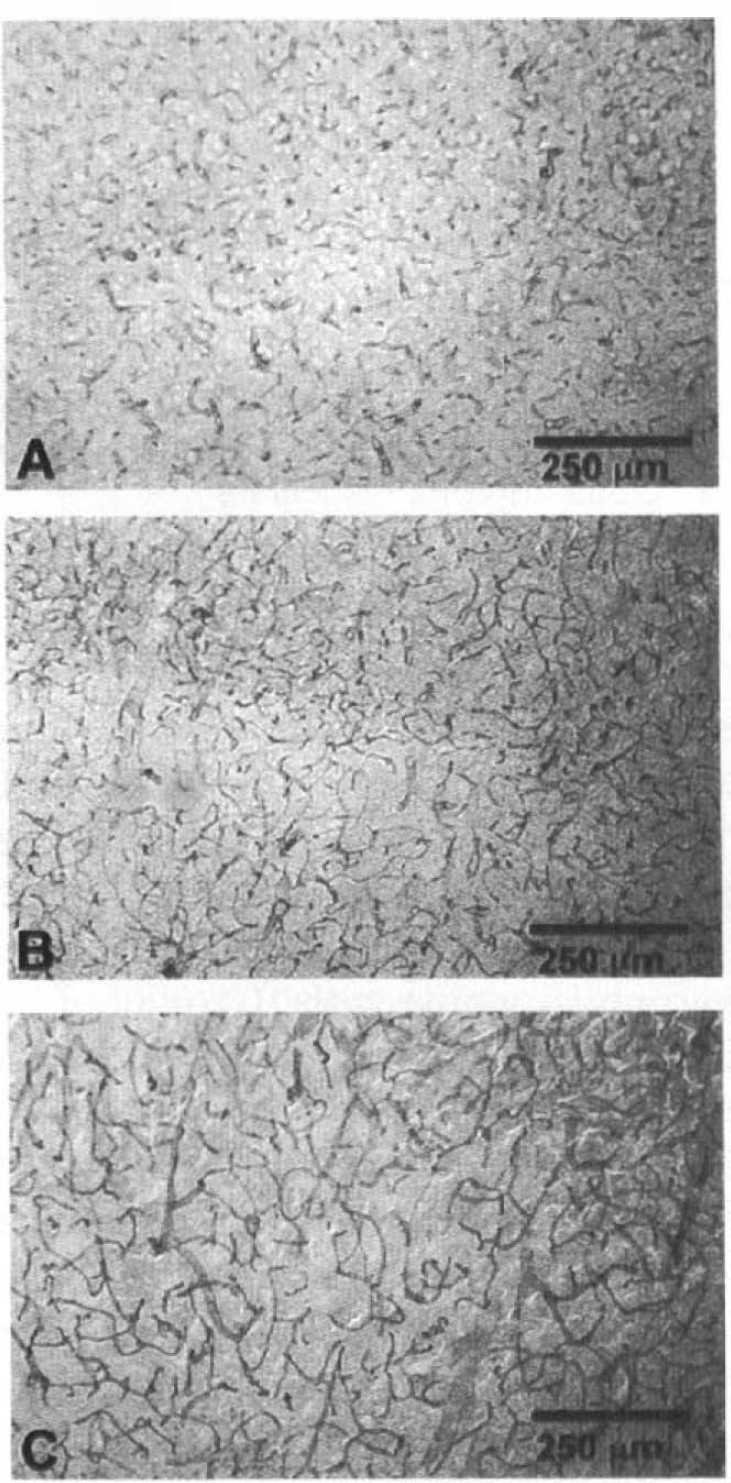
Cortical GLUT1 immunocytochemistry in control and ischemic brain. Sections of cingulate cortex are shown to illustrate changes in GLUT1 vascular and nonvascular immunoreactive staining for GLUT1 (ALM1-K: 1:5,000) in areas outside of the hippocampus.
To document altered vascularity after ischemia, Fig. 6 shows the counts of microvessel segments per mm2 for sham-operated, 24 h and 4-day post-ischemic rats. At 24 h after ischemia, cortex microvessel segments increased by 50% and hippocampal microvessel segments by 80%. At 4 days after global ischemia, the increase was 29% greater than controls in the cortex and 64% greater than controls in the hippocampus.
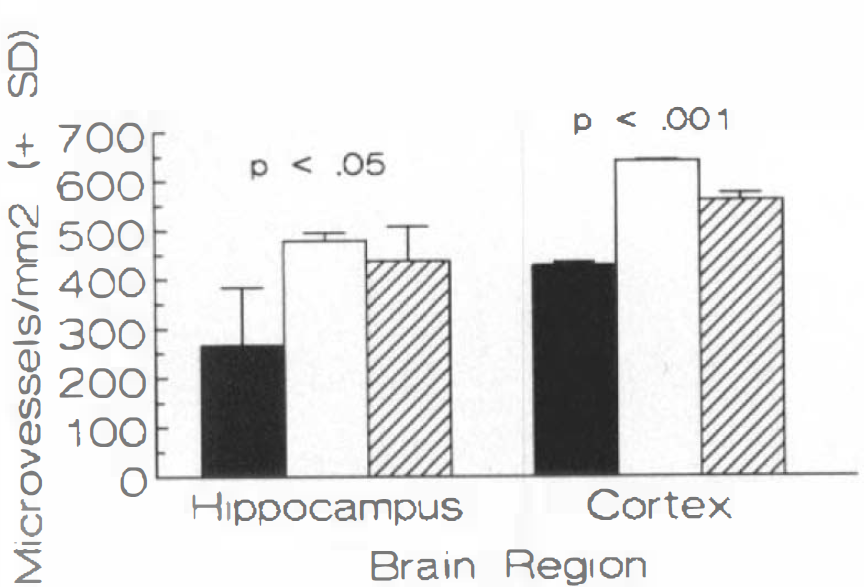
Quantitation of vascularity after ischemia. Segments of microvessels per mm2 were counted in sections from hippocampus and cortex in sham-operated controls (▪), and 24 h (□) and 4-day (▨) postischemic rats.
The increased parenchymal GLUT1 immunoreactive staining within the cortical areas exposed to ischemia is widespread but not uniform. In some animals, GLUT1 immunoreactive staining—as assessed by visual inspection—was increased from frontal cortex to portions of the cerebellum; in others, staining was less widespread, although it was consistently visible outside of the hippocampal CA1 region and adjacent cortex known to be vulnerable in this form of ischemic insult (McCall et al., 1995). GLUT1 parenchymal staining corresponds closely with increased GFAP staining (Fig. 7) indicative of reactive astrocytosis after ischemia. By contrast, GLUT1 immunoreactivity does not correlate well with other markers of ischemic damage, e.g., thionin staining for neuronal dropout or microglial activation markers such as OX-42 (McCall et al., 1995).
Ischemia increases GFAP staining by immunocytochemistry in hippocampus.
A final observation potentially relevant to GLUT1 expression is shown in Fig. 8. We found that inducible HSP70 immunoreactive staining was increased rapidly (by 24 h postischemia) within the areas in which GLUT1 immunoreactive staining increased. The correspondence of HSP70 and GLUT1 immunoreactive staining was largely lost, however, by 4 days after ischemia.
Rapid transient induction of HSP70 after ischemia. Inducible heat shock protein (HSP70) was assessed by immunocytochemistry in sham-operated
DISCUSSION
These data show that a high titer antibody for GLUT1 can permit specific immunocytochemical visualization of the less concentrated parenchymal form of that protein in nonischemic brain tissue. Evidence for specificity of this staining includes Western blot analysis, which showed appropriately-sized, peptide-inhibitable bands that are distributed in a tissue-specific manner. Use of other GLUT1 antisera in Western blot analysis of these same tissues gave similar patterns. Immunocytochemical staining for GLUT1 was also peptide-inhibitable, and background staining with 10 μg/ml of immunizing peptide preincubated with immune antisera was very low (Figs. 1 and 3).
Another major finding shown here is that global forebrain ischemia produced a considerable increase in expression of both parenchymal and microvascular GLUT1 protein. Lee and Bondy reported that focal brain ischemia markedly induces GLUT1 gene expression (as well as modest increases in GLUT3 mRNA), using in situ hybridization (Lee and Bondy, 1993). Similarly, Gerhart et al. (1994) recently reported increases in GLUT1 and GLUT3 mRNAs after global ischemia in a gerbil model. There has been little evidence, however, that GLUT1 protein also responds to ischemia in the adult brain (Gerhart et al., 1991). Preliminary data have suggested that increased GLUT1 protein expression may occur with neonatal hypoxia/ischemia (S. Vannucci, unpublished observations). The explanation for the different findings after ischemia is not known. The combination of increased GLUT1 mRNA from these two reports combined with our observation of increased GLUT1 protein expression suggests a possible transcriptional regulation.
While the mechanism for increased GLUT1 expression is unknown, such increased expression could represent an immediate early gene form of transcriptional cellular response to stress and hypoxia (Collaco-Moraes et al., 1994). GLUT1 expression is induced in culture by cellular metabolic stress (Wertheimer et al., 1991). Induction of GLUT1 also occurs in cell culture in response to serum (Hiraki et al., 1988) and proto-oncogenes (Flier et al., 1987), and the GLUT1 gene has been found to have a serum response element in the 5′-untranslated region (Murakami et al., 1992). The early parallel induction of HSP70 immunoreactive staining that we have observed could be relevant, since its induction accompanies the cellular activation that characterizes the immediate early gene response (Nowak TS, 1990).
Induction of GLUT1 and GLUT3 mRNAs occurs after brain ischemia (Lee and Bondy, 1993; Gerhart et al., 1994). We have not, however, found any increase in immunoreactive GLUT3 protein—the neuronal glucose transporter—in our model of global ischemia (McCall et al., 1995), pointing to a specificity of the transporter response.
Precise cellular localization and subcellular sites of GLUT1 protein overexpression are not yet characterized. Co-localization of GLUT1 protein and GFAP in nonischemic animals confirm and extend prior observations about GLUT1 mRNA localization (Bondy et al., 1992). A comprehensive analysis will be required to determine whether ectopic (e.g., neuronal) expression of GLUT1 protein occurs after ischemia as is suggested by in situ hybridization data (Lee and Bondy, 1993). The marked increase in GFAP staining after global ischemia observed in the current study and the correspondence of increased GFAP staining with GLUT1 protein overexpression points to reactive astrocytes as one important source of the overexpression.
The idea has been advanced that altered GLUT expression in the brain may be functionally equivalent to altered glycemia with loss of transporter equal to glucoprivation (Maher et al., 1994; Simpson et al., 1994). A corollary implication is that the concentrations of glucose transporters within the brain may affect cellular metabolism of brain regions. If these ideas are correct, then our current observations support the suggestion that GLUT1 overexpression, by equaling hyperglycemia, influences brain metabolism after ischemia. Certainly, the combination of increased expression of GLUT1 and the associated increased vascularity, found in this study, suggests a potential compensatory response to fuel deprivation. Increased vascularity and glucose transporter induction have recently been reported in response to long-term (weeks) hypobaric hypoxia (Harik et al., 1994). We are not aware, however, of occurrence of these responses in other situations within such a short (24 h) period. The consequences of these responses for recovery from ischemia need to be determined.
Footnotes
Acknowledgment:
We thank Dr. Dianne F. Lattemann for editorial suggestions, Dr. Susan J. Vannucci for help with the choroid plexus dissection, Mr. Don Begley for technical assistance in antibody generation and evaluation, and Mr. Michael Moody for digital photography. This work was supported by U.S. Public Health Service grants NS22213 and NS17493, and the Department of Veterans Affairs.