
Abstract
Carbon metabolism in the rat brain was studied in animals anesthetized with a light dose of pentobarbital and in awake animals under morphine, which were infused with either [1-13C]glucose+acetate or glucose+[2-13C]acetate for various periods of time. Brain amino-acid enrichments in tissue extracts were determined by nuclear magnetic resonance (NMR) spectroscopy and their time evolution was analyzed by automatic fitting. Acetyl-coenzyme A C2 enrichment and ratio between pyruvate carboxylase and pyruvate dehydrogenase activity (PC/PDH) were determined from glutamate and glutamine labeling. The following results were obtained: (i) amino-acid enrichment patterns implied metabolic compartmentation and occurrence of the glutamate—glutamine cycle; (ii) kinetics of aspartate, GABA, and glutamate labeling from [1-13C]glucose and of glutamine labeling from [2-13C]acetate indicated a twofold higher metabolic activity in awake than in anesthetized rat brain; (iii) evaluation of the contributions of the astrocytic and neuronal metabolisms to glutamine synthesis in both groups of rats indicated a coupling between neuronal tricarboxylic acid (TCA) cycle, glutamate—glutamine cycle and glial TCA cycle; and (iv) analyzing the extrapolations back to time zero and the steady-state values of PC/PDH indicated a close coupling between PC activity and both astrocytic and neuronal TCA cycles. All these results suggest a cooperative-like behavior of astrocytic and neuronal metabolisms to fulfill the anabolic and energy needs linked to brain activation.
Introduction
To be efficient, cerebral activity requires adequate energy supply to each of the cellular mechanisms involved (Attwell and Laughlin, 2001). Evaluation of the energy budget for excitatory brain signaling indicates that most of the energy consumed is devoted to reversing ion fluxes linked to action potentials and postsynaptic responses (80%) and to maintaining neuronal resting potentials (10%), whereas the remainder is used by other less greedy components including glutamate recycling (3%) (Attwell and Iadecola, 2002). In addition to the energy required for signaling, there is a minor but significant non-signaling component in brain energy metabolism (observed under deep pentobarbital anesthesia leading to isoelectric encephalogram as compared with mild anesthesia in the rat brain; Choi et al, 2002). Close coupling between neuronal oxidative glucose consumption and glutamate recycling has been shown to occur over a large range of synaptic activity above isoelectricity, both in the depressed rat brain (Sibson et al, 1998) and during intense neuronal activation (Patel et al, 2004). In contrast, an increase in astrocytic metabolism has been reported in the brain of awake as compared with deeply anesthetized rats (Öz et al, 2004; Choi et al, 2002) and in the ipsilateral brain of conscious rats during acoustic stimulation (Cruz et al, 2005). The increase in the anaplerotic pathway via pyruvate carboxylase (PC) was several fold higher in awake than in anesthetized rats, whereas the activity on the astrocytic oxidative pathway (tricarboxylic acid (TCA) cycle) remained in the same range (Öz et al, 2004; Choi et al, 2002), suggesting either coupling or uncoupling of these pathways with cerebral activity.
Astrocytes are particularly involved in neurotransmitter glutamate recycling (through the glutamate—glutamine cycle) owing to the specific localization of glutamine synthetase in these cells (Martinez-Hernandez et al, 1977). It has been proposed that the ATP required for glutamate amidation is provided by astrocytic aerobic glycolysis whose stimulation is triggered by glutamate uptake (Pellerin and Magistretti, 1994). On the basis of this result, a mechanism of coupling between neuronal activation and glucose utilization was proposed (Magistretti et al, 1999), in which lactate, the end product of astrocytic glycolysis, plays a pivotal role as neuronal oxidative substrate (Pellerin, 2003). This mechanism is supported by the higher glucose uptake and phosphorylation in astrocytes (∼50%) (Nehlig et al, 2004) than its oxidative metabolism in these cells (∼14%, at least 20%) (Ebert et al, 2003; Lebon et al, 2002). Although the relevance of this mechanism in the adult rat brain was recently validated (Serres et al, 2005), it does not exclude the possibility that part of the energy demand of the activated brain results from astrocytic oxidative metabolism (Garcia-Espinosa et al, 2003).
To obtain further insights into the coupling between brain activity and metabolism, we analyzed the activity of different metabolic pathways in the brain in both awake rats under analgesia and lightly anesthetized rats. After infusing the animals with either glucose+[2-13C]acetate or [1-13C]glucose+acetate, we used nuclear magnetic resonance (NMR) spectroscopy ex vivo to analyze amino-acid labeling from either the astrocytic or (mainly) the neuronal metabolism. The results evidenced increased carbon fluxes on metabolic pathways with cerebral activity both in neurons and in astrocytes, suggesting that metabolic activity in both cell types was coupled with cerebral activity.
Materials and methods
Animals
Experimental protocols were approved by the appropriate institutional review committees and met the guidelines of the appropriate governmental agency (authorization number 7368). Female Wistar rats (200±10 g weight) were used after overnight fasting.
Labeled Substrate Infusion
Animals were either anesthetized by one intraperitoneal injection of sodium pentobarbital (60 mg/kg) or kept awake under analgesia by a light intraperitoneal dose of morphine sulfate (15 mg/kg). Rats under pentobarbital were kept under a glow lamp to avoid hypothermia. Awake rats under morphine were immobilized in a restrainer (Serres et al, 2004).
Approximately 15 mins after drug administration, rats were infused in the tail vein with a saline (0.9% NaCl) solution containing 0.6 mol/L glucose and 0.5 mol/L sodium acetate at a flow rate of 6 mL/h for 10 mins. They were simultaneously infused with a solution containing 0.6 mol/L glucose and 1.1 mol/L sodium acetate at a flow rate of 2 mL/h for 20, 40, 60, or 80 mins. The dose of acetate, which corresponded to an infusion of 21.5 μmol/min per 100 g (with 25 μmol/min per 100 g of Na+) for 80 mins, was similar to that used previously in other studies: 21.5 μmol/min per 100 g for 90 or 180 mins (Cerdan et al, 1990) or 30.5 μmol/min per 100 g for 2 h (Patel et al, 2004). Two types of experiments were performed with either [2-13C]acetate (99% enriched) or [1-13C]glucose (99% enriched) in the infusate. Rats physiologic parameters were controlled as described previously (Serres et al, 2007).
Collection of Blood and Brain After Infusion of Labeled Substrate
A blood sample (∼400 μL) was collected by cardiac puncture during the last minute of infusion. It was immediately mixed with a perchloric acid (9 mol/L) aliquot corresponding to 10% of the collected blood volume and centrifuged. The supernatant was removed and neutralized with concentrated KOH. A 50 μL aliquot was taken for glucose determination by bioassay. Another 50 μL aliquot was taken and diluted with 300 μL of D2O for acetate determination by NMR spectroscopy. Before the NMR analysis, a 10 μL aliquot of fumarate (0.1 mol/L, pH 7) was added as internal reference.
At the end of infusion, the animal brain was frozen in situ by funnel freezing. Then, brain tissue was removed and kept at −80°C. Awake rats under morphine were anesthetized 30 secs before funnel freezing by an intravenous injection of sodium thiopental (15 mg/kg; Dienel et al, 2002).
Nuclear Magnetic Resonance Spectroscopy
Extraction and NMR spectroscopy of brain metabolites were performed as described previously (Serres et al, 2007). Each sample was dissolved in 500 μL D2O. Nuclear magnetic resonance analyses were performed with a Bruker Avance 500 narrow-bore spectrometer equipped with a 5 mm broadband probe, at 30°C. Proton-decoupled 13C-NMR spectra of tissue extracts were acquired with a 5.1 μs pulse (∼52° flip angle), 1.18 secs acquisition time, 0.1 sec relaxation delay, 22,150 Hz sweep width, 64K memory, gated proton composite pulse decoupling, and D2O lock. The number of scans was 50,000. 1H-NMR spectra were acquired using a 7 μs pulse (∼90° flip angle), 3.27 secs acquisition time, 8.5 secs relaxation delay, 5,000 Hz sweep width, and 32K memory size. Residual water signal was suppressed by homonuclear presaturation. The number of scans was 32. 1H-observed/13C-edited spectra were obtained as described previously (Bouzier et al, 2000). The acquisition sequences involved a proton spin echo with calibrated 90 and 180° pulses separated by a 3.9 ms delay corresponding to (2 × JCH)−1, with JCH the value for the 1H–13C scalar coupling in amino-acid –CH2– and –CH3 (JCH=126 to 132 Hz), either with or without 13C spin inversion with a 90, 120, 120, and 90° composite pulse (8.75 μs for 90° flip angle). Other parameters were 3.28 secs acquisition time, 8 secs relaxation delay, 5000 Hz sweep width, and 32K memory size. Measurements were conducted under carbon decoupling (Waltz 16) applied during acquisition and water proton presaturation. The free induction decays corresponding to the two types of data were alternatively acquired as three blocks of 64 scans.
Metabolite Contents and Enrichments
Amino-acid contents in brain were determined from peak areas in 13C-decoupled 1H-NMR spin echo spectra of extracts (Serres et al, 2007). Glucose content in blood was determined by enzymatic assay (kit from Sigma). Blood acetate content was determined from 1H-NMR spectra of sera (Serres et al, 2007).
Brain metabolites were labeled according to the pathways shown in Figure 1. The specific 13C-enrichment of most metabolites was evaluated from 1H-observed/13C-edited NMR spectra as the area ratio of the homologous peaks in the 13C-edited and spin echo spectra, respectively (Serres et al, 2007). Blood glucose enrichment was calculated from relative areas of satellite peaks corresponding to 1H–13C coupling on 1H-NMR spectra of blood samples. Acetate enrichment was determined from the heteronuclear 1H–13C coupling figures on the 1H-NMR spectra of sera (not lyophilized) (Serres et al, 2007).
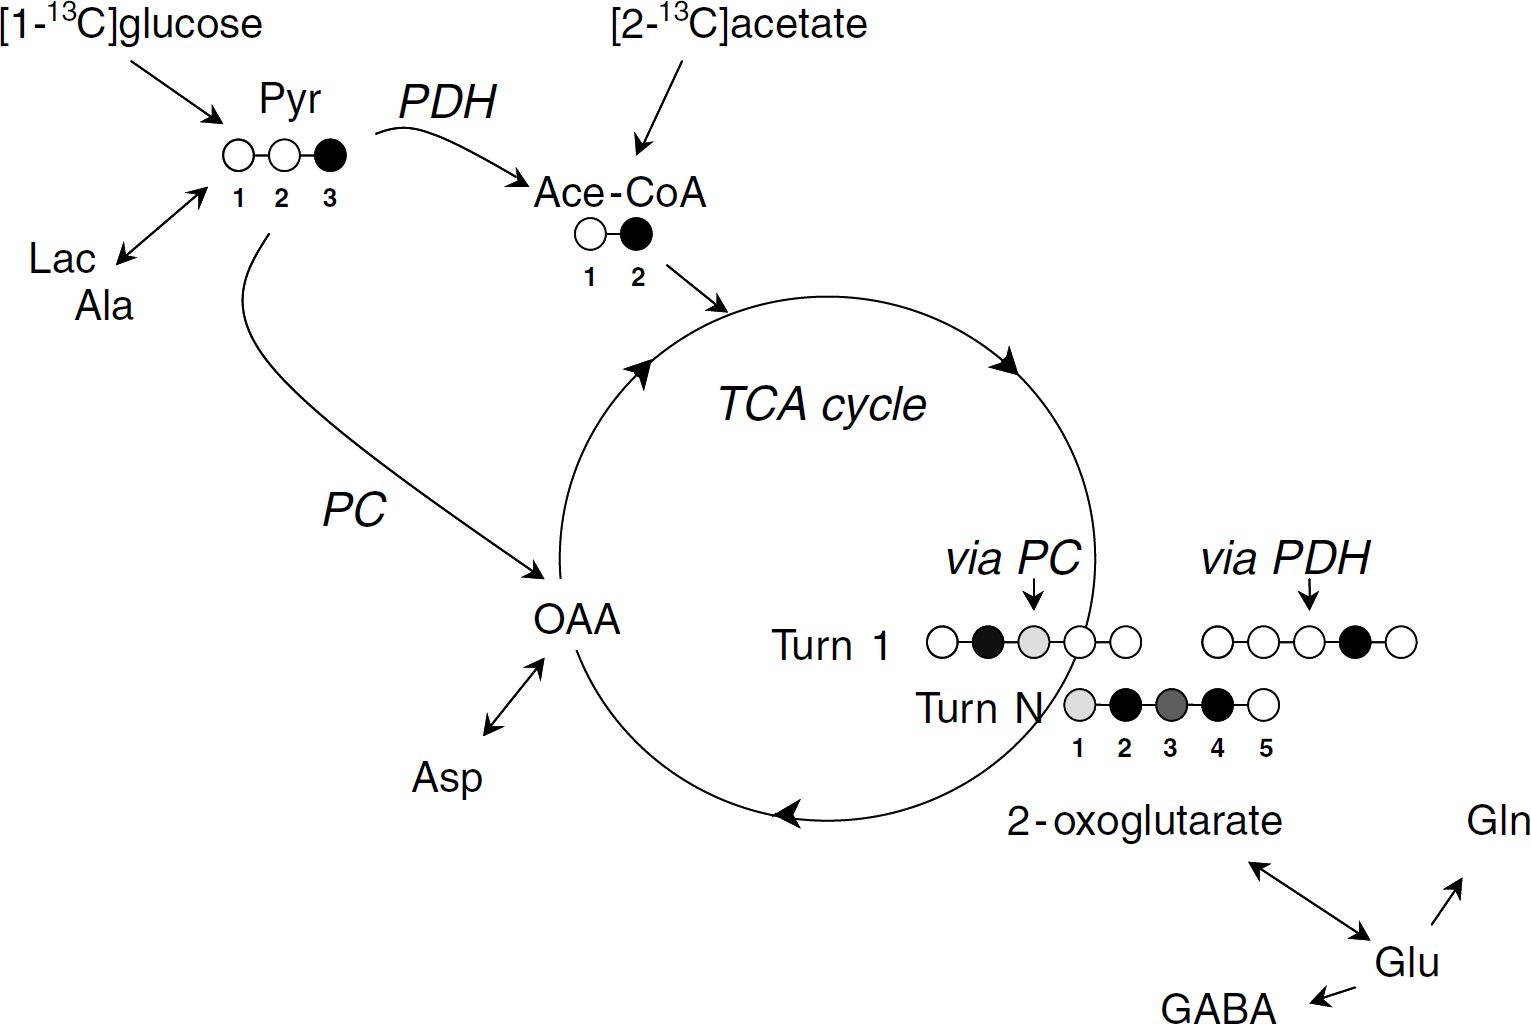
Metabolite labeling from either [2-13C]acetate or [1-13C]glucose. [1-13C]Glucose metabolism gives [3-13C]pyruvate via glycolysis and then [2-13C]acetyl-CoA via PDH activity. [2-13C]Acetyl-CoA is also formed from [2-13C]acetate via acetyl-CoA synthetase. After entry into the TCA cycle via citrate synthetase, the label is recovered at 2-oxoglutarate C4 within the first turn. Simultaneously, the label enters the TCA cycle from [3-13C]pyruvate through PC activity. This leads to oxaloacetate (OAA) labeling at C3 and to a lesser extent at C2 owing to partial equilibration with fumarate through reversal of the reactions catalyzed by malate dehydrogenase and fumarase. Then, the label is recovered at 2-oxoglutarate C2 and C3 (with C2 more labeled than C3) within the first turn. With subsequent turns, carbon scrambling through the TCA cycle leads to 2-oxoglutarate labeling at C1, C2, C3, and C4. Labeling of 2-oxoglutarate is transferred to glutamate via isotopic exchange and thereafter to glutamine or GABA. More or less black carbons indicate more or less 13C-enrichment. Ace-CoA, acetyl-coenzyme A; Lac, lactate; Pyr, pyruvate.
Determination of Acetyl-Coenzyme A C2 Enrichment
Enrichment (at the C2 position) of acetyl-coenzyme A (acetyl-CoA) entering the TCA cycle from which amino-acid labeling originated was evaluated according to the method described previously (Malloy et al, 1990). The method is based on the fact that the percentage of glutamate or glutamine isotopomers labeled at both C3 and C4 relative to all isotopomers labeled at C3 (100 × Glx C3C4/Glx C3) depends on acetyl-CoA C2 enrichment. The evaluation requires measuring the Glx C43 doublet area contributing to the Glx C4 resonance on 13C-NMR spectra: 100 × Glx C3C4/Glx C3=100 × (Glx C43 doublet area/Glx C4 area) × ({Glx C4}/{Glx C3}), where {Glx Ci} corresponds to the specific enrichment of glutamate or glutamine Ci carbon. Acetyl-CoA C2 enrichment from either [1-13C]glucose or [2-13C]acetate metabolism was determined from either glutamate or glutamine labeling, respectively.
Determination of Pyruvate Carboxylase/Pyruvate Dehydrogenase Ratio
The fraction of [3-13C]pyruvate metabolized through PC relative to the flux through PDH (PC/PDH ratio) was evaluated from glutamine and glutamate carbon enrichments (Shank et al, 1993). The evaluation is based on the fact that the enrichment difference between Glx C2 and C3 is due to [3-13C]pyruvate metabolism via PC, whereas Glx C4 enrichment reflects [3-13C]pyruvate metabolism through PDH.
The expression used to calculate PC/PDH was as follows: PC/PDH=({Glx C2}−{Glx C3})/({Glx C4}−1.1), where 1.1 (%) represents the natural 13C abundance.
Analysis of Kinetic Data
The time-dependent increases in Glu C4, GABA C2, and Asp C3 enrichment on infusion of acetate+[1-13C]glucose and that of Gln C4 on infusion of [2-13C]acetate+glucose appeared as monotonic phenomena. Therefore, they were analyzed according to a one-step process (A → B) described by the simple exponential function
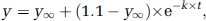
where y∞ was the enrichment at isotopic steady state, k the time constant of the exponential, t the time, and 1.1 the 13C natural abundance at time zero.
The increases in enrichment of Glu C4, GABA C2, and Asp C3 on infusion of [2-13C]acetate+glucose and that of Gln C4 on infusion of acetate+[1-13C]glucose displayed a lag phase. They were analyzed on the assumption that labeling occurred via two successive steps (A → B → C) described by the function
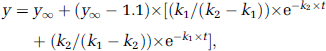
where k1 and k2 are the rate constants of the two steps.
Because the time evolutions of the PC/PDH ratio appeared monotonic, they were analyzed according to the function
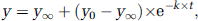
where y0 and y∞ were the extrapolation back to time zero and the value at isotopic steady state, respectively, and k the time constant of the exponential.
The time dependency of the percentage of glutamine isotopomers labeled at both C3 and C4 relative to all isotopomers labeled at C3 (100 × Gln C3C4/Gln C3) from [2-13C]acetate was analyzed as linear to determine acetyl-CoA C2-specific enrichment from the extrapolation back to time zero.
All analyses were performed using the IGOR Pro program without any constraint on parameter values during fitting.
Statistical Analysis
Data are expressed as mean±s.d. They were analyzed by ANOVA with P<0.05, using the Stagraphics package software.
Results
Concentration and Specific Enrichments of Blood Acetate and Glucose and of Brain Glucose
Rats anesthetized with pentobarbital and awake rats under analgesia were infused with a solution containing both glucose and acetate to compare brain metabolite labeling from either [2-13C]acetate or [1-13C]glucose under the same metabolic conditions. As shown previously (Serres et al, 2007), blood acetate and glucose concentrations rapidly increased and plateaued at 4.5±0.8 and 10.2±2.2 mmol/L in anesthetized rats (n=12), and at 3.9±1.1 and 10.3±1.9 mmol/L in awake rats (n=12), respectively, so there was no difference between the two animal groups. Similarly, there was no difference in specific enrichment of the labeled substrate: 68.5±4.0 (n=3) and 72.0±2.4% (n=3) for glucose C1 after 80 mins acetate+[1-13C]glucose infusion; and 75.8±8.5 (n=3) and 71.6±2.4% (n=7) for acetate C2 after 80 mins [2-13C]acetate+glucose infusion in the blood of anesthetized and awake rats, respectively.
Brain glucose content was the same in anesthetized and awake rats: 33.3±10.8 (n=6) and 24.2±7.3 (n=5) nmol/mg P. On infusion of acetate+[1-13C]glucose, brain glucose C1-specific enrichment was the same in both animal groups and was identical to that of blood glucose: 70.6±3.2 (n=20) and 71.2±4.3% (n=12) in anesthetized and awake rats, respectively.
Brain Metabolism of Acetate and Glucose
Incorporation of 13C in brain metabolites demonstrated that both glucose and acetate were used as energy substrate (Figure 1). For a given condition (as shown in Figure 2 after 80 mins infusion in awake rats), signal intensities in 13C-NMR spectra were higher from [1-13C]glucose than [2-13C]acetate metabolism, except for glutamine (Glu and Gln enrichments are given in Figure 2 legend). Such an enrichment pattern was not consistent with a one-compartment model (Figure 1). Indeed, because glutamate is the precursor of glutamine, it was not possible to find Gln C4 more enriched than Glu C4 without considering two different compartments: a first compartment in which Gln synthesis occurred and was able to consume acetate; and a second where Glu (but also GABA and Asp) labeling mostly reflected glucose metabolism (Berl et al, 1961; O’Neal and Koeppe, 1966). This conclusion is obviously in agreement with those of the first 13C-NMR studies about the astrocytic specificity of acetate metabolism (Badar-Goffer et al, 1990; Cerdan et al, 1990).
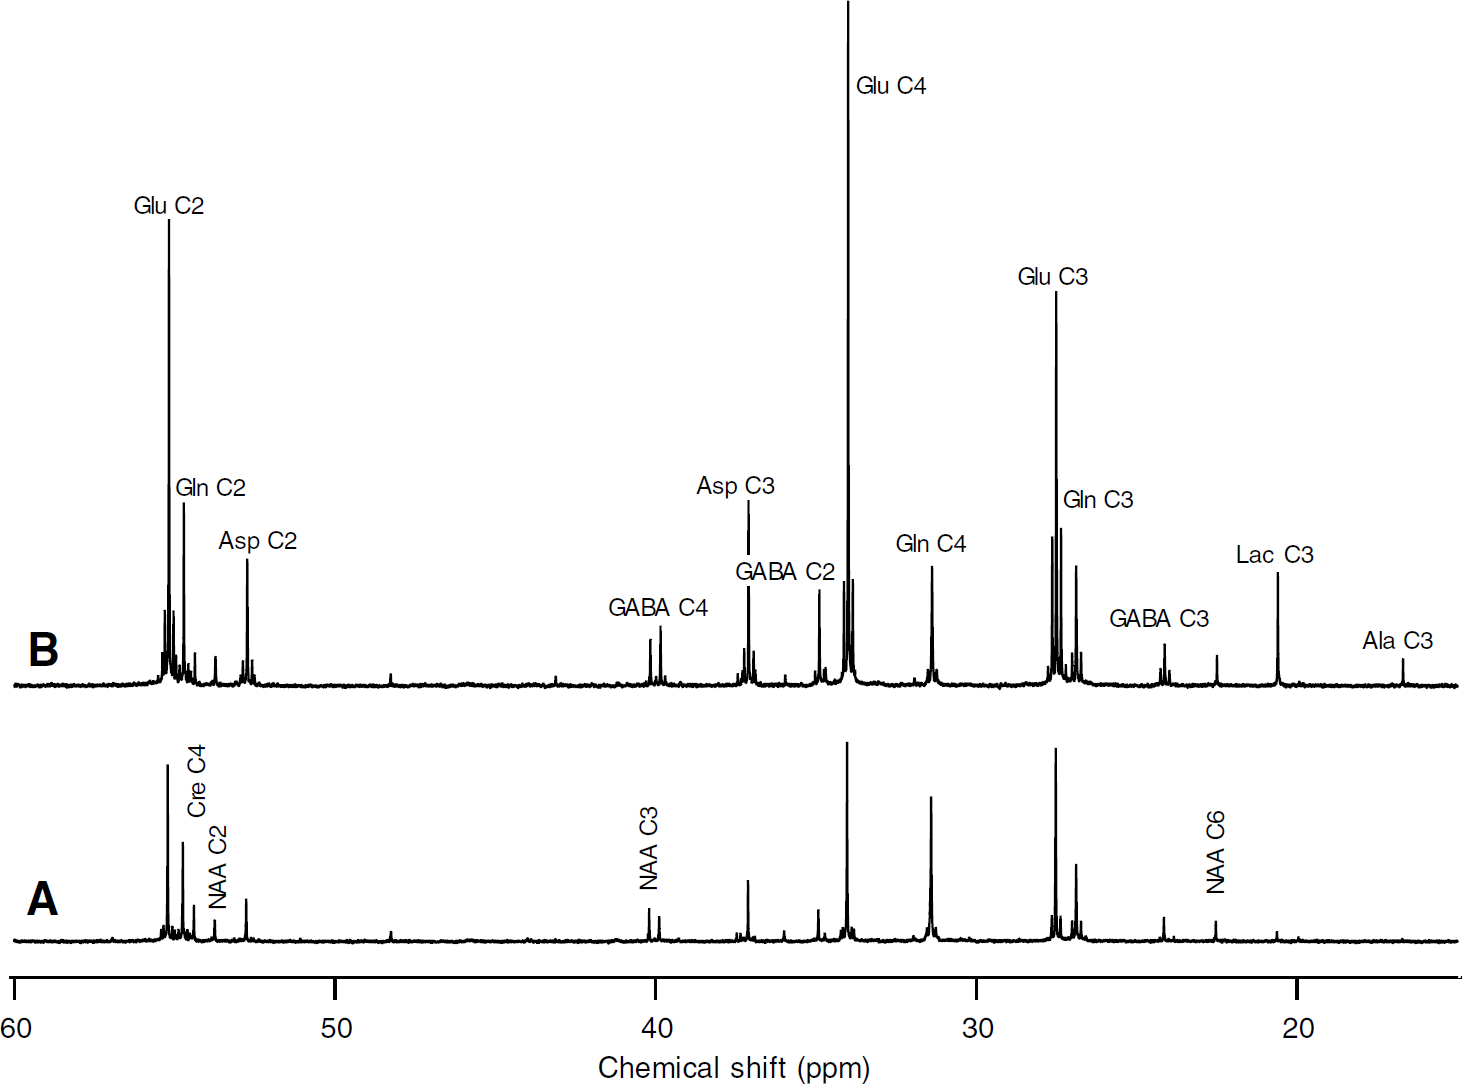
13C-NMR spectra of perchloric acid extracts of brain from awake rats under morphine perfused for 80 mins with a solution containing either (
Most resonance peaks in 13C-NMR spectra were multiplets revealing coupling between neighboring 13C nuclei. The enrichment of acetyl-CoA C2 was determined from the percentage of Glx isotopomers labeled at both C3 and C4 relative to all isotopomers labeled at C3 (100 × Glx C3C4/Glx C3) (Malloy et al, 1990). As shown in Figure 3, 100 × Glx C3C4/Glx C3 for Glu labeled from [1-13C]glucose was constant over the time scale used and the same for anesthetized and awake rats: 30.6±3.1 (n=9) and 31.4±2.5 (n=13), respectively. In contrast, the value for Gln labeled from [2-13C]acetate decreased with time. The extrapolations back to time zero (y0=67.8±3.4 and 49.1±5.1% for anesthetized and awake rats, respectively) were different, indicating a decrease in the contribution of acetate to brain metabolism with cerebral activity.
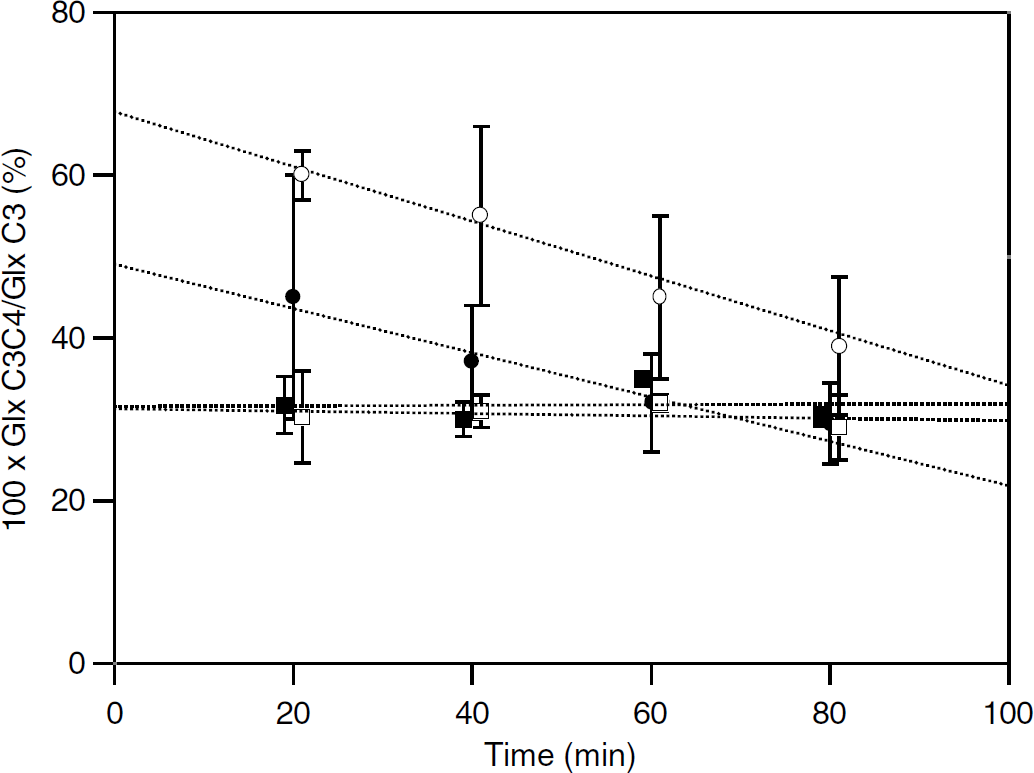
Time dependence of the percentage of glutamate or glutamine isotopomers labeled at both C3 and C4 relative to all isotopomers labeled at C3 (100 × Glx C3C4/Glx C3) from either [2-13C]acetate or [1-13C]glucose metabolism. Values for 100 × Glx C3C4/Glx C3 for anesthetized (□, ○) or awake (▪, •) rats were determined from either glutamine or glutamate labeling with either [2-13C]acetate+glucose (○, •) or acetate+[1-13C]glucose (□, ▪), respectively. For clarity, points (□, ○) and (▪) were plotted at time t±1 min, after fitting. Time evolutions were fitted according to a straight line: y=y0+At. The slope was significantly negative (A=−0.31±0.06 and −0.27±0.04, for anesthetized and awake rats, respectively) when using [2-13C]acetate, whereas there was no significant slope (A=0.014±0.033 and −0.003±0.063, respectively) when [1-13C]glucose was used. The extrapolated values back to time zero (corresponding to acetyl-CoA C2 enrichment) were y0=64.3±3.4 and 49.0±2.2% for anesthetized and awake rats, respectively.
Kinetics of Amino-Acid Labeling from [1-13C]Glucose or [2-13C]Acetate Metabolism
Amino-acid contents in the brain of anesthetized and awake rats were the same (data not shown). Amino-acid enrichment increased with time (Figures 4 and 5). As reported previously, peripheral [2-13C]acetate metabolism induced a time-dependent glucose labeling through gluconeogenesis, leading to around 4% enrichment at C1 and C6 after 80 mins (Serres et al, 2007). Therefore, a fraction of amino-acid labeling under [2-13C]acetate infusion resulted from glucose metabolism.
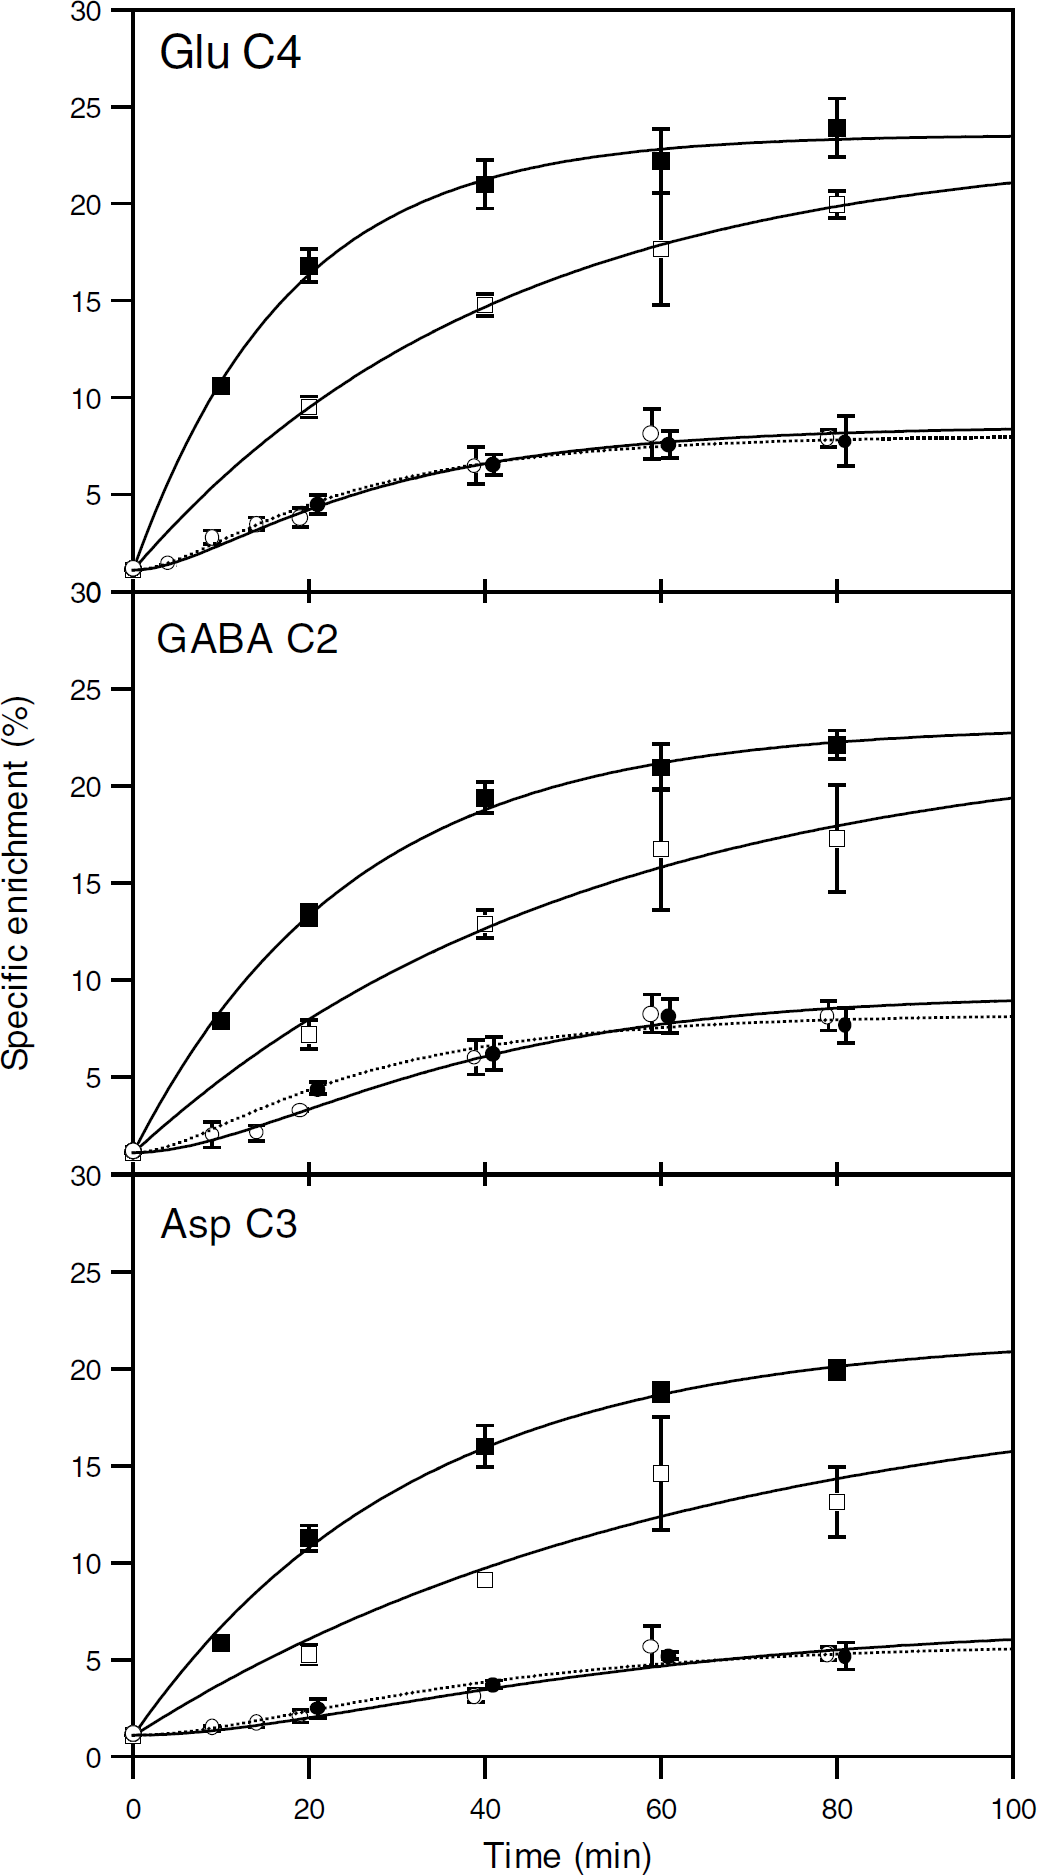
Time evolution of glutamate C4, GABA C2, and aspartate C3-specific enrichment from either [2-13C]acetate or [1-13C]glucose metabolism. Enrichments were determined from 1H-observed/13C-edited NMR spectra of brain extracts from anesthetized (□, ○) or awake (▪, •) rats infused with [2-13C]acetate+glucose (○, •) or acetate+[1-13C]glucose (□, ▪). For clarity, points corresponding to [2-13C]acetate metabolism were plotted at time t±1 min after fitting. Enrichment kinetics from [1-13C]glucose were fitted with equation (1). Enrichment kinetics from [2-13C]acetate were fitted with equation (2) (see Materials and methods). Parameter values are given in Table 1. Anesthetized (○) and awake rats (•), respectively.
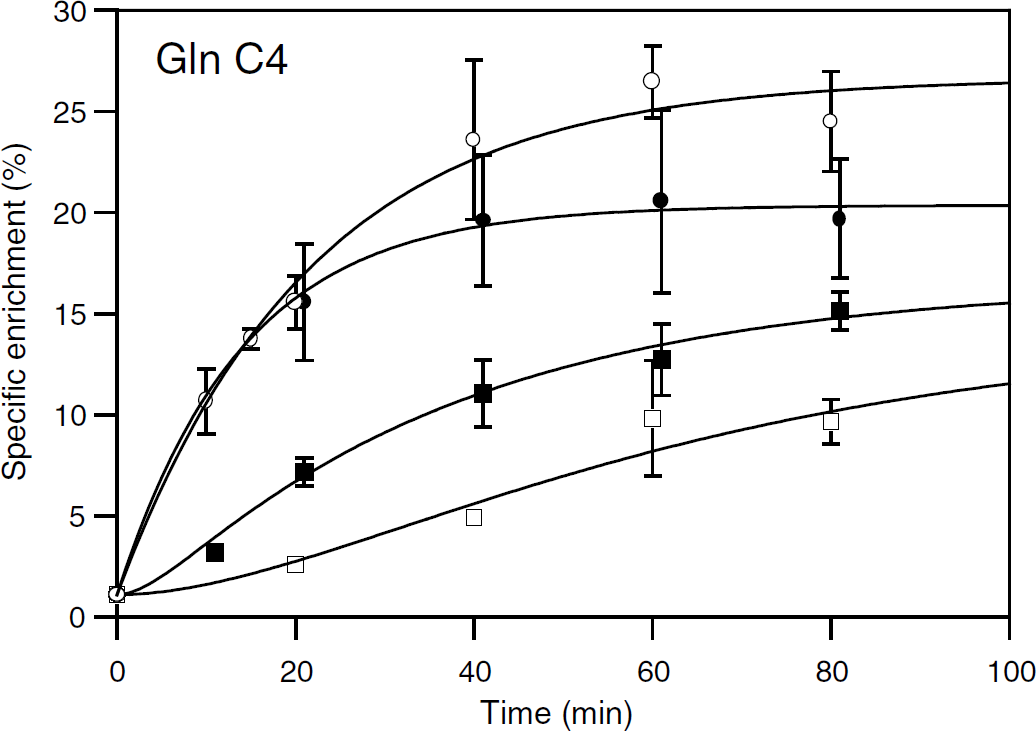
Time evolution of glutamine C4-specific enrichment from either [2-13C]acetate or [1-13C]glucose metabolism. Enrichments were determined from 1H-observed/13C-edited NMR spectra of brain extracts from anesthetized (□, ○) or awake (▪, •) rats infused with [2-13C]acetate+glucose (○, •) or acetate+[1-13C]glucose (□, ▪). For clarity, points corresponding to awake rats were plotted at time t±1 min after fitting. Enrichment kinetics from [2-13C]acetate were fitted with equation (1). Enrichment kinetics from [1-13C]glucose were fitted with equation (2). Parameter values are given in Table 1.
Analysis of amino-acid enrichment kinetics from either [1-13C]glucose or [2-13C]acetate
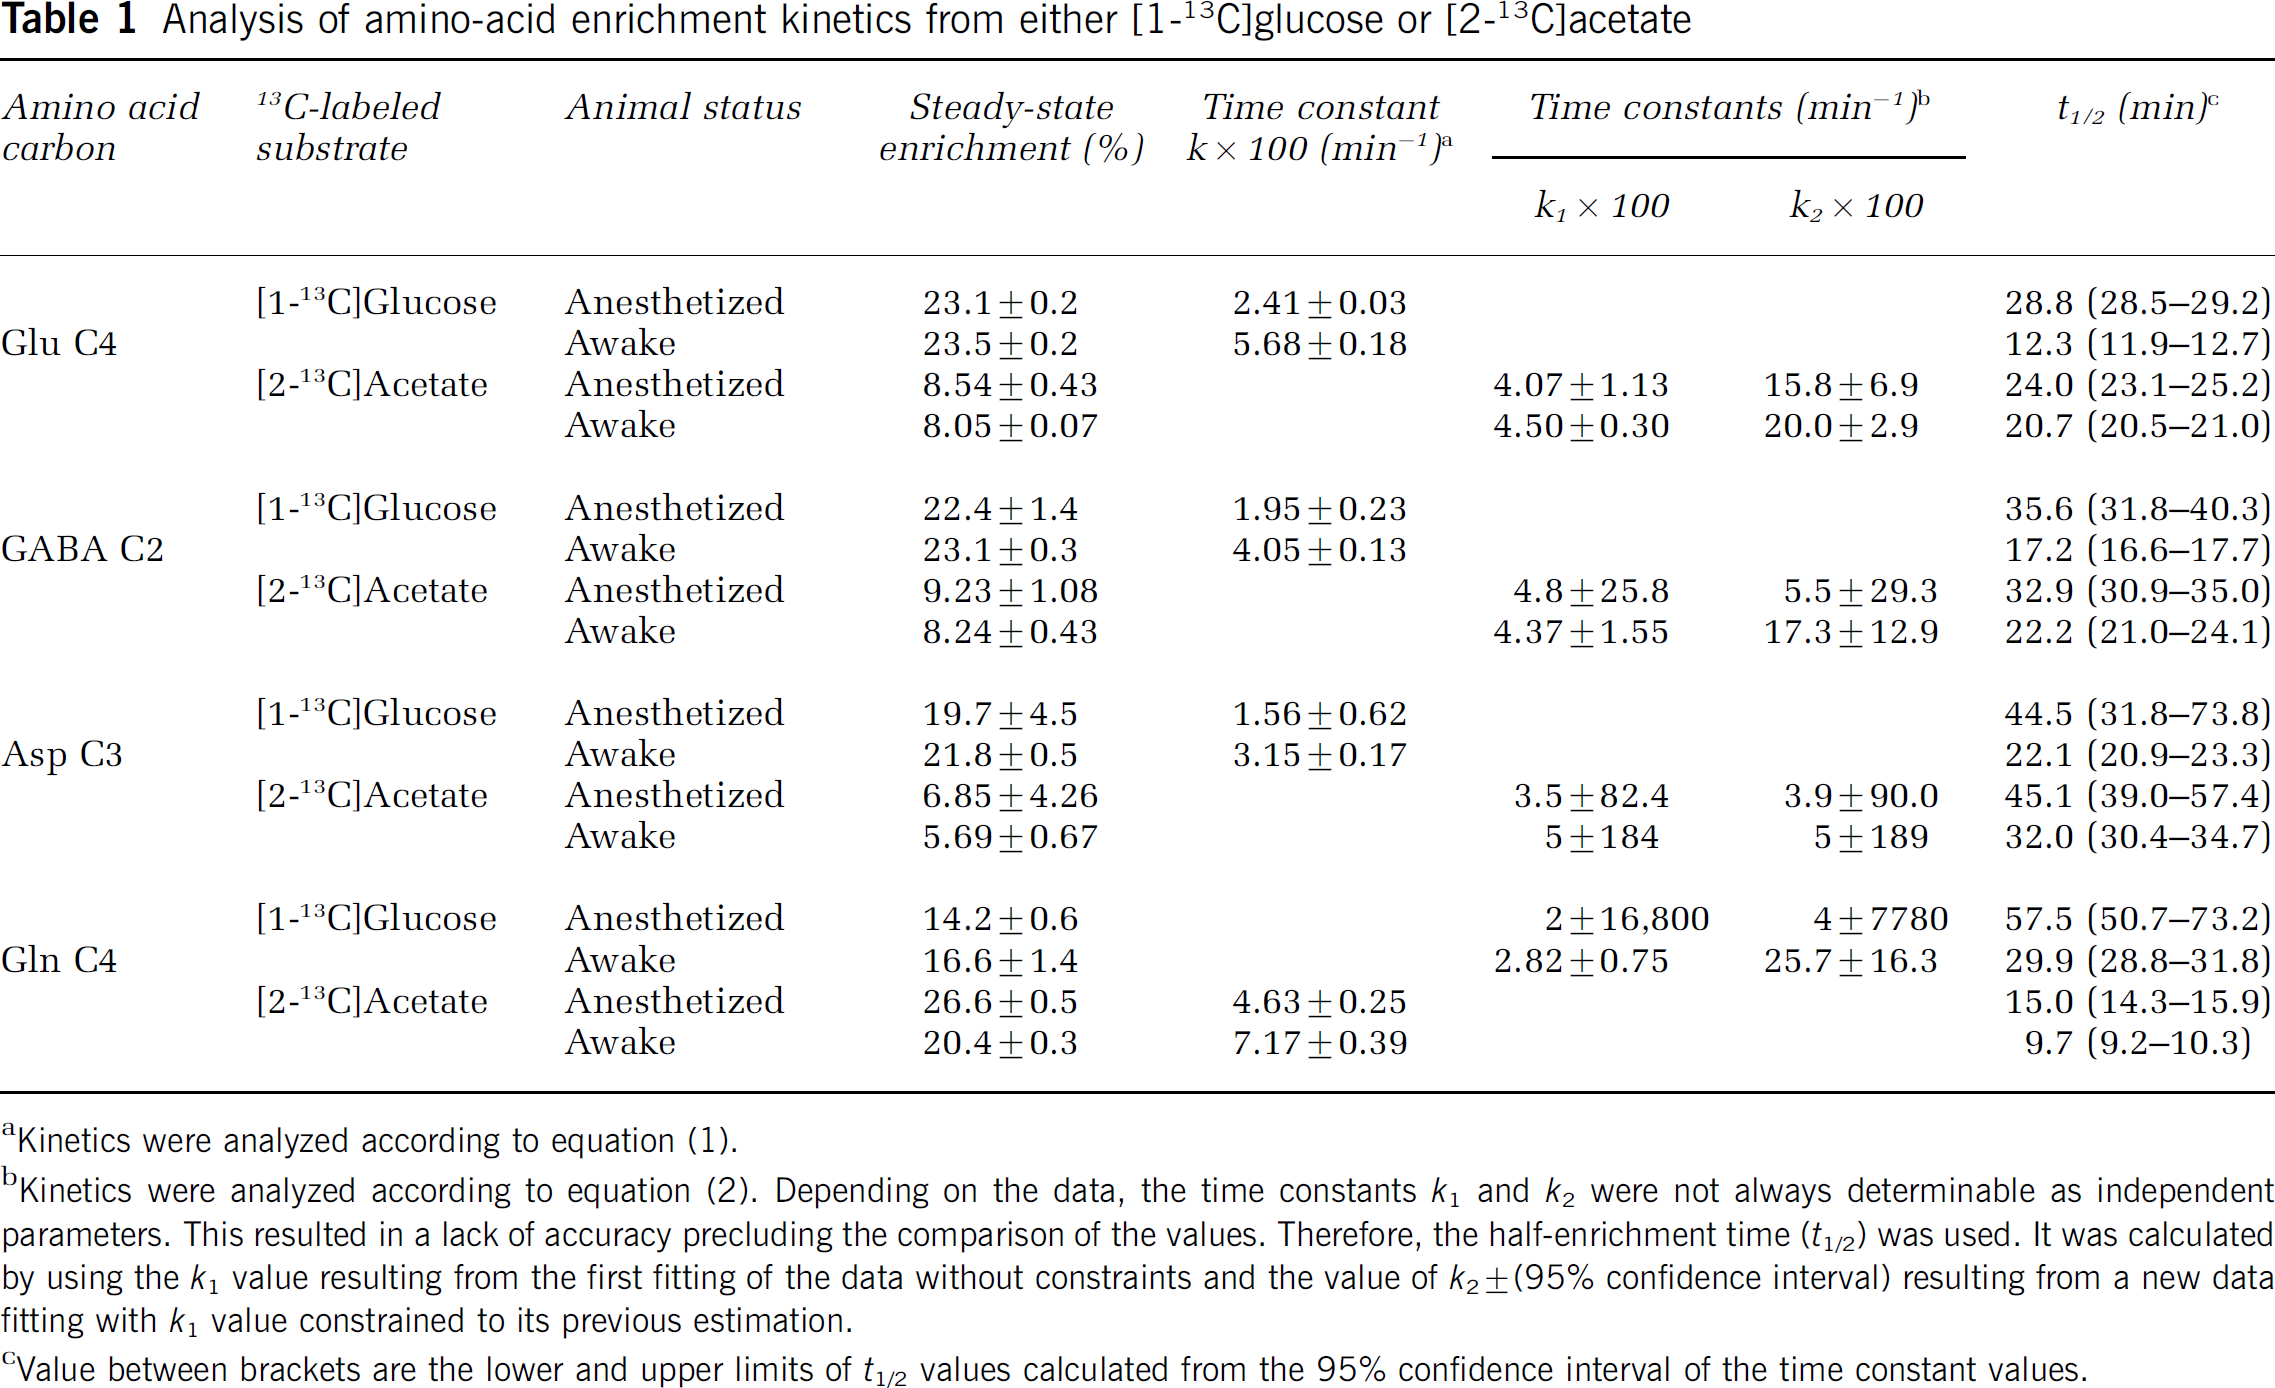
Kinetics were analyzed according to equation (1).
Kinetics were analyzed according to equation (2). Depending on the data, the time constants k1 and k2 were not always determinable as independent parameters. This resulted in a lack of accuracy precluding the comparison of the values. Therefore, the half-enrichment time (t1/2) was used. It was calculated by using the k1 value resulting from the first fitting of the data without constraints and the value of k2±(95% confidence interval) resulting from a new data fitting with k1 value constrained to its previous estimation.
Value between brackets are the lower and upper limits of t1/2 values calculated from the 95% confidence interval of the time constant values.
At each time point, Glu C4, GABA C2, and Asp C3 enrichments from [1-13C]glucose were significantly higher in awake than in anesthetized rats. They increased with time with no apparent lag phase over the time scale used. Therefore, the kinetics was analyzed as a simple first-order process according to equation (1). The same function was used to analyze the increase in Gln C4 labeling from [2-13C]acetate but the enrichments were higher in anesthetized rats.
Enrichments of Glu C4, GABA C2, and Asp C3 from [2-13C]acetate in awake and anesthetized rats were not different (except GABA C2 enrichment at 20 mins), suggesting similar labeling rates. Their time increase involved an initial lag reflecting a multistep process, which was analyzed with equation (2). The same equation was used to fit the evolutions of Gln C4 enrichments from [1-13C]glucose, which were significantly higher in awake than in anesthetized rats.
Table 1 shows that by analyzing the data according to the first-order process, it was possible to determine both rate constants and enrichments at isotopic steady state with rather good accuracy. This was also the case for isotopic steady-state enrichments determined by fitting the data according to two-step kinetics. In contrast, rate constants determined with the latter procedure were accurate only when the half-effect time (t1/2) was less than 30 mins (Table 1).
At isotopic steady state, there was no difference in Glu C4, GABA C2, and Asp C3 enrichment from either [1-13C]glucose or [2-13C]acetate between anesthetized and awake rats. This remarkable result indicated that the relative contributions of acetate and glucose to the synthesis of each of these amino acids remained very close under both conditions. Furthermore, as there was no difference in Glu and GABA enrichment plateaus, the contributions were the same for both amino acids. Comparing exponential process time constants indicated that Glu, GABA, or Asp labeling rates from [1-13C]glucose were higher (× 2.0 to 2.4) in awake than in anesthetized rats (Table 1). Comparing labeling rate constants from [2-13C]acetate was not possible owing to the lack of accuracy. However, t1/2 values suggested a higher (× 1.1 to 1.5) labeling rate in awake rats.
Glutamine C4 enrichment kinetics were quite different from those of Glu, GABA, and Asp (Figure 5). As mentioned above, glutamine labeling was higher from [2-13C]acetate than from [1-13C]glucose metabolism at each time point. Moreover, from [2-13C]acetate, it was higher (31% higher at isotopic steady state) in anesthetized than in awake rats, but it occurred at a lower rate (Table 1). The reverse figure was obtained from [1-13C]glucose with a higher enrichment in awake than in anesthetized rats (17% higher at steady state) and occurring at a faster rate (t1/2 was twofold lower for awake rats) (Table 1).
We analyzed the time evolution of the ratio between the enrichment of Glx C4 (labeled within the first TCA cycle turn after the entry of labeled acetyl-CoA into the cycle, Figure 1) and Glx C2 or C3 (labeled within the following turns) by considering the ratio C4/(0.5 × (C2+C3)) for Glu and Gln. As shown in Figure 6 for awake rats (similar evolutions were obtained with anesthetized rats), the ratio decreased with time. This result was the consequence of the progressive isotopic steady-state achievement through the successive labeling of C4 and thereafter C2 and C3 (Figure 1). However, a remarkable result was that the enrichment ratio for Glu was always higher than that for Gln when [1-13C]glucose was the labeled substrate, whereas the ratio for Gln was higher with [2-13C]acetate. Such enrichment patterns were not in agreement with a homogeneous distribution of the label at the homologous carbons of Gln and Glu (as in the simplified scheme in Figure 1). Actually, they reflected brain metabolic compartmentation and the occurrence of the glutamate—glutamine cycle, as discussed below.
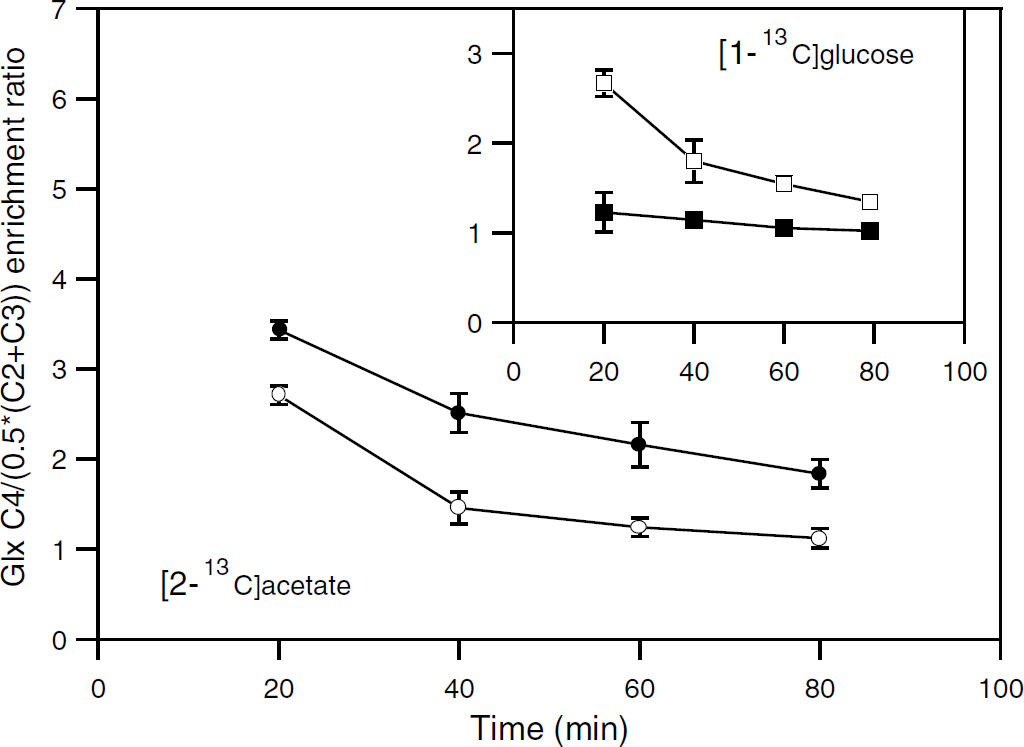
Time evolution of the enrichment ratio C4/(0.5 × (C2+C3)) for glutamine and glutamate from either [2-13C]acetate or [1-13C]glucose metabolism. Enrichments in glutamate (□, ○) and glutamine (▪, •) were determined from 1H-observed/13C-edited NMR spectra of brain extracts from awake rats infused with [2-13C]acetate+glucose (○, •) or acetate+[1-13C]glucose (□, ▪).
Time Evolution of Pyruvate Carboxylase/Pyruvate Dehydrogenase Ratio
The ratio between carbon flux through PC and PDH activities (PC/PDH ratio) was determined on the basis of Gln and Glu carbon labeling from [1-13C]glucose metabolism. As shown in Figure 7, values calculated from Gln decreased with time. This time evolution was analyzed with a simple monotonic exponential process. The extrapolations back to time zero indicated a ratio approximately 2.5-fold higher for anesthetized than awake rats (1.49±0.61 and 0.58±0.15, respectively), whereas steady-state values were in the same range (0.32±0.27 and 0.26±0.03, respectively). The decrease appeared more rapid for awake rats but the time constant determinations were not accurate (0.032±0.032 and 0.063±0.042 mins−1, respectively).
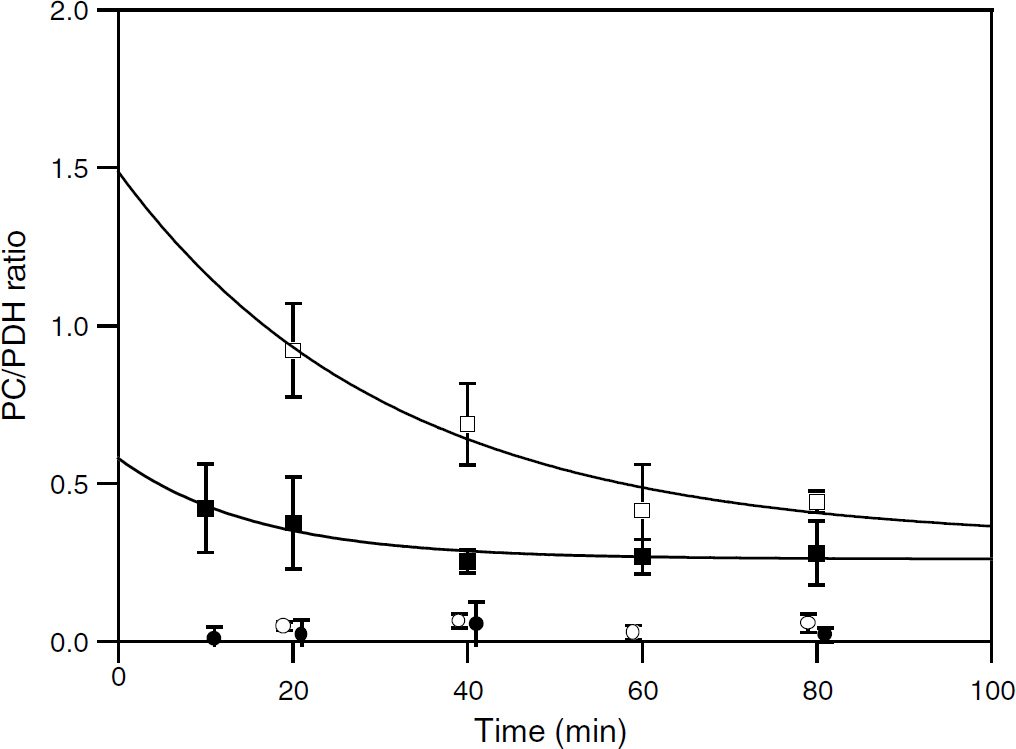
Time evolution of PC/PDH during [1-13C]glucose metabolism. Pyruvate carboxylase/pyruvate dehydrogenase was determined from Gln (□, ▪) or Glu (○, •) labeling in anesthetized (□, ○) or awake (▪, •) rats infused with acetate+[1-13C]glucose. For clarity, points (○, •) were plotted at time t±1 min. Time evolutions of points (□, ▪) were fitted with equation (3). Extrapolation back to time zero was 1.49±0.61 or 0.58±0.15 and steady-state values were 0.32±0.27 or 0.26±0.03, respectively. Time constant of the exponential processes was 0.032±0.032 or 0.063±0.042 mins−1, respectively.
Values calculated from Glu labeling were very low for both anesthetized and awake rats. With regard to the astrocytic localization of PC (Yu et al, 1983), this indicated that Glu labeling mostly reflected neuronal TCA cycle functioning. However, taking all the time points into account, the ratio appeared significantly higher in anesthetized than in awake rats (mean values: 0.051±0.024 (n=16) and 0.014±0.048 (n=15), respectively).
Discussion
Involvement of Glutamate—Glutamine Cycle in Metabolite Labeling
The occurrence of the glutamate—glutamine cycle (Van den Berg and Garfinkel, 1971) as the main interconnecting pathway between astrocytic and neuronal metabolisms induced different labeling of glutamate and glutamine from [2-13C]acetate (Figure 6). Indeed, without this pathway, the relative labeling of these amino acids would have been the same owing to the specific astrocytic acetate metabolism. Actually, the lower enrichment ratio C4/(0.5 × (C2+C3)) for Glu indicated that the glutamate detected was not the astrocytic pool but mainly the neuronal pool, whose labeling resulted from the transfer of glutamine from astrocytes to neurons. The lower ratio was because a substantial part of the label was recycled in the neuronal TCA cycle not consuming [2-13C]acetate, thus leading to the isotopic dilution of 2-oxoglutarate (and then Glu) C4 relative to C2 or C3 through the TCA cycle turnover.
The transfer of glutamate from neurons to astrocytes led to a mirror labeling pattern from [1-13C]glucose metabolism. Indeed, as unlabeled acetate contributed to fuel the astrocytic TCA cycle, acetyl-CoA C2 enrichment from [1-13C]glucose metabolism was likely lower in astrocytes than in neurons (which first explained the lower enrichment of Gln than Glu C4 at isotopic steady state (Figures 4 and 5)). Moreover, as a fraction of the neuronal Glu taken up by astrocytes was recycled in their TCA cycle, an isotopic dilution of 2-oxoglutarate C4 relative to C2 or C3 occurred owing to the acetate consumption. This dilution was translated to glutamine (via the exchange between 2-oxoglutarate and Glu and thereafter Gln synthesis), making possible its detection (Figure 6).
The time dependence of the value for 100 × Glx C3C4/Glx C3 for Gln labeling from [2-13C]acetate (Figure 3) was also the consequence of the glutamate—glutamine cycle. Indeed, within a one-compartment system under a metabolic steady state, the ratio Glx C3C4/Glx C3 is not time-dependent and thus acetyl-CoA C2 enrichment determination does not require an isotopic steady state (Malloy et al, 1990). This is also true for a system consisting in two independent compartments if the labeled substrate is consumed in only one of them, but not for the brain system consisting in two interacting compartments. Indeed, in the initial labeling phase, only astrocytic TCA cycle intermediates were labeled from [2-13C]acetate metabolism before the label was transferred to astrocytic Glu and Gln. With time, the label spread within the neuronal compartment (via Gln trafficking) where it partly entered the TCA cycle (Figure 8). In that cycle, it was no longer possible to generate 2-oxoglutarate (and then Glu) isotopomers labeled at both C3 and C4 because [2-13C]acetate was not consumed in neurons. As a consequence, the relative amount of Glu isotopomers labeled at both C3 and C4 decreased. Owing to the fact that neuronal Glu was partly Gln precursor through the glutamate—glutamine cycle, the decrease was thereafter translated to Gln labeling (Figure 3). In other words, the relative amount of Gln isotopomers labeled at both C3 and C4 resulting from Glu C4 labeling in the compartment metabolizing the labeled substrate progressively decreased because unlabeled acetyl-CoA units entered the TCA cycle in the compartment metabolizing the non-enriched substrate, until an isotopic steady state was reached. Therefore, the enrichment of acetyl-CoA C2 entering the TCA cycle in the astrocytic compartment corresponded to the extrapolation back to time zero of 100 × Gln C3C4/Gln C3 (Figure 3). The value (67.8±3.4 or 49.1±5.1% in anesthetized or awake rats, respectively) was lower than blood acetate enrichment (75.8±8.5 or 71.6±2.4%, respectively), indicating that acetate contribution to astrocytic TCA cycle metabolism amounted to 89 or 69%, respectively. Thus, other substrates than acetate—and especially glucose derived pyruvate—contributed to fueling the astrocytic TCA cycle, particularly in awake rats.
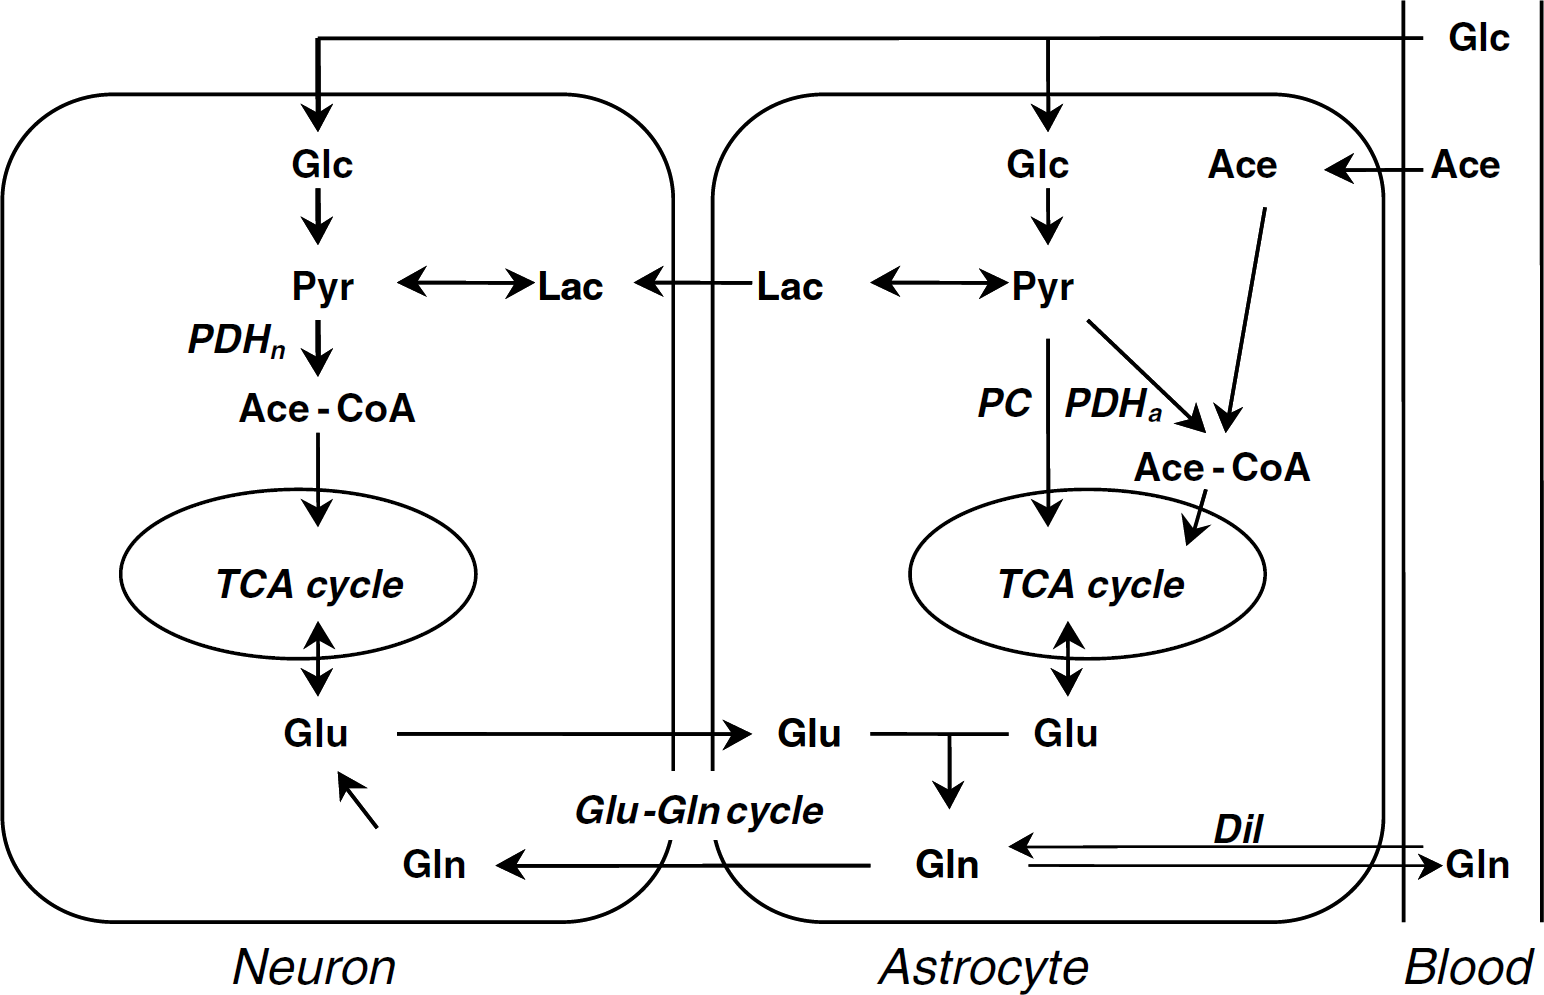
Two-compartment model of brain metabolism. The figure presents the metabolic pathways taken into consideration in the paper. Glucose (Glc) is metabolized in both neurons and astrocytes, whereas acetate (Ace) is converted into acetyl-CoA (Ace-CoA) only in the latter. In astrocytes, glycolysis leads to pyruvate (Pyr), which is partly converted into lactate (Lac) or metabolized in the TCA cycle via PC or PDHa. In neurons, pyruvate resulting from either glycolysis or oxidation of imported lactate is metabolized in the TCA cycle viaPDHn. Neurotransmitter glutamate is recycled via the glutamate—glutamine cycle (Glu—Gln cycle) in which both neurotransmitter and astrocytic Glu are Gln precursors. The efflux of Gln through the blood—brain barrier is associated with an influx of blood Gln leading to dilution (Dil) of the astrocytic pool.
However, the value for 100 × Glu C3C4/Glu C3 from [1-13C]glucose was constant and the same for both groups of rats (and thus acetyl-CoA C2 enrichment) (Figure 3). As brain glucose-specific enrichment was the same under both conditions, this result indicated that the contribution of glucose to Glu metabolism did not change significantly. In the presence of acetate, and keeping in mind that neuronal Glu represented approximately 90% of brain Glu (Cruz and Cerdan, 1999), it could be assumed that the value found (31%) corresponded rather to neuronal acetyl-CoA C2 enrichment. It indicated a 14% dilution compared with the theoretical maximal enrichment value of pyruvate C3 (36% from [1-13C]glucose enriched at 71%). In comparison, the dilution factor between glucose (C1+C6)/2 and Glu C4 (23.3% at isotopic steady state, Table 1) was 35%. In previous studies with labeled glucose as the only exogenous substrate, a similar dilution between glucose and glutamate (29%) was reported as occurring upstream from acetyl-CoA (Sibson et al, 1998, 2001). From the determination of acetyl-CoA enrichment in this study, it can be suggested that the dilution occurred partly upstream and partly downstream from acetyl-CoA (particularly owing to acetate metabolism in the astrocytic compartment and to isotopic dilution with glutamine from blood).
Relative Contributions of Glucose and Acetate to Amino-Acid Synthesis
The relative contributions of glucose and acetate to Glu or Gln synthesis were calculated from Glu C4 or Gln C4 labeling, respectively. Glucose contribution (α) was calculated from Glx C4 labeling from [1-13C]glucose metabolism according to
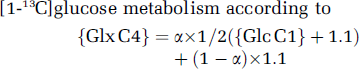
In this equation, {Glx C4} corresponds to either Glu C4 or Gln C4 enrichment at isotopic steady state (value in Table 1), {Glc C1} to brain glucose C1 enrichment (Results section), and 1.1 (%) to 13C natural abundance in Glc C6 and other non-enriched substrates (including exogenous acetate).
Then, acetate contribution (β) was calculated from Glx C4 enrichment from [2-13C]acetate according to
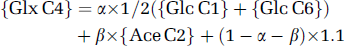
{Glx C4} corresponds to isotopic steady-state enrichment (Table 1), {Glc C1} and {Glc C6} correspond to the value of Glc C1 and C6 enrichment due to hepatic gluconeogenesis (4 and 4.4% in anesthetized and awake rats, respectively) (Serres et al, 2007), {Ace C2} to blood acetate enrichment (Results section), and 1.1 corresponds to natural abundance in sources other than glucose and acetate.
The contributions of glucose, acetate, and other sources to Glu synthesis were the same in anesthetized and awake rats: α=0.63 and 0.64, β=0.07 and 0.07, and (1−α−β)=0.29 and 0.29, respectively, whereas some changes were observed for Gln: α=0.38 and 0.44, β=0.33 and 0.25, and (1−α−β)=0.30 and 0.31, respectively. The fact that the contribution of glucose was ninefold higher than that of acetate in Glu synthesis, whereas their contributions in Gln synthesis were in the same range, again emphasized the compartmentation of acetate metabolism.
Kinetics of Amino-acid Labeling
Enrichment kinetics from [1-13C]glucose were around twice as fast in awake than in anesthetized rats (time constant ratio of 2.37, 2.08, and 2.02 for Glu C4, GABA C2, and Asp C3 and t1/2 ratio of 1.92 for Gln C4, respectively, Table 1). This result demonstrated the higher metabolic activity in awake rat brain, particularly in the neuronal compartment where glucose metabolism dominated. Enrichment kinetics from [2-13C]acetate were also faster in awake rats (time constant ratio of 1.55 for Gln C4 and t1/2 ratio of 1.16, 1.48, and 1.41 for Glu C4, GABA C2, and Asp C3, respectively). Metabolite labeling from both [1-13C]glucose and [2-13C]acetate resulted from both astrocyte and neuron metabolism (owing to metabolite trafficking). However, acetate was oxidized only in astrocytes, whereas glucose was oxidized both in neurons and astrocytes. As a consequence, the weight of metabolism in the neuronal compartment (containing the large Glu pool) buffered the enrichment kinetics when [2-13C]acetate was used. Therefore, the higher labeling rate with [2-13C]acetate in awake rats points to substantial enhancement of oxidative metabolic activity in the astrocytic compartment.
Time Evolution of Pyruvate Carboxylase/Pyruvate Dehydrogenase Ratio
The PC/PDH ratio was determined under [1-13C]glucose metabolism (acetate is not a substrate for anaplerosis). The ratio calculated from Gln labeling decreased with time, a consequence of the involvement of the glutamate—glutamine cycle in Gln labeling (Merle et al, 2002). As discussed previously, the extrapolation back to time zero corresponded to PC/PDHa (PDHa: PDH activity in the astrocytic compartment) (Merle et al, 2002). As shown in Figure 6, PC/PDHa was around 2.5-fold lower in awake rats. This decrease could have been due to a lower difference in C2 and C3 labeling through partial equilibration between oxaloacetate and fumarate via reversal of malate dehydrogenase and fumarase activities (Merle et al, 1996). However, it seems unlikely that such a reaction reversal would be more favored in awake rats than in anesthetized ones because an increase in TCA cycle activity, and thus in the forward reaction rate, occurred in the former. Therefore, the result indicated a relative increase in PDH activity.
As both astrocytic and neuronal Glu were Gln precursors (owing to metabolic trafficking between astrocytes and neurons), the steady-state PC/PDH ratio depended on PC activity, PDH activities in the astrocytic and neuronal compartment (PDHa and PDHn, respectively) and Glu—Gln cycle rate. Therefore, to interpret the data, we needed to know the relative contributions of the astrocytic and neuronal TCA cycles to glutamine labeling (see below).
Coupling between Metabolism and Cerebral Activity
Administration of a high dose of either morphine (50 mg/kg, intraperitoneally) or pentobarbital (120 mg/kg, intraperitoneally) to rats led to very different cerebral activity levels characterized by either fast desynchronized or isoelectric encephalogram patterns, respectively, and to a sixfold higher brain glucose consumption rate through the TCA cycle under morphine (Sibson et al, 1998). However, glucose consumption rate and flux through PDH were threefold higher in the brain of awake rats (Choi et al, 2002) than in deeply pentobarbital-anesthetized ones (80 mg/kg per h, intravenously) (Öz et al, 2004). These results emphasized the coupling between brain metabolic and electrical activities. In this study where smaller intraperitoneal doses of morphine (15 mg/kg) and pentobarbital (60 mg/kg) were used, brain metabolic activity was around twofold higher in awake than in anesthetized rats (mean value of ratios between time constants for Glu and GABA labeling from [1-13C]glucose and for Gln labeling from [2-13C]acetate, Table 1), indicating a less depressed state under pentobarbital than in the above-mentioned studies.
In anesthetized and awake rats, the similar enrichments at isotopic steady state of Glu C4, GABA C2, or Asp C3 from either [1-13C]glucose or [2-13C]acetate indicated very similar contributions of glucose and acetate to their metabolism. Therefore, the twofold higher metabolic activity in awake rats suggested that carbon entries into the TCA cycles via PDH and acetyl-CoA synthetase were simultaneously increased, and that the increase in metabolic activity occurred in both astrocytic and neuronal compartments. However, the weight of neuronal metabolism in the labeling of these amino acids remained dominant as revealed by the ninefold higher contribution of glucose than acetate to Glu synthesis (α/β ratio) and the unchanged value of acetyl-CoA C2 enrichment from [1-13C]glucose metabolism (determined from Glu labeling). However, acetyl-CoA C2 enrichment from [2-13C]acetate metabolism evidenced a lower contribution of acetate as astrocytic TCA cycle fuel in awake than in anesthetized rats (69 and 89%, respectively), in agreement with the lower steady-state enrichment of Gln in the former. This meant that the increase in astrocytic TCA cycle activity relied more on an increase in carbon flux through PDH than through acetyl-CoA synthetase. Indeed, if the rates of astrocytic acetyl-CoA synthesis through PDH and through acetyl-CoA synthetase would have been increased in the same way, acetyl-CoA C2 enrichment determined from [2-13C]acetate metabolism would have been the same for both groups of rats. This conclusion was in agreement with the finding of a higher acoustic stimulus-induced increase in astrocytic oxidative activity than acetate utilization in the rat auditory pathway (Cruz et al, 2005; Hertz et al, 2007). In addition, it suggested that relatively more pyruvate than acetate was available to fuel the astrocytic TCA cycle in awake rats, due to the overall increase in metabolic activity. This latter suggestion would be in agreement with the Glu uptake stimulation of astrocytic glycolysis (Pellerin and Magistretti, 1994), which leads to a higher production of lactate/pyruvate in the astrocytic compartment (Serres et al, 2004). Therefore, in this case, the extra three-carbon units produced from glucose would be used to fuel not only the neuronal TCA cycle (via the astrocyte—neuron lactate shuttle mechanism) (Magistretti et al, 1999; Serres et al, 2004) but also the astrocytic TCA cycle to fulfill the energy needs of the glial cells during activation (as discussed recently) (Hertz et al, 2007).
The glutamate—glutamine cycle is the major interconnecting pathway between astrocytic and neuronal metabolisms and its activity is directly related to glutamatergic neurotransmission. As a consequence, Gln synthesis in astrocytes relies on two different Glu precursors (neurotransmitter Glu from the neuronal pool and astrocytic Glu) in close connection with either the neuronal or the astrocytic TCA cycle. The relative contribution of these two precursors to Gln C4 labeling could be estimated from Glu C4 (assuming that Glu C4 enrichment mainly corresponded to that of neuronal Glu) and acetyl-CoA C2 enrichments from [2-13C]acetate metabolism, respectively, using the equation
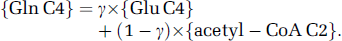
In this equation, γ represents the fractional contribution of neuronal Glu to Gln labeling and {Glx C4} corresponds to steady-state enrichment. Neuronal Glu contribution was 0.69 or 0.70 in anesthetized or awake rats, respectively. Considering an isotopic dilution due to entry of blood Gln through the blood—brain barrier would lead to a lower γ value: for example, with a 22% dilution (Öz et al, 2004), γ would be 0.57 in both anesthetized and awake rats. Such values indicated that the relative contributions of the neuronal and astrocytic TCA cycles to Gln metabolism did not change with cerebral activity. Therefore, although a relatively lower change in glial TCA cycle rate (from 0.26 to 0.40 μmol/g per min) than in neuronal TCA cycle rate (from 0.35 to 1.13 μmol/g per min) in the brain of awake as compared with deeply anesthetized rats was reported (Choi et al, 2002; Öz et al, 2004), this result suggested tight coupling between neuronal TCA cycle, Glu—Gln cycle, and glial TCA cycle activities. Such a tight coupling emphasized the importance of the oxidative component in glial ATP production to sustain astrocytic metabolic reactions related to overall brain activity, as mentioned already (Öz et al, 2004).
Concerning the PC/PDH ratio determined from Gln labeling, the 2.5-fold lower value for PC/PDHa in awake rats suggested at first glance that in glia, the increase in energy requirements with cerebral activity was higher than that in anaplerotic requirements. However, to be valid, this conclusion required that the increase in PDH activity should not be counterbalanced by a decrease in acetate metabolism. In fact, this was likely the case. Given the relative contribution of acetate to glial metabolism in anesthetized or awake rats (89 and 69%), that of pyruvate would at most be 11 or 31%, respectively. This corresponded to a 2.8-fold relative increase in PDH activity, which could fully explain the evolution of the PC/PDHa ratio. Thus, anaplerotic and astrocytic TCA cycle-derived energy needs appeared closely coupled.
As both neuronal and astrocytic Glu were Gln precursors and assuming that neuronal Glu labeling mostly reflected neuronal TCA cycle functioning (as demonstrated by the very low PC/PDH ratio determined from Glu labeling), the value of the steady-state ratio corresponded to the equation

where γ was the fractional contribution of neuronal Glu to Gln labeling (as determined above). As the ratio PC/PDHa was known, replacing PDHa by its value as a function of PC made it possible to determine PC/PDHn. The values found were PC/PDHn=0.24 and 0.21 (or 0.20 and 0.18 with γ values determined on the basis of a 22% dilution of Gln by blood glutamine) for anesthetized and awake rats, respectively, indicating close coupling between neuronal TCA cycle and PC activity, as proposed previously (Öz et al, 2004).
In conclusion, this study shows that carbon fluxes on astrocytic and neuronal metabolic pathways (PDHa, PDHn, PC, and glutamate—glutamine cycle) are proportionally increased in the same way in awake rats as compared with lightly anesthetized rats. This suggests that both astrocytic and neuronal metabolisms are closely coupled to fulfill the anabolic and energy needs linked to brain activation. More particularly, the oxidative metabolic increase in astrocytes is likely related to the sum of energy-dependent processes either directly linked to neurotransmission, that is glutamate uptake (Eriksson et al, 1995) and active K+ uptake (Hertz et al, 2007; Walz, 2000), or involved in the intra- and inter-cellular signaling pathways mediated by Ca2+ or Na+ waves (Zonta et al, 2003; Bernardinelli et al, 2004) that participate in the spatio-temporal coupling between cerebral activation and metabolism.
Footnotes
Acknowledgements
We thank Eric Bezancon for his help in NMR analyses.