
Abstract
An increase in dopamine turnover has been shown to occur early in Parkinson's disease (PD). This study investigated changes of dopamine turnover as a function of PD duration using the effective distribution volume (EDV) for dopamine, determined by positron emission tomography with 6-[18F]-fluoro-L-dopa, and compared them with changes in dopamine synthesis and storage ability, quantified with the fluorodopa uptake rate constant Ki. Six healthy subjects, 9 early PD patients (PD1), and 13 advanced PD patients (PD2) participated in the study. In the caudate, the Ki and EDV for PD1 were not significantly different from the normal values, whereas in the putamen Ki was 63% of normal and EDV was only 35%. Between PD1 and PD2 the decline in EDV was higher than that for Ki (caudate 44% and putamen 46% for EDV vs. 21% and 34%, respectively, for Ki). Turnover was higher in the caudate than the putamen in controls, whereas the PD patients exhibited the reverse pattern. This comparison of changes in Ki and EDV as a function of disease progression indicates that a relatively slower decrease in dopamine synthesis and a relatively faster increase in turnover in early disease likely act as compensatory mechanisms, and that the clinical onset of PD reflects a global failure of dopaminergic compensatory mechanisms.
Parkinson's disease (PD) affects approximately 300/100,000 of the general population (Schoenberg et al., 1988). Its clinical symptoms include resting tremor, rigidity, bradykinesia, and postural instability leading to progressive motor impairment. These characteristics are attributed to a progressive loss of the neurotransmitter dopamine, caused by the degeneration of the dopaminergic neurons of the substantia nigra pars compacta that project to the striatum. Clinical symptoms appear only when the striatal dopamine concentrations are already fairly depleted (by 80% or more) (Bernheimer et al., 1973; Seeman and Niznik, 1990). This finding implies that a variety of compensatory mechanisms may take place in the early stages of the disease, including changes in dopamine synthesis, release, reuptake, and transport mechanisms (Calne and Zigmond, 1991).
There are indications from biochemical data that an increase in dopamine turnover might be a very important early compensatory mechanism (Barrio et al., 1990) and we have recently confirmed this hypothesis in vivo, using the 18F-fluorodopa positron emission tomography (PET) marker for dopamine turnover, the dopamine effective distribution volume (EDV) (Sossi et al., 2002) which is the inverse of the effective dopamine turnover (Doudet et al., 1998; Holden et al., 1997; Sossi et al., 2001). The latter is in turn highly correlated with classical neurochemical markers for turnover (Agid et al., 1987; Doudet et al., 1998).
The radiotracer 18F-fluorodopa has been used extensively to investigate the rate of dopamine synthesis and storage, quantifiable with the blood to striatum uptake rate constant Ki (Patlak et al., 1983; see Materials and Methods). Ki is in fact thought to reflect a combination of tracer uptake, decarboxylation to fluorodopamine, and subsequent trapping in synaptic vesicles, and has been shown to correlate well with the number of dopamine neurons and the levels of striatal dopamine (Snow et al., 1993). Ki is generally obtained from data acquired in the first 90 minutes after tracer injection. During that time 18F-fluorodopa behaves as an irreversibly bound tracer. However, if the scanning time is extended, some degree of reversibility is observed in the data, which is considered an indication of dopamine neuronal release and subsequent metabolism. Such reversibility is quantified with the rate constant kloss. The ratio kloss/Ki is then interpreted as an in vivo estimate of the effective dopamine turnover. Although highly correlated with classical biochemical measures of dopamine turnover (Doudet et al., 1998; Sossi et al., 2001), this turnover index differs conceptually because it is obtained using a radiotracer that is analogous to exogenous levodopa; this tracer is not sensitive to the tyrosine hydroxylation step considered to be the limiting factor in the formation of endogenous dopa and dopamine. Nevertheless, the effective dopamine turnover measures the relative strength of the uptake and elimination processes present at each site of the brain and it can thus provide information about variation of dopamine turnover between brain regions and between different subjects.
Apart from our previous studies performed in very early PD patients, very little is known about the changes in dopamine turnover as a function of PD progression and/or severity. In addition to investigating the time course of this possible compensatory mechanism, it is interesting to compare the changes in dopamine turnover with changes in dopamine synthesis in an attempt to understand the relative effects of these processes at various stages of the disease. Previous studies have in fact suggested a relative upregulation of dopamine synthesis over a wide range of disease durations (Lee et al., 2000). Such upregulation of synthesis has been itself interpreted as an attempt by the nigrostriatal system to maintain normal dopaminergic function.
To address these questions, we used a 4-hour 18F-fluorodopa PET protocol to determine EDV and compared EDV and Ki (a marker of dopamine synthesis and storage) among 3 groups of subjects: normal volunteers, patients with early PD (PD1), and patients with more advanced PD (PD2). Ki and EDV were compared separately for the caudate and the putamen because there is a well-known topologic gradient in the dopaminergic lesion induced by PD, with the putamen being affected earlier than the caudate (Kish et al., 1992). We also quantified the degree of change in Ki and EDV as a function of disease duration by modeling the Ki and EDV time courses and calculating the fractional change as a function of disease duration. Although such an approach may provide useful insights into disease mechanisms, its conclusions and validity are dependent on the choice of the particular mathematical model used.
MATERIALS AND METHODS
Patient selection, scanning protocol, and region of interest placement
Nine very early PD patients (six men and three women; mean±SD age, 60.3±12.0 years) were selected for this study (PD1 group). Disease duration, defined as time from the onset of symptoms as first noticed by the patient, was 3 years or less (mean±SD, 2.1±0.8 years). Four of the nine patients were still untreated at the time of the scan. The Modified Columbia Scale score (Duvoisin, 1971) was 16.8±5.3 (mean±SD; range, 11 to 27). The five treated patients were receiving levodopa therapy alone (standard levodopa equivalents, mean±SD, 370.0±133.9 mg/day).
Thirteen more advanced age-matched PD patients (11 men and 2 women; mean±SD age, 64.4±7.8 years) comprised the PD2 group. Disease duration was 11.7±4.6 years (mean±SD; range, 5 to 22). The Modified Columbia Scale score (assessed after a minimum of 12 hours off all antiparkinson medication) was 34.8±9.9 (mean±SD; range, 18 to 51). Only one of these patients was still untreated at the time of the scan. The other 12 patients were receiving chronic levodopa treatment, and 8 of them were also taking direct dopamine agonists (standard levodopa equivalents, mean±SD, 1,070.3±505.6 mg/day). All medications were stopped the evening before the scan.
These patients and six normal volunteers (two men and four women) of similar age (mean±SD, 52.2±8.4 years) underwent a 4-hour-long 18F-fluorodopa scan on a Siemens/CTI ECAT 953B PET tomograph (CTI, Knoxville, TN, U.S.A.). (Spinks et al., 1992) operating in three-dimensional mode (Sossi et al., 1998) after injection of 7 mCi of 18F-fluorodopa (effective dose equivalent 4.2 mSV). All the subjects were administered 150 mg of the peripheral decarboxylase inhibitor carbidopa 1 hour before 18F-fluorodopa injection. Data were corrected for attenuation using an external 68Ge source. The scanning sequence consisted of nine 10-minute scans, after which the patients could leave the bed for 60 minutes, followed by a final sequence of nine 10-minute scans. The repositioning was aided by use of a thermoplastic mask, which also helped to minimize head motion during the scans. Images from the first and second scanning sequences were realigned using the AIR algorithm (Woods et al., 1993). Four 61-mm2 circular regions of interest were placed on each striatum, one on the caudate nucleus and three on the putamen (anterior [P1], middle [P2], and posterior putamen [P3]), and six 270-mm2 circular regions of interest were placed on the occipital cortex on five adjacent planes containing the striatal image on each frame of the dynamic sequence.
For each study, 37 arterial blood samples were taken to obtain the plasma radioactivity time course. Twelve were analyzed for metabolites to identify the authentic 18F-fluorodopa plasma fraction. The metabolite separation was performed as previously described with an alumina extraction method with anion/cation exchange columns (Doudet et al., 1998; McLellan et al., 1991). With this method, the cation column captures the positively charged metabolites ([18F]dopamine and 6-fluoro-3-methoxytyramine) and the anion column the negatively charged metabolites (L-3,4-dihydroxy-6-[18F]fluorophenylacetic acid [FDOPAC] and [18F]6-fluoro-homovanillic acid and sulfated conjugates). 18F-fluorodopa and 3-O-methyl-fluorodopa (3OMFD), not retained by the columns, are then separated by alumina extraction. All subjects gave written informed consent. The study received the approval of the University of British Columbia Ethics Committee.
Modeling
During approximately the first 90 minutes after tracer injection, 18F-fluorodopa behaves as an irreversibly bound tracer. Ki was thus determined using the Patlak graphical approach (Patlak et al., 1983) from the first 90 minutes of data: [Ki = K1k3/(k2 + k3)], where K1 and k2 are the clearance rate constants from plasma into tissue and from tissue into plasma, and k3 is the rate constant describing the trapping of brain 18F-fluorodopa. At times later than approximately 90 to 120 minutes after tracer injection, the data defined by the graphical analysis start to deviate from a straight line, indicating some degree of reversibility and thus loss of storage ability. This reversibility is considered primarily due to dopamine release and subsequent metabolism, either synaptic or cytoplasmic after dopamine reuptake in the presynaptic neuron. A reversible tracer approach model was thus applied to the data acquired between 150 to 240 minutes after injection to determine EDV (EDV is equivalent Ki/kloss, where the rate constant kloss quantifies the degree of tracer reversibility) (Sossi et al., 2001).
Although our previous work emphasized the turnover rather than the distribution volume concept, we recognized from the start that the two were equivalent, but reciprocal (Doudet et al., 1998). Therefore, from here on the terms effective distribution volume and effective dopamine turnover will be used interchangeably.
Data analysis
Radiotracer concentrations in caudate nucleus and putamen were estimated by averaging the values in the two caudate regions of interest and in the six putaminal regions of interest, and Ki and EDV were calculated from the resulting time courses. The values obtained were compared among the three groups. The progression of change in the EDV was further examined by calculating the ratio of the EDV value in caudate nucleus to that in putamen for each subject, and comparing these ratio values among the three groups.
Ki and EDV were also plotted as a function of disease duration and fitted with a function corresponding to the sum of an exponential and a constant term. This function has been shown to be most consistent with a biologic process (Fearnley and Lees, 1991). Only data from the PD patients were used to perform this fit. The fitted curves were extrapolated back in time until they reached the parameter values corresponding to the mean of the healthy control subject values. This time interval, calculated for each parameter and region separately, was considered to be the time of detectable onset of the specific disease-induced change, either decrease of dopamine synthesis and storage (Ki) or increase in turnover (EDV), in that particular region. A fractional parameter change was defined as the ratio between the parameter rate of change at any given time (calculated as the first derivative of the functional form used for the fit) and the value of the fitting function at the same time point. This fractional change was then plotted as a function of time after onset of disease-induced neurochemical changes (which is different for each variable and each region) and additionally as a function of time after symptom onset (which is the same for all variables and all regions). The first plot provides some insight into the initial time course of the fractional change and is highly dependent on the extrapolation method used to determine the preclinical period, whereas the second plot is more directly related to the observed data. It must be emphasized that the information obtained from this part of the study is strongly dependent on the validity of the model used to fit the data and on the assumption that the behavior of the relevant process during the time interval not observed (i.e., from onset of neurochemical changes to onset of clinical symptoms) is consistent with the fit obtained from the available data.
When performing the analysis of the PET data only plasma input function methods were selected to avoid disease-dependent biases introduced by the presence of the 18F-fluorodopa metabolite 3OMFD and to minimize the impact of a nonzero kloss value on the estimate of dopamine synthesis (Sossi et al., 2003).
Data are summarized as mean±SD unless otherwise stated. Only P values from two-tailed t-tests are reported.
RESULTS
Ki and EDV values
The Ki and EDV values averaged over the subjects of each group are shown in Table 1. There is no significant difference for either parameter for the caudate in the N-PD1 comparison, whereas both parameters show a significant difference in the putamen (Table 1). The difference is most significant in EDV, as previously observed (Sossi et al., 2002) and as expected from the analysis of the EDV and Ki values (see Materials and Methods). When comparing PD1 and PD2 all parameters are significantly different, with caudate EDV showing the most significant difference, followed by putamen Ki and EDV and caudate Ki.
Ki and effective distribution volume (EDV) values for the healthy group (N), mild Parkinson's disease (PD) patients (PD1), and more advanced PD patients (PD2)
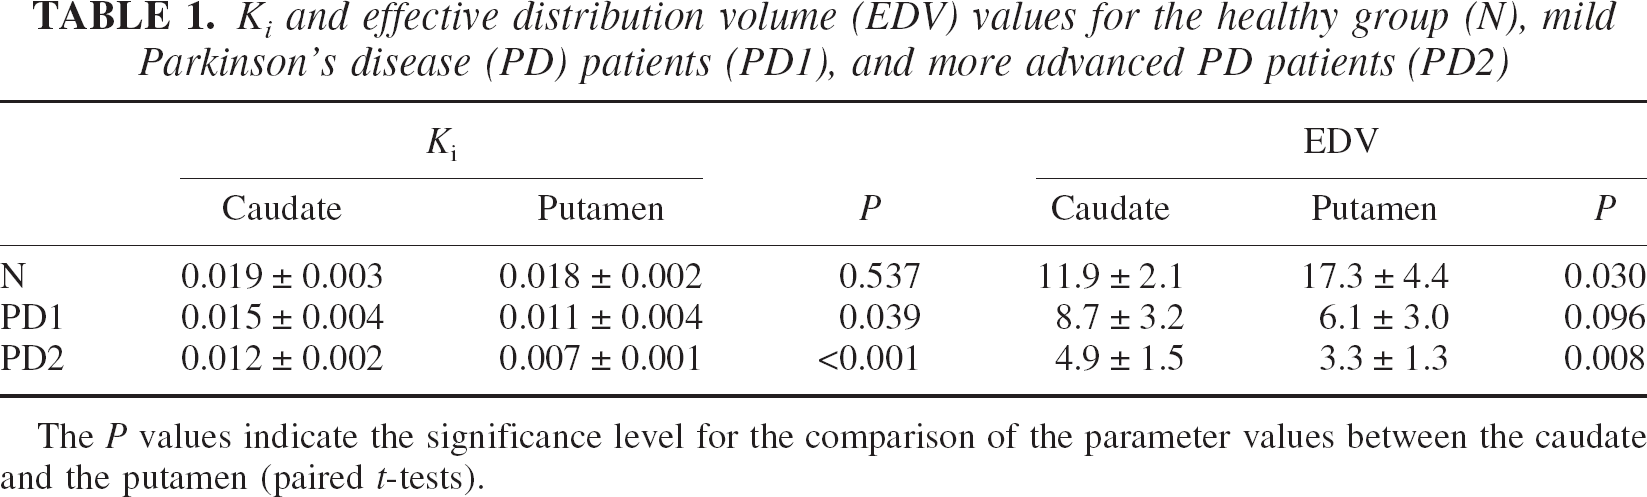
The P values indicate the significance level for the comparison of the parameter values between the caudate and the putamen (paired t-tests).
In the putamen Ki shows a similar degree of reduction comparing the progression from healthy patients (N) to PD1 and from PD1 to PD2 (Table 2). In contrast, EDV shows a larger reduction between N and PD1 for the putamen, compared with the reduction obtained between PD1 and PD2. A different behavior is observed for the caudate: here the reduction in EDV is greater between PD1 and PD2. Considering that the neuronal degeneration affects the nigral projection to the putamen earlier than that to the caudate, this finding indicates that the change in the EDV and consequently dopamine turnover is much greater than the change in Ki throughout the range of disease duration examined.
Reduction for each disease state compared with the previous one for each variable
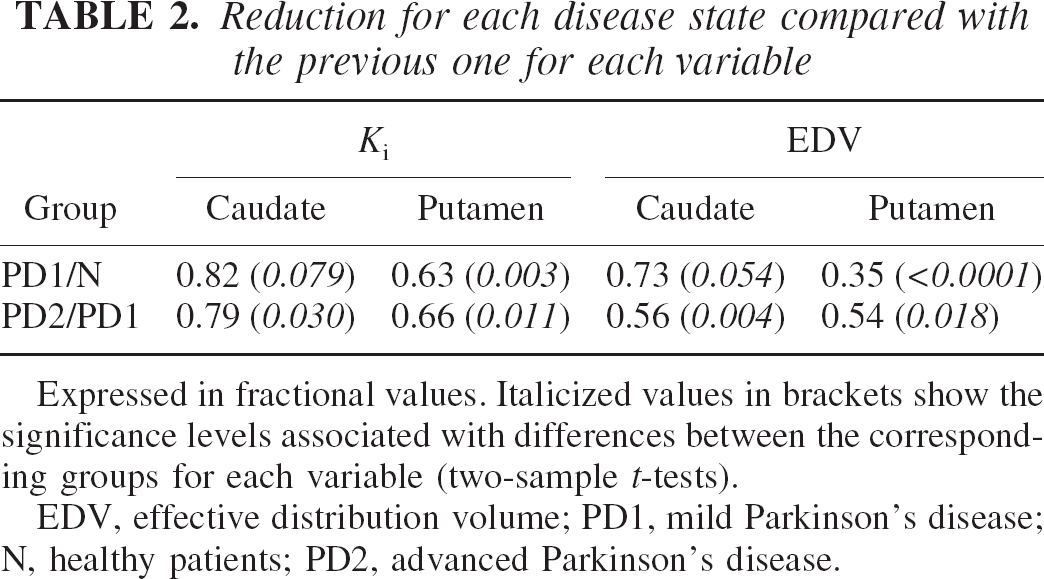
Expressed in fractional values. Italicized values in brackets show the significance levels associated with differences between the corresponding groups for each variable (two-sample t-tests). EDV, effective distribution volume; PD1, mild Parkinson's disease; N, healthy patients; PD2, advanced Parkinson's disease.
Comparison of the caudate/putamen ratio for EDV
The ratios of EDV in the caudate nucleus over that in putamen are presented as their equivalents, turnover in putamen over turnover in caudate nucleus (Fig. 1). There is a highly significant difference between the ratios in the N and PD1 group (P < 0.002), while there is no difference between the ratios obtained in the PD1 and PD2 groups. The ratio values in the N group are always smaller than 1, indicating that the EDV (effective dopamine turnover) is smaller (larger) in the caudate compared with the putamen. The situation is essentially reversed as soon as there is clinical manifestation of the disease, although it is reasonable to assume a smooth transition during the preclinical stages of the disease. This can be inferred from the significance levels of the difference in the parameter values between the caudate and putamen shown in Table 1. For the Ki there is no difference between caudate and putamen in the healthy subjects, as expected. The difference becomes significant (lower Ki values in the putamen) in PD1 and even more so in PD2. EDV shows a significant difference for the healthy group with the caudate showing the larger turnover. In the PD1 group there is an almost significant difference, but now the turnover is greater in the putamen. This difference becomes highly significant in PD2.
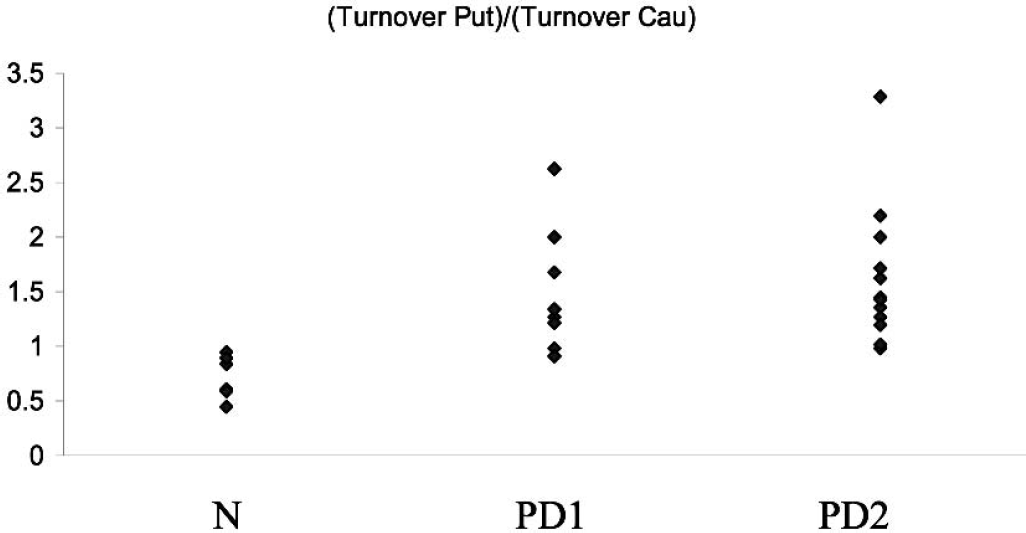
Ratio between the putamen turnover and the caudate turnover for the three groups investigated: healthy subjects (N), early PD patients (PD1), and more affected PD subjects (PD2).
Turnover change as a function of disease progression
The fits to the data are shown in Fig. 2. The P values for the goodness-of-fit tests were P = 0.19 for Ki caudate, P = 0.67 for EDV caudate, P = 0.09 for Ki putamen and P = 0.15 for EDV putamen. These nonsignificant P values obtained from the goodness-of-fit test indicated that the curves provided adequate fits to the data. Extrapolation of the parameter value to the healthy control group mean values indicated that disease-related changes started 8.5 years before the onset of clinical symptoms for EDV putamen, 4 years before for Ki putamen, and 1 year before for EDV and Ki caudate. For Ki these values agree very well with previously published values (Morrish et al., 1998). The times for EDV have not been previously estimated; however, they are in general agreement with those obtained for Ki, with the putamen showing an earlier onset of disease induced changes in dopamine turnover. Figure 3 shows the fractional change as a function of time after neurochemical onset of disease. Changes in EDV appear higher than changes in Ki throughout the investigated range of disease progression, indicating that there is a relatively large increase in dopamine turnover compared with the decrease in dopamine synthesis and storage. The changes are always higher in the putamen, as expected from the topologic pattern of PD pathology. Figure 4 shows the same fractional changes as a function of time after symptom onset. For Ki the fractional changes continue to be greater in the putamen, whereas for EDV fractional changes are similar for caudate and putamen.
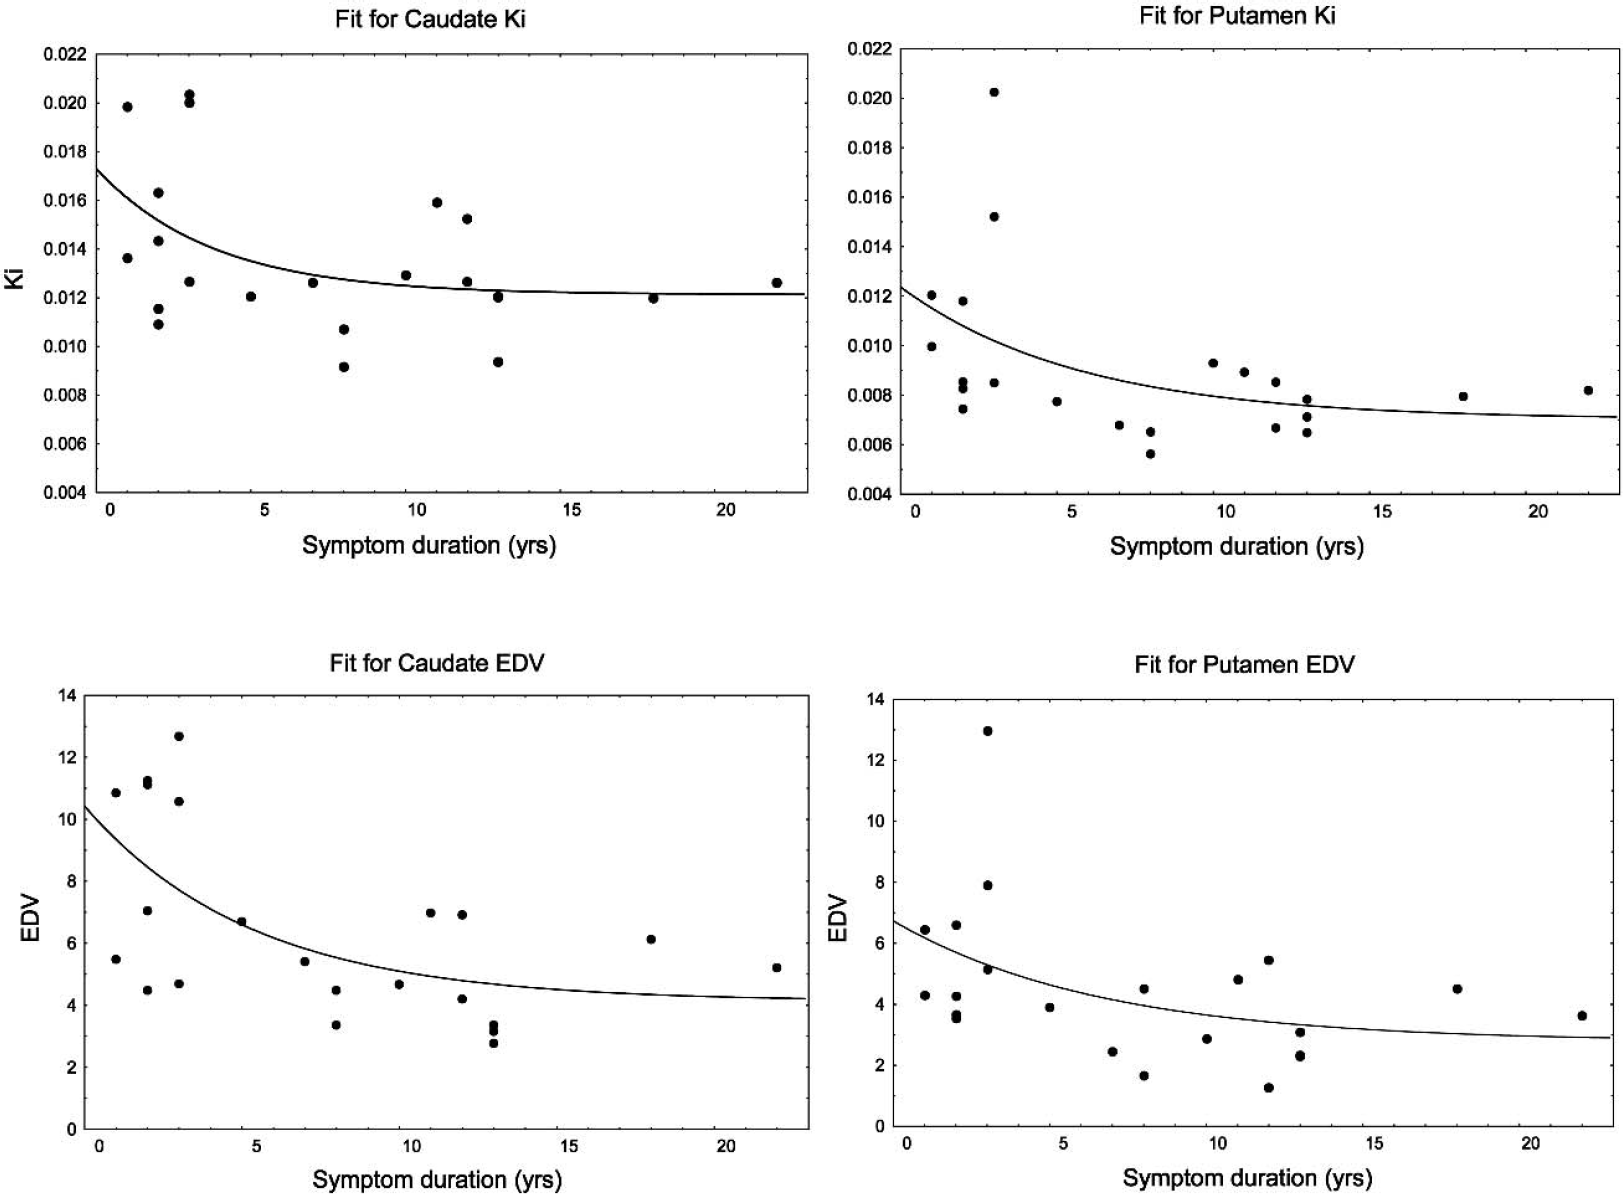
Ki and EDV values presented as a function of symptom duration for the caudate and putamen. The solid line shows the fit to the data.
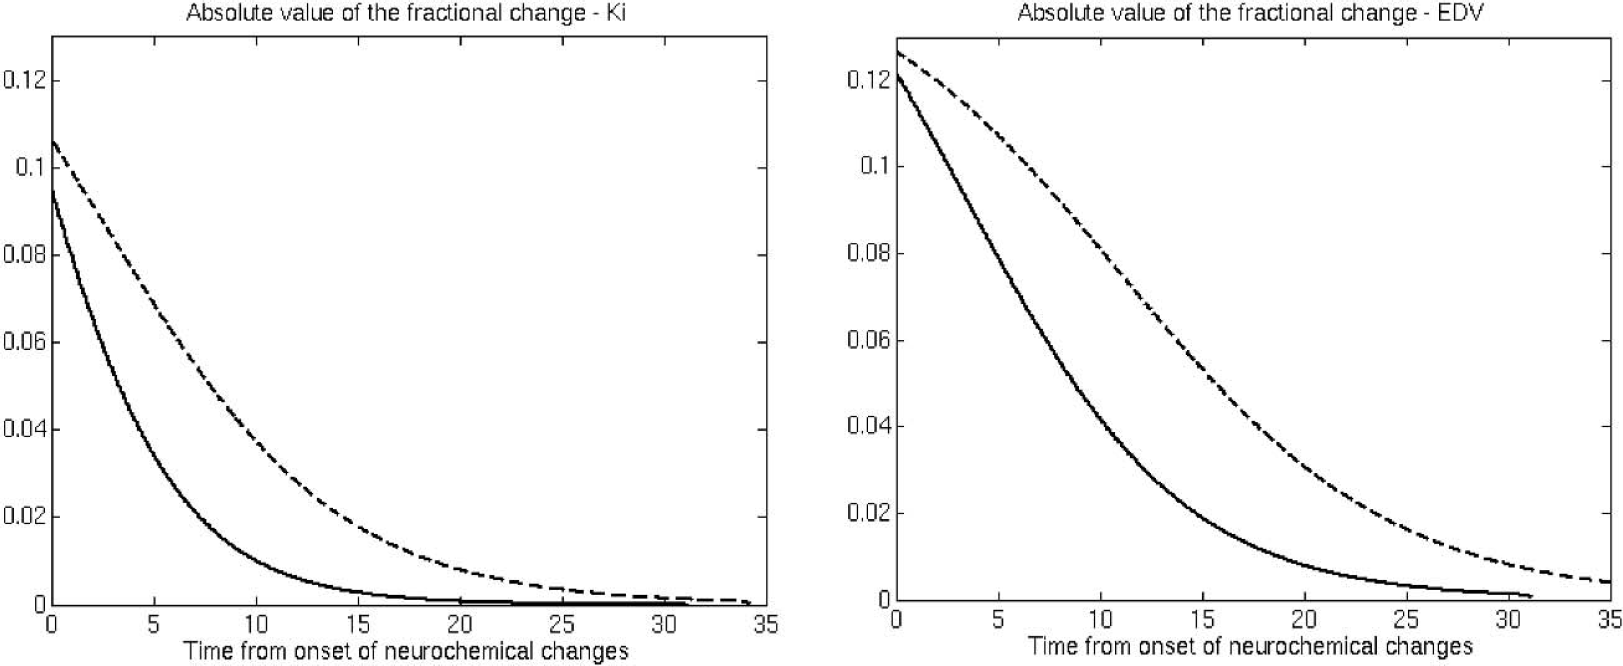
Magnitude (absolute value) of the fractional change for Ki and EDV (see text). Dashed line, putamen; solid line, caudate. The horizontal axis represents the time from the estimated onset of disease-induced neurochemical changes for that region.
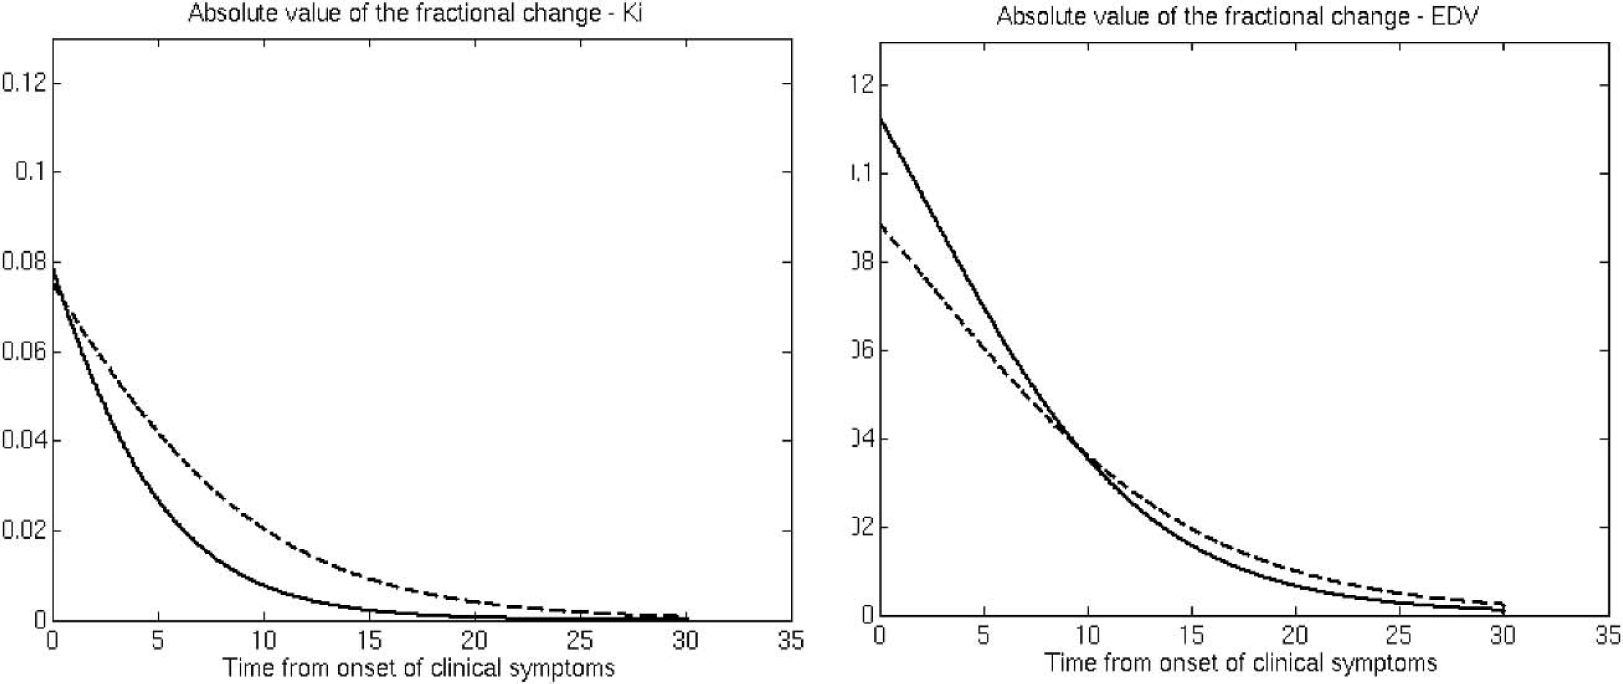
Magnitude (absolute value) of the fractional change for Ki and EDV (see text). Dashed line, putamen; solid line, caudate. The horizontal axis represents the time from onset of clinical symptoms.
DISCUSSION
This is the first study in which changes in dopamine synthesis (Ki) as well as those in dopamine turnover (EDV) have been estimated in vivo by PET within the same subject population as a function of PD progression. For each subject, both PET measurements (Ki and EDV) were made on the same day, during the same scanning session. Therefore, any between-subject variability in disease duration due to the use of the self-reporting of symptom onset will be common to both measures, and thus differences between the measures with respect to time (i.e., PD progression) must be valid. The same argument can be applied to address the issue of this study following a cross-sectional as opposed to a longitudinal design—any possible bias in the patient selection affects both measures and therefore a comparison between the two should still be valid. The methodological issue of a possible interaction between the determination of EDV and Ki should also be addressed. It has been shown that a nonzero value of kloss introduces a downward bias in the Ki estimate (Sossi et al., 2003). A correction for such bias, if possible, would increase the difference between the magnitude of change in Ki and EDV because patients with more advanced disease are expected to have a higher kloss value, thus a larger downward bias in the Ki estimate. In contrast, we would not expect EDV to be affected by a similar bias because it was determined from the data directly and not as a ratio between Ki and kloss.
We found that changes in dopamine turnover precede changes in dopamine synthesis in the putamen, confirming our earlier results. Here, we extended the study to include patients with more severe disease and a comparison between the caudate and the putamen. Considering that the dopaminergic deficit affects the putamen earlier than it does the caudate, these results show not only that changes in dopamine turnover are larger than changes in dopamine synthesis, but also that changes in dopamine turnover are greater in the initial stage of disease (which occurs at different times for the caudate and putamen). This suggests that increased dopamine turnover could be an effective compensatory mechanism, primarily in the preclinical stages of PD. Further, using two different approaches of data analysis (see below), we found that the decline in dopamine synthesis occurs closer in time to PD symptom onset. This later and relatively smaller decline of Ki compared with the effective turnover is evidence of dopamine synthesis upregulation, in keeping with existing data (Lee et al., 2000). The manifestation of clinical symptoms is then likely related to the failure of this additional compensatory mechanism. Taken together, our results suggest that clinical onset of PD reflects a global failure of compensatory mechanisms in the dopamine system that occur in response to PD pathology.
It is also possible to speculate that the increase in dopamine turnover, as observed, might be due to two different effects: a very rapid increase in early disease that has an effective compensatory role, and a slower increase later in the disease that reflects mostly tracer egress due to neuronal loss and consequent reduction of dopamine storage capacity. This gradual loss of compensatory ability could be supported by the observation that Ki and EDV change to a comparable degree between PD1 and PD2 in the putamen (PD2 = 66%, P = 0.011 and 54%, P = 0.018 of PD1, respectively, see Table 2), whereas between N and PD1 the corresponding figures are 63% (P = 0.003) for Ki, but only 35% (P < 0.0001) for EDV.
In the normal population, the effective dopamine turnover is significantly higher in the caudate, whereas as soon as clinical manifestations of the disease appear, dopamine turnover becomes higher in the putamen, which is the most affected region. Even the four untreated early patients showed a higher turnover in the putamen, implying that the reversal is not a consequence of treatment, but a real disease-induced functional change. (Only two patients showed a ratio smaller that 1; one was 0.98, which was outside the normal range, and the other was 0.91, which falls in the upper part of the normal range.) This situation seems to remain unchanged even for more severe disease, showing that the turnover in the putamen still remains higher compared to that of the caudate.
These results are in keeping with postmortem neurochemical studies (Kish et al., 1988). Using the molar ratio between homovanillic acid and dopamine as an index of dopamine turnover, these studies have shown that, in the 45 to 65 years age range, dopamine turnover is slightly higher in the caudate nucleus. The reverse pattern is observed in PD (Kish et al., 1992, 1988). Such agreement was considered a further validation of this in vivo measurement of the effective dopamine turnover.
Additional information can be obtained from the study of the fractional change as a function of disease duration. This information is model dependent and should therefore be interpreted with some caution. However, we have attempted to use an additional functional form with biologic meaning when performing the fit: the inverse of the sum of the exponential function and a constant term. Data analysis using the latter approach leads to conclusions very similar to those obtained with the chosen fitting function (i.e., exponential function plus constant) with a slightly shorter estimate of the preclinical stage (6 years for EDV putamen, 3 years for Ki putamen, and 0.5 years for EDV and Ki caudate) and very similar time courses of the fractional change. It should also be noted that in the case of the caudate nucleus, essentially no extrapolation is required, because the onset of the neurochemical changes as estimated by PET virtually coincides with the onset of clinical symptoms. This is consistent with the fact that no significant differences in the Ki and EDV values were observed between N and PD1.
Our mathematical modeling allowed us to provide a tentative estimate of the preclinical period of PD. In the putamen, changes in effective dopamine turnover precede changes in dopamine synthesis. It should be noted, however, that the later decline in Ki most likely reflects the eventual failure of compensatory mechanisms to maintain normal function. Thus, for example, there is evidence that the dopamine enzymatic machinery, particularly dopa-decarboxylation, is upregulated in PD (Agid et al., 1987). These compensatory mechanisms may be present, but partially undetected by conventional 18F-fluorodopa PET (e.g., Ki), since the start of the neurodegenerative process. Indeed, there is evidence that Ki may not be a particularly sensitive tool for preclinical detection in familial parkinsonism (Kishore et al., 1996; Piccini et al., 1999). The present study also shows that the fractional changes in turnover exceed the changes in dopamine synthesis at all stages of the disease.
CONCLUSION
We have for the first time investigated changes in the effective dopamine turnover as a function of disease duration and compared them with the changes in dopamine synthesis and storage rate. The changes in effective dopamine turnover were found to be greater in early disease for both the caudate and the putamen, indicating that an increase in dopamine turnover might be an effective compensatory mechanism in the early stages of the disease only and might contribute to the delayed onset of clinical symptoms compared with the onset of disease-induced neurochemical changes. In addition, we found that PD pathology alters the normal striatal pattern of dopamine turnover. EDV is higher in the caudate nucleus than in the putamen in normal controls, whereas PD patients exhibit the reversed pattern. Changes in Ki are consistently smaller than changes in the EDV, likely related to upregulation of dopamine synthesis in the surviving terminals in response to disease. For both processes, changes in the putamen precede symptom onset substantially (by about 8 years for EDV, and by 4 years for Ki). These results suggest that clinical onset of PD reflects a global failure of the dopaminergic compensatory mechanisms that occur in response to the underlying pathology.
The method presented here for assessment of dopamine turnover was found to yield data that are consistent with postmortem studies. It could thus be used in the future to provide some insight into the pathogenesis of the “wearing-off” phenomenon often associated with levodopa treatment in PD, in light of the current evidence (de la Fuente-Fernández et al., 2001) that increased dopamine turnover might have a role in the pathogenesis of this still poorly understood motor complication.
Footnotes
Acknowledgments:
The authors thank Caroline Williams, Carolyn English, and Jessamyn McKenzie for patient scanning, the TRIUMF PET chemistry group for radiotracer production and delivery, J. Haba for image analysis, and E. Mak for help with the data analysis.