
Abstract
Changes in dopamine turnover resulting from disease states such as Parkinson's disease may be reflected in corresponding changes in the kinetics of the positron emission tomographic tracer [18F]fluorodopa. The authors had previously refined the conventional irreversible-tracer graphical approach to determine both the uptake rate constant Ki and the rate constant kloss that describes the slow loss of the trapped kinetic component. Because these parameters change in the opposite sense with disease, their ratios may be more powerfully discriminating than either one alone. The ratio kloss/Ki is indicative of effective dopamine turnover. Its inverse, Ki/kloss, can be interpreted as the effective distribution volume (EDV) of the specific uptake compartment referred to the fluorodopa concentration in plasma. Here the authors present a new approach to the estimation of EDV based on reversible-tracer graphical methods. When implemented with a plasma input function, the method evaluates EDV directly. When implemented with a tissue input function, the outcome is proportional to the ratio of the distribution volumes of the specific uptake and precursor compartments. Comparison of the new and previous approaches strongly validates this alternative approach to the study of effective dopamine turnover.
The role of the positron emission tomographic tracer [18F]fluorodopa (FD) in the assessment of the integrity of the dopaminergic system has been firmly established (Brooks et al., 1990; Garnett et al., 1983). FD is transported across the blood–brain barrier by means of the large neutral amino acid system. It is subsequently decarboxylated by dopa decarboxylase into [18F]fluorodopamine, which is then trapped in the presynaptic vesicles and/or further metabolized into 1–3,4-dihydroxy-6-[18F]fluorophenylacetic acid and [18F]6-fluorohomovanillic acid, which are capable of leaving the brain. FD in plasma and brain is also metabolized by catechol-O-methyl-transferase into 3-O-methyl-[18F]fluoro-DOPA, which crosses the blood–brain barrier by the same large neutral amino acid system. The accumulation of [18F]fluorodopamine in the synaptic vesicles is responsible for most of the striatal radioactivity for the first 90 to 120 minutes after FD administration because [18F]fluorodopamine, like dopamine, cannot cross the blood-brain barrier. During this time, FD thus appears as an irreversibly bound tracer.
This apparent irreversibility is the basis of the graphical approach to the evaluation of FD uptake developed by Patlak et al. (1983) and further refined by Martin et al. (1989). The basic principle of this method is that accumulation of the tracer into an irreversible compartment can be reliably identified even if the intermediate reversible components of the tracer kinetics are not fully identified or known. If steady state between compartments is reached and if an irreversible compartment exists, a linear relationship is obtained between the ratio of the specific compartment and plasma radioactivity and the ratio between the running integral and the instantaneous value of the plasma radioactivity (stretch time). The slope of the straight line yields the FD uptake rate constant Ki (Ki = K1k3/(k2 + k3), where K1 and k2 are the clearance rates from plasma into tissue and from tissue into plasma and k3 is the rate constant describing the trapping of brain FD. Although Ki does not provide separate information about tracer transport, decarboxylation, and storage, it has been proven to discriminate between health and disease states (Ishikawa et al., 1996; Morrish et al., 1998; Vingerhoets et al., 1996).
The graphical approach has also been extended to include a tissue input function (Patlak and Blasberg, 1985). The time activity course of a region essentially devoid of trapping, typically the occipital cortex or the cerebellum, is used as input. In this case the slope of the straight line (Kocc) is equal to k2k3/(k2 + k3). An added complication with this approach is the presence of 3-O-methyl-[18F]fluoro-DOPA in the reference region, which artificially increases the input function and therefore biases the Kocc toward smaller values. Nevertheless, this method correlates well with the plasma input approach (Takikawa et al., 1994) and is commonly used. It presents two significant advantages over the plasma input method: it simplifies the scanning procedure, because no blood samples need to be taken, and it eliminates the noise caused by the plasma radioactivity measurement (Morrish et al., 1998; Vingerhoets et al., 1994, 1996). Such noise may be even more relevant in these studies compared with those examined in the above references, because in this case the scans are extended to 4 hours after injection: at that time, the FD fraction in the plasma is only approximately 2%, and consequently a small measurement error can cause a large variation in the FD fraction estimate, and significant physical radiotracer decay has occurred, thus decreasing the statistical accuracy of the radioactivity measurement.
Although FD shows an apparently irreversible behavior for the first 90 to 120 minutes after administration in normal subjects, the data obtained from the conventional graphical analysis at later times start to deviate from a straight line, exhibiting a progressively decreasing slope. Such a trend is indicative of the slow loss of radioactivity from the trapping compartment as a result of [18F]fluorodopamine metabolism by catechol-O-methyltransferase and monoamine oxidase and diffusion of the metabolites out of the brain. An extension of the standard graphical approach was developed to quantify this reversibility of the trapping compartment, described by the rate constant kloss (Doudet et al., 1998; Holden at al., 1997). The rate constant kloss is a measure of the frequency of turnover of the trapped tracer component, and its inverse represents the mean dwell time of that component in brain tissue. The ratio kloss/Ki is a powerfully discriminating indicator of the turnover of the trapped FD compartment (effective dopamine turnover [EDT]). Its inverse Ki/kloss can be interpreted as an effective distribution volume (EDV) of the specific compartment alone with respect to the plasma tracer concentration and is a similarly discriminating measure of the ability of the trapping mechanism to store tracer. In Parkinson's disease, a disease characterized by a progressive loss of nigrostriatal dopamine terminals in the striatum, the rate of FD uptake decreases and the rate of loss increases. Thus, both EDT and its inverse EDV, because they are ratios of these rate constants, are sensitive markers of disease severity and progression. Nonhuman primate studies examining animals with varying degrees of 1-methyl-4-phenyl-1,2,3,6-tetrahydropyridine (MPTP)-induced Parkinsonism have shown the EDT to be a more sensitive marker of disease state than Ki or kloss alone (Doudet et al., 1998). The EDT, or its inverse EDV, may thus be useful in characterizing and staging disease states where an increased [18F]fluorodopamine turnover is expected as a result of loss of storage ability. They might also prove useful in understanding and quantifying different manifestations of therapy responses, such as treatment-induced motor fluctuations in Parkinson's disease.
Although this modified graphical approach has been shown to be reliable and robust in a variety of circumstances, it sometimes fails to converge to a valid solution when the rate constant kloss is high. Given the demonstrated and potential further relevance of the EDV and EDT concepts, we present a new method for their estimation that can be implemented using either plasma or tissue input functions. A brief description of the original method and the derivation and validation of the new methods are presented.
MATERIALS AND METHODS
Modeling methods
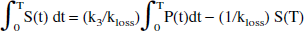
The original method (Holden et al., 1997) is based on the idea of restoring the apparent irreversible behavior of the tracer by altering the stretch time present in the graphical analysis with the introduction of a kloss term:

where S(t) is the specific tracer concentration in the target region, Cp is the tracer concentration in the plasma, and Ki is the FD uptake rate constant. The specific tracer concentration is obtained after subtracting the radioactivity measured in a region of interest placed on the occipital cortex from the radioactivity measured in a region of interest placed on the striatal region. The specific tracer concentration is thus determined under the assumption that the same 3-O-methyl-[18F]fluoro-DOPA concentration is present in the two regions (Martin et al., 1989). The effect of kloss is to reduce the values of the abscissa, with the largest values undergoing the largest reduction—that is, to shrink the stretch time and to restore the straight-line behavior of the data. The rate constant kloss is generally identified from data obtained between 30 and 240 minutes after tracer injection. EDT is then estimated as the ratio between kloss and the uptake rate constant Ki obtained from the data acquired during the first 90 to 120 minutes after tracer injection.
In the new method, the deviation of the data from the straight line in the Patlak approach can also be interpreted as an indication of tracer reversibility. Thus, instead of determining kloss by trying to restore irreversibility into the tracer kinetics, a reversible tracer model, similar to the one developed by Logan et al. (1990), can be applied to the data. We have developed such a model, which allows for both a plasma and a tissue input function.
Reversible plasma input approach
For the sake of simplicity, the following derivation is specific to the standard two-tissue compartment model (Fig. 1), in which the precursor time course P(t) and the specifically trapped component S(t) are both single compartments:
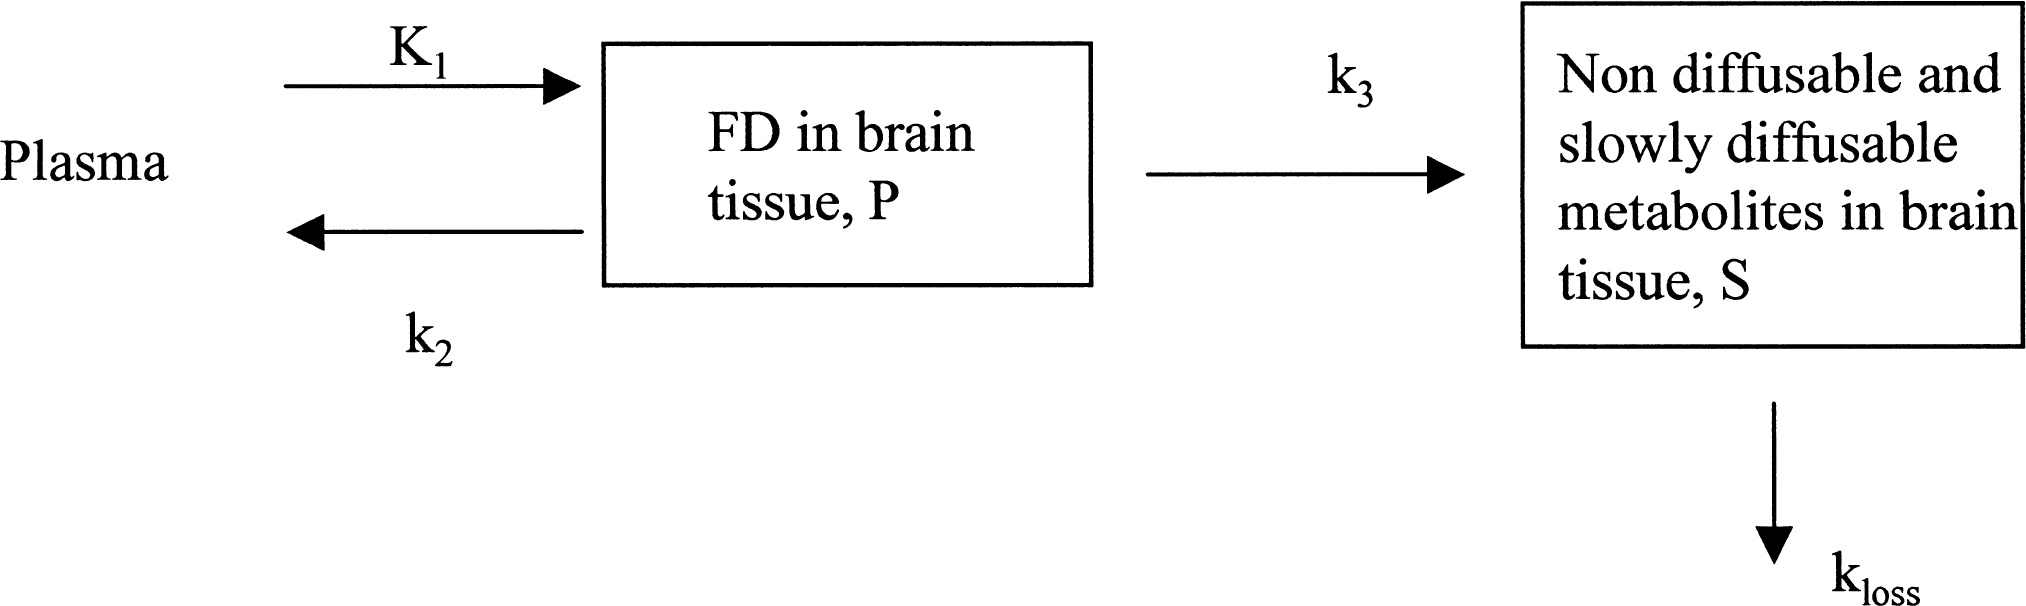
Model describing [18F]fluorodopa kinetics, including the reversibility of the trapping compartment.


As above, S(t) is obtained from the radioactivity determined in a region of interest placed on the striatum after subtraction of the radioactivity present in a region of interest placed on the occipital cortex. This subtraction thus identifies S(t) under two assumptions: 3-O-methyl-[18F]fluoro-DOPA is present in the same concentration in the two regions as mentioned earlier, and the error introduced by the assumption that the precursor concentration P(t) (free FD) is the same in the two regions is small compared with the concentration of the specific striatal activity. The precursor time course P(t) is not directly observable, but this is not required by the method.
Integration of Eqs. 2 and 3 and rearranging coefficients yields

Substituting Eq. 4 into Eq. 5 yields:
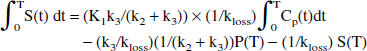
The time dependence of the two last terms is eliminated by dividing all terms by S(T):
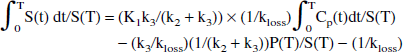
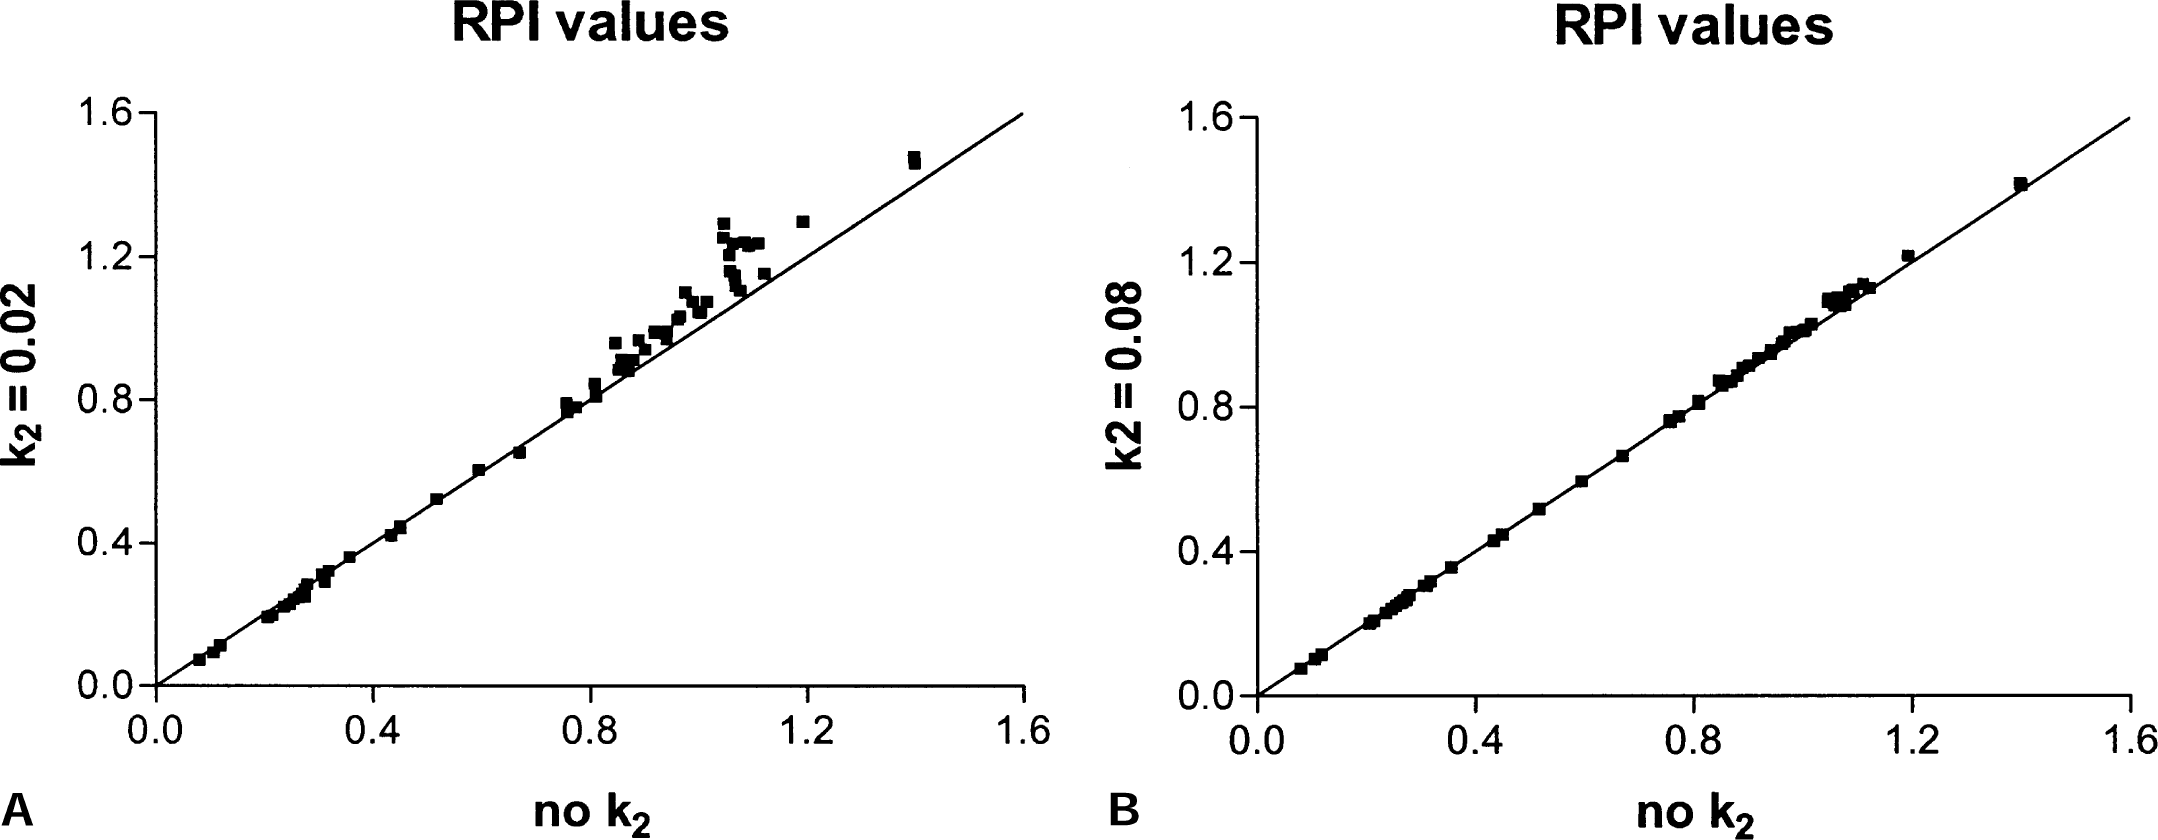
The next-to-last term on the right side of Eq. 7 becomes a constant when a steady state between the precursor and the specific pools is reached. In this case, a plot of ∫0T S(t) dt/ S(T) vs. ∫0T Cp(t)dt / S(T) yields a straight-line relationship with a slope of (K1k3/(k2 + k3)) × (1/kloss) = Ki/kloss = EDV = 1/EDT—that is, the slope of the line is found to be the same combination of the rate constants that determines the effective distribution volume in the original approach.
Reversible tissue input approach
A similar approach can also be used to derive the expression in the case of a reference tissue driving function. Again, the simplified model in Fig. 1 is assumed. An equation similar to Eq. 7 can be derived for a reference region devoid of the specific process (Logan et al., 1996):

where P′(t) is the tracer time course in the reference region and K1′ and k2′ are transfer constants related to that region. Rearranging Eq. 8 to isolate ∫0T Cp(t)dt, substituting this into Eq. 7, and grouping the constant terms into the intercept term (int) yields:
Using the assumption K1′/k2′ = K1/k2 (Kuwabara et al., 1993), the coefficient of the first term (graphical slope) can be expressed as:

where Kocc is the standard graphical uptake rate constant obtained with the tissue input method. This ratio, defined here as the effective distribution volume ratio (EDVR), is the ratio of the distribution volumes of the specific and precursor compartments, reduced by the factor k2/(k2 + k3). Just as in the case of the determination of Kocc, the values of the EDVR determined by this graphical approach are affected by the presence of 3-O-methyl-[18F]fluoro-DOPA in the reference region. Thus, in analogy with Kocc (Brooks et al., 1990), empirical evidence is required to validate the use of the EDVR. Further, Eq. 9 includes the reference region efflux constant k2′ in the expression used to calculate the values of the graphical abscissa. For this to be a truly bloodless method, a population-derived k2′ value must be usable, or the term containing k2′ must be of negligible importance.
Model validation
For the reversible method to be applicable to FD kinetics, data obtained using Eqs. 7 and 9 must follow a straight line sometime during the extent of the study (linearity). For the method to perform reliably, the value of the slope must not be overly sensitive to the exact starting and ending point of the fitted time range (effect of time range). Because the original method has already been validated (Doudet et al., 1998), it can be used as reference in the validation of the newly proposed reversible approaches. Therefore, numeric values similar to those produced by the original method must be obtained with the reversible plasma input method and proportional values must be produced by the reversible tissue input method. The methods must be equally able to distinguish various disease states (comparison to the original method). In the case of the tissue input function, the method must not be overly sensitive to the k2′ value, because either a population k2′ value or no k2′ term must be used (effect of k2′).
To investigate these issues, both reversible methods were tested on a study involving nonhuman primate data that explored the sensitivity of EDT to disease severity (Doudet et al., 1998). In addition, the reversible plasma input method was tested with a second nonhuman primate study that investigated the effect of pharmacologic interventions on EDT (Doudet et al., 1997).
In set 1, dopamine turnover as a function of disease severity, 32 rhesus and cynomolgus monkeys were studied. Sixteen were normal controls, eight had bilateral lesions of the dopamine nigrostriatal pathway induced by MPTP, and the remaining eight had unilateral lesions. The data derived from these subjects were sorted into four groups: normals (16 normal control monkeys); an exposed but asymptomatic group containing data from the contralateral striata of the monkeys receiving MPTP by unilateral carotid injection (n = 9); an asymptomatic injected group containing data from the affected striata of animals not showing Parkinsonism (n = 8); and a symptomatic group containing data from the bilaterally lesioned animals and from the affected striata of the five unilaterally lesioned animals displaying bradykinesia or hypokinesia and rigidity on the contralateral body side (n = 9). Three to 5 mCi was injected as a bolus. The scanning sequence consisted of six 30-second scans, two 1-minute scans, and one 5-minute scan, followed by a succession of 10-minute scans for a total duration of 200 minutes (with an interval between 120 and 140 minutes). Data were acquired on a CTI/Siemens ECAT953B (Knoxville, TN, U.S.A.). Arterial blood samples were drawn throughout the study and 11 samples were analyzed for metabolites. Regions of interest were placed over the left and right striata on four consecutive slices and 12 regions of interest were placed over an area of nonspecific 18F accumulation in the occipital cortex on two consecutive slices. A detailed study description can be found in Doudet et al. (1998).
In set 2, dopamine turnover as a function of intervention, normal juvenile cynomolgus monkeys were studied. Five animals were studied without pharmacologic intervention, seven after pretreatment with nitecapone (a peripheral catechol-O-methyl-transferase inhibitor), seven after pretreatment with tolcapone (a catechol-O-methyl-transferase inhibitor that also crosses the blood–brain barrier), six after pretreatment with the monoamine oxidase inhibitor deprenyl, and five with a combination of tolcapone and deprenyl. Twenty-four 10-minute frames were acquired after injection of a 5-mCi bolus of FD. Data were acquired on the University of British Columbia/ TRIUMF PETTVI. Arterial samples were acquired throughout the duration of the study and five were analyzed for metabolites. Data were analyzed similarly as for set 1. A detailed study description can be found in Doudet et al. (1997).
RESULTS AND DISCUSSION
Set 1
A linear portion of the graph was found in all cases both for the plasma and tissue input functions, generally between 70 and 200 minutes after injection (Fig. 2). Neither the reversible plasma nor the reversible tissue input method was found to be greatly sensitive to the starting or ending time points of the data used for the fit within the time range of roughly 70 to 200 minutes after injection. Excellent correlations were found between values calculated with the starting points between 60 and 80 minutes after tracer injection and ending points between 180 and 200 minutes. An example is shown in Fig. 3.
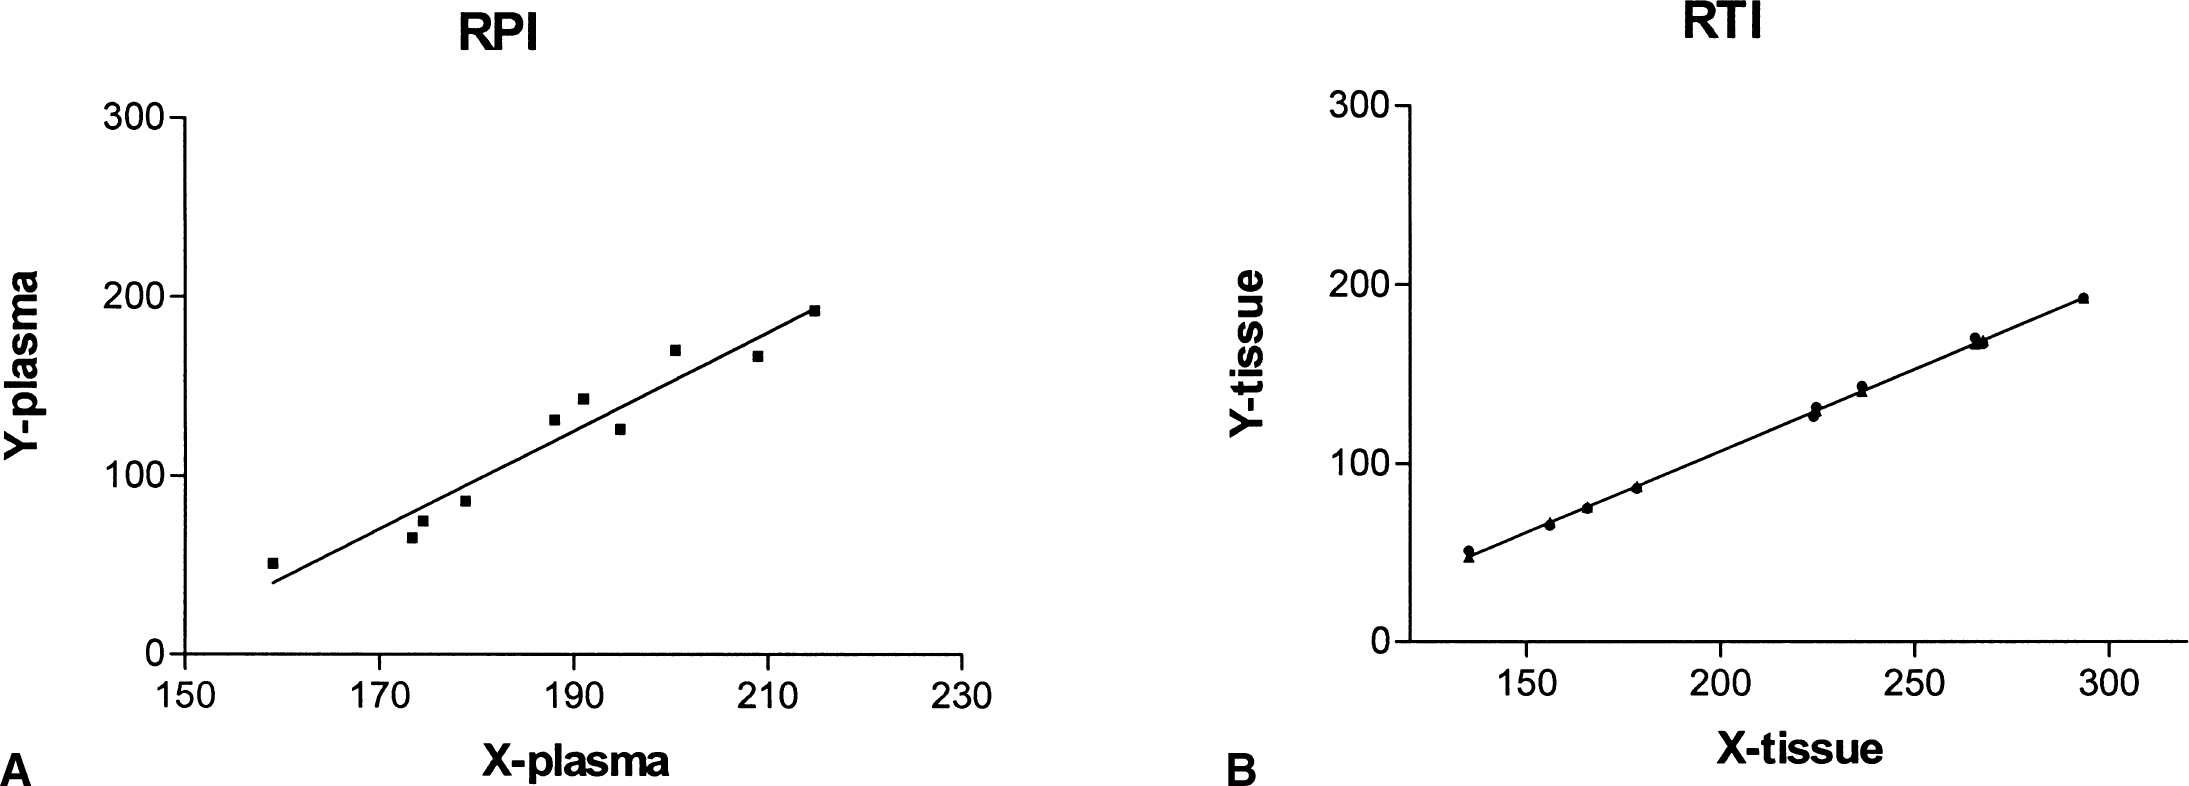
Example of the plot obtained using the reversible tracer approach for plasma input (RPI,
Example of the effective dopamine turnover calculated using data extending over two different time ranges.
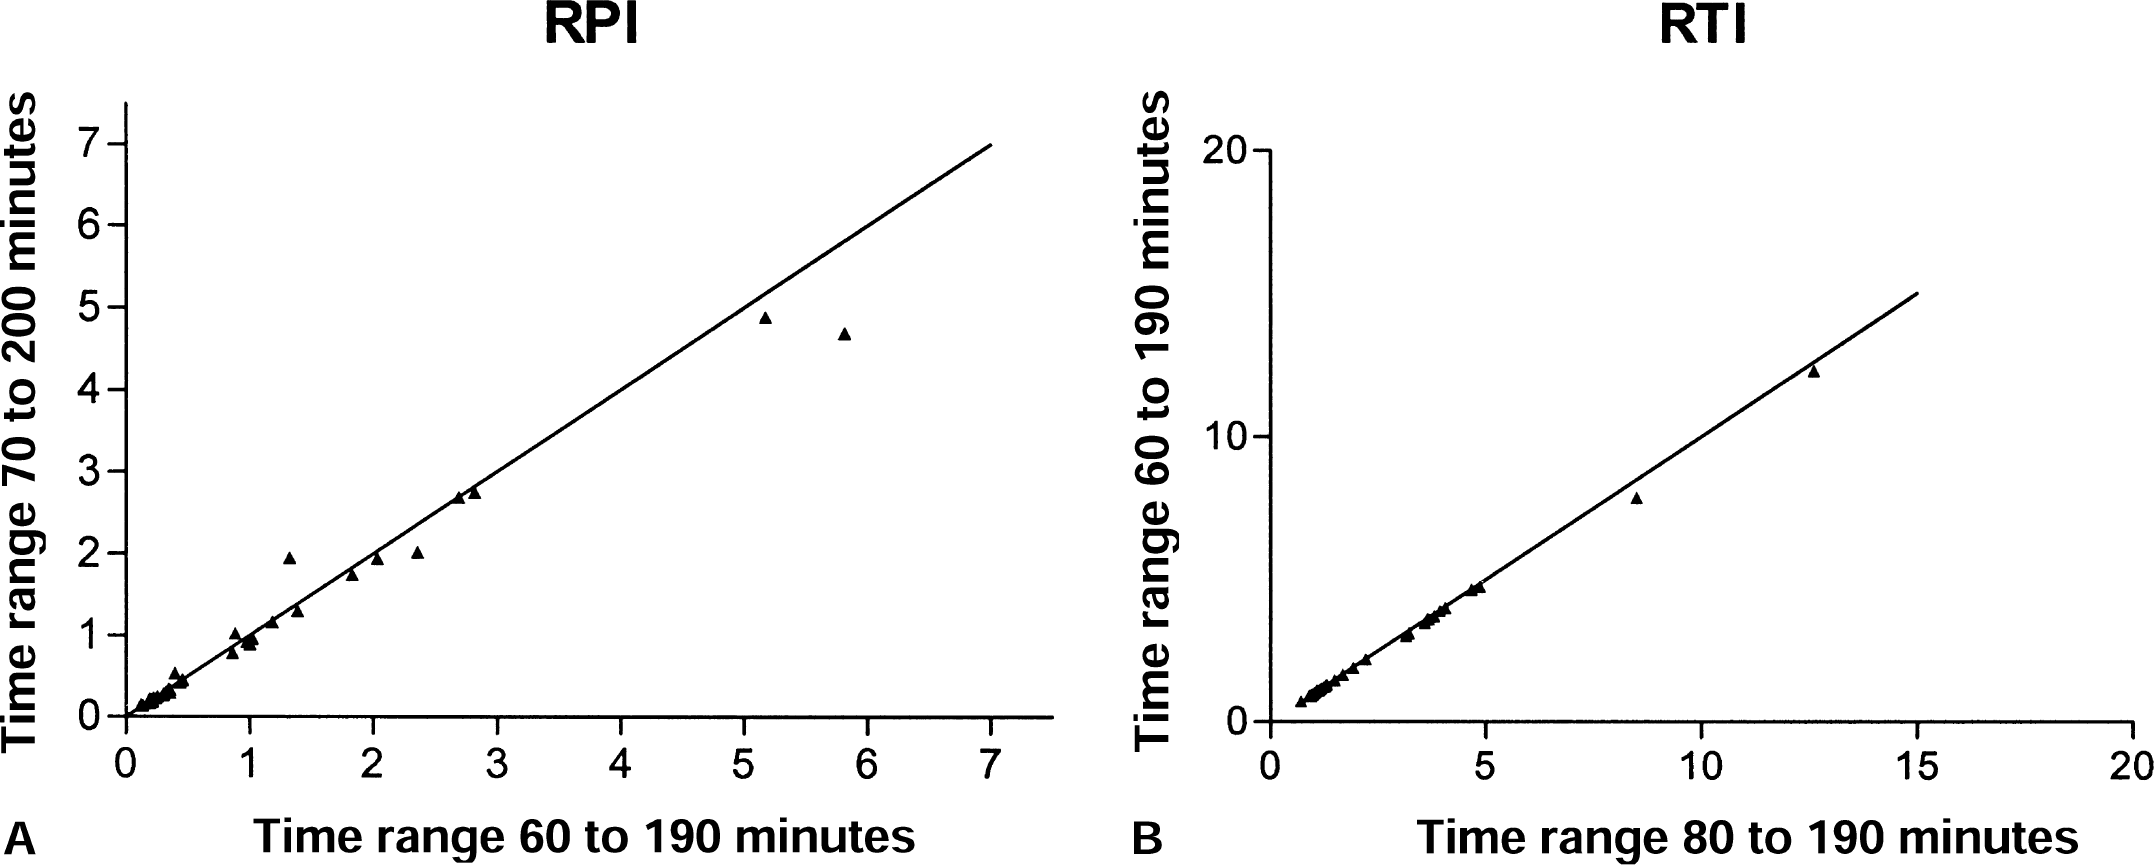
The sensitivity of the EDVR to the value of k2′ was investigated by performing the whole analysis for three different k2′ values (0.02, 0.05, and 0.08 min-1), as well as with no k2′ term. Minimal differences were observed in the EDVR values obtained with any k2′ value (Fig. 4). Even when k2′ was as low as 0.02, only a small bias was observed when comparing the results with those obtained without the k2′-dependent term in the abscissa. With a k2′ of 0.08, the bias was truly negligible. Because the values tested were centered over the range of values suggested in the literature (Cumming and Gjedde, 1998; Huang et al., 1991; Kuwabara et al., 1993), we chose to ignore the term containing k2′ in our implementation of the reversible plasma input method.
Comparison of the effective dopamine turnover ratio values obtained without the term containing k2N and k2N = 0.02 and without the k2N term and k2N = 0.08.
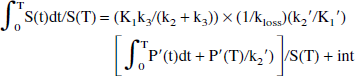
Good numeric agreement was found between the values obtained with the original method and the reversible plasma model. Table 1 shows mean EDT values, standard deviations, and fractional standard deviations for the four groups for each method. The fractional standard deviation for the normal and the exposed group was smallest for the reversible tissue input method. This likely reflects the fact that in this approach, there is no additional contribution from the plasma FD radioactivity measurement to the overall noise. The reversible method shows a larger spread in the EDT values obtained for the symptomatic and asymptomatic groups. Because these groups are expected to be heterogeneous, no simple conclusion can be drawn from this comparison.
Turnover measures in four groups of monkeys with varying degrees of MPTP-induced Parkinsonism obtained from each method
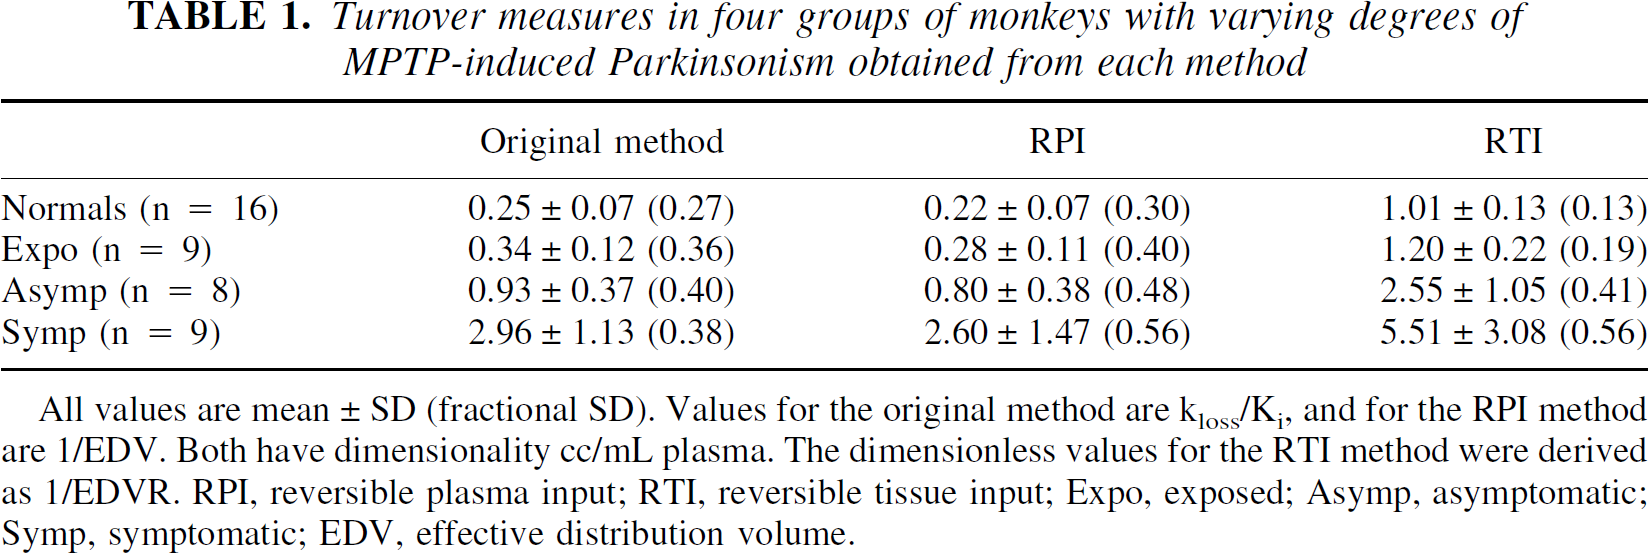
All values are mean ± SD (fractional SD). Values for the original method are kloss/Ki, and for the RPI method are 1/EDV. Both have dimensionality cc/mL plasma. The dimensionless values for the RTI method were derived as 1/EDVR. RPI, reversible plasma input; RTI, reversible tissue input; Expo, exposed; Asymp, asymptomatic; Symp, symptomatic; EDV, effective distribution volume.
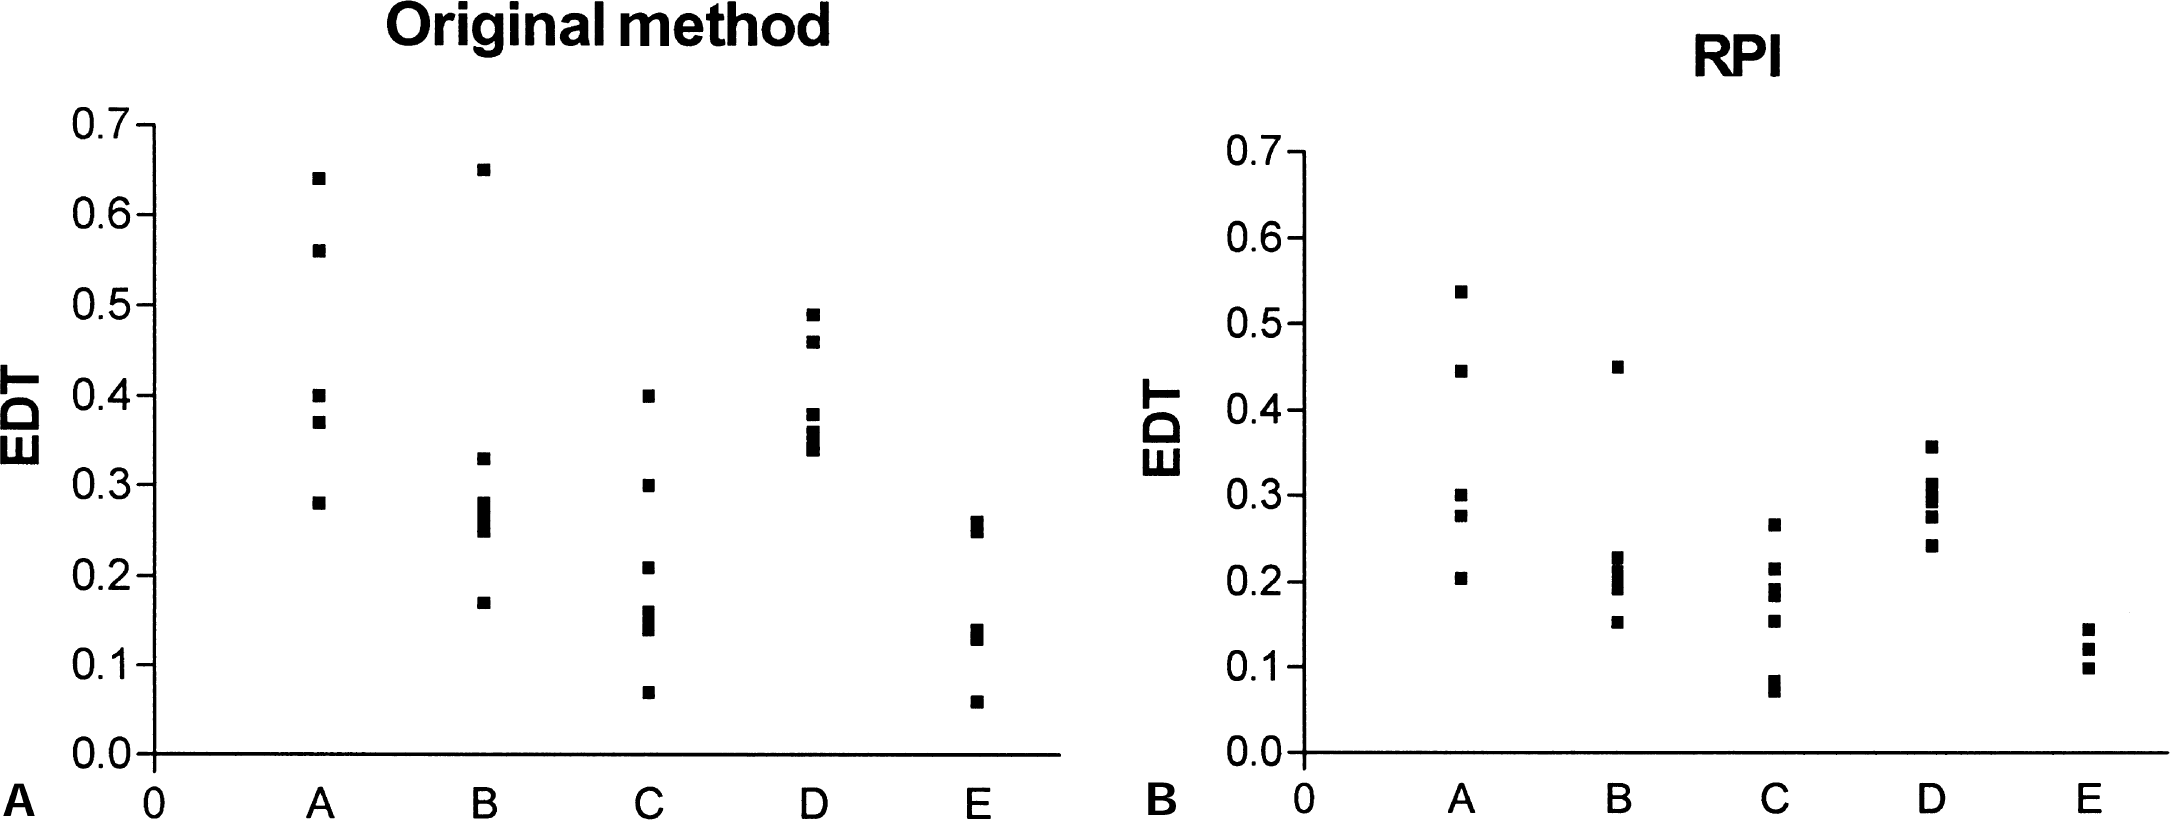
Figure 5 shows the values obtained for the four groups with the three methods, and Table 2 contains the correlation coefficients between the EDT measures obtained from the original method and those obtained from the new methods. There was good correlation between the two plasma input function methods, both for individual groups and overall. There was also good correlation between the values obtained from the two new methods in all cases except when the normal and the exposed groups were considered. This lower correlation is due to the fact that the reversible tissue input method gives a much tighter distribution of slope values for these two groups, as mentioned above.
Correlation coefficients (r) between EDT values obtained from the different methods for all groups together (Full range) and for each group separately
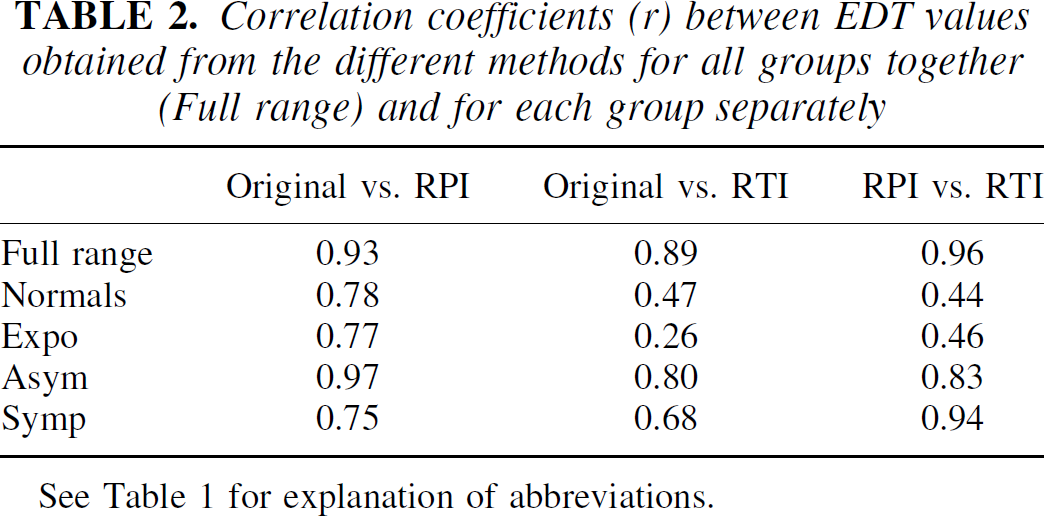
See Table 1 for explanation of abbreviations.
Finally, the new methods were examined in terms of their ability to separate the four groups. A two-tailed t-test assuming unequal variances was applied to the data, and the probability values associated with the rejection of the hypothesis of no difference between the groups are shown in Table 3. Although the original method was more sensitive in detecting EDT differences between the groups, similar levels of significance were obtained with all three methods. In particular, the reversible tissue input method was the only one that could differentiate the normal from the exposed group.
P values associated with the significance level of the rejection of the hypothesis of no difference between groups
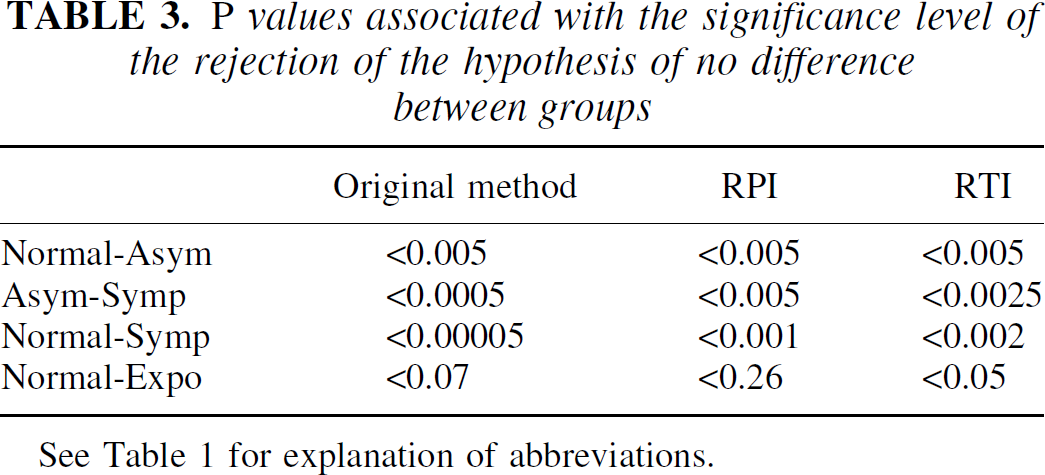
See Table 1 for explanation of abbreviations.
Set 2
Only the results obtained from the reversible plasma input method and the original method could be compared in this case. In the case of the tissue input function, a catechol-O-methyl-transferase–inhibiting intervention had the confounding effect of reducing the presence of 3-O-methyl-[18F]fluoro-DOPA in the reference region, thus increasing the Kocc value and decreasing the kloss value because of a decrease of the input function. Therefore, any observed change would not be entirely due to the effect of the intervention in the region of interest, but mainly to a change of the input function.
The comparison between the values obtained in the original study and those obtained with the reversible plasma input method is shown in Fig. 6. There was good numeric agreement between the values obtained from the two methods, and the overall correlation coefficient between the two data sets was 0.92. The ability of the two methods to separate the effect of interventions was similar: using a two-sided t-test assuming unequal variances, a significant difference was found between baseline and the group treated with tolcapone with both methods (P = 0.02 for the original method, P = 0.03 with the reversible plasma input method) and between baseline and the group treated with both tolcapone and deprenyl (P = 0.01 with the original method, P = 0.02 with the reversible plasma input method).
Effective dopamine turnover (EDT) values obtained from the original method
Conclusion
The EDT, measured in vivo, has been previously shown in nonhuman primate studies to be a sensitive index of disease severity. The EDT is estimated using FD by quantifying the amount of tracer leakage from the trapping compartment. A new method to determine EDT (or EDV) and the EDVR has been developed. The method is based on the observation that the leakage from the trapping compartment that is invariably observed 120 minutes after tracer injection (or even earlier in disease) can be viewed as a reversible stage of the FD tracer kinetics. A reversible tracer model can thus be applied to the data.
The method, based on the graphical approach developed by Logan et al. (1990), can be used with a plasma or a tissue input function. When the plasma input function is used, the slope obtained from the graph is Ki/kloss. The values obtained from the reversible approach were proven to correlate well with the values obtained from the extended Patlak graphical method, both numerically and in their ability to separate disease states and effects of interventions.
When the tissue input is used, the slope of the graph is the ratio of the distribution volumes of the specific and precursor compartments, reduced by the factor k2/(k2 + k3). As in the case of Kocc, the results obtained from this method are biased toward smaller values of the EDVR because of the presence of the FD metabolite 3-O-methyl-[18F]fluoro-DOPA in the reference region. Nevertheless, the results were shown to correlate well with those obtained from the reversible plasma input method and were shown to yield comparable separation between disease states. These findings provide empirical support for the validity of this approach. In addition, this method proved to be less susceptible to measurement noise, because no plasma radioactivity measurement is required. The data were found not to be sensitive to the reference region efflux constant k2′, thus allowing a truly bloodless analysis method.
The extended Patlak method and the reversible tracer approach presented here both provide an estimate of EDT, the first one by trying to restore the irreversible behavior of the tracer and the other by exploiting the reversible stage of the tracer kinetics. The relative performance of the two methods is thus expected to depend on the amount of reversibility and on the rapidity of FD kinetics, and it might vary between nonhuman and human primates. Preliminary results obtained from human data indicate that this method is well suited to determine EDT in humans.
Footnotes
Acknowledgments:
The authors thank the UBC/TRIUMF positron emission tomography group and the UBC Animal Care Facility.