
Abstract
An increase in dopamine turnover has been hypothesized to occur early in Parkinson's disease (PD) as a compensatory mechanism for dopaminergic neuronal loss. A new approach to the determination of dopamine turnover was developed using 4-hour-long 18F-fluorodopa (FD) positron emission tomography (PET) data. An effective dopamine turnover, an estimate of dopamine turnover, has been measured using its inverse, the effective dopamine distribution volume (EDV). This new method is based on a reversible tracer approach and determines the EDV using a graphical method. Six healthy subjects and 10 subjects with very early PD underwent a 4-hour-long FD scan. The EDV and the plasma uptake rate constant Ki, a marker of dopamine synthesis and storage, were compared according to their ability to separate the PD group from the healthy group. The EDV was the better discriminator (93.8% correct classification versus 81.3% for Ki). Effective dopamine distribution volume decreased by 65% in the PD group relative to the healthy group, whereas the decrease in Ki was 39%. These results show that changes in EDV are measurable with PET earlier than changes in the dopamine synthesis and storage rate, indicating that EDV is a sensitive marker for early PD and that a dopamine turnover increase likely serves as an early compensatory mechanism.
Parkinson's disease (PD) affects approximately 300 per 100,000 of the general population (Schoenberg et al., 1988). Its clinical symptoms include resting tremor, rigidity, bradykinesia, and postural instability leading to an increasing motor impairment as disease progresses. These characteristics are attributed to a progressive loss of the neurotransmitter dopamine caused by the degeneration of the dopaminergic neurons of the substantia nigra pars compacta that project to the striatum. It seems that the clinical symptoms only appear when the striatal dopamine concentrations are already fairly depleted (by 80% or more) (Bernheimer et al., 1973; Seeman and Niznik, 1990). This finding implies that a variety of compensatory mechanisms may take place in the early stages of the disease, such as changes in dopamine synthesis, release, reuptake, and transport mechanisms (Calne and Zigmond, 1991).
There are indications from biochemical data that an increase in dopamine turnover might be a very important early compensatory mechanism (Barrio et al., 1990). Classically, dopamine turnover is defined as the ratio between dopamine metabolites and dopamine itself. Such an estimate can only be obtained from postmortem studies, and thus investigations of dopamine turnover in early disease have been hampered by the lack of a suitable measuring technique.
Recently, the concept of the effective dopamine turnover that is measurable by 18F-fluorodopa (FD) positron emission tomography (PET) has been developed (Doudet et al., 1998). The radiotracer FD has been used extensively to investigate the rate of dopamine synthesis and storage, quantifiable with the blood to striatum uptake rate constant Ki (Patlak et al., 1983; see Materials and Methods). Ki has been shown to correlate well with the number of dopamine neurons and the levels of striatal dopamine (Snow et al., 1993) and is generally obtained from the data acquired in the first 90 minutes after tracer injection. During that time, FD behaves as an irreversibly bound tracer. However, if the scanning time is extended, some degree of reversibility is observed in the data, which is considered an indication of dopamine neuronal release and subsequent metabolism. Such reversibility is quantified with the rate constant kloss. The ratio kloss/Ki is then interpreted as an in vivo estimate of the effective dopamine turnover.
This turnover index differs conceptually from the biochemical dopamine turnover marker, because it is obtained using a radiotracer that is analogous to exogenous levodopa; this tracer is not sensitive to the tyrosine hydroxylation step considered the limiting factor in the formation of endogenous dopa and dopamine. Nevertheless, the effective dopamine turnover measures the relative strength of the uptake and elimination processes present at each site of the brain, and it can thus provide information about variation of dopamine turnover between brain regions and between different subjects.
These observations were validated with a nonhuman primate PD model, in which monkeys were lesioned with 1-methyl-4-phenyl-1,2,3,6-tetrahydropyridine (MPTP) to induce PD-like symptoms (Doudet et al., 1998). In these studies, effective dopamine turnover was found to correlate well with lesion severity and with postmortem biochemical turnover measurements. This study also showed that an increase in the effective turnover was observable even before the threshold of parkinsonian symptoms was reached (80% loss of striatal dopamine), thus providing supporting evidence that increased dopamine turnover occurs early in the disease. The estimate of kloss and consequently the effective dopamine turnover was obtained with an extension of the Patlak graphical approach (Holden et al., 1997). This method determined kloss by modifying the stretch time term (see Materials and Methods) in the abscissa, thus restoring apparent irreversibility to the data.
These nonhuman primate studies thus identified a protocol to estimate dopamine turnover in vivo, providing a relatively noninvasive technique that could be used in human studies. It is, in fact, only in human studies that the role of dopamine turnover in early PD can be accurately established, because it remains to be proven that the animal PD model accurately reproduces disease progression, especially in its early stages. We have therefore selected 10 patients with very early PD (disease onset 3 years or less; see Materials and Methods) and six normal volunteers of similar age and evaluated the observed separation between the two groups using PET. Specifically, we have compared a marker for FD synthesis and uptake, Ki, to the observed separation obtained when the effective dopamine turnover was used as discriminator. If the effective dopamine marker proved to be the better separator, then we could demonstrate that changes in dopamine turnover are measurable earlier than changes in FD uptake, thus providing evidence that an increase of dopamine turnover occurs very early in the disease, and serves as a disease compensatory mechanism.
To reliably determine the effective dopamine turnover, a new method was used, because the extended Patlak method (Holden et al., 1997) failed to produce reliable estimates for kloss for human studies. This was likely caused by the relative increase in the noise in the data due to the measurement of the authentic plasma tracer radioactivity: the nonhuman primates had been injected with a higher amount of radioactivity per body weight than the human subjects, thus providing statistically more reliable plasma tracer concentration values. An additional reason may be that the FD kinetics are different in the nonhuman primates compared with human subjects, thus affecting the ability of various models to accurately define different kinetic variables.
The new method is based on a reversible model approach and determines directly the effective distribution volume (EDV), which is the direct inverse of the effective dopamine turnover. The method is described in detail elsewhere (Sossi et al., 2001) and a brief description will be given below. In addition to providing the effective distribution volume using a plasma input function, the method allows for the option of a tissue input function. In this case the measurable parameter is the effective distribution volume ratio (EDVR) (see Materials and Methods).
Although our previous work emphasized the turnover rather than the distribution volume concept, we recognized from the start that the two were equivalent (Doudet et al., 1998). However, as the new method evaluates the distribution volume directly, it is more appropriate to use it, and not its inverse, in the statistical analysis described herein. From here on the terms effective distribution volume and effective dopamine turnover will be used interchangeably.
The primary PET index for dopamine synthesis and storage considered in this study was the plasma input uptake rate Ki, whereas EDV was taken as marker of the effective dopamine turnover. We also examined the results obtained with the tissue input uptake rate Kocc and EDVR. Although one of these might also prove to be a good discriminator of early disease, the biological interpretation of these two markers is confounded by the presence of the FD metabolite 3-O-methyl-[18F]fluoro-DOPA (3OMFD) in the reference region (Fig. 1; see Materials and Methods) (Martin et al., 1989), whose time course is used as input function. It is well known that the presence of 3OMFD introduces a bias in the Kocc estimate. The degree of such bias may change with disease progression, because it remains to be proven that the relative impact of the 3OMFD tissue input component does not change with disease severity. An even larger bias is introduced in the EDVR estimate (see Materials and Methods). Therefore, these methods are less likely to accurately quantify disease compared with plasma input methods. However, some studies reported them to be very good disease discriminators (Leenders et al., 1990; Hoshi et al., 1993; Vingerhoets et al., 1996), implying that such methods might give fairly precise results. They are indeed less susceptible to measurement errors, because they do not require the knowledge of the FD plasma concentration and they are not affected by subject-to-subject variations of tracer transport across the blood–brain barrier.
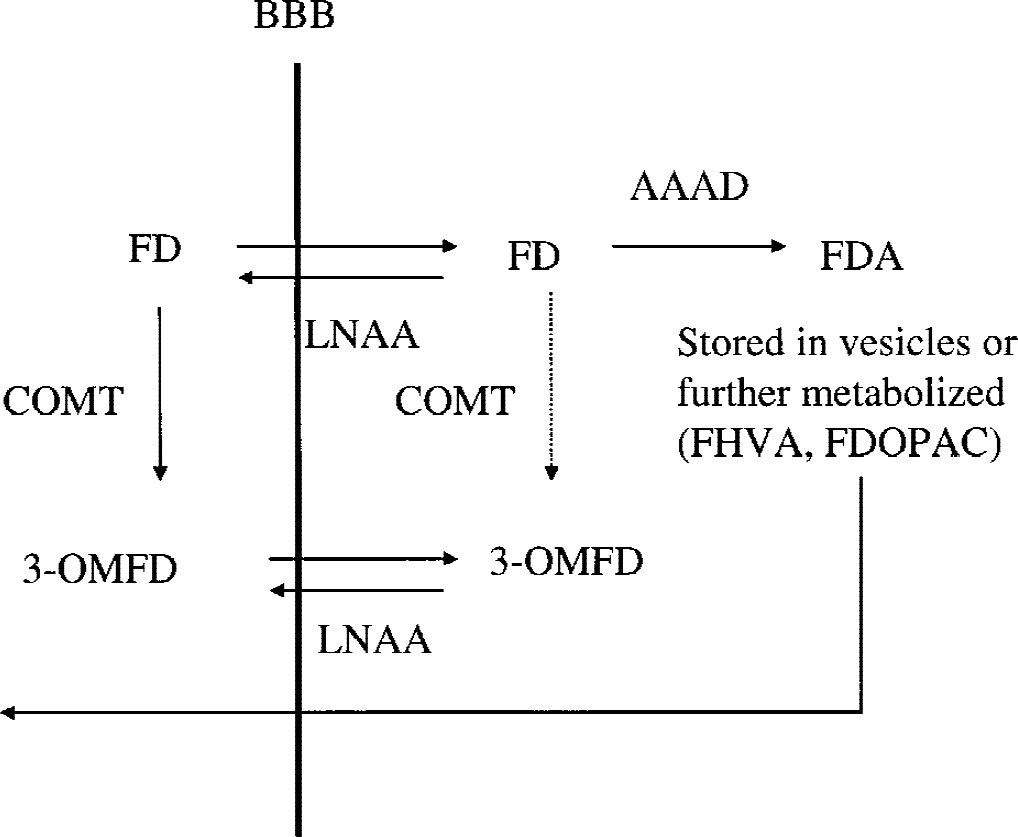
[18F]fluorodopa (FD) kinetics in the striatum. FD is transported across the blood–brain barrier (BBB) via the large neutral amino acid (LNAA) system. It is subsequently decarboxylated via the
MATERIALS AND METHODS
Patient selection, scanning protocol, and region-of-interest placement
Ten patients with very early PD (7 men and 3 women, age 60.4 ± 11.3, mean ± SD) were selected for this study. Disease duration, defined as time from the onset of symptoms as first noticed by the patient, was 3 years or less. Five of the 10 patients were still untreated at the time of the scan. The motor component of the Modified Columbia Scale score (Duvoisin, 1971) was 11.0 ± 4.3 (mean ± SD, range 5 to 16).
These patients and six normal volunteers (2 men and 4 women) of similar age (52.2 ± 8.4, mean ± SD) underwent a 4-hour-long FD scan on a Siemens/CTI ECAT 953B PET tomograph (Knoxville, TN) (Spinks et al., 1992) operating in three-dimensional mode (Sossi et al., 1998) after injection of 7 mCi of FD (effective dose equivalent 4.2 mSv). All the subjects were administered 150 mg of the peripheral decarboxylase inhibitor carbidopa 1 hour before FD injection. Data were corrected for attenuation using an external 68Ge source. The scanning sequence consisted of 9 × 10-minute scans, after which the patients could leave the bed for 30 minutes, followed by a final sequence of 12 × 10 minutes. The repositioning was aided by use of a thermoplastic mask, which also helped to minimize head motion during the scan. Images from the first and second scanning sequences were realigned using the AIR algorithm (Woods et al., 1993). Four 61-mm2 circular regions of interest (ROIs) were placed on each striatum: 1 on the caudate nucleus and 3 on the putamen (anterior [P1], middle [P2], and posterior putamen [P3]), and 6 270-mm2 circular ROIs were placed on the occipital cortex on 5 adjacent planes containing the striatal image on each frame of the dynamic sequence.
Thirty-seven arterial blood samples were taken to obtain the plasma radioactivity time course. Twelve were analyzed for metabolites to identify the authentic FD plasma fraction. The metabolite separation was performed as previously described with an alumina extraction method with anion/cation exchange columns (McLellan et al., 1991; Doudet et al., 1998). With this method, the cation column captures the positively charged metabolites (FD and 6-fluoro-3-methoxytyramine) and the anion column captures the negatively charged metabolites [L-3,4-dihydroxy-6-[18F]fluorophenylacetic acid and [18F]6-fluoro-homovanillic acid and sulfated conjugates]. FD and 3OMFD, both unretained by the columns, are then separated by alumina extraction. All studies received the approval of the University of British Columbia Ethics Committee.
Modeling
Determination of Ki and Kocc.
Ki and Kocc were determined using the Patlak graphical approach (Patlak et al., 1983; Patlak and Blasberg, 1985). When a trapping compartment exists and steady state is reached between plasma and the exchangeable compartments, Ki is obtained as the slope of the line describing the relationship between the ratio of the specific compartment, S(t), and plasma radioactivity, Cp(t), and the ratio between the running integral and the instantaneous value of the plasma radioactivity (stretch time). Ki = K1k3/(k2 + k3), where K1 and k2 are the clearance rates from plasma into tissue and from tissue into plasma, and k3 is the rate constant describing the trapping of brain FD. The radioactivity in the specific compartment (trapped 18F-fluorodopamine) is obtained from the radioactivity determined in a ROI placed on the striatum after subtraction of the radioactivity present in a ROI placed on the occipital cortex (Martin et al., 1989). This subtraction needs to be performed to eliminate the contribution of the 3OMFD from the radioactivity in the ROI placed on the striatal image. A description of the FD kinetics is shown in Figure 1.
The same approach is used to determine Kocc, with the exception that the time activity course of a region essentially devoid of trapping, in this case the occipital cortex, is used as input function. In this case, the slope of the straight line (Kocc) is equal to k2k3/(k2+k3). An added complication with this approach is the presence of 3OMFD in the reference region, which artificially increases the input function and therefore biases the Kocc toward smaller values. This method also has been shown to introduce some alteration in patient severity ranking compared with Ki (Holden et al., 1996) because of its sensitivity to 3OMFD. Nevertheless, this method has been found to separate PD patients from normal subjects (Brooks et al., 1990; Leenders et al., 1990; Hoshi et al., 1993; Takikawa et al., 1994; Vingerhoets et al., 1996) and is commonly used, because it does not require arterial sampling. Data acquired from injection time to 90 minutes were used to determine Ki and Kocc.
At times later than approximately 90 to 120 minutes after tracer injection, the data defined by the graphical analysis start to deviate from a straight line, indicating some degree of reversibility. Figure 2 shows an example of such a deviation in the data obtained using the tissue input function. This observation was used to develop the new method for determining the dopamine effective distribution volume.
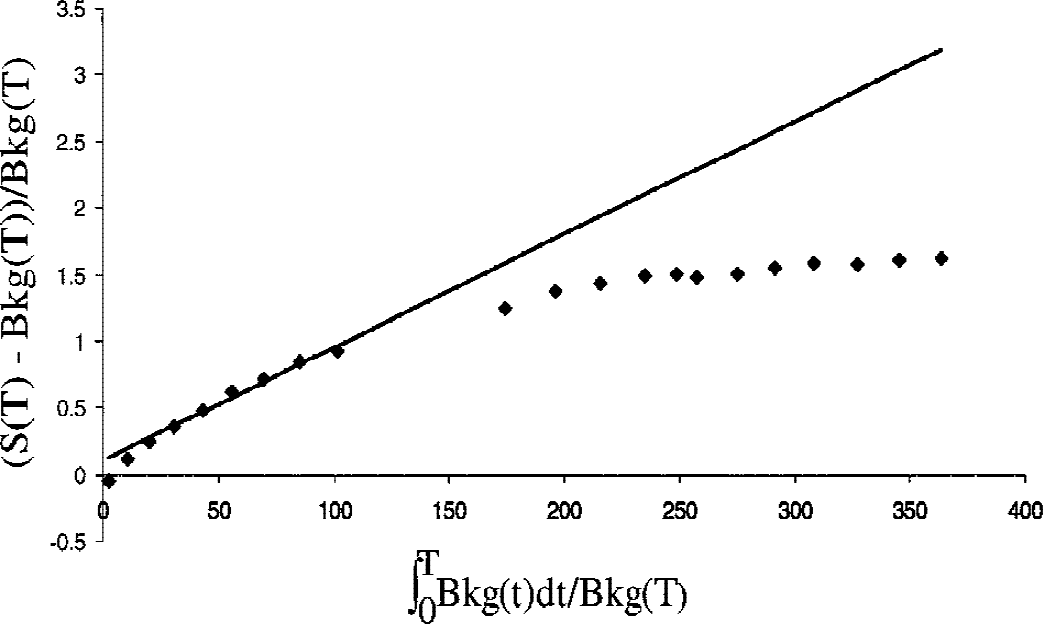
Example of a Patlak graph obtained with the tissue input function for a healthy subject. Each diamond corresponds to the time when the patient was taken out of the scanner. The solid line is the best fit to the data acquired between 20 and 90 minutes after tracer injection, and the slope of this line corresponds to Kocc. It is apparent from the graph that the data points start to deviate from the straight line at approximately 90 minutes after tracer injection (ninth data point; see Materials and Methods). For the patients mildly affected with PD participating in this study, the deviation from the straight line occurred at approximately the same time points, as determined from visual inspection. The determination of the exact point of inflection and its dependence on disease severity was beyond the scope of this study.
Determination of EDV and EDVR.
The new method has been described in detail previously (Sossi et al., 2001). Briefly, the effective dopamine distribution volume is obtained using the following equation
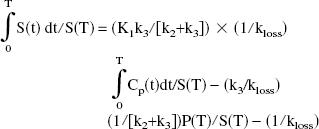
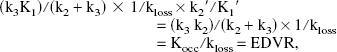
where P(t) is the precursor time course (tissue free FD) and S(t) is the specifically trapped component (trapped dopamine), obtained from the radioactivity determined in an ROI placed on the striatum after subtraction of the radioactivity present in an ROI placed on the occipital cortex. The next-to-last term on the right side of the preceding equation becomes a constant when steady state between the precursor and the specific pools is reached. In this case, a plot of ∫0T S(t) dt/S(T) versus ∫0T Cp(t)dt/S(T) yields a straight line relationship with a slope of

the inverse of the effective dopamine turnover.
Following the approach used by Logan et al. (Logan et al., 1996), a tissue input EDVR was derived from the following equation:
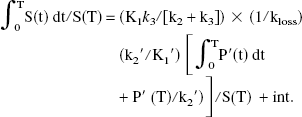
Using the assumption K1′/k2′ = K1/k2 (Kuwabara et al., 1993), the coefficient of the first term (graphical slope) can be expressed as
where Kocc is the standard graphical uptake rate constant obtained with the tissue input method. EDVR is the ratio of the distribution volumes of the specific and precursor compartments, reduced by the factor k2/(k2 + k3). As in the case of Kocc, the values of EDVR are biased by the presence of 3OMFD in the reference region used as input function. The bias is likely to be even greater compared with the one introduced in the determination of Kocc, because the presence of 3OMFD decreases the apparent value of Kocc and increases that of kloss. Nevertheless, previous studies where this method was applied to data obtained from nonhuman primate studies have shown that the EDVR correlates well with EDV and is similarly able to distinguish normal state from MPTP-induced PD.
It has been shown that the graphical method for a reversible process is very sensitive to the noise in the PET data time activity course (Slifstein and Laruelle, 2000). The presence of noise introduces an underestimation of the slope value. The magnitude of this bias is proportional to the amount of noise on the data and to the magnitude of the slope. To minimize the effect of such bias, the EDV and EDVR were calculated on the radiotracer concentration values averaged over all six putaminal ROIs. Visual inspection of the time activity curves thus obtained indicated smooth radioactivity time courses.
Statistical analysis
Linear discriminant analysis (Everitt and Dunn, 1991) was used to identify the parameter that best separated the PD patients from the normal volunteers. To investigate dopamine turnover using the least biased markers (see the introduction and Materials and Methods) the discriminant analysis was first applied to EDV and Ki alone. All methods were then compared for their ability to discriminate early disease.
Briefly, discriminant analysis identifies that linear transformation of the data that maximizes the separation between the two groups. Because the neuronal degeneration affects the putamen earlier than the caudate, only the parameter values averaged over the putaminal ROIs were used in the analysis.
RESULTS
An example of a plot obtained with the new graphical approach for the dopamine EDV estimate is shown in Figure 3. Data from the reversible model analysis were found to follow a straight-line behavior from 120 to 240 minutes. Putaminal values obtained for each patient are shown in Figure 4 for all four outcome variables. It is apparent that the EDV is the only quantity that completely separates the two groups.
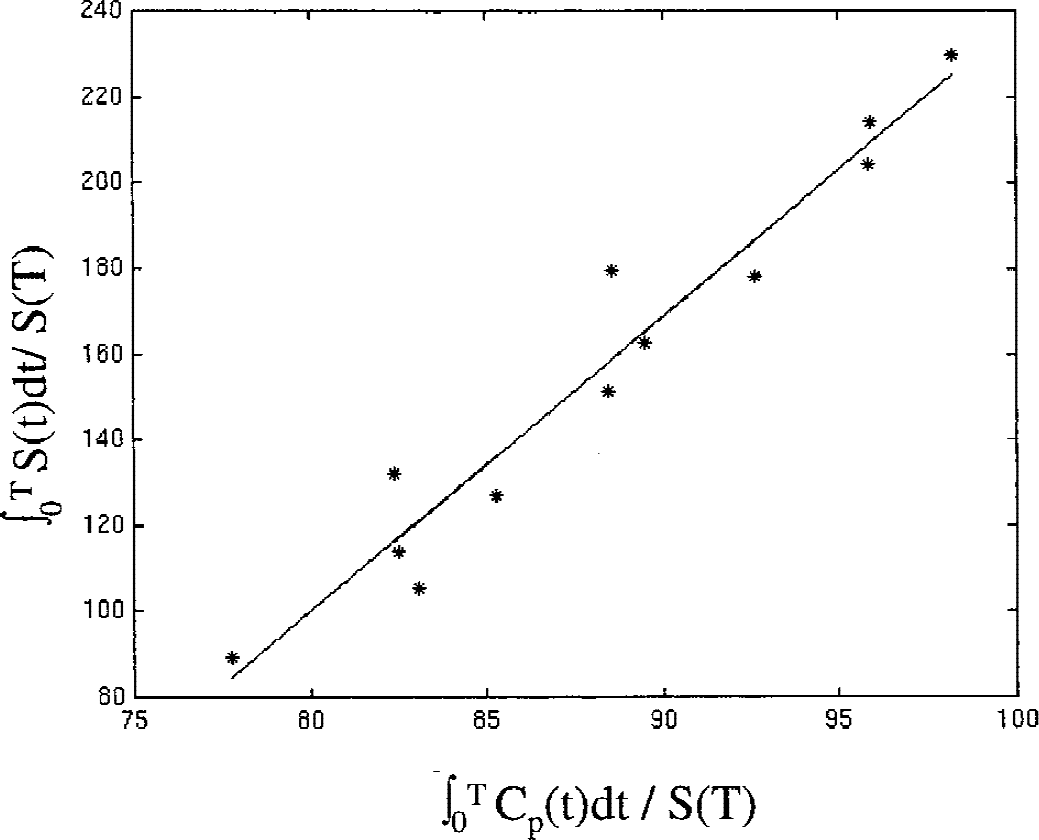
Example of a plot obtained with the new graphical analysis with plasma input function. Data acquired between 120 and 240 minutes after injection are shown. Although these data were obtained for a patient with Parkinson's disease (PD), the character of the plot is representative of both groups. No obvious difference in the aspect of the plots between the PD and the normal group was observed.
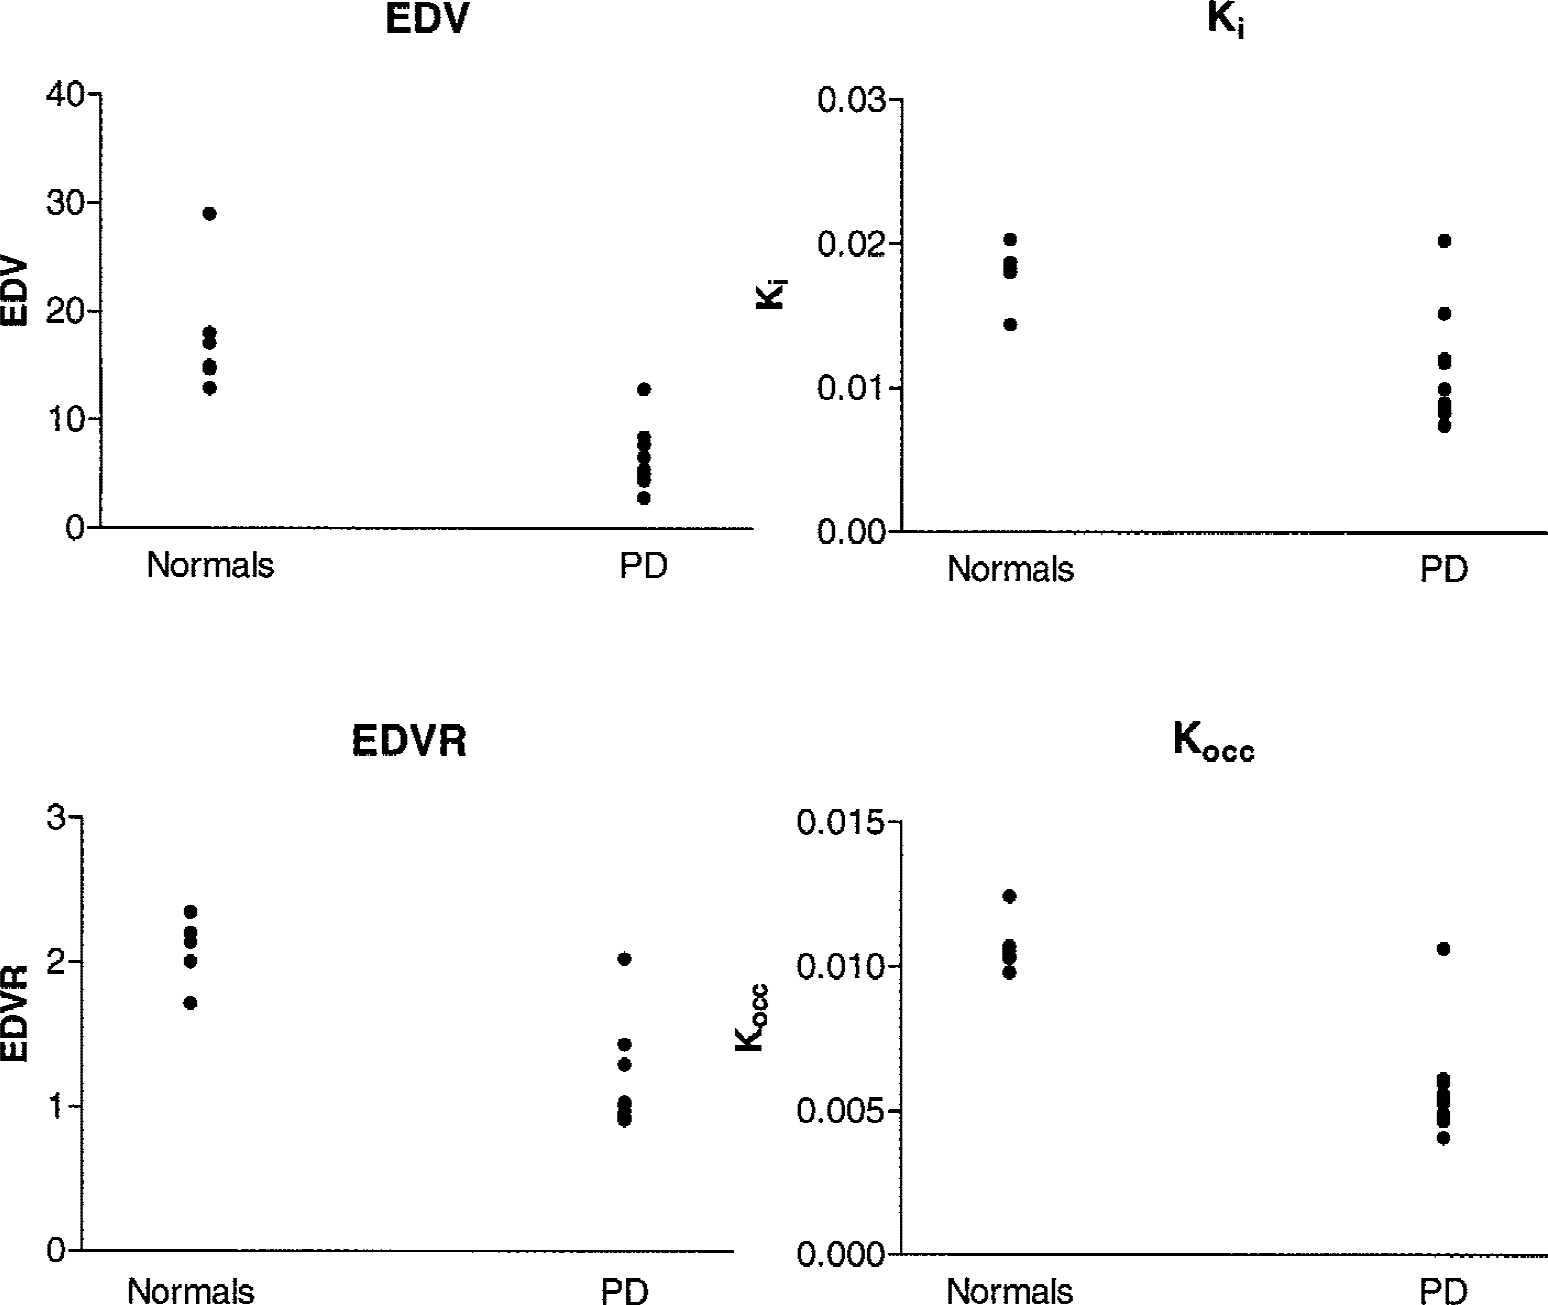
Putaminal effective dopamine distribution volume (EDV), effective distribution volume ratio (EDVR), Ki, and Kocc values for each patient. (Note that EDV and EDVR are the inverse of turnover and therefore a lower value indicates higher turnover.) PD, Parkinson's disease.
Table 1 shows the decrease of each of the four outcome variables from the normal for the putaminal regions. As previously noted, the emphasis is placed on the EDV and Ki comparison: the EDV values obtained in the PD group are 35% of its values averaged over the normal subjects, whereas the corresponding comparison performed with Ki show a reduction to 61% of the normal values.
Mean (M), standard deviation (SD), and coefficient of variation (CV) for each outcome variable calculated for the putamen in the control and the PD group
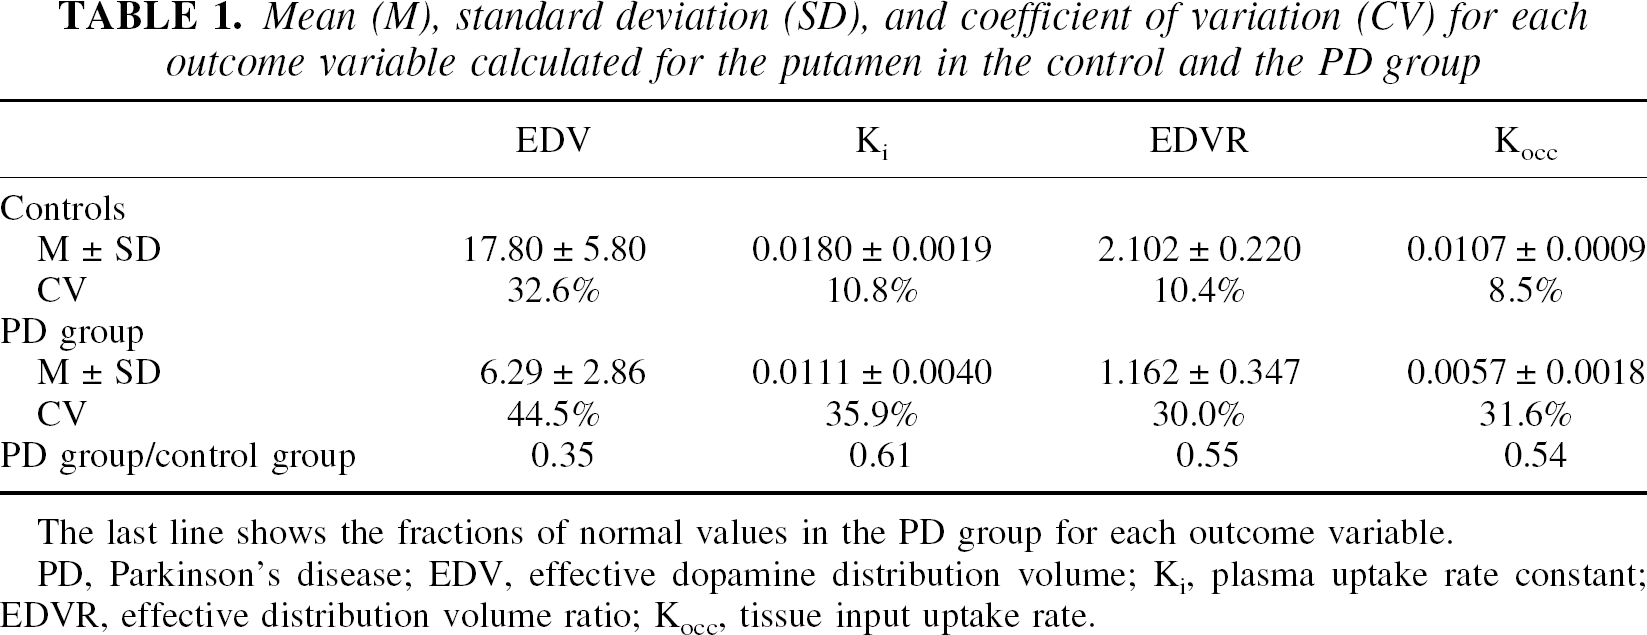
The last line shows the fractions of normal values in the PD group for each outcome variable.
PD, Parkinson's disease; EDV, effective dopamine distribution volume; Ki, plasma uptake rate constant; EDVR, effective distribution volume ratio; Kocc, tissue input uptake rate.
Results of the discriminant analysis
Linear discriminant analysis applied to EDV and Ki identified the EDV as the better discriminator between the two groups (for EDV, F = 28.73, df = 1,14, P = 0.0001; for Ki, F = 15.69, df = 1,14, P = 0.0014). Effective dopamine distribution volume classified correctly all the normals and only misclassified 1 patient with PD (overall correct classification 93.8%), whereas Ki misclassified 1 normal subject and 2 patients with PD (overall correct classification 81.3%). The same percentages were obtained even when using a jackknifed classification (also called the “leaving out method”; see, for example, Everitt, 1994). The only patient who was incorrectly classified by EDV had similar a posteriori probabilities of pertaining to any of the two groups (0.64 for the normal group versus 0.36 for the PD group). The probabilities of belonging to each group are shown in Table 2, and the data transformed according to the respective discriminant functions are shown in Figure 5. Stepwise linear discriminant analysis only selected EDV for the discriminant function.
Probability for each subject to be classified into the algorithm-defined normal or PD group
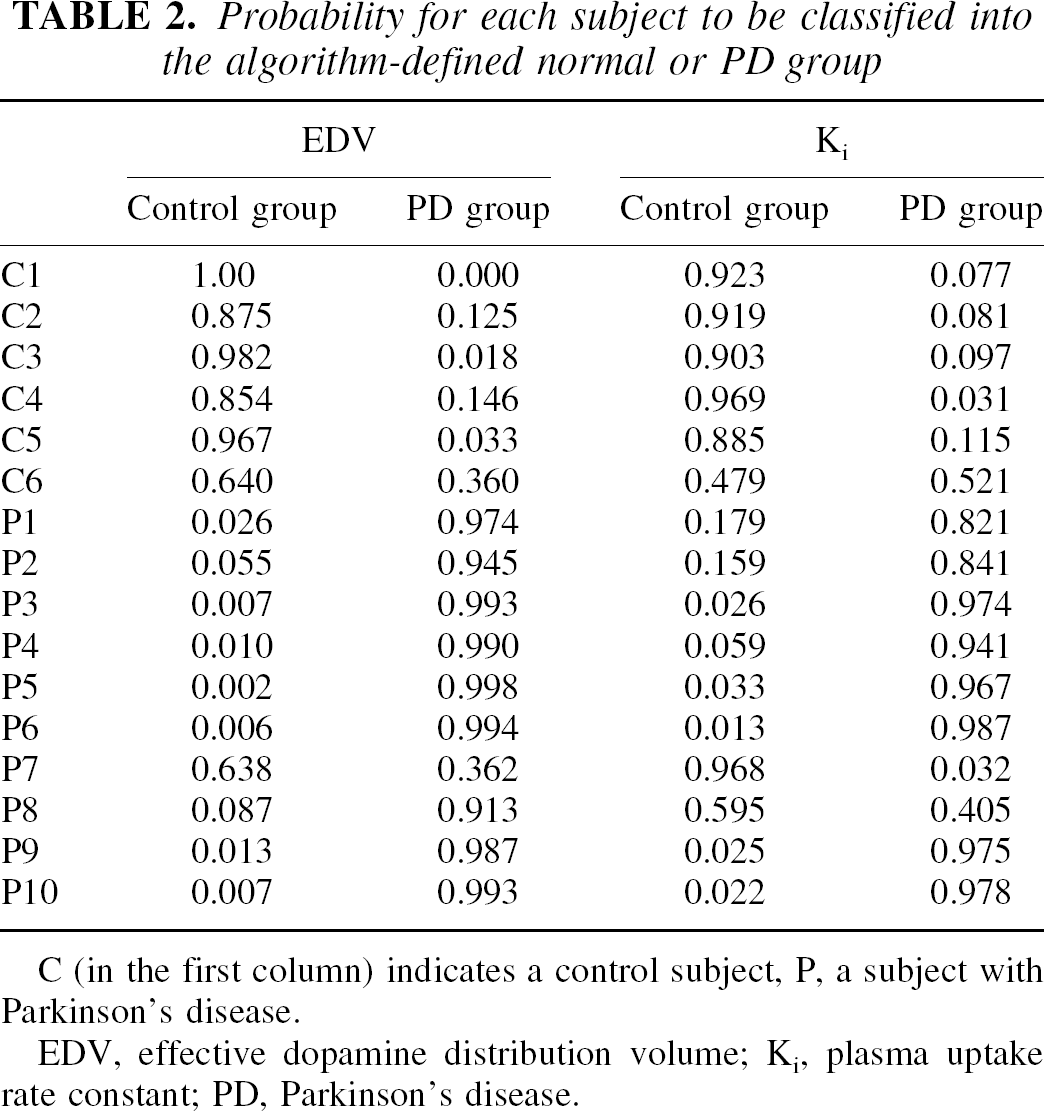
C (in the first column) indicates a control subject, P, a subject with Parkinson's disease.
EDV, effective dopamine distribution volume; Ki, plasma uptake rate constant; PD, Parkinson's disease.
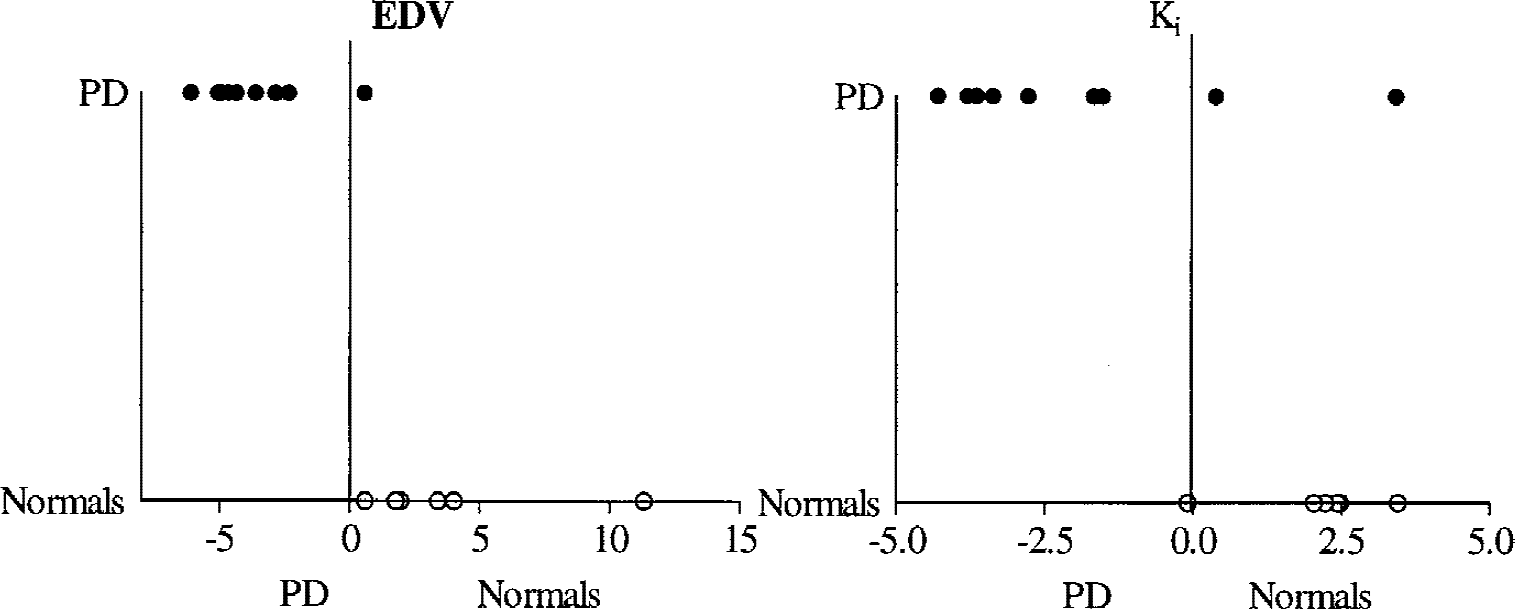
Effective dopamine distribution volume (EDV) and Ki values transformed according to the discriminant analysis (x-axis values). Values greater than zero indicate the algorithm-defined normal group (Normals), whereas values less than zero indicate belonging to the algorithm-defined Parkinson's disease group (PD). Normal (open circles) and PD (filled circles) on the y-axis identify the actual grouping of the subjects. The two vertical lines at x = 0 are introduced for clarity.
When all four figures of merit were included in the comparison, Kocc appeared to be the best discriminator (overall correct classification = 93.8%, F = 37.56, df = 1,14, P < 0.0001), in spite of the fact that EDV was the only marker that achieved complete numerical separation between the two groups (Fig. 3). EDVR was also found to be a good discriminant (overall correct classification = 93.8%, F = 34.99, df = 1,14, P < 0.0001). The good discriminating ability of the two tissue methods was attributed to the higher precision compared with the plasma input methods as demonstrated by their coefficients of variation shown in Table 1. Both Kocc and EDVR also failed to classify correctly the PD patient misclassified by EDV using the discriminant analysis.
DISCUSSION
The effective dopamine distribution volume was found to be a better discriminator than Ki between the group of normal subjects and a group of patients with PD of similar age with very early PD. Clearly the diagnosis of PD is predominantly clinical, and we do not propose to use the current methodology for diagnostic purposes. However, on the assumption that the effective dopamine distribution volume measurable with PET provides a good estimate of dopamine turnover, this study shows in vivo that an increase in dopamine turnover occurs very early in the disease, and it thus provides a compensatory effect.
There are some methodologic issues that need to be considered in the context of this study: the effect of noise on the determination of the EDV and EDVR and the comparison of the plasma and tissue input methods.
As previously noted, the presence of noise in the radioactivity time course used to determine the EDV or EDVR introduces a downward bias into their values (Slifstein and Laruelle, 2000) Such bias is proportional to the magnitude of the noise itself and to the magnitude of the parameter value. To minimize the effect of such noise, we calculated the EDV and EDVR values from the radioactivity values averaged over the whole putamen. For EDV, the values thus calculated were higher by 44% for the normal group and by 33% for the PD compared with the values obtained by averaging the EDV values calculated for each putaminal ROI separately. The increase for EDVR was 0.8% for the normal group and 2% for the PD group. The magnitude of the correction reflects the character of the bias. It is expected to be larger for the EDV values calculated in the normal group, because the absolute values of the parameter are higher in that group. The small change in the EDVR values is because its values were low enough to render the magnitude of the bias small (Slifstein and Laruelle, 2000). After the radioactivity values were averaged over all putaminal ROIs, visual inspection revealed fairly smooth time-course behavior. Correction for any possible remaining bias would preferentially further increase the EDV values for the normal group. This effect would increase the difference between the PD and the normal group, thus further strengthening the present findings.
A good discrimination between the two groups was also obtained using the tissue input methods. Several studies have compared the ability of plasma and tissue input methods to separate disease from normal condition with discrepant outcomes (Hoshi et al., 1993; Takikawa et al., 1994; Vingerhoets et al., 1996). This discrepancy is likely because investigations differed in their choice of disease severity and image analysis methods. There are many factors that affect the precision and accuracy of each method: the need to isolate the FD plasma fraction and measure its radioactivity coupled to the sensitivity of the blood-to-brain transport mechanism tends to decrease the precision achievable with the plasma input methods. However, the bias introduced by 3OMFD decreases the accuracy of the tissue-input methods as indicators of the dopa to dopamine decarboxylase capacity. Therefore, even though the tissue input methods may perform very well and are advisable when discrimination is of interest, they might be less able to quantitatively follow disease progression (Takikawa et al., 1994). A more comprehensive study, beyond the scope of this investigation, is required to fully address this issue.
Pretreatment with the catechol-O-methyl-transferase peripheral inhibitor entacapone could conceivably be considered to minimize the amount of 3OMFD in the system. Such a pretreatment increases the FD circulation time in the plasma and decreases the plasma amount of 3OMFD. In addition, after such pretreatment, there is an increase in the plasma concentration of sulfated metabolites (Ishikawa et al., 1996), which reduces the combined amount of FD and 3OMFD that can cross the blood– brain barrier, thus decreasing the radioactivity amount in the reference region. As a consequence of these two effects, the Kocc values increase and become less biased. However, it has been shown that the level of catechol-O-methyl-transferase inhibition influences the Kocc values (Psylla et al., 1997). Therefore, intersubject variability in the degree of catechol-O-methyl-transferase inhibition and in the amount of sulfated metabolites is likely to introduce an additional source of uncertainty in the determination of the tissue-input methods.
CONCLUSIONS
A new method to determine the effective dopamine distribution volume using FD PET has been developed based on the reversible tracer approach. The EDV was used as a marker of dopamine turnover. The changes in EDV in early PD were larger compared with changes in dopamine synthesis and storage as measured by the FD uptake rate constant Ki. This finding shows that changes in dopamine turnover can be measured by FD PET in the early stages of the disease and that an increase in dopamine turnover is thus an early compensatory mechanism for dopaminergic neuronal degeneration.
Footnotes
Acknowledgments:
The authors acknowledge the support of the UBC/TRIUMF PET group and, in particular, C. English and T. Dobko.