
Abstract
Parkinson disease is characterized by the loss of dopaminergic neurons, thus decreasing the system's ability to produce and store dopamine (DA). Such ability is often investigated using 18F-fluorodopa (FD) positron emission tomography. A commonly used model to investigate the DA synthesis and storage rate is the modified Patlak graphical approach. This approach allows for both plasma and tissue input functions, yielding the respective uptake rate constants Ki and Kocc. This method requires the presence of an irreversible compartment and the absence of any nontrapped tracer metabolite. In the case of Kocc, this last assumption is violated by the presence of the FD metabolite 3-O-methyl-[18F]fluoro-dopa (3OMFD), which makes the Kocc evaluation susceptible to a downward bias. It was found that both Ki and Kocc are influenced by DA loss and thus are not pure measures of DA synthesis and storage. In the case of Kocc, the presence of 3OMFD exacerbates the effect of DA egress, thus introducing a disease-dependent bias in the Kocc determination. These findings imply that Ki and Kocc provide different assessments of disease severity and that, as disease progresses, Ki and especially Kocc become more related to DA storage capacity and less to the DA synthesis rate.
Parkinson disease (PD) affects approximately 300 in 100,000 of the general population (Schoenberg et al., 1988). Its clinical symptoms include resting tremor, rigidity, bradykinesia, and postural instability leading to increasing motor impairment as the disease progresses. These characteristics are attributed to a progressive loss of the neurotransmitter dopamine (DA) caused by the degeneration of the dopaminergic neurons of the substantia nigra pars compacta that project to the striatum.
The positron emission tomography (PET) tracer 18F-fluorodopa (FD) has been used extensively to investigate the integrity of the dopaminergic system. 18F-Fluorodopa is transported across the blood–brain barrier (BBB) via the large neutral amino acids (LNAA) system. It is subsequently decarboxylated via L-aromatic amino acid decarboxylase (AAAD) into 18F-dopamine (FDA), which is then trapped in the presynaptic vesicles (trapping compartment) and/or further metabolized into l-3,4-dihydroxy-6-[18F]fluorophenylacetic acid (FDOPAC) and [18F]6-fluoro-homovanillic acid (FHVA), which are capable of leaving the brain. 18F-Fluorodopa in plasma and brain is also metabolized by catechol-O-methyl-transferase (COMT) into 3-O-methyl-[18F]fluoro-DOPA (3OMFD), which crosses the BBB via the same LNAA system. It is usually assumed that in the healthy state, the accumulation of FDA in synaptic vesicles accounts for most of the striatal radioactivity for the first 90 to 120 minutes after FD administration.
18F-Fluorodopa kinetics are fairly complex, particularly because of the presence of its metabolites in both plasma and tissue. Models have been developed to isolate the rate constants of the three main distinct processes involved in FD metabolism: transport of FD across the BBB, FD decarboxylation, and the tissue ability to retain FDA and its metabolites (Kuwabara et al., 1993; Cumming and Gjedde, 1998; Huang et al., 1991). The statistical quality of the PET data, however, often fails to support the definition of all of the rate constants describing these processes. Thus, a simpler method is commonly used for the analysis of FD uptake, based on the graphical approach developed by Patlak et al. (1983) modified for the case of FD by Martin et al. (1989). The basic principle of this method is that accumulation of the tracer into an irreversible compartment can be reliably identified even if the intermediate reversible components of the tracer kinetics are not fully identified or known. If steady state between compartments is reached and an irreversible compartment exists, a linear relation is obtained between the ratio of the specific compartment and plasma radioactivity and the ratio between the running integral and the instantaneous value of the plasma radioactivity (often denoted as “stretch time”). The slope of the straight line yields the FD uptake rate constant Ki (Ki = K1k3/(k2 + k3)), where K1 is the first-order rate constant for transfer of FD from plasma into brain, k2 the rate constant for the return of free FD from brain back to plasma, and k3 the rate constant describing the trapping of brain FD by DOPA decarboxylase. Although Ki does not provide information about each of the three steps described above separately, it has been always interpreted as a marker of DA synthesis and storage.
The Patlak-based graphical approach has also been extended to include a tissue input function (Patlak and Blasberg, 1985). The time–activity course of a region devoid of trapping, typically the occipital cortex or the cerebellum, is used as input. In this case, the stretch time corresponds to the ratio between the running integral and the instantaneous value of the reference region, and the slope of the straight line (Kocc) is equal to k2k3/(k2 + k3). An added complication with this approach is the presence of 3OMFD in the reference region, which artificially increases the input function and therefore biases the Kocc toward smaller values. Nevertheless, this method is very commonly used, because it significantly alleviates the scanning procedure, since no blood samples need to be taken. In addition, Kocc has been proven by many investigators to provide a sensitive discrimination between brain uptake in healthy volunteers and patients with PD. Several studies have compared the disease-discriminating ability of Ki and Kocc (Vingerhoets et al., 1994, 1996; Morrish et al., 1998; Takikawa et al., 1994; Leenders et al., 1990; Hoshi et al., 1993), with Kocc usually found to be the better discriminator.
The conventional interpretation of Ki and Kocc is as markers of DA synthesis and storage. They are evaluated using an irreversible model approach and are thought to be independent of the loss of FDA, represented by the first-order rate constant kloss, which occurs as a consequence of FDA release by the presynaptic vesicles and subsequent metabolism and transport out of the system. It has also been assumed that Ki and Kocc are equivalent measures of disease progression. In the present study, we investigated the validity and limitations of these assumptions. In particular, we explored a possible dependence of Ki and Kocc on FDA loss, and we examined the effect of the presence of 3OMFD on the values of Kocc. These investigations were performed by examining the Ki/Kocc ratio as a function of disease severity, by comparison of the disease severity estimations by Ki and Kocc, and by investigating the empirical results with simulation studies.
MATERIALS AND METHODS
Patient selection, scanning methods and region of interest placement
Three groups of subjects were selected in this study: 6 healthy volunteers, 9 subjects with very early PD (PD1 group), and 11 patients with more advanced PD (PD2 group). Disease duration, defined as time from the onset of symptoms as first noticed by the patient, was 3 years or less (mean duration 2.1 ± 0.8 years, mean ± SD) for PD1 (3 women and 6 men, age 62.9 ± 8.7, mean ± SD). Four of the nine patients were still untreated at the time of the study. Disease duration in PD2 (3 women and 8 men, age 62.2 ± 10.9 years, mean ± SD) was at least 5 years (mean duration 10.9 ± 5.2 years, mean ± SD). The healthy group comprised 2 men and 4 women of similar age (52.2 ± 8.4 years, mean ± SD) to the subjects in the PD1 and PD2 groups. The motor component of the Unified Parkinson's Disease Rating Scale was 11 ± 5 (mean ± SD, range 5 to 18) for PD1 and 30 ± 12 (mean ± SD, range 13 to 51) for PD2. Fifteen patients were taking levodopa/carbidopa (Sinemet; Merck Frosst, Canada), three patients were taking DA agonists, and four were taking antidepressant medication. All medication was stopped at least 12 h before the scan.
Twenty-four of the 26 subjects were part of another study and underwent a 4-h FD scan on a Siemens/CTI ECAT 953B PET tomograph (Siemens/CTI, Knoxville, TN, U.S.A.) (Spinks et al., 1992) operating in three-dimensional mode (Sossi et al., 1998) after injection of 7 mCi of FD (effective dose equivalent 4.2 mSV). All of the subjects received oral administration of 150 mg of the peripheral decarboxylase inhibitor carbidopa 1 h before FD injection. Data were corrected for attenuation using an external 68Ge source. The scanning sequence consisted of 9 × 10-minute scans, after which the patients could leave the bed for 30 minutes, followed by a final sequence of 12 × 10 minutes for a total of 240 minutes of elapsed time from injection. The repositioning was aided by use of a thermoplastic mask, which also helped to minimize head motion during the scan. Images from the first and second scanning sequences were coregistered using the AIR algorithm (Woods et al., 1993). Four 61-mm2 circular regions of interest (ROIs) were placed on each side of the striatum: one on the caudate nucleus and three on the putamen [anterior (P1), middle (P2), and posterior putamen (P3)]. Six 270-mm2 circular ROIs were placed on the occipital cortex in the five adjacent planes containing the striatum. All regions were applied to each frame of the dynamic sequence to generate the corresponding time–activity curves (TACs).
Thirty-seven arterial blood samples were taken to obtain the plasma radioactivity time course. Twelve were analyzed for metabolites to identify the FD and the 3OMFD plasma fractions. The metabolite separation was performed as previously described with an alumina extraction method with anion/cation exchange columns (McLellan et al., 1991; Doudet et al., 1998). With this method, the cation column captures the positively charged metabolites (FD and 6-fluoro-3-methoxytyramine) and the anion column the negatively charged metabolites FDOPAC and FHVA and sulfated conjugates. 18F-Fluorodopa and 3OMFD, both unretained by the columns, are then separated by alumina extraction.
The remaining two subjects underwent an identical scanning and data analysis protocol, with the exceptions that they were injected with 5 mCi of FD and scanning and blood sampling were stopped at 90 minutes after tracer administration. All studies received the approval of the University of British Columbia Ethics Committee. Informed consent was obtained from all subjects.
Estimations of Ki, Kocc, and Ki/Kocc
Ki and Kocc were determined using the Patlak graphical approach (Patlak et al., 1983; Patlak and Blasberg, 1985) described in the Introduction. The radioactivity in the specific compartment (trapped FDA) was obtained from the radioactivity determined in an ROI placed on the striatum after subtraction of the radioactivity present in an ROI placed on the occipital cortex (Martin et al., 1989). This subtraction eliminates the contribution of the 3OMFD from the radioactivity in the striatal ROI (Doudet et al., 1991). When the tissue input function is used, there is a further residual influence of 3OMFD; the radioactivity values measured in the reference region contain an indistinguishable contribution from 3OMFD.
In the absence of 3OMFD, the ratio between Ki and Kocc is by definition equal to the distribution volume K1/k2, if all model assumptions are satisfied for the entire time-course. It has been shown that the K1/k2 value does not change as a function of disease (Kuwabara et al., 1995). It has also been shown that the metabolism of FD to 3OMFD is disease independent (Chan et al., 1991). When 3OMFD is present, the Ki/Kocc ratio is expected to increase because of the bias in Kocc. If no disease-dependent bias is introduced by the analysis methods, and if the irreversibility assumptions (see Introduction) are satisfied, this ratio should be the same in all three groups—healthy, PD1, and PD2. The following analyses were performed to investigate the consistency of the methods: Ki and Kocc were calculated for the caudate and putamen separately for the time spans 0 to 70 and 0 to 90 minutes after injection. Ki/Kocc ratios were calculated in each case. Ki, Kocc and the Ki/Kocc ratio were compared among the three groups for the caudate and putamen separately for each time span.
Disease severity
If all the model assumptions are satisfied and the Ki/Kocc ratio is indeed proportional to K1/k2, Ki and Kocc should be equivalent estimators for the deterioration of the dopaminergic system and thus of disease severity or progression. Disease severity was defined as the values of Ki and Kocc in the disease groups PD1 and PD2 relative to those in the healthy group (PD1/N and PD2/N) and was estimated for caudate and putamen separately for each time span.
Simulations
To investigate the effect of kloss on the determination of Ki and Kocc and their ratio, and a disease-dependent effect of 3OMFD on Kocc, a method that used a combination of simulation and measured data was developed. Compartmental analysis was applied to the average putaminal TACs (obtained by averaging the TAC of the six ROIs placed on the putamen) and average occipital cortex TACs (obtained by averaging the TAC of the six ROIs placed on the occipital cortex) for a randomly chosen subset of the healthy group (five subjects) and a subset of the PD2 group (seven subjects). The measured FD and 3OMFD input functions were used together with the model described in Fig. 1. The data included in the fitting procedure spanned all 4 h of the scanning protocol. First the occipital cortex data TACs were fitted with four free parameters: K1′, k2′, K1m′, and k2m′, where K1′ and k2′ are the first-order rate constants describing the transfer from plasma into tissue and the reverse for FD, K1m′ and k2m′ are the corresponding parameters for 3OMFD, and the prime symbol indicates rate constants evaluated for the reference region. Because the putaminal TACs do not support the determination of every individual rate constant, the fit was then performed with K1m and k2m constrained to equal K1m′ and k2m′ and three remaining free parameters: K1, k2, and k3. Because a reliable value for kloss could not be obtained from the data, possibly because of the lack of fine temporal sampling of the PET data immediately after tracer injection, its values were constrained to two test pairs: 0.001 for the healthy group and 0.003 for the PD2 group, and 0.002 for the healthy group and 0.004 for the PD2 group (Huang et al., 1991). Two test sets were used to reflect the range of values existing in the literature and those obtained in our DA turnover studies (Sossi et al., 2002).
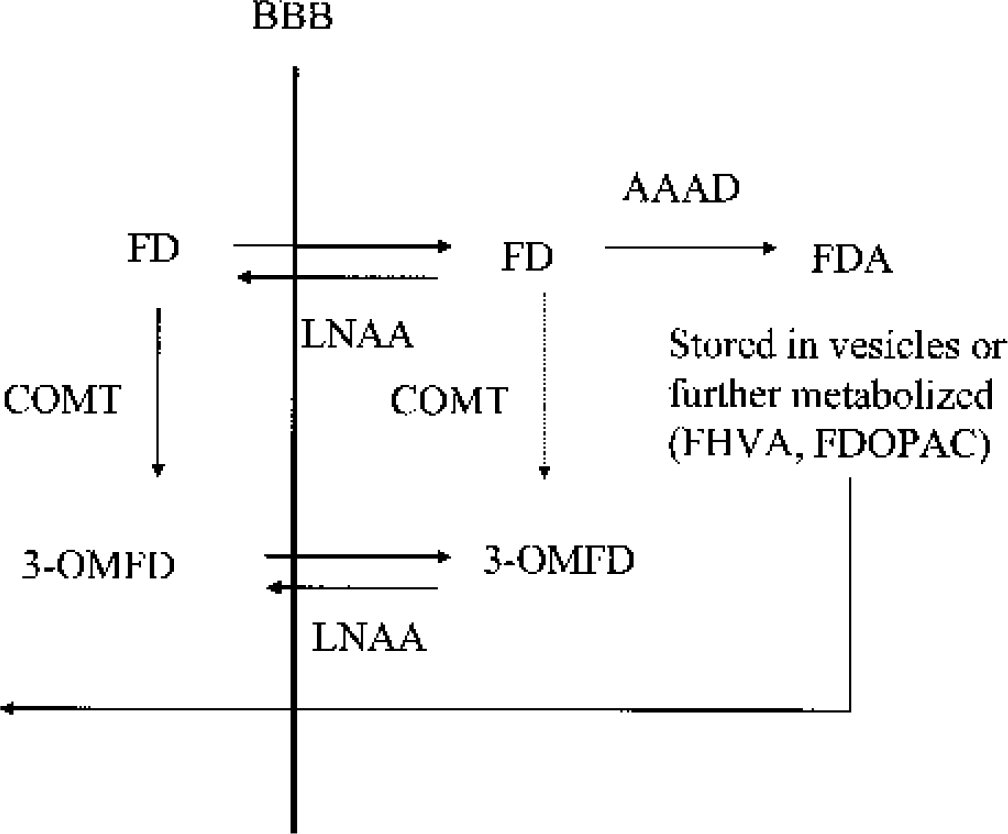
18F-Fluorodopa (FD) kinetics in the striatum. 18F-Fluorodopa is transported across the blood–brain barrier (BBB) via the large neutral amino acid (LNAA) system. It is subsequently decarboxylated by l-aromatic amino acid decarboxylase (AAAD) into [18F]fluorodopamine (FDA), which is then trapped in the presynaptic vesicles and/or further metabolized into l-3,4-dihydroxy-6-[18F]fluorophenylacetic acid (FDOPAC) and [18F]6-fluoro-homovanillic acid (FHVA), which are capable of leaving the brain. 18F-Fluorodopa in plasma and brain is also metabolized by catechol-O-methyl-transferase (COMT) into 3-O-methyl-[18F]fluoro-DOPA (3OMFD), which crosses the BBB via the same LNAA system. The amount of FD O-methylation in brain is generally considered negligible. 18F-Fluorodopa kinetics in the reference region are considered identical except for the lack of the FD conversion into FDA.
Once the values of the parameters were obtained, nearly noiseless TACs for the putaminal and occipital cortical regions were formed using the model equations and the measured plasma FD and 3OMFD TACs. The first 90 minutes of these TACs together with the measured FD input function were then used to calculate the model values for Ki and Kocc, Ki-mod and Kocc-mod. Ki-mod and Kocc-mod were compared with the measured Ki and Kocc for each subject to ensure that the fitted values for the rate constants were in a reasonable range. Because the scanning protocol did not include very fine PET time sampling, a direct comparison of the individual parameter values to those obtained in the literature was not appropriate. The purpose of this fitting procedure was not to find highly accurate individual parameters values but to obtain estimates realistic enough to yield the experimental uptake rate constant values. By subsequently setting the appropriate individual parameters to zero and recalculating Ki and Kocc, an estimate of the impact of the individual components on Ki and Kocc was obtained.
When thus validated, Ki-mod and Kocc-mod were recalculated for each subject under the following conditions: (1) kloss = 0; (2) K1m = 0; and (3) kloss = K1m = 0. Conditions 1 and 2 showed the separate effects of kloss and 3OMFD on Ki and Kocc, whereas condition 3 explored the effects of possible interactions between the uncorrected presence of 3OMFD and kloss.
RESULTS
Effect of scan duration on Ki and Kocc and disease severity estimates
Table 1 shows the group average values of Ki, Kocc, and the corresponding disease severity estimates for the two time spans. The value of Ki does not change as a function of time interval for any group. It exhibits the typical rostrocaudal gradient for the PD group. The value for Kocc calculated over 70 minutes is larger than Kocc calculated over 90 minutes for all three groups. This is indicative of a curvature in the tissue input Patlak plot shown in Fig. 2 (see Results—simulations). It is interesting to note that a curvature is present even in the data obtained for the healthy group as observed by Hoshi et al. (1993).
Ki and Kocc values averaged over the subjects of each group for the two time ranges: 0 to 70 minutes and 0 to 90 minutes after injection
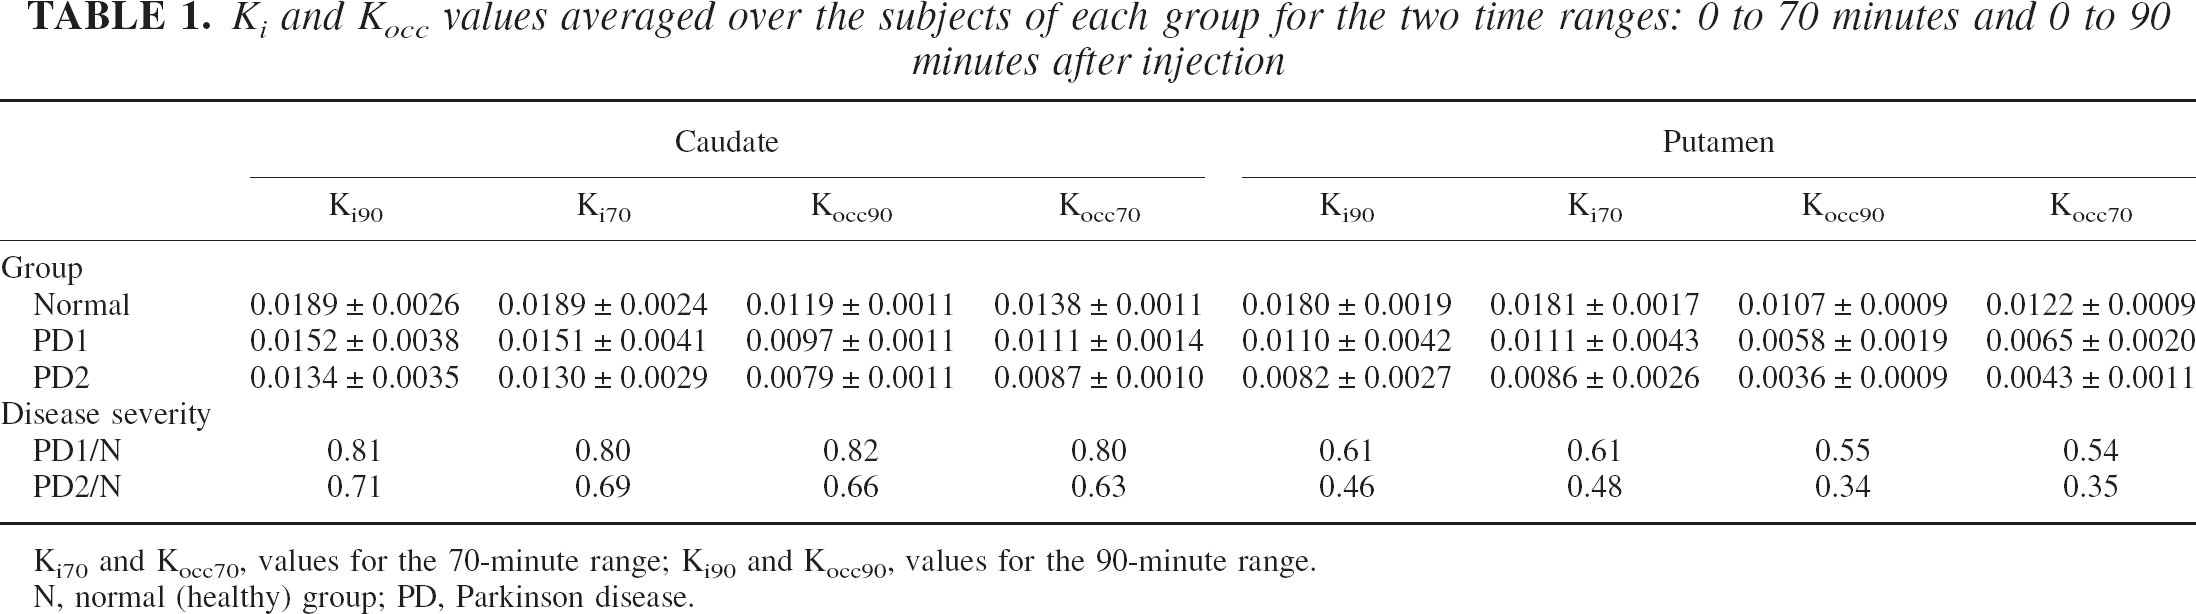
Ki70 and Kocc70, values for the 70-minute range; Ki90 and Kocc90, values for the 90-minute range.
N, normal (healthy) group; PD, Parkinson disease.
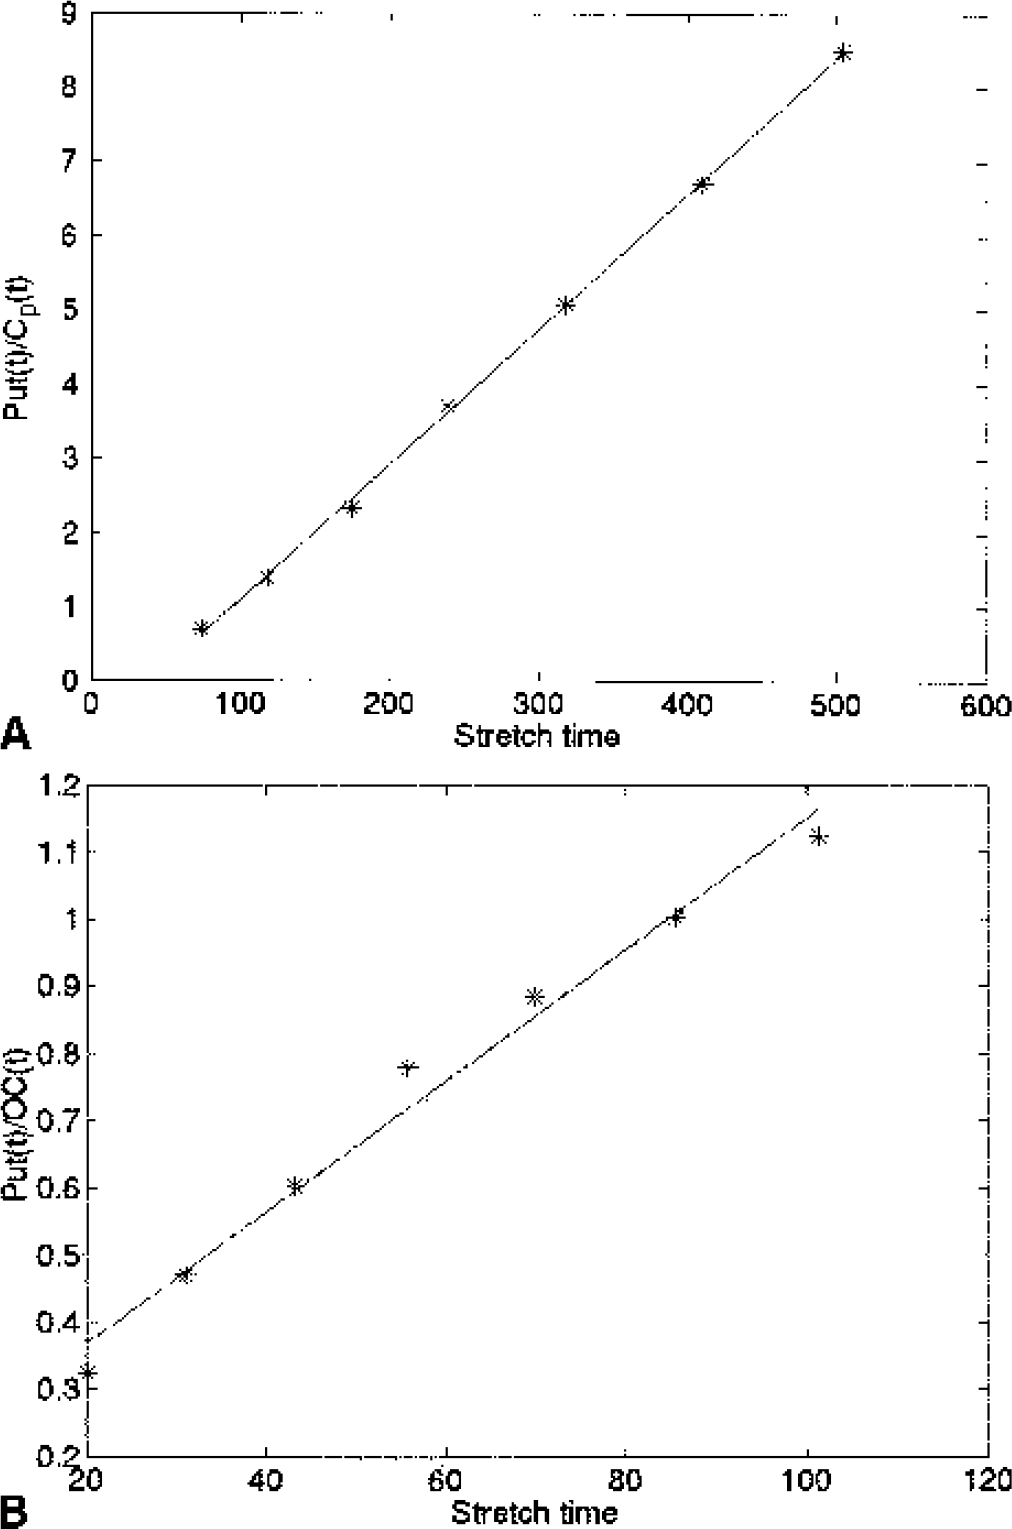
Example of a plasma input
The effect of disease severity on the magnitude of Kocc exceeds the effect on Ki, and the amount of discrepancy between the assessment obtained with Ki and Kocc increases as a function of disease severity. Thus, the discrepancy is very small for the caudate of the PD1 group but becomes progressively larger for the caudate of the PD2 group, the putamen of the PD1 group, and, finally, the putamen of the PD2 group, thus following the expected topologic pattern of disease progression.
Ki/Kocc ratios
The Ki/Kocc ratios averaged over the subjects of each group are shown in Table 2. Very similar results were obtained for both time spans: there is no difference in the ratio between the healthy group and PD1 for the caudate. The ratio is higher for the PD2, but these increases did not reach statistical significance. For the putamen, a borderline significant difference in the ratio was found between the PD1 and PD2 (P = 0.05, two-sided t-test for the 90-minute data and P = 0.07 for the 70-minute data) and a highly significant difference between the healthy and PD2 groups (P < 0.005, two-sided t-test for both the 70- and 90-minute data). No significant difference was found between the healthy and PD1 putamen Ki/Kocc ratios (P = 0.24, two-sided t-test for the 90-minute data and P = 0.14 for the 70-minute data), but a very significant difference was found when the comparison was made between the healthy and the PD1 and PD2 groups taken together (P < 0.005, two-sided t-test for both time spans).
Ki/Kocc ratios calculated for each time span, averaged over subjects of each group, for the caudate and the putamen
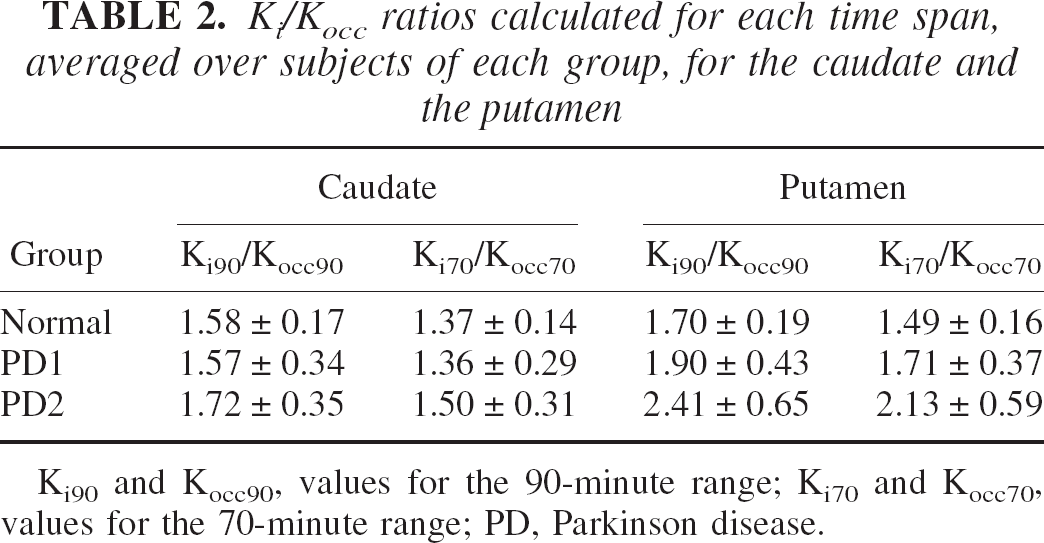
Ki90 and Kocc90, values for the 90-minute range; Ki70 and Kocc70, values for the 70-minute range; PD, Parkinson disease.
These results, together with the discrepant assessment of disease severity by Ki and Kocc, indicate that the two uptake rate constants must be differentially sensitive to some other effect in addition to being markers of DA synthesis and storage. As previously mentioned, FDA loss and 3OMFD were identified as possible candidates to explain the discrepancy.
Simulations
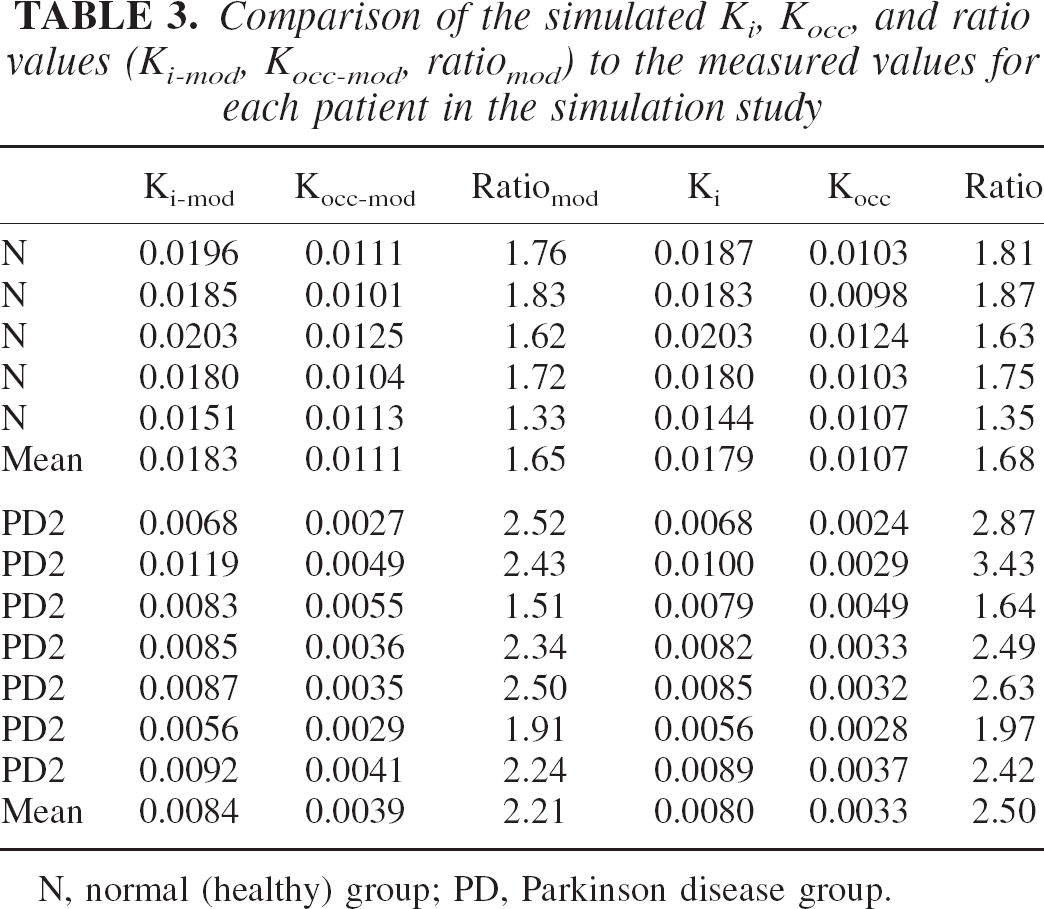
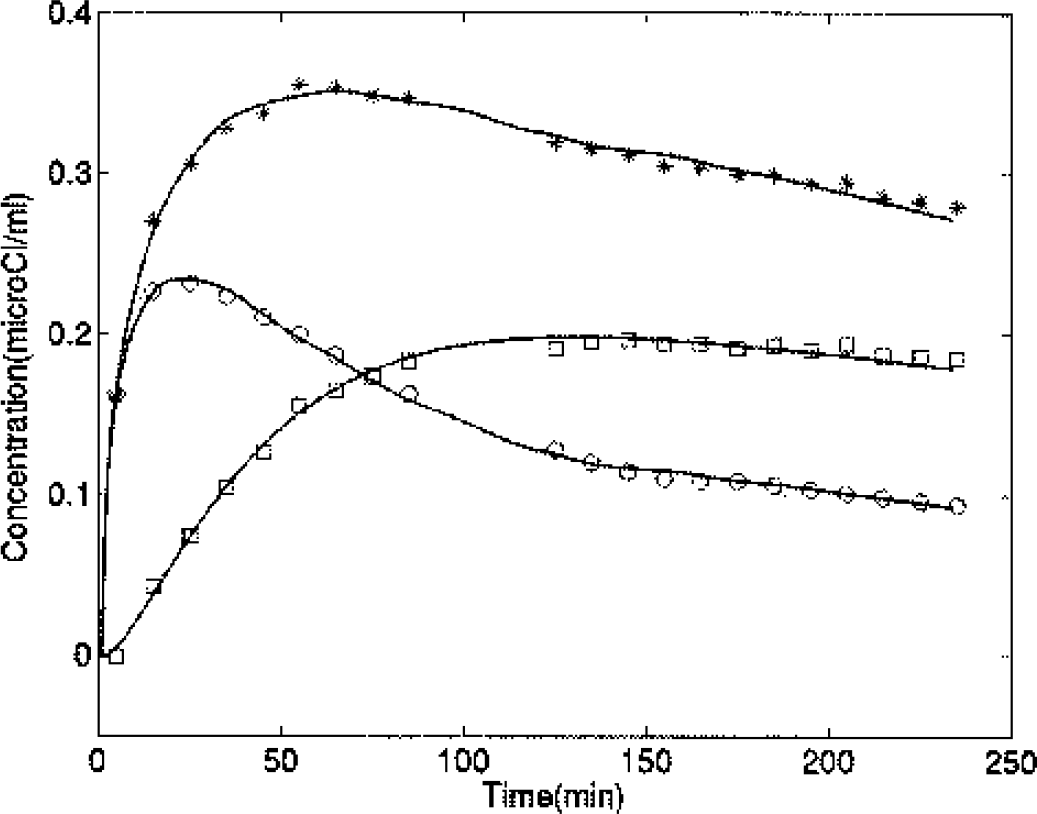
Table 3 shows the Ki-mod, Kocc-mod, ratiomod (Ki-mod/Kocc-mod) together with the actual measured values for putaminal TACs for the 12 subjects included in the simulation study. Data presented here were obtained by setting kloss to 0.002 for the healthy group and to 0.004 for PD2. There is very good agreement between the measured and simulated parameter values. The Pearson correlation coefficient r between the model and measured values was 0.99 for Ki, 0.99 for Kocc, and 0.9 for the ratio. Figure 3 shows an example of the fit obtained from the model. Although an accurate determination of the individual rate constant was beyond the scope of this study (see Materials and Methods), the values obtained were in general agreement with published values (Cumming and Gjedde, 1998). The mean ± SD value of k3 was 0.021 ± 0.008 in the healthy group and 0.010 ± 0.005 for PD2. The mean FD DV (DV = K1′/k2′) in the cortical region was 1.03 ± 0.35, the mean 3OMFD DV was 1.27 ± 0.20, and the mean FD DV in the striatal region was 1.89 ± 0.85. The latter value was somewhat higher than published values (Kuwabara et al., 1993); this could reflect several factors, including the type of constraints imposed on the individual rate constants and the lack of fine time sampling in the PET scan in the early minutes of the scan.
Comparison of the simulated Ki, Kocc, and ratio values (Ki-mod, Kocc-mod, ratiomod) to the measured values for each patient in the simulation study
N, normal (healthy) group; PD, Parkinson disease group.
Example of time–activity curves from measured data (*, putamen; ○, occipital cortex; □, putamen minus occipital cortex) and the corresponding fits (solid lines) for a healthy patient.
Table 4 shows the Ki-mod, Kocc-mod, and ratiomod values for the four conditions evaluated: (1) all parameters as defined from the fit; (2) kloss = 0; 3. K1m = 0; and (4) kloss = K1m = 0. Figure 4 shows characteristic examples of the simulated Patlak plots obtained for each condition for both the tissue input and the plasma input methods. It can be seen that most of the curvature in the tissue input Patlak plot is because of the presence of 3OMFD.
Ki-mod Kocc-mod, and ratiomod for the four cases simulated
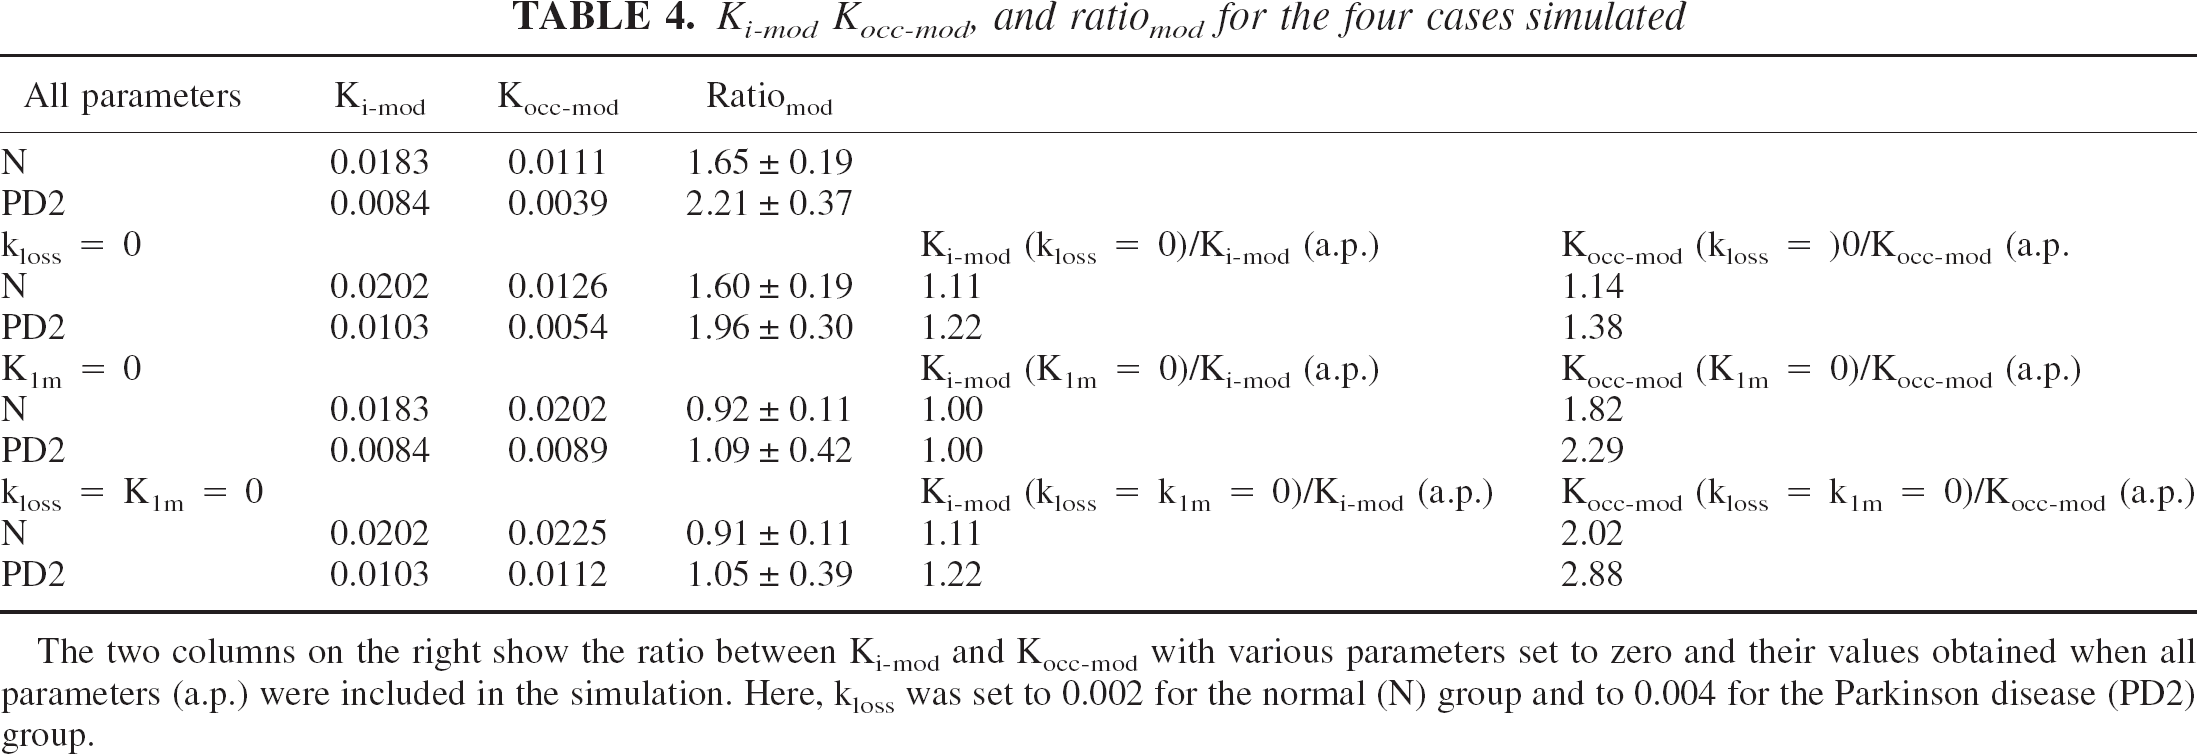
The two columns on the right show the ratio between Ki-mod and Kocc-mod with various parameters set to zero and their values obtained when all parameters (a.p.) were included in the simulation. Here, kloss was set to 0.002 for the normal (N) group and to 0.004 for the Parkinson disease (PD2) group.
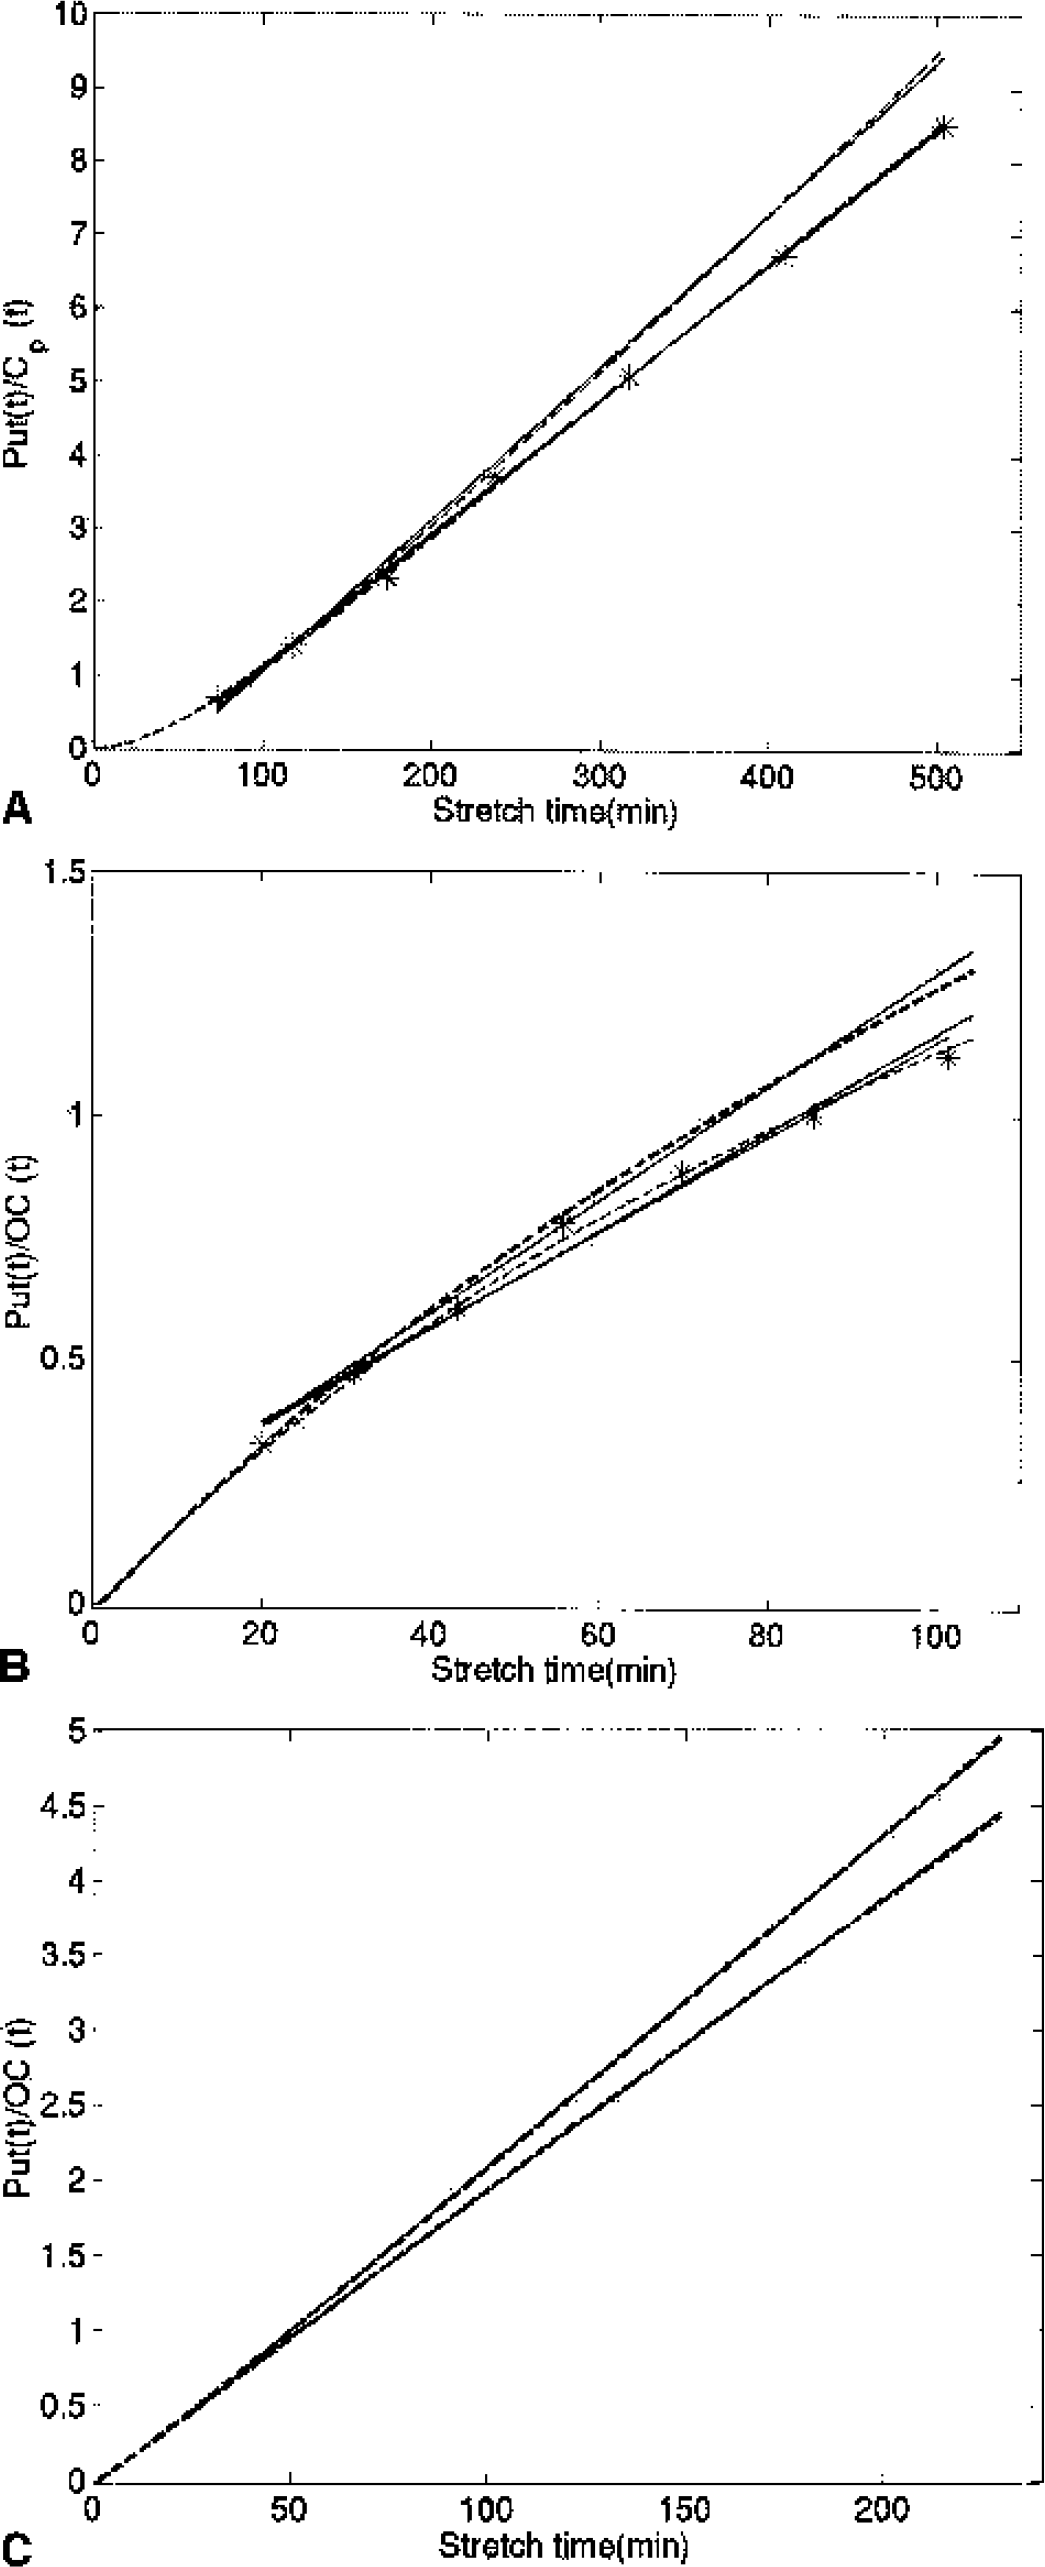
Patlak plots obtained from simulated and measured data.
Disease severity assessment
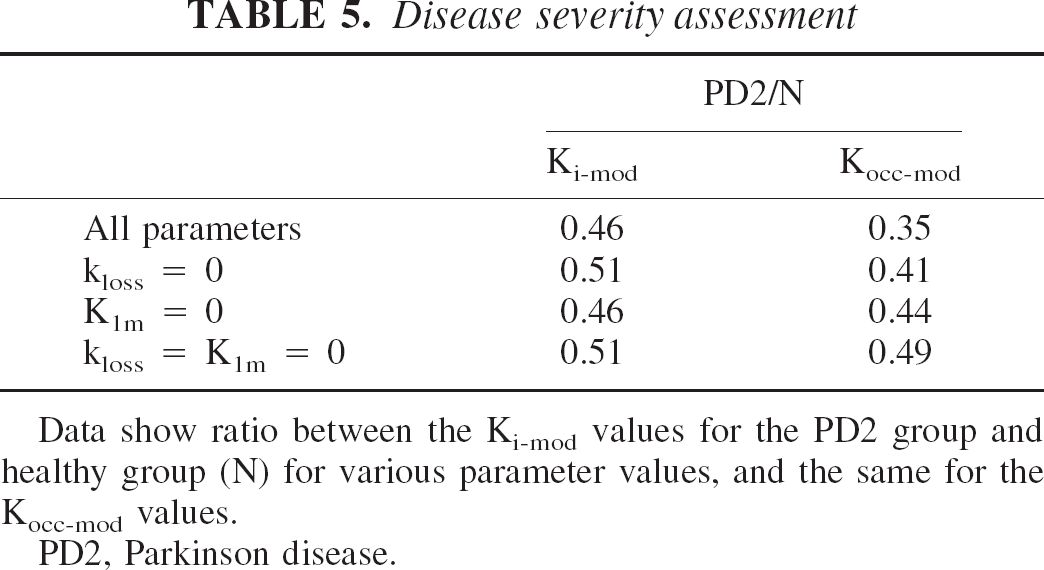
Data show ratio between the Ki-mod values for the PD2 group and healthy group (N) for various parameter values, and the same for the Kocc-mod values.
PD2, Parkinson disease.
The conclusions obtained with the simulation performed by setting kloss = 0.001 for the healthy group and kloss = 0.003 for the PD2 group were very similar to those described previously and are summarized in Table 6. The kloss values considered fall in the lower limit of the published kloss value range. A higher kloss value would further confirm these conclusions.
Ki-mod, Kocc-mod, and ratiomod for the four cases simulated
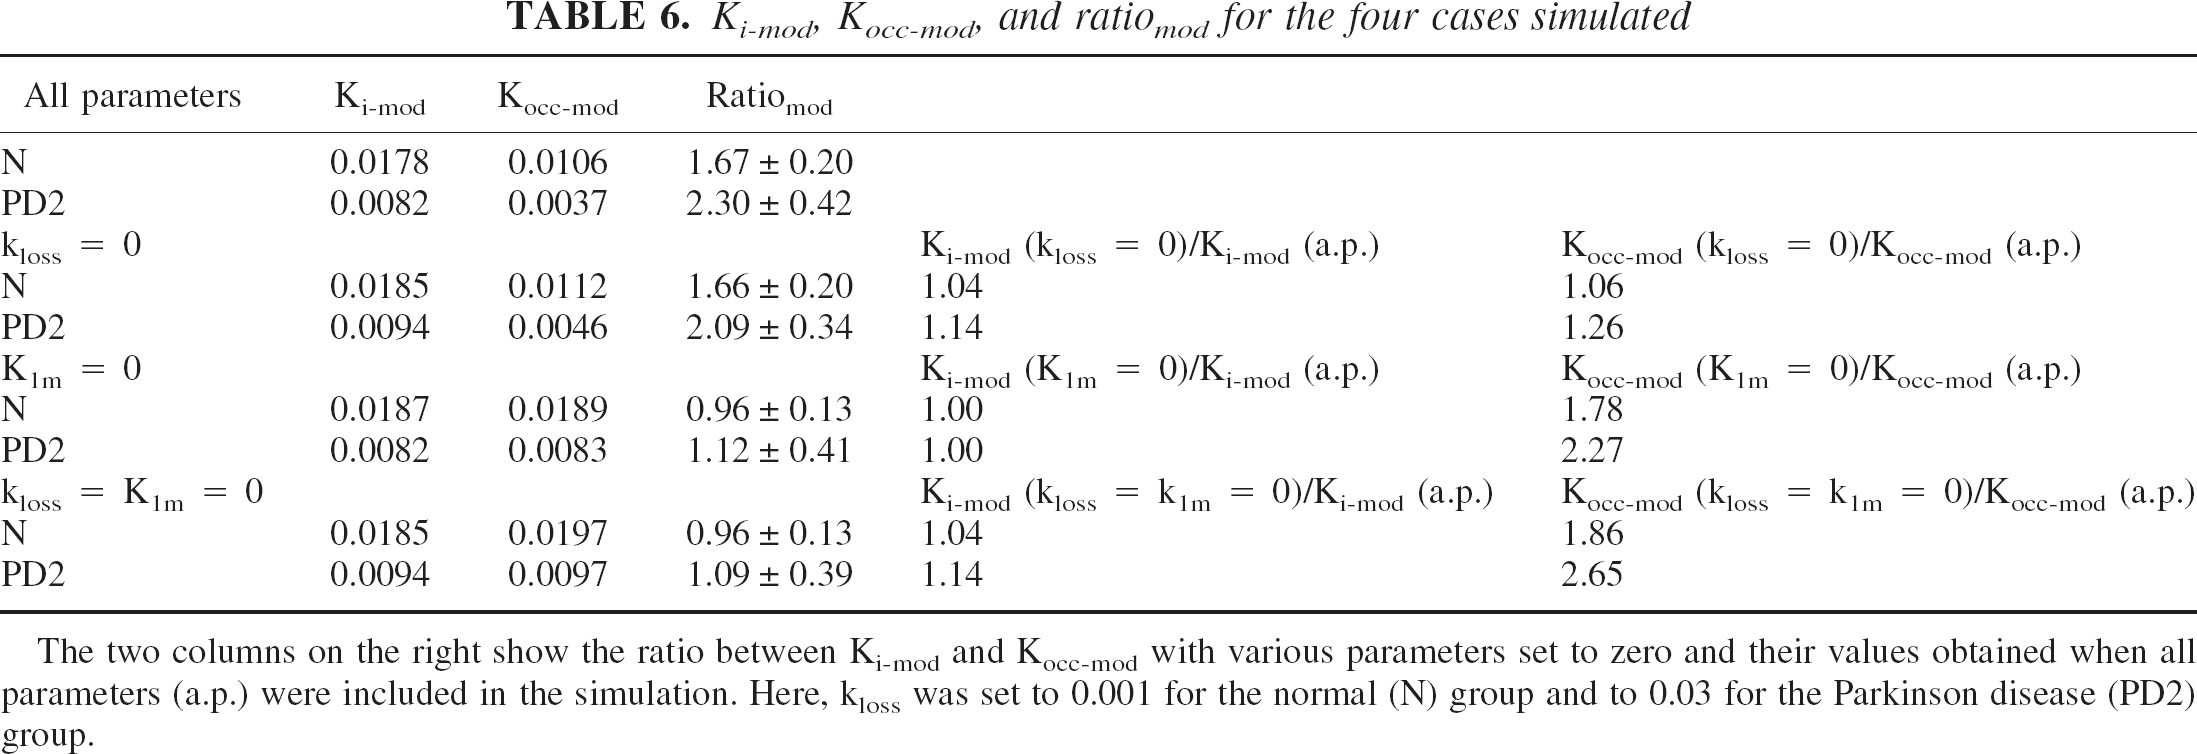
The two columns on the right show the ratio between Ki-mod and Kocc-mod with various parameters set to zero and their values obtained when all parameters (a.p.) were included in the simulation. Here, kloss was set to 0.001 for the normal (N) group and to 0.03 for the Parkinson disease (PD2) group.
DISCUSSION
Two important conclusions can be derived from this study: Ki and even more so Kocc are not pure measures of DA synthesis and storage but are sensitive to DA loss even when they are calculated using only the first 90 minutes of data after tracer injection. The second conclusion is that 3OMFD introduces a disease-dependent bias in the Kocc estimate because of the interaction between the effect of kloss and 3OMFD in the input function.
The first finding is in apparent contradiction with the assumption that FD behaves as an irreversibly trapped tracer for the first 90 minutes after tracer injection and is therefore suitable for a Patlak graphical analysis. A close examination, however, of the Ki Patlak plots obtained in the simulation study (Fig. 4) shows that, during the first 90 minutes after tracer injection, the presence of kloss manifests itself as a reduction of the slope values; its effects are thus indistinguishable from those of a decrease in the trapping rate k3. It is also reasonable to assume that the influence of kloss manifests itself even earlier than 90 minutes after tracer injection. No difference was found in the Ki values estimated from 70 or 90 minutes of the acquired data. Only in very advanced disease is a curvature in the data during the first 90 minutes observed (unpublished data), and in that case a reduction of the time span over which the Ki is calculated might produce more accurate results. Such an approach would, however, introduce some degree of arbitrariness in the analysis method, since the final time point for analysis would have to be determined on a case-by-case basis.
The 3OMFD-based amplification of the kloss effect on Kocc arises because the presence of 3OMFD introduces an additional downward curvature in the data (Figs. 2 and 4) due to the inaccurate determination of the true input function from the occipital cortex. In this case, the stretch time contains a time-dependent component related to 3OMFD, which is absent in the value plotted in the y-axis, thus decreasing the correlation between the two axes. This disease-amplifying bias might explain why Kocc has in many cases been found to be the most sensitive marker for disease and the best disease progression discriminator (Vingerhoets et al., 1994; Morrish et al., 1998).
The fact that both Ki and Kocc are sensitive to kloss implies that to some extent they are also measures of storage capacity or turnover time, especially in advanced stages of disease, when the loss rate is higher (Doudet et al., 1998). In these extreme cases, when a clear curvature is apparent even in the Ki Patlak plots (data not shown), it becomes questionable whether the Patlak analysis can still be applied, because a deviation from a straight-line relation is itself indicative of a certain degree of reversibility. Certainly, at least in these cases, the interpretation of Ki and Kocc must be revisited. This consideration would lead to an intriguing interpretation of situations where a change in Ki or Kocc is observed after an intervention such as cell transplant, which is generally performed on patients with very severe disease: does an increase in Ki or Kocc calculated over the first 90 minutes of data really reflect an increase in DA synthesis, thereby implying that the transplanted cells are capable of DA synthesis, or is it mostly indicative of an increase in storage capacity because of the ability of the transplanted cells to store DA, but not necessarily produce it? More studies are required to investigate this issue.
CONCLUSIONS
The Patlak graphical method is often used to quantify the FDA synthesis and storage rate Ki or Kocc using the plasma or the tissue input function respectively. Results shown in this study suggest that both uptake rate constants are influenced by the FDA release by the presynaptic vesicles and subsequent metabolism and transport out of the system and are thus not pure estimates of DA synthesis. Furthermore, the presence of 3OMFD in the tissue input function introduces a disease-dependent bias in the effect of kloss on Kocc. Consequently different quantitative assessments of disease progression or severity are obtained from Ki and Kocc. Care must thus be taken when relating the meaning of Kocc and Ki to specific processes and when quantifying changes in disease state, especially in situations of advanced disease.
Footnotes
Acknowledgments:
The authors thank the UBC/TRIUMF PET group for patient scanning and image analysis.