
Abstract
The integrity of the dopaminergic system can be studied using positron emission tomography. The presynaptic tracers [11C]-methylphenidate and [11C]dihydrotetrabenazine (DTBZ) are used to investigate the dopamine transporter availability, the dopamine vesicular transporter integrity; the post-synaptic tracers [11C]-raclopride and [11C]-Schering 23990 (SCH) are used to probe the D2 and D1 receptors. These are reversible tracers, where the binding potential (BP) = Bmax/Kd often is used to quantify the amount of their specific binding to the sites of interest. The simplified tissue input methods to calculate BP are attractive, since they do not require a blood input function. The suitability and performance of two such methods were evaluated: the Logan graphical tissue method, and the Lammertsma reference tissue method (RTM). The BP estimates obtained with the two methods were nearly identical in most cases, with similar reliability and reproducibility indicating that all four tracers satisfy the assumptions required by each method. The correlations among the fitted parameters obtained from the RTM were estimated and were found not to introduce noticeable bias in the RTM BP and R1 estimates. R1 showed low intersubject and intrasubject variability. The k2 estimate showed good reliability for SCH with cerebellar input function and DTBZ with occipital input function.
[11C]-Methylphenidate (MP), [11C]dihydrotetrabenazine (DTBZ), [11C]-raclopride (RAC) and [11C]-Schering 23990 (SCH) provide complementary information on the integrity of the dopaminergic system using positron emission tomography (PET).
Methylphenidate inhibits dopamine reuptake and enhances synaptic dopamine levels. One of its isomers, d-threo-methylphenidate, has been labeled with 11C (MP) (Ding et al., 1994) for PET. Its binding in the human brain is reversible, highly reproducible, and saturable, and thus MP is deemed an appropriate PET ligand to measure dopamine transporter availability (Volkow et al., 1995).
Dihydrotetrabenazine is one of the metabolites of tetrabenazine, a high-affinity inhibitor of the type 2 vesicular monoamine transporter. Dihydrotetrabenazine binds to the type 2 vesicular monoamine transporter and blocks the storage of monoamine neurotransmitters in presynaptic vesicles (Pletscher et al., 1962; Henry and Scherman, 1989). Dihydrotetrabenazine labeled with 11C (DTBZ) is used in PET to examine in vivo the integrity of striatal presynaptic monoaminergic terminals (Koeppe et al., 1996; Koeppe et al., 1995) and to estimate neuronal losses in aging (Frey et al., 1996) and neurodegenerative disease (Frey et al, 1996; Gilman et al., 1996). In these studies, (±-α-DTBZ was used.
The postsynaptic tracer SCH has been widely used as a ligand to study dopamine D1 receptor function using PET (Farde et al., 1987; Suhara et al., 1991; Farde et al., 1992; Shinotoh et al., 1993). Likewise, RAC, a D2 receptor antagonist, is commonly used to study dopamine D2 receptor function (Farde et al., 1985).
All of these tracers are reversible, although with different time courses, and several analysis methods have been proposed. They range from standard compartmental analysis, which requires dynamic scanning and a plasma input function (IF), to simplified ratio methods where only a static image at a certain time interval after injection and the definition of a reference region devoid of specific binding are required. Several comparisons of the various methods have been reported (Lammertsma et al., 1996; Chan et al., 1998; Chan et al., 1999).
A common measure that quantifies the tracer binding is the binding potential (BP): BP = k3/k4, where k3 is the rate constant for transfer from free to bound compartment and k4 is the rate constant for transfer from bound to free compartment. In this study, we compare BP values obtained by two tissue input methods, the Logan graphical approach (Logan et al., 1996) and the Lammertsma simplified reference tissue method (Lammertsma and Hume, 1996) with the Gunn implementation (Gunn et al., 1997)(RTM) for all four tracers. Both methods are attractive in that they do not require a plasma IF, thus eliminating the need for arterial blood sampling and consequently reducing the burden of the scanning procedure. The Logan method requires secular equilibrium between the bound ligand and the other tissue kinetic components during the scanning procedure but makes no assumptions about details of the compartmental model. On the other hand, the RTM makes no assumptions about even secular equilibrium but imposes constraints on the number of compartments. Therefore, there could be a priori differences in BP estimates by the two methods as a consequence of the kinetic behaviors of the tracers. The BP estimates obtained from the two methods were compared in terms of absolute values and robustness. Reproducibility and reliability (see Analysis) were used to assess robustness of each method.
In addition to BP, the RTM provides an estimate of the rate constant for transfer from free to plasma compartment, k2, and the ratio of the rate constants for transfer from plasma to free compartment (k1) between target and reference region: R1 = k1/k′1. However, the RTM does not estimate BP, R1, and k2 directly but derives them from algebraic combinations of the directly fitted parameters (see Methods). We have found significant covariances among these parameters, which might affect the precision and accuracy of the BP, R1, and k2 estimates. Therefore, we also investigated the reproducibility and accuracy of R1 and k2. Where adequate, results from the standard compartmental analysis were used as a reference. Although the compartmental model approach may suffer from noise introduced by plasma metabolite separation and plasma radioactivity counting statistics, it does not require any assumptions on the tracer kinetics and is therefore expected to be free of systematic bias. This study thus is divided into five parts, with the main focus being the comparison of the BP values obtained by the two methods and their robustness: examination of the kinetics of the four tracers, comparison of the BP values, estimation of reliability and reproducibility of the BP values provided by each method, evaluation of RTM fitted parameter covariances, and estimation of the reliability and reproducibility of R1 and k2.
METHODS
Subjects and scanning protocol
Ten normal volunteers were scanned using DTBZ, SCH, and RAC; mean ages were 54.9 ± 17.9, 50.5 ± 18.4, and 51.3 ± 16.4 years, respectively. Seven normal volunteers were scanned using MP; mean age was 47.6 ± 13.7 years. The subjects recruited for the SCH, DTBZ, or MP study underwent a repeat scan approximately 14 days after the first scan to evaluate the reproducibility of the measurement and the analysis method. All subjects gave written informed consent before each scan. The study was approved by the Human Ethics Committee of the University of British Columbia.
The scanning protocol was the same for all of the tracers and consisted of 4 × 60 seconds, 3 × 120 seconds, 8 × 300 seconds, and 1 × 600 seconds. For DTBZ, MP, and SCH, 23 blood samples also were taken, and 5 were analyzed for metabolites. The metabolite-corrected plasma data were used to perform a standard compartmental analysis to complement the comparison of these methods. All scans were taken on the ECAT 953B (Spinks et al., 1992) in two-dimensional mode except for the RAC scans, which were performed in three-dimensional mode. Details of the processing of the three-dimensional data can be found elsewhere (Sossi et al., 1998). All scans were corrected for attenuation using a 68Ge transmission scan.
Tracer preparation
SCH. 11C-SCH 23390 was synthesized by N-methylation of the desmethyl precursor analog (SCH 24518) using [11C]methyliodide (Ravert et al., 1987). Carbon-11-methyliodide was reacted with 1.5 mg of SCH 24518 (free from salt) in 450 μL of dimethyl formamide. The reaction was performed in a dry ice/isopropanol bath for 5 minutes at 55°C with constant stirring. The product then was purified on a silica HPLC column. Radiochemical yield was 50% to 60%. The desmethyl precursor of SCH 23390 was supplied by Schering Plough Pharmaceutical Corporation (Bloomfield, NJ, U.S.A.). The specific activity of [11C]SCH 23390 was 448 ± 232 Ci/mmol (mean ± SD; range, 190 to 1,189 Ci/mmol) at ligand injection, and the radiochemical purity was more than 99%.
DTBZ. A modification of the method described by Kilbourn et al. (1995) was used to synthesize (±)-α-[11C]DTBZ. Briefly, (±)-9-o-desmethyl-α-DTBZ was methylated with 11C-methyliodide in a mixture of dimethyl sulfoxide/sodium hydroxide. The product was purified by HPLC and obtained with more than 95% radiochemical purity. The specific activity was 1501 ± 1008 Ci/mmol (mean ± SD; range 321 to 3204 Ci/mmol) at ligand injection.
MP. The [11C]d-threo-methylphenidate was synthesized by a modification of the procedure reported by Ding et al. (1994). Briefly, an N-protected d-threo-ritalinic acid derivative was methylated with 11C-methyliodide. The labeled intermediate was deprotected and purified on a C-18 Sep Pak (Walter Corporation, Milford, MA, U.S.A.) followed by an Accel ion exchange SepPak (Walter) (Adam et al., 1997). The product was obtained in 60% radiochemical yield with more than 95% radiochemical purity. The specific activity was 402 ± 248 Ci/mmol (mean ± 1 SD; range 100 to 820 Ci/mmol) at ligand injection.
RAC. 11C Methyl-iodide was bubbled through a solution of dihydro-raclopride precursor in dimethylsulfoxide. The mixture then was heated to 85°C for 5 minutes and subsequently purified by HPLC. This is a modified procedure based on the method developed by Ehrin et al. (1987). The specific activity was 3544 ± 1243 Ci/mmol (mean ± SD; range 1938 to 5658 Ci/mmol) at ligand injection.
ANALYSIS
Region of interest placement
For each scan, seven consecutive axial image planes containing the striatum were summed to produce a composite image. Four circular (61 mm2) regions of interest (ROI) were placed on each striatum, one on the caudate and three without overlap along the longitudinal axis of the putamen, and six circular ROI (297 mm2) on the occipital cortex (OC). In addition, two consecutive slices containing the cerebellum were summed, and one oval ROI (556 mm2) was placed on the cerebellum. These ROI were replicated on images obtained from each time frame. Time-activity curves thus were obtained for the left and right caudate, left and right putamen (average of the three ROI values), OC, and cerebellum.
Analysis methods
The Logan method determines the distribution volume ratio according to the equation 1.
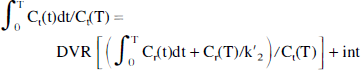
where Ct(t) is the tracer concentration in the target region, Cr(t) is the tracer concentration in the reference region, and k′2 is the population-derived k′2 value. This method requires the tracer kinetics to satisfy the following assumptions: steady state must be reached during the course of the study, the ratio of the influx/efflux constants is the same in the target and reference regions (k1/k2 = k′1/k′2), and a population k′2 value can be used. The steady-state requirement refers to the equilibrium between the bound ligand and other tissue kinetic components, and thus the graphic plot may become a straight line even before true equilibration is reached (Logan et al., 1996). This is a two-parameter method, with the variable of interest being BP (BP = DVR − 1), with no specific assumptions about the number of compartments. The k′2 values used in this study were derived from compartmental analysis: SCH 0.061 (OC IF) 0.101 (cerebellar IF), MP 0.039 (OC IF) 0.055 (cerebellar IF), DTBZ 0.073 (OC IF) 0.086 (cerebellar IF), and RAC 0.3545 (OC IF) 0.163 (cerebellar IF) (all values min−1; values for SCH, DTBZ, and MP were determined in our laboratory, values for RAC are from Logan et al., 1996). Data from 17.5 to 60 minutes were used to calculate the DVR values for all tracers.
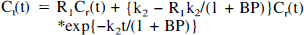
The RTM requires these assumptions to be satisfied: the free and the bound tracer in the target region can be described by a single compartment and k1/k2 = k′1/k′2, whereas no assumption of equilibrium is necessary. The model provides three parameters: BP, the relative local rate of delivery R1 = k1/k′1, and k2, using Eq. 2, where Ct is the total concentration of the free and bound tracer in the target region
The standard one-compartment compartmental approach also was applied to the DTBZ, MP, and SCH data, and the BP values were compared with those obtained from the Logan method and the RTM. The compartmental parameters k1 and k2, which describe exchange between tissue and plasma, were determined in both target and reference tissues, and the tissue-plasma distribution volume (DV) were determined as their ratio. Binding potential was estimated from the distribution volumes using the indirect method BP = (DVt − DVr)/DVr. For both the RTM and the compartmental methods, data from all measured time points were used.
The BP values were compared numerically for all four tracers, and linear correlation coefficients were estimated. For DTBZ, MP, and SCH, standard deviations between (STDB) and within subjects (STDW) and reliability (R) (STDB2/(STDB2 + STDW2)) were calculated using a one-way analysis of variance (Scheffe, 1959). The STDW was used as a measure of reproducibility. Reproducibility and reliability are complementary estimates of robustness: the first gives indications on the uncertainty associated with a measurement, whereas the second provides information on the ability of the variable of interest to discriminate between subjects. Reliability is a composite estimate and as such may be more susceptible to statistical uncertainties when the number of subjects is limited. In all cases, STDB and STDW were expressed as fractional standard deviations, that is, standard deviations divided by the mean value of the variable of interest, to facilitate comparisons.
In practice, in the Gunn implementation of the RTM (Gunn et al., 1997), BP, R1, and k2 are obtained by linearizing Eq. 2 as follows:

where α = R1, β = k2{1 − R1/(1 + BP)}, and γ = k2/(1 + BP). Both α and β are determined using linear least squares optimization for each of a preselected array of values of γ. The combination of the fitted parameters that yields the minimum least square residual represents the solution, and R1, BP, and k2 are derived from these values of α, β, γ. The covariances among α, β, and γ, which could affect the precision and accuracy of the determinations of the BP, R1, and k2, were estimated. Finally, R1 values were compared with the equivalent parameter determined from the compartmental model. The parameters k1 and k′1 were determined from one-compartment fits of the striatal and reference region time courses, respectively, and their ratio was compared with the RTM parameter R1 using linear regression. In addition, the STDB and STDW and reliability of R1 were calculated.
When the data from the target tissue are well represented by a one-compartment model, the free and the specific compartments cannot be distinguished. In that case, the compartmental rate constant k2 represents an effective rate constant for exchange between the combined tissue components and plasma. There is, therefore, no equivalent of the RTM k2 provided by the one-compartment model approach. Consequently, only STDB, STBW, and reliability R were used in the assessment of the RTM k2 measurement. Additional comments on this point are provided in the Discussion section below.
RESULTS
Tracer kinetics
Figure 1 shows the decay-corrected time courses in a specific target region for all four ligands, following subtraction of the time courses in each of the reference tissues. Potential differences between the free tracer in target and reference tissues make these only approximations of the bound tracer time courses; nevertheless, the rise and fall of these curves provide insight into the uptake into the bound compartment and the equilibration between that compartment and its environment. The difference curves for both cerebellar and OC reference tissues imply the rapid equilibration of RAC, SCH, and DTBZ. However, MP barely reaches equilibrium during the course of the study. This slowness probably is imposed by the unusually low rates of exchange for MP between tissue and plasma.
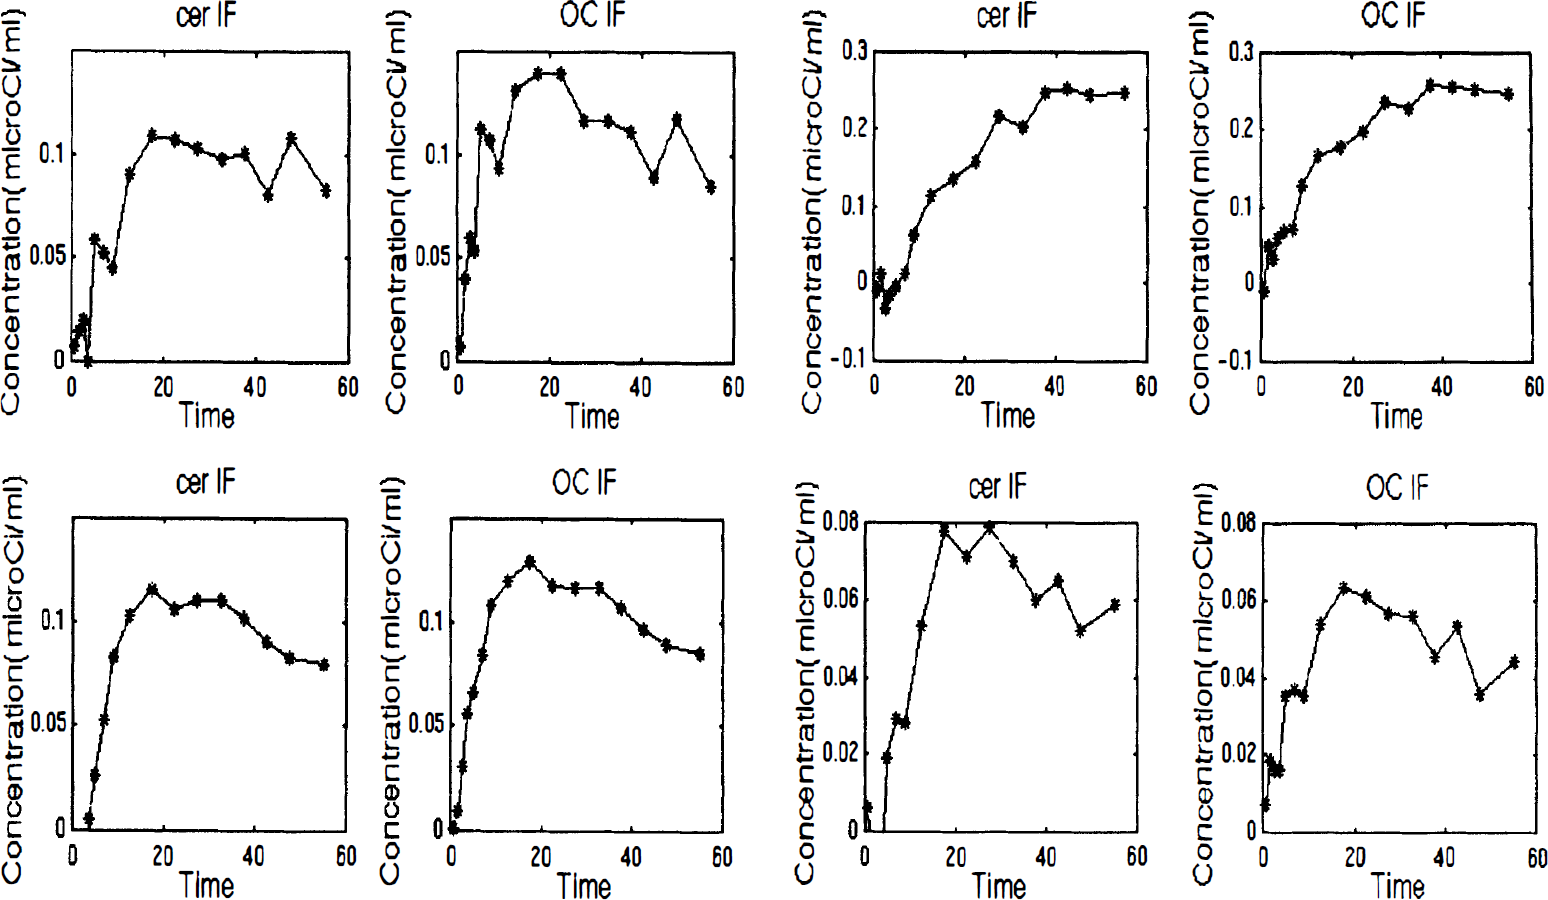
Radioactivity time courses in striatum minus those in each reference region. Although these are only approximate representations of specifically bound ligand, they provide insight into the relative rates of equilibration among the four ligands. Time is in minutes. Top left, [11C]dihydrotetrabenazine (DTBZ); top right, [11C]-methylphenidate (MP); bottom left, [11C]-raclopride (RAC); and bottom right, [11C]-Schering 23990 (SCH). Solid line connects the points. CER IF, cerebellar input function; OC IF, occipital cortex input function.
The compartmental model analysis performed on the DTBZ, MP, and SCH showed that a one-compartment model describes the kinetics of MP and SCH well. Visual inspection of the model fit to the data shows that DTBZ kinetics are better described by a two-compartmental model, as already previously determined (Koeppe et al., 1996). Therefore, DTBZ might not satisfy the requirements of the RTM model. The RAC kinetics are known to follow the one-compartment model well (Lammertsma and Hume, 1996).
Binding potential comparison
Table 1 shows the relative ratios of the BP values obtained with the different methods and the correlation coefficients. Excellent agreement between the numerical values of the BP obtained with RTM and Logan is observed for SCH, RAC, and DTBZ with the OC IF and MP with the cerebellar IF. The Logan method gives approximately 5% lower values for DTBZ with the cerebellar IF and 10% higher values for MP with the OC IF compared with the RTM. The correlation coefficient is more than 0.96 for all tracers except for MP, where it is approximately 0.85. The compartmental model BP estimates were consistently higher than those from either of the tissue input methods. These discrepancies may arise from the different sensitivities of the blood input and the tissue input approaches to regional differences in non-specific binding, contamination of the time course data by intravascular tracer, specific binding in the reference region, and systematic errors in plasma metabolite analysis. The observed discrepancies are not relevant to our primary goal of comparing the two-tissue input methods.
Comparison of BP estimates between various methods and correlation coefficients r
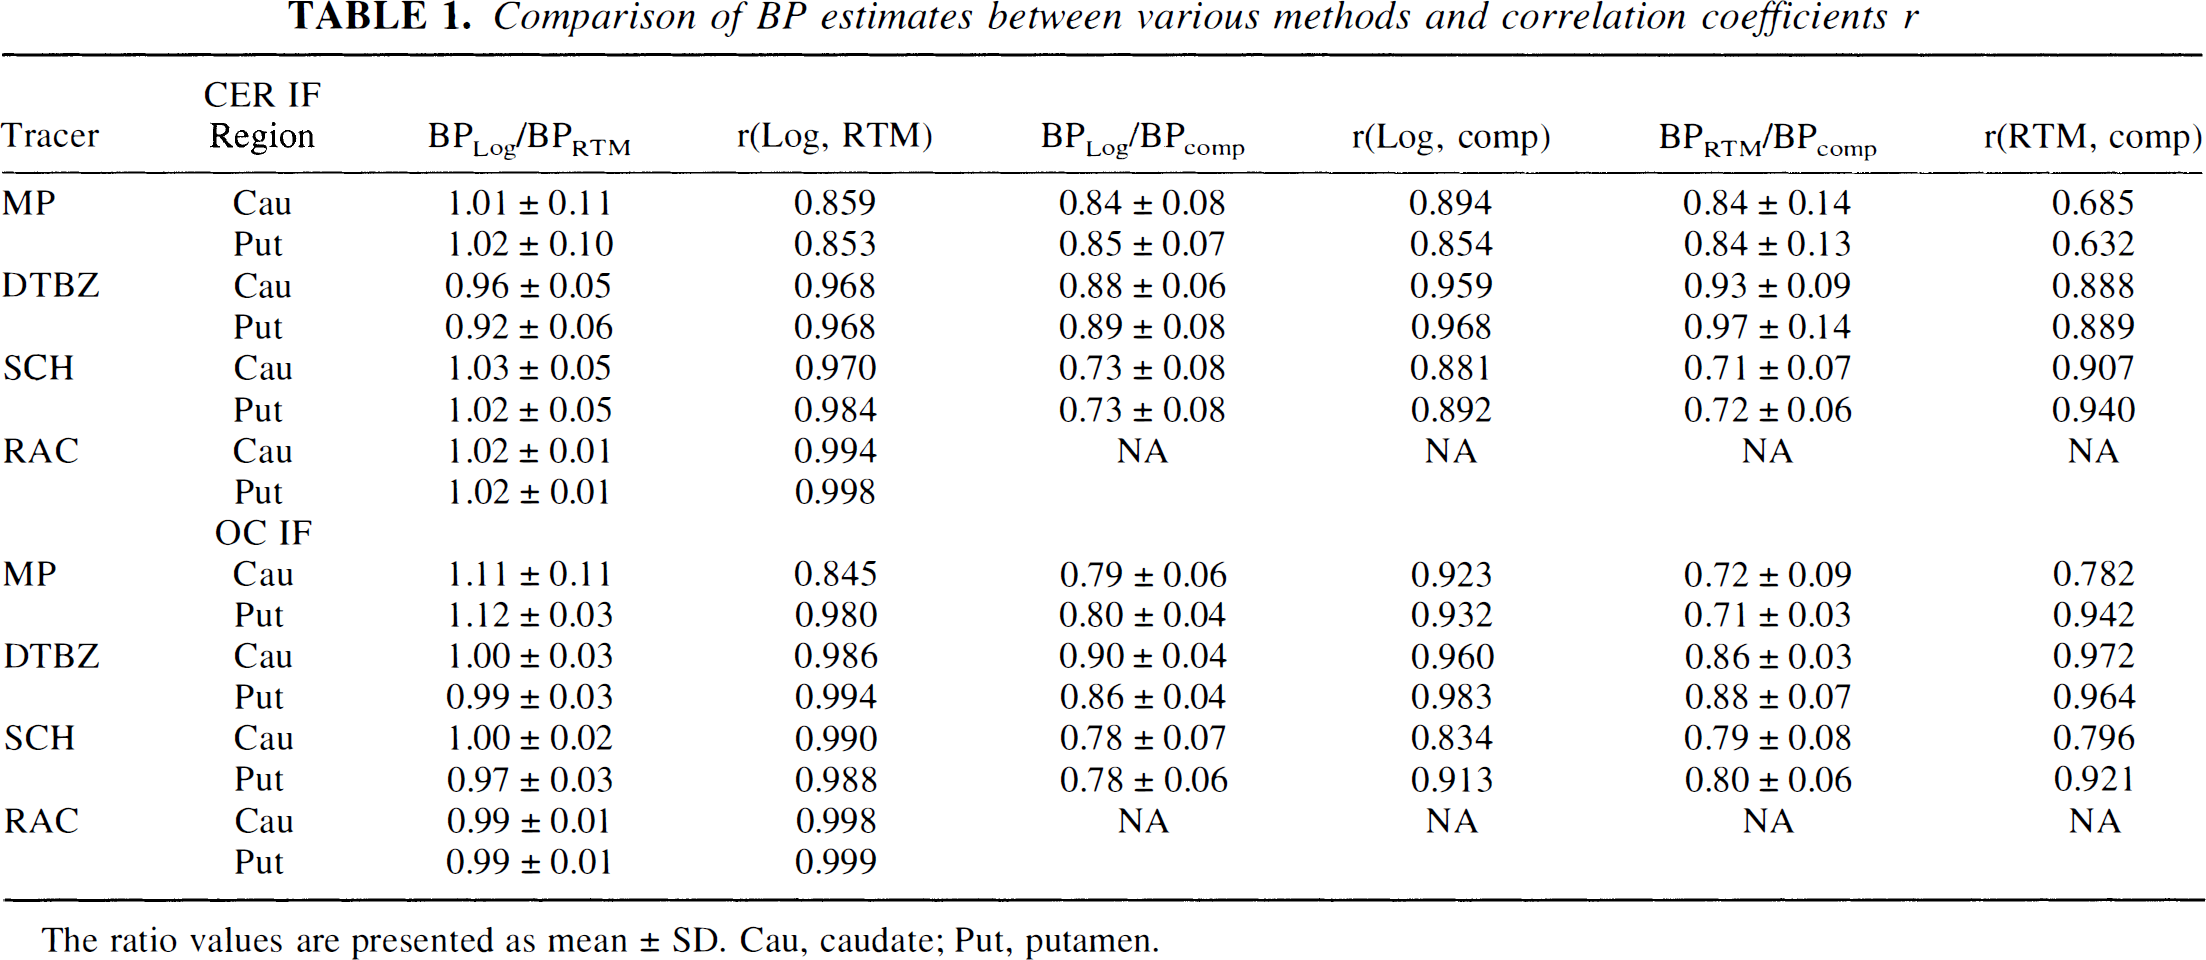
The ratio values are presented as mean ± SD. Cau, caudate; Put, putamen.
BP reliability and standard deviations
Table 2 shows the BP values together with the STDB and STDW values. For all four tracers, the STDB and STDW are comparable for the two methods, with the exception of the DTBZ putamen BP value obtained with the cerebellar IF. The lower reliability of the RTM in this case resulted from a single outlier where the program failed to properly fit the data.
Reliability R, STDB and STDW for BP evaluated by the two methods (see text)
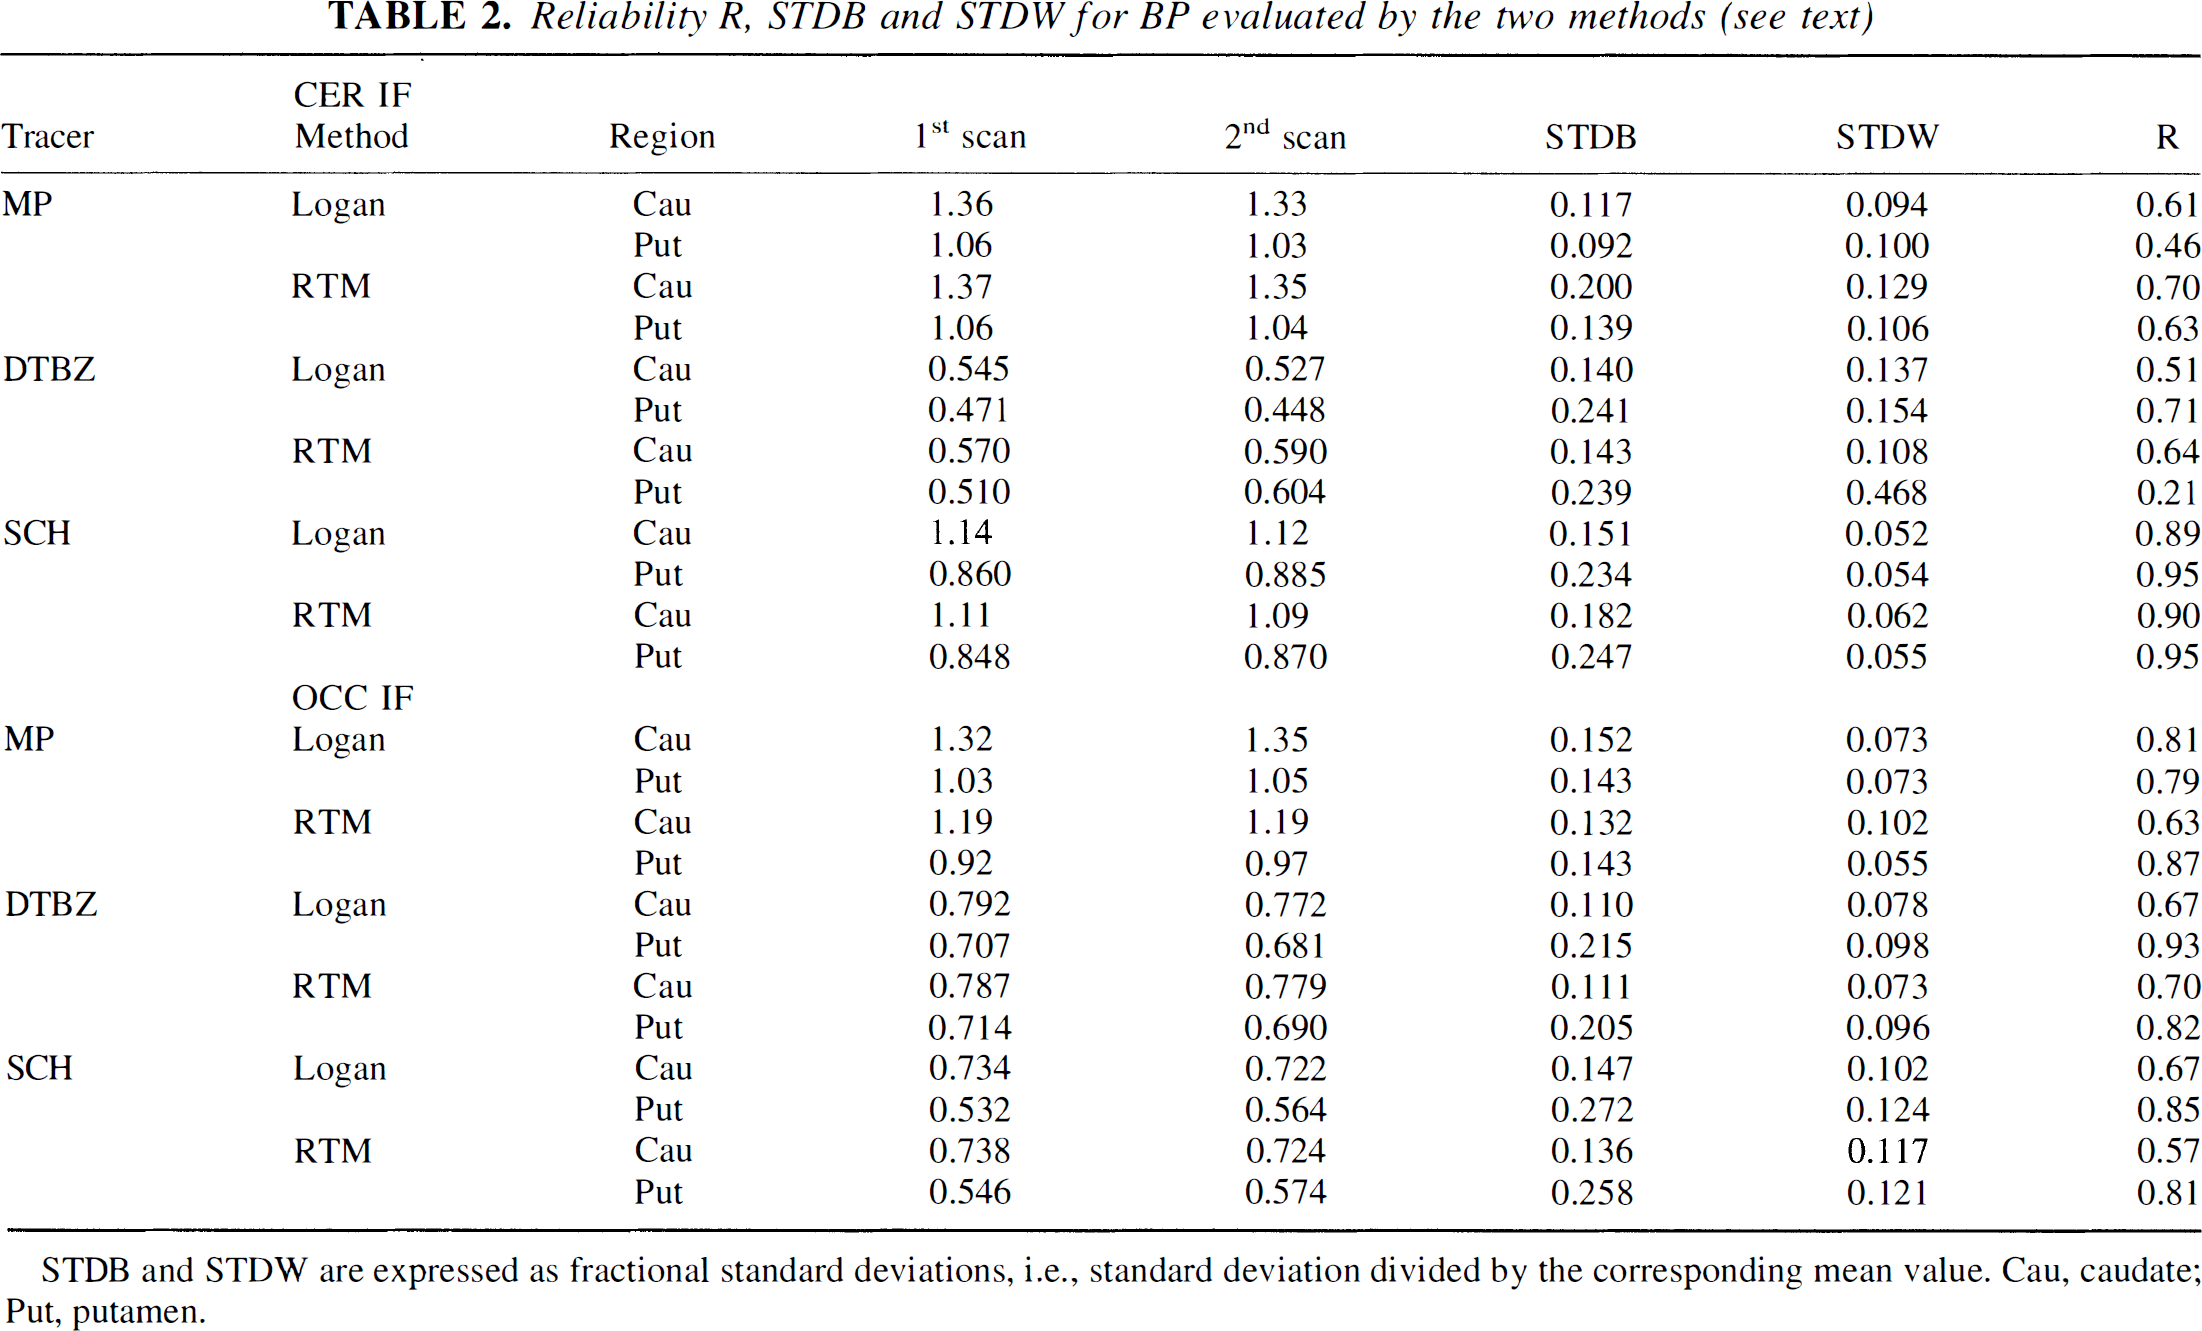
STDB and STDW are expressed as fractional standard deviations, i.e., standard deviation divided by the corresponding mean value. Cau, caudate; Put, putamen.
Covariance of α, β, γ
The correlation matrix (obtained from the covariance matrix after dividing each term by the square root of the product of the variances of the two variables under consideration) for each tracer is shown in Table 3. In general, the (β, γ) correlation is the largest in magnitude and always positive for all tracers. This result might have been expected considering that β appears as a coefficient and γ as an exponential factor with a negative sign in the same term (Eq. 3). Since the corresponding covariance term appears with a negative sign in the variance propagation to the BP, minimal increase in the BP variance estimate because of α, β, γ covariance is to be anticipated. This is confirmed by the fact that similar BP STDB and STBW values are given by the RTM and the Logan methods. Conversely, the same covariance term appears with a positive sign in the variance propagation to k2, thus contributing to the increase of the k2 variance.
Correlation matrices for the three parameters directly fitted by RTM, α, β, γ
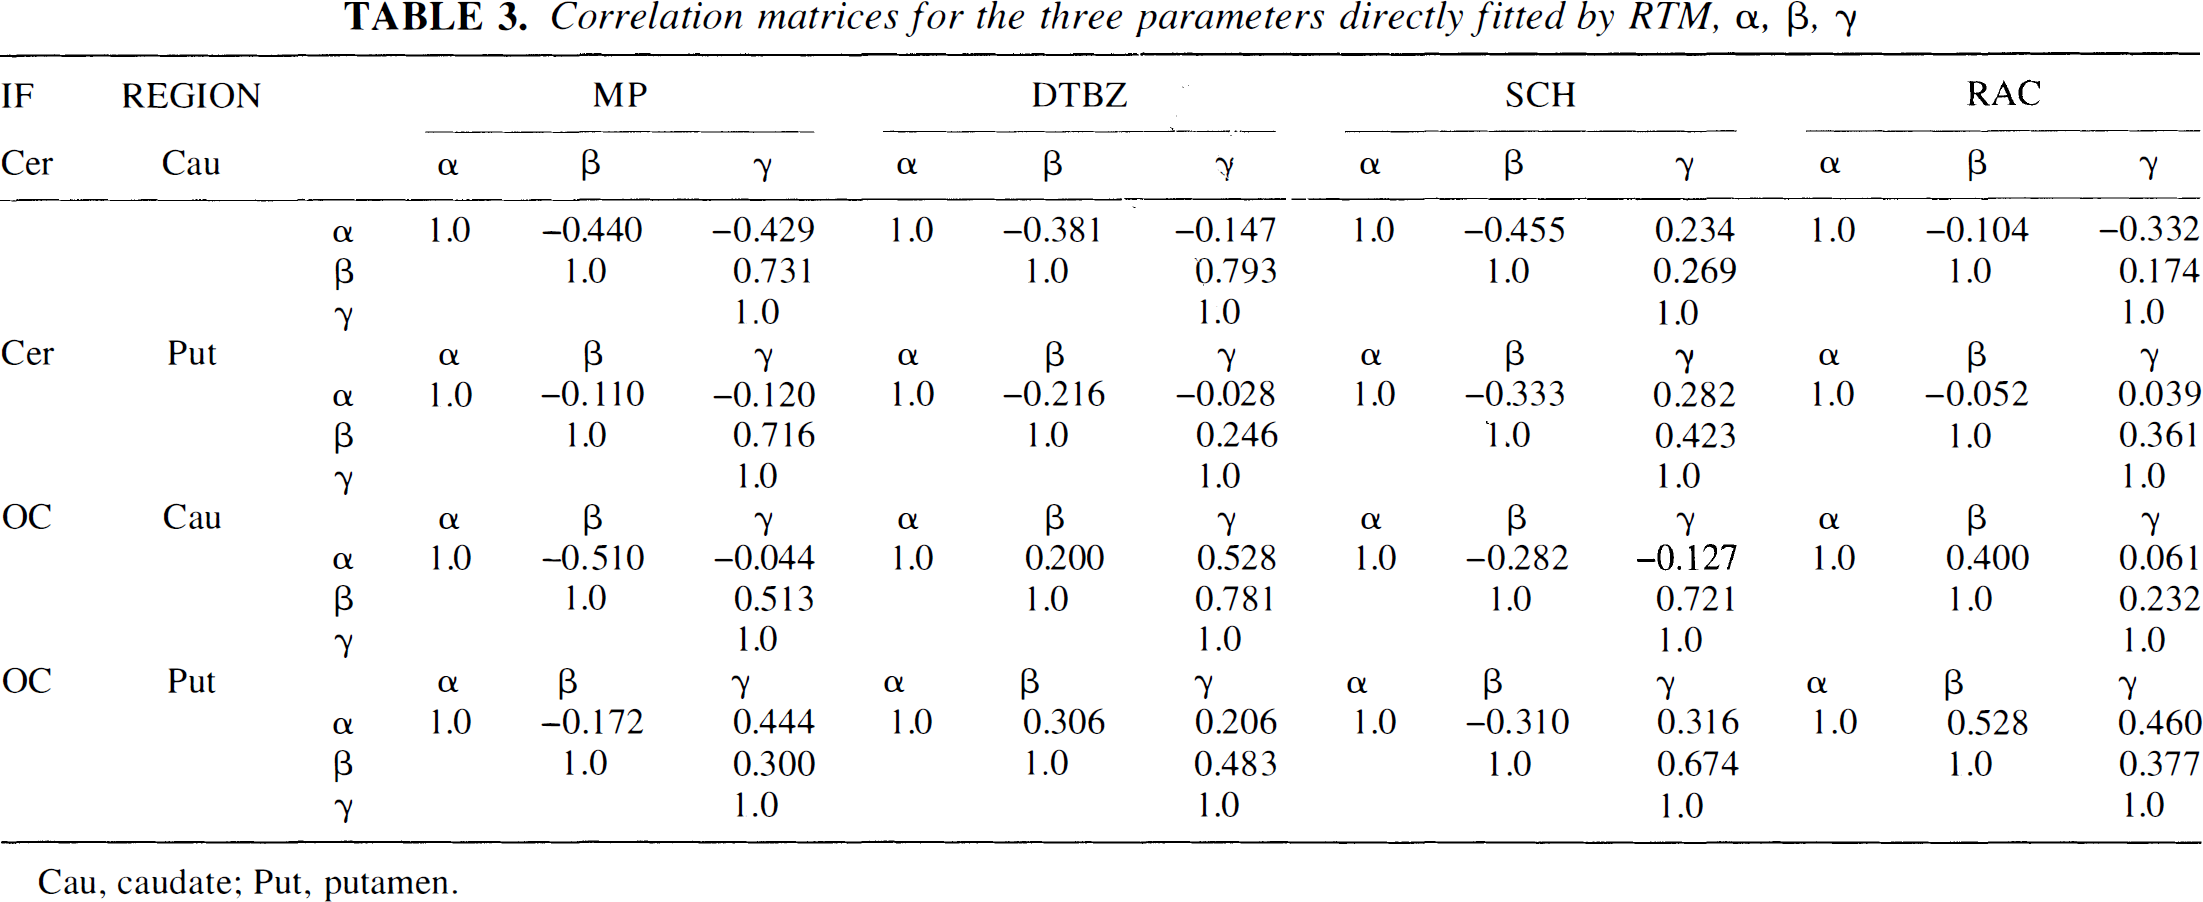
Cau, caudate; Put, putamen.
R1 correlation with the compartmental model, STDB, STDW, and reliability
Results are shown in Table 4. There is good correlation between the R1 values obtained from the compartmental model (a one-compartment model fit was used for all three tracers), indicating that the α, β, γ covariance does not introduce any significant bias in the R1 estimate. The STDB and STDW values are always less than 0.10, indicating that R1 can be measured accurately. However, the reliability tends to be low, with the exception of the values obtained for SCH with cerebellar IF and the values in caudate obtained for MP with either IF. Additional comments on the proper interpretation of low reliability values are provided in the discussion section (later).
Correlation coefficients r, STDB, STDW and reliability R of the RTM parameter R1
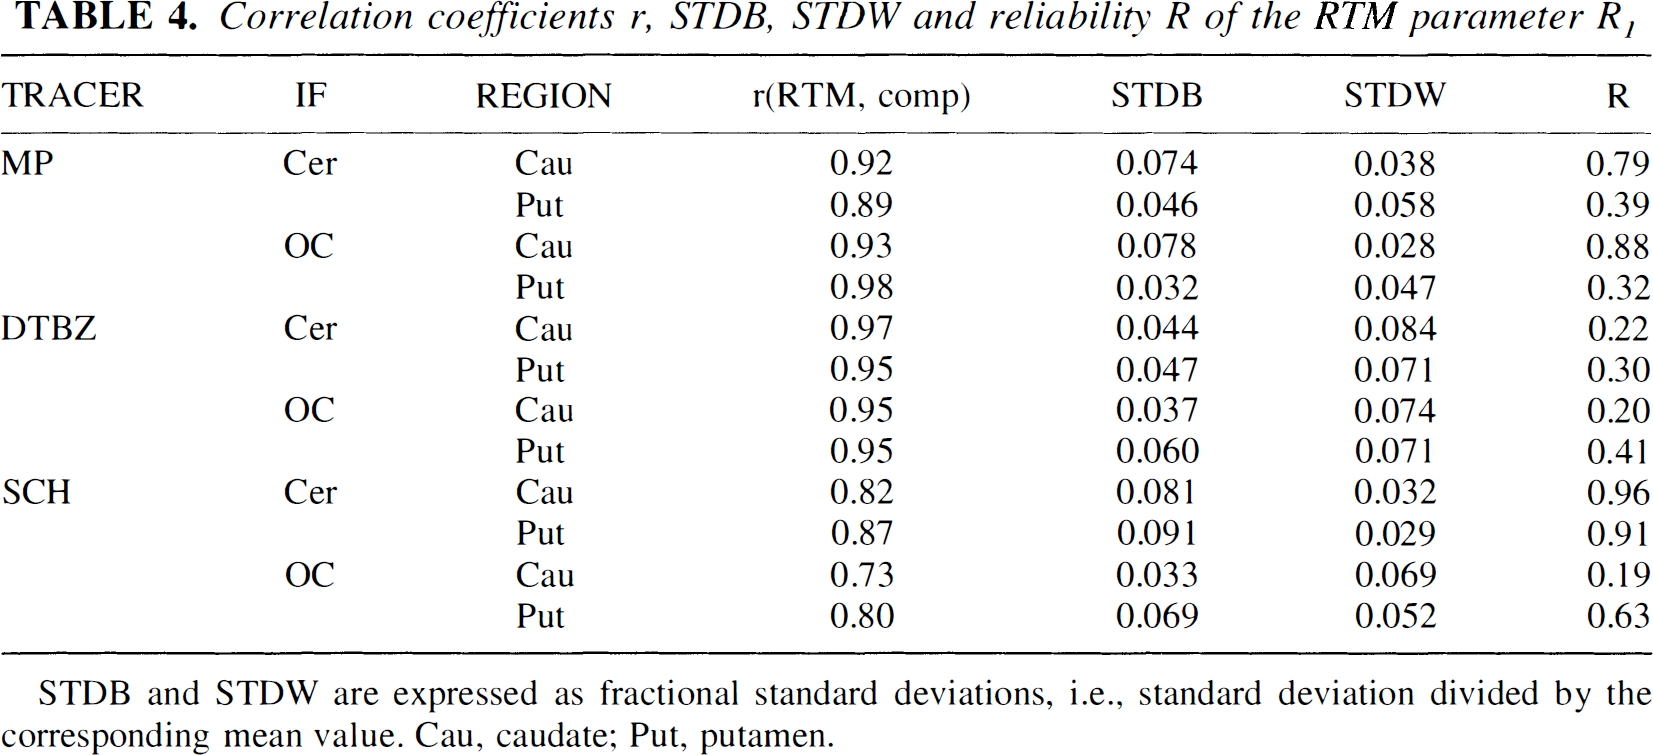
STDB and STDW are expressed as fractional standard deviations, i.e., standard deviation divided by the corresponding mean value. Cau, caudate; Put, putamen.
k2 STDB, STDW, and reliability
The k2 value cannot be determined directly from the compartmental model approach, and, therefore, only STDB, STDW, and reliability were used as figures of merit. Table 5 shows the results. The STDB and STDW generally are higher compared with their values obtained for R1. The reliability tends to be low, with the exception of SCH with the cerebellar IF and DTBZ with the OC IF.
STDB, STDW, and reliability R of the RTM parameter k2
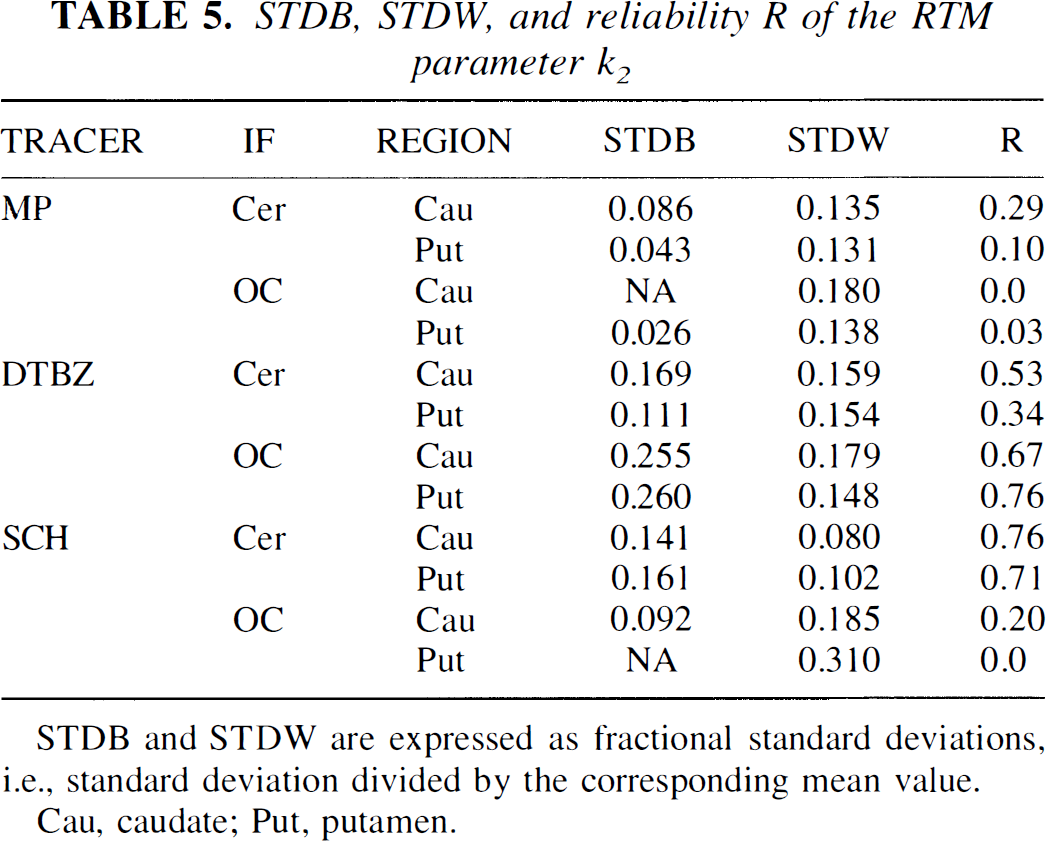
STDB and STDW are expressed as fractional standard deviations, i.e., standard deviation divided by the corresponding mean value.
Cau, caudate; Put, putamen.
DISCUSSION
The primary goal of this study was to compare the estimates of BP from two-tissue IF approaches for four tracers of the dopaminergic system. The BP values determined from both methods were in good agreement for all four tracers, indicating that all tracers adequately satisfy the kinetic assumptions required by each model. The appropriate selection of the reference region for each tracer should be based on the absence of specific binding and was beyond the scope of this study. Depending on the tracer, either the OC or the cerebellum provides a better assessment of the nonspecifically bound tracer. However, both cases were included in this comparison to evaluate the two-tissue input methods under different approximations. This finding included DTBZ in spite of the fact that a two-compartment model provided a better fit of the DTBZ data compared with the one-compartment model. The MP with the OC IF showed the largest discrepancy in the BP values, with the Logan method giving about 10% higher estimates compared with the RTM. This could potentially result from the late equilibration of this tracer. To explore this hypothesis, we extended the scanning time for 11 different patients to 80 minutes and calculated the BP over that time interval with both methods. Both methods gave a lower BP estimate when the longer scanning time was used compared with the standard 60 minutes: by approximately 4.5% with the RTM, and by 8% with the Logan method. Thus, the late equilibration time might account for at least part of the discrepancy in the BP estimates of the two methods. The BP estimates were comparable in terms of reproducibility and reliability. The RTM has one additional degree of freedom compared with the Logan method and thus is expected to be more sensitive to the noise in the data. Nevertheless it failed to give an accurate BP value in an isolated case only.
The reliability measures estimated for this and the other parameters are composite measures that compare the reproducibility of the estimation in one subject to the variation between subjects. As composite measures, they are more sensitive to the small sample sizes used in our study, and the wide variation of the estimated values must be interpreted in this light. Furthermore, notice that a low reliability value determined in a group of normal volunteers does not necessarily reflect negatively on the suitability of a ligand or analysis method for discriminating disease. In many cases in the current study, low reliability was the result of small intersubject variation, which could enhance the discriminating power of the method.
The second parameter determined by RTM, R1, was found to vary little between and within patients. This could mean that there is limited variability between subjects or that the method is not sensitive enough to changes in R1. Potentially, R1 is an important parameter because it provides information on the relative rate of tracer delivery from plasma to free compartment between target and reference region. The rate of tracer delivery depends on blood flow and ligand extraction from plasma across the blood-brain barrier into the brain. Therefore, any local alterations of either blood flow or blood-brain barrier permeability that would alter R1 could have an effect on the BP estimate. This study has been performed on normal volunteers where no alterations in either blood flow or blood-brain barrier were present; more studies in situations where such alterations are known to occur are needed to establish the sensitivity of the method to changes in R1 and their impact on the determination of the BP.
The last parameter determined by RTM, the tracer efflux rate k2, showed higher variability between and within subjects, often with low reliability. The reliability was particularly low for MP, which again could reflect the late equilibration of this tracer and consequent difficulty in accurately determining k2. In the case of SCH, where the reliability is high when the cerebellum is used as IF and low when the OC is used, the result could be explained by the fact that the cerebellum has a lower density of D1 receptors compared with the OC. The significant affinity of this tracer to serotonin receptors (Hall et al., 1988) also may contribute to the different performance of the two reference regions. The cerebellum is therefore a more suitable area to be used as reference region for SCH. A similar explanation might be valid for DTBZ, where the k2 reliability is higher when the OC time-activity course is used as IF. The fact that the BP values are higher when the OC IF is used compared with the cerebellar IF might indicate that the degree of specific binding is higher in the cerebellum, as reported by Koeppe et al. (1999). The tissue input model requirement that the reference region should be devoid of specific binding is satisfied to a lesser degree with the cerebellar IF, thus potentially rendering the k2 estimate less reliable.
Although the k2 values yielded by the RTM and compartmental methods are not directly comparable, there are two comparisons that are theoretically valid, between the compartmental k2 in the target tissue and the RTM parameter γ, and between the compartmental k2 in the reference tissue and the value k2/R1 from the RTM. These correlations were performed in each case where the data were available. Poor correlations were observed in every case, presumably because of the consistent finding that the compartmental parameters were tightly grouped about their means, whereas the RTM results had a wide dynamic range, often in excess of 2 to 1. It was this observed difference in variability that spawned our interest in the effect of parameter covariance in the RTM. Our hypothesis that parameter covariances tend to decrease the variance of BP and increase those of the RTM γ and k2 values was borne out by this analysis.
CONCLUSION
Tissue input data analysis methods are clearly preferred to those requiring plasma input, since they reduce the invasiveness and the complexity of the scanning procedure. The requirements imposed by the tissue input methods, however, generally are more stringent compared with the plasma input ones. In this study, we examine the suitability of four reversible tracers, MP, DTBZ, RAC, and SCH, to satisfy the assumptions required by the Logan graphic method and by the reference tissue method by examining the tracer time-activity course and comparing the BP estimates obtained from the two methods in terms of values, SD, and reliability. All four tracers were found to adequately satisfy the requirements of both methods with good agreement between BP estimates from both methods. The correlation coefficient between the BP estimate from each method was high for all tracers (r ≥ 0.85 for MP and r ≥ 0.97 for the other three tracers). The two methods also were found to be similarly robust, with comparable reproducibility and reliability for both methods.
Investigation of the other two parameters provided by RTM, R1, and k2 showed that R1 had limited intrasubject and intersubject variability, potentially reflecting the fact that the ratio of the target to reference influx constant does not vary greatly between subjects. However, k2 was found to have a greater variability, with higher reliability only for SCH with cerebellar IF and DTBZ with OC IF. Finally, the covariance found between α, β, γ, the directly estimated parameters by the RTM from which BP, R1, and k2 are extracted, seemed not to impact the accuracy or precision of the BP and R1 estimate, while possibly decreasing the accuracy of the k2 estimate.
Footnotes
Abbreviations used
Acknowledgements
The authors thank Dr. R. Gunn for the software for the RTM analysis, Dr. M. Schulzer and E. Mak for their help with the statistical analysis, the PET chemistry group at TRIUMF for the radiotracer preparations, and the scanning team at UBC.